18
Crop Sensor Research for Corn N Management at DuPont Pioneer

Crop Sensor Research for Corn N Management at DuPont Pioneer

Right Product, Right Acre = G x E x M
What’s the environment the crop will be growing in? • Cold/hot • Drought • High yield
What’s the best hybrid for my field? • Disease • Insect pressure • Yield potential • Stress
How do I need to manage the crop? • Planting date • Fertility • Population • Pests

Better Decision Aid Tools 1. Geo-spatial data bases combined
Environmental information (historical & real-time climatic data) Landscape information (i.e., soils, topography, imagery, etc.) Genotypic and agronomic performance information
2. Geo-spatial orientation enables both regional & within field evaluation 3. Analytical engines to distill information into knowledge and real-time decisions
Environmental Landscape
Performance
Analytical Engines
Geo-spatial data bases

Environmental Information
10-Year Avg
2004
2011
2012
Environment Classification (EnClass®)Map for 2012

Environmental Information – Real-time & Historical
Historical Drought Maps - 60 yrs
Individual Location Profile -2012
EnClass ® System

Performance Information
Yield Monitor Weigh Wagon
On-farm Agronomy Trial Locations in 2012

On-farm Hybrid by Population Protocol
FIT Yield Map of Strips Field Layout of Hybrid and Population Field Strips

Regional Evaluation of Hybrid Performance
Interpolated Difference Map

Within Field Evaluation
SURGO Soils, Topo, Soil EC, Imagery As-Planted Nitrogen Treatment Yield Map
®, SM, TM Trademarks and service marks of Pioneer . The DuPont Oval Logo is a registered trademark of DuPont.
© 2012 PHII.
Pioneer Field360® Studio is a proprietary version of MapShots’ AgStudio™ precision Ag software package.
Customers inputting yield data in system since early 2000’s
GIS analysis tools, with ability to import multiple information layers, Pioneer EnClass® Soils
Can analyze performance data using unique combinations of polygons

INTERNAL USE ONLY
Other New Tools in 2013
Pioneer
Field360®
Select
Pioneer
Field360®
Field Notes app
Corn Plantability app

Precision Ag Education Materials
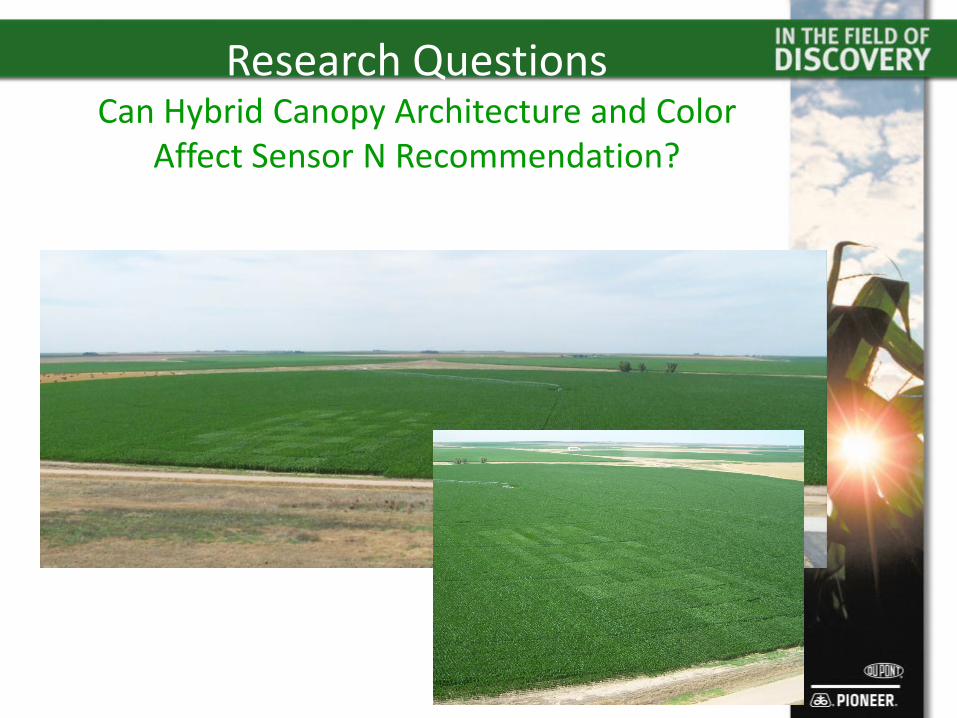
Research Questions Can Hybrid Canopy Architecture and Color
Affect Sensor N Recommendation?

Crop Sensor Study Description
Map of 2011 and 2012 trial locations in central Nebraska Total of 8 Site -Years.
Year Hybrid Color
2011
P0902XR (HXX, LL, RR2) Dark
P1395XR (HXX, LL, RR2) Light
2012
33D49 (HX1, LL, RR2) Dark
P1498HR (HX1, LL, RR2) Light
Hybrids used by year and their respective canopy characteristic.

Study Description (continued)
Hybrid
Color
Sensor
Trt,
Pre-plant or Early
Sidedress N (lbs/A) Description
Dark 1 190-275 Reference
2 75-120 Dark Ref.
3 75-120 Light Ref.
4 75-120 Average
Light 5 190-275 Reference
6 75-120 Dark
7 75-120 Light
8 75-120 Average
Sensor-directed N applications made around V9

Study Description (continued) Small-Plot Trials
with University of Nebraska in 2011 and 2012 On-farm Trials
W/ Field Length Strips In 2011 and 2012

UNL Small Plot Trials
2011
2012

Averaged Across Eight Site-Years
• Profit Potential of $30 to $50 per acre • NUE substantially improved • Studies continued in 2013 to confirm results

Thanks for Your Attention Questions?
18


