ORIGINAL RESEARCH published: 08 March 2016 doi: 10.3389/fphys.2016.00078 Frontiers in Physiology | www.frontiersin.org 1 March 2016 | Volume 7 | Article 78 Edited by: Julien Périard, ASPETAR - Qatar Orthopaedic and Sports Medicine Hospital, Qatar Reviewed by: Christopher Todd Minson, University of Oregon, USA Michal Horowitz, Hebrew University of Jerusalem, Israel Lars R. McNaughton, Edge Hill University, UK *Correspondence: Ben J. Lee [email protected]Specialty section: This article was submitted to Exercise Physiology, a section of the journal Frontiers in Physiology Received: 20 November 2015 Accepted: 15 February 2016 Published: 08 March 2016 Citation: Lee BJ, Miller A, James RS and Thake CD (2016) Cross Acclimation between Heat and Hypoxia: Heat Acclimation Improves Cellular Tolerance and Exercise Performance in Acute Normobaric Hypoxia. Front. Physiol. 7:78. doi: 10.3389/fphys.2016.00078 Cross Acclimation between Heat and Hypoxia: Heat Acclimation Improves Cellular Tolerance and Exercise Performance in Acute Normobaric Hypoxia Ben J. Lee 1, 2 *, Amanda Miller 2 , Rob S. James 2 and Charles D. Thake 2 1 Department for Health, University of Bath, Bath, UK, 2 Centre for Applied Biological and Exercise Sciences, Coventry University, Coventry, UK Background: The potential for cross acclimation between environmental stressors is not well understood. Thus, the aim of this investigation was to determine the effect of fixed-workload heat or hypoxic acclimation on cellular, physiological, and performance responses during post acclimation hypoxic exercise in humans. Method: Twenty-one males (age 22 ± 5 years; stature 1.76 ± 0.07 m; mass 71.8 ± 7.9 kg; V ˙ O peak 51 7 mL . kg −1. 2 m 1 ± in − ) completed a cycling hypoxic stress test (HST) and self-paced 16.1 km time trial (TT) before (HST1, TT1), and after (HST2, TT2) a series of 10 daily 60 min training sessions (50% N V ˙ O 2 peak) in control (CON, n = 7; 18 ◦ C, 35% RH), hypoxic (HYP, n ◦ = 7; fraction of inspired oxygen = 0.14, 18 C, 35% RH), or hot (HOT, n = 7; 40 ◦ C, 25% RH) conditions. Results: TT performance in hypoxia was improved following both acclimation treatments, HYP (−3:16 ± 3:10 min:s; p = 0.0006) and HOT (−2:02 ± 1:02 min:s; p = 0.005), but unchanged after CON (+0:31 ± 1:42 min:s). Resting monocyte heat shock protein 72 (mHSP72) increased prior to HST2 in HOT (62 ± 46%) and HYP (58 ± 52%), but was unchanged after CON (9 ± 46%), leading to an attenuated mHSP72 response to hypoxic exercise in HOT and HYP HST2 compared to HST1 (p < 0.01). Changes in extracellular hypoxia-inducible factor 1-α followed a similar pattern to those of mHSP72. Physiological strain index (PSI) was attenuated in HOT (HST1 = 4.12 ± 0.58, HST2 = 3.60 ± 0.42; p = 0.007) as a result of a reduced HR (HST1 = 140 ± 14 b.min −1 ; HST2 131 ± 9 b.min −1 p = 0.0006) and T rectal (HST1 = 37.55 ◦ ± 0.18 C; HST2 37.45 ± 0.14 ◦ C; p = 0.018) during exercise. Whereas PSI did not change in HYP (HST1 = 4.82 ± 0.64, HST2 4.83 ± 0.63). Conclusion: Heat acclimation improved cellular and systemic physiological tolerance to steady state exercise in moderate hypoxia. Additionally we show, for the first time, that heat acclimation improved cycling time trial performance to a magnitude similar to that achieved by hypoxic acclimation. Keywords: heat, hypoxia, cross-acclimation, cycling, heat shock proteins
Transcript
ORIGINAL RESEARCHpublished: 08 March 2016
doi: 10.3389/fphys.2016.00078
Frontiers in Physiology | www.frontiersin.org 1 March 2016 | Volume 7 | Article 78
Cross Acclimation between Heat andHypoxia: Heat Acclimation ImprovesCellular Tolerance and ExercisePerformance in Acute NormobaricHypoxiaBen J. Lee 1, 2*, Amanda Miller 2, Rob S. James 2 and Charles D. Thake 2
1Department for Health, University of Bath, Bath, UK, 2Centre for Applied Biological and Exercise Sciences, Coventry
University, Coventry, UK
Background: The potential for cross acclimation between environmental stressors is
not well understood. Thus, the aim of this investigation was to determine the effect of
fixed-workload heat or hypoxic acclimation on cellular, physiological, and performance
responses during post acclimation hypoxic exercise in humans.
Method: Twenty-one males (age 22 ± 5 years; stature 1.76 ± 0.07 m; mass 71.8 ±
7.9 kg; V̇O peak 51 7mL.kg−1.2 m 1± in− ) completed a cycling hypoxic stress test (HST)
and self-paced 16.1 km time trial (TT) before (HST1, TT1), and after (HST2, TT2) a series
of 10 daily 60min training sessions (50% N V̇O2 peak) in control (CON, n = 7; 18◦C,
35% RH), hypoxic (HYP, n ◦= 7; fraction of inspired oxygen = 0.14, 18 C, 35% RH), or
hot (HOT, n = 7; 40◦C, 25% RH) conditions.
Results: TT performance in hypoxia was improved following both acclimation
treatments, HYP (−3:16 ± 3:10min:s; p = 0.0006) and HOT (−2:02 ± 1:02min:s;
p = 0.005), but unchanged after CON (+0:31 ± 1:42min:s). Resting monocyte heat
shock protein 72 (mHSP72) increased prior to HST2 in HOT (62 ± 46%) and HYP (58 ±
52%), but was unchanged after CON (9 ± 46%), leading to an attenuated mHSP72
response to hypoxic exercise in HOT and HYP HST2 compared to HST1 (p < 0.01).
Changes in extracellular hypoxia-inducible factor 1-α followed a similar pattern to those
of mHSP72. Physiological strain index (PSI) was attenuated in HOT (HST1 = 4.12 ±
0.58, HST2 = 3.60 ± 0.42; p = 0.007) as a result of a reduced HR (HST1 = 140 ±
14 b.min−1; HST2 131 ± 9 b.min−1 p = 0.0006) and Trectal (HST1 = 37.55 ◦± 0.18 C;
HST2 37.45 ± 0.14◦C; p = 0.018) during exercise. Whereas PSI did not change in HYP
(HST1 = 4.82 ± 0.64, HST2 4.83 ± 0.63).
Conclusion: Heat acclimation improved cellular and systemic physiological tolerance to
steady state exercise in moderate hypoxia. Additionally we show, for the first time, that
heat acclimation improved cycling time trial performance to a magnitude similar to that
Lee et al. Heat Acclimation Improves Hypoxic Tolerance
INTRODUCTION
Adaptation to one environmental stressor can induce protectiveresponses upon exposure to other stressors as long as they sharecommon adaptive responses (Fregly, 2011). This phenomenon istermed cross-acclimation, when physiological strain is attenuated(Ely et al., 2014), or cross-tolerance, when improved cellularprotection is observed (Kregel, 2002). At a cellular level acuteheat (Fehrenbach et al., 2001; Lee et al., 2014; Périard et al., 2015)and hypoxic stress (Taylor et al., 2011; Lee et al., 2014) induce theheat shock response (HSR; Morimoto, 1998), characterized by atransient post exposure increase in the cytoprotective heat shockprotein 72 (HSP72). Additionally, acclimation to either heat orhypoxia induces phenotypic alterations that increased expressionof genes encoding for cytoprotective HSPs (Maloyan et al., 1999;Mcclung et al., 2008; Gibson et al., 2015c), leading to greatercellular resilience in the face of subsequent stressful insults (Leviet al., 1993; Hutter et al., 1994).
Enhanced HSP72 following heat acclimation is associatedwith delayed tissue injury during acute heat stress (Horowitzet al., 2004) and contributes to cross tolerance between heatand ischemic stressors (Maloyan et al., 1999). In humanssupplemented with quercetin—a potent inhibitor of the heatshock response, post heat acclimation thermotolerance wasreduced (Kuennen et al., 2011). This was characterized bya diminished cellular stress marker response alongside anattenuated physiological adaptation, illustrating the functionalrole of the HSR at a whole body level. However, Hom et al.(2012) demonstrated a heat acclimated phenotype in the absenceof HSP72 elevation, suggesting that increased HSP72 alonemay not always be present in heat acclimation. In rodentmodels, increased hypoxia-inducible factor 1-α (HIF1-α), themaster regulator of oxygen-regulated genes, and downstreamindicators of HIF-1α expression such as erythropoietin (EPO)receptor, EPO, and vascular endothelial growth factor (VEGF),have been observed after acute heat stress (Na’ama et al., 2005)and heat acclimation (Maloyan et al., 2005; Tetievsky et al.,2008; Assayag et al., 2012; Umschweif et al., 2013) suggestingan interaction between HIF-1α and the HSR during heatacclimation.
Few studies have investigated the potential for heatacclimation to confer cross acclimation and tolerance to acutehypoxic exposures in a human model (Heled et al., 2012; Leeet al., 2014, 2015; Gibson et al., 2015c), with no study examiningthe response ofHIF1-α to a heat acclimation regimen. Both acuteexercising exposures to heat and heat combined with hypoxiahave been shown to attenuate physiological strain during hypoxicexercise conducted 24 h following the initial heat exposure (Leeet al., 2014). The same authors also observed reduced exerciseheart rates and rectal temperatures, and increased exercise SpO2
during hypoxic exercise that was preceded by 3 days of heatacclimation (Lee et al., 2015). Longer term heat acclimationprograms have also led to a reduction in hypoxic exerciseHR alongside increased SpO2 (Heled et al., 2012; Gibsonet al., 2015c), and an improved cardiac efficiency (V̇O2/HRreferred to as O2 pulse; Gibson et al., 2015c). In addition to theimprovements seen in systemic function, an increase in resting
peripheral blood mononuclear cell (PBMC) HSP72 protein (Leeet al., 2014, 2015) and HSP72 mRNA (Gibson et al., 2015c) havebeen observed following heat acclimation. Subsequently, thepost hypoxic exercise induced increases in the HSP72 responsehave been shown to be attenuated in heat-acclimated individuals(Lee et al., 2015; Gibson et al., 2015c). These data supportthe existence of both cross-acclimation and cross-tolerance inhumans.
While each of these studies included matched load controlgroups (Lee et al., 2015; Gibson et al., 2015c), no study hasexamined cross-acclimation and cross-tolerance in relation toa matched period of hypoxic acclimation. Neither has theeffect of heat acclimation on hypoxic exercise performance beendetermined. Therefore, the aim of the present study was tocompare the impact of a period of heat acclimation vs. hypoxicacclimation on physiological cross-acclimation and cellularcross-tolerance, and exercise performance during a subsequentexposure to acute normobaric hypoxia. It was hypothesized thata prior period of either heat or hypoxic acclimation wouldreduce physiological strain and improve physical performancewhen exercising in moderate normobaric hypoxia, with theeffects being greatest following hypoxic acclimation. It was alsohypothesized that both heat and hypoxic acclimation wouldincrease resting levels of both mHSP72 and eHIF-1α postacclimation.
METHODS
Participant CharacteristicsParticipants (n = 21 males; Figure 1) provided writteninformed consent to take part in the study, which was approvedby the Coventry University Ethics review panel. Establishedconfounding variables of smoking, caffeine, glutamine, quercetin,alcohol, and prior thermal, hypoxic and hyperbaric exposureswere all controlled in line with previous work (Taylor et al., 2011;Gibson et al., 2014; Lee et al., 2014, 2015). Participants were askednot to undertake any other exercise training in the 72 h leadingup to a testing bout and throughout the intervention period. Alldata collection was conducted in accordance with the standardsset out in the Declaration of Helsinki of 1996.
Experimental DesignAll participants attended the laboratory on 17 separate occasions,as outlined in Figure 1. Two preliminary visits enabled height,body mass, estimated body fat via skinfold measurements, andnormoxic (N) and hypoxic (H) V̇O2 peak tests, separated by atleast 5 days, to be conducted. Thereafter participants were splitinto three experimental groups (control, CON; heat acclimation,HOT; hypoxic acclimation, HYP) that were matched for H V̇O2
peak and training experience (Figure 1). After both N and HV̇O2 peak tests had been conducted all participants undertooktwo hypoxic stress test (HST) familiarization (FAM) sessions(described below) at least 4 days apart (Lee et al., 2014, 2015). Toavoid any confounding acclimation to acute hypoxia FAM wasconducted under normoxic conditions. At least 7 days after thefinal FAM session participants completed the first HST.
Frontiers in Physiology | www.frontiersin.org 2 March 2016 | Volume 7 | Article 78
Lee et al. Heat Acclimation Improves Hypoxic Tolerance
FIGURE 1 | Schematic of the experimental design, anthropometric and physiological characteristics of participants, indicating the typical days on
which specific tests were undertaken.
Preliminary Visit MeasurementsHeight was measured in the Frankfurt plane using a Harpendenstadiometer (Harpenden Instruments, Burgess Hill, UK), nudebody mass determined on an electronic scale (Seca Body,Cranlea and Company, Birmingham, UK) and sum of skinfoldsdetermined from four sites using a skinfold caliper (HarpendenInstruments, Burgess Hill, UK) as described by Durnin andWomersley (1974).
Peak V̇O2 was determined in both N and H conditionson separate days (preliminary visits 1 and 2) using anincremental exercise test to volitional exhaustion on a calibratedSRM cycle ergometer (Schoberer Rad Meßtechnik, Welldorf,Germany). Hypoxia was generated via a Hypoxicator unit(Hypoxico HYP123 Hypoxicator, New York, USA), that wasused to fill a reservoir of three 1000 L Douglas bags inseries. Participants inspired via a mouthpiece attached to atwo-way non-rebreathable valve (Harvard Ltd., Eldenbridge,UK) connected to the gas reservoir with clear ethylene vinyltubing.
Resting blood lactate (BLa; Biosen C-Line analyser, EKFDiagnostics, Sailauf, Germany) was determined from a fingercapillary whole blood sample following a 10-min seated restperiod. The test began at a workload of 70W for 4min and wasthen increased by 35 W every 4min until a blood lactate valueof >4mmol·L−1 was reached. Thereafter, workload increased35 W every 2min until volitional exhaustion. A cadence of70 rev·min−1 was maintained throughout. Expired gases werecollected using 200 L Douglas bags (Cranlea & Co, Birmingham,UK) during the final minute of each stage. Heart rate (PolarFT1, Polar Electro OY, Kempele, Finland) and perceived exertion(Borg, 1982) were recorded at the end of each gas collection.Respiratory gas analysis was completed as previously described(Lee et al., 2014, 2015).
Familiarization, Hypoxic Stress Testing(HST), and Acclimation ProceduresOn each FAM and HST session, as well as throughout theacclimation period, participants reported to the laboratory afteran overnight fast to consume a set breakfast 2 h prior to theexercise bout. The energy content of the breakfast was 386 kcal,made up of 15.6 g protein, 44.4 g carbohydrate and 16.4 g fat.Participants drank 400ml of water with the breakfast.
Each FAM, HST and acclimation session was preceded by15min of seated normoxic rest (after instrumentation) to collectbaseline data and an additional 15min of seated rest within thedefined environment (N or H). The FAM and HST sessionsconsisted of 40min of cycle exercise at 50% N V̇O2 peak, a 5minrecovery in which instruments were removed from participants,followed by a 16.1 km cycling time trial. The time trial has a CVand TEM of 0.63% and 36 s, respectively, following two FAMsessions. The smallest worthwhile change in TT time using thisprotocol is therefore a 46 s difference (Lee et al., 2015). The 10-day acclimation protocol consisted of once daily exposures ofcycle ergometer exercise within the defined environment, eitherCON (18◦C, 35% RH), HOT (40◦C, 25% RH), or HYP (18◦C,35% RH, FIO2 = 0.14%) at 50% N V̇O2 peak for 60min (Castleet al., 2011).
Physiological MeasurementsPrior to each testing session participants provided a urinesample for the assessment of urine specific gravity (USG;Atago Refractomer, Jencons Pls, Leighton Buzzard, UK) andurine osmolality (UOSMO; Advanced 3300 Micro-Osmometer,Advanced Inc., Massachusetts, USA), determined their nudebody mass (Seca, Bodycare, UK) and inserted a rectal thermistor(Grant Instruments, UK) to a depth of 10 cm. Heart rate (HR)was monitored throughout each trial via telemetry (Suunto, T6c,
Frontiers in Physiology | www.frontiersin.org 3 March 2016 | Volume 7 | Article 78
Lee et al. Heat Acclimation Improves Hypoxic Tolerance
Finland). Blood lactate (Biosen C-Line analyser, EKFDiagnostics,Sailauf, Germany) was determined from a finger capillary wholeblood sample at the end of the resting period and at the end ofexercise for both HST and acclimation sessions. Heat strain wascalculated using the physiological strain index (PSI; (Moran et al.,1998) as follows:
PSI = 5(TrectalT − Trectal0)× (39.5− Trectal0)−1
+ 5(HRT −
HR0)× (180−HR0)−1
Where Trectal0 and HR0 are the initial Trectal and heart raterespectively, and TrectalT and HRT were obtained at 10minintervals during acclimation sessions or HST with the meanexercise value reported, and at each 1 km measurement pointthroughout the TT. The PSI classifies physiological strainbetween 0 and 10 units, where 0 represents no or very little strainand 10 represents very high strain (Moran et al., 1998).
During all hypoxic sessions, arterial oxygen hemoglobinsaturation (SPO2) was measured throughout via a pulseoximeter (WristOx, Nonin Medical Inc., Minnesota, USA).Hemodynamic indices of stroke volume (SV) and cardiacoutput (Q̇) were estimated via arterial waveform measurementsobtained from a pneumatic finger cuff attached to the indexfinger of the right hand (Portapres Model-2, Finapres MedicalSystems, Hogehilweg, Amsterdam). The right arm was supportedthroughout using a sling, and the index finger positioned at aheight equivalent to the aorta via palpation of the third intercostalspace. Measurements were taken at the end of each restingphase, and for 120 s every 10min during the exercise phase, andPortapres calibrations performed at the beginning of the restperiod and at 8min intervals throughout the HST. Ratings ofperceived exertion (RPE; Borg, 1982) and thermal sensation (TS)were collected at 10min intervals during the 40min exercisetolerance phase of the test session with the mean exercise valuereported.
The self-paced 16.1 km time trial was completed usingthe SRMwin software’s open-ended mode (Version 6.4.2).Participants were instructed to complete the course as quickly aspossible and were given no verbal encouragement during the TT.Participants were only able to see the distance they had covered.Measures of HR, SpO2, Trectal, and power output were collectedevery kilometer and a fingertip BLa sample collected immediatelyupon completion of the TT.
Blood SamplingVenous blood samples (∼7mL) were collected from anantecubital vein into an EDTA treated vacutainer (Vacuetter,Greiner Bio-One, Stonehouse, UK) following the 15min seatedstabilization period before each HST, and on day 1 and 10 ofthe acclimation period. Post exercise samples were collectedimmediately after the exercise phase of the 60min HSTexposure was completed, and immediately upon completionof the aforementioned acclimation sessions. Whole venousblood was used to determine hemoglobin via a calibrated B-Hemoglobin Photometer (Hemocue Ltd., Angleholm, Sweden)and heparinized capillary sample tubes were centrifuged(Hawksley Micro Hematocrit Centrifuge, Hawksley and Son,
Lancing, UK) to establish hematocrit using a micro hematocritreader (Hawksley Micro). Both hemoglobin and hematocrit wereassessed in triplicate with themean value reported. These sampleswere collected to calculate corrected plasma volumes accordingto the equations of Dill and Costill (1974). A 100µL aliquotwas used for the immediate assessment of monocyte HSP72(mHSP72; described below). The remaining whole blood wascentrifuged at 5000 rpm for 10min and plasma aliquots storedat−80◦C until assessment of plasma glucose and lactate (RandoxDaytona Rx, County Antrim, Ireland), and extracellular HIF-1α(eHIF-1α; Cusabio, BIOTEK, Newark, New Jersey).
mHSP72 DeterminationAn IgG1 isotype and concentration-matched FITC-conjugatednegative control were used in order to assess non-specificbinding. Briefly, cells obtained after red cell lysis were fixed andpermeabilised (AbD Serotec, Kidlington, UK) and a negativecontrol (FITC, AbD Serotec, Kidlington, UK) or anti-HSP72antibody (SPA-810, Enzo lifesciences, Exeter, UK) was addedto a final concentration of 100µg·ml−1, this was used to label1 × 106 cells according to the manufacturer’s instructionsand then incubated for 30min in the dark. Samples werethen analyzed on a BD FACSCalibur (BD Biosciences, Oxford,UK) by flow cytometry with monocytes gated for forward/sidescatter properties and further discriminated by CD14 expression(Selkirk et al., 2009). Mean florescence intensity (MFI) was thencalculated using CellQuest Pro software (BDBiosciences, Oxford,UK) with a total of 15000 cells counted.
Extracellular HIF-1α
Extracellular HIF-1α, in EDTA plasma, was measured usinga pre-prepared sandwich enzyme-linked immunosorbent assay(ELISA) technique (Cusabio BIOTEK, Newark, New Jersey).100µL of standards and samples were added to each pre-coatedwell and incubated for 2 h at 37◦C. Standards and samples werethen aspirated and 100µL of biotin-antibody and incubated at37◦C for 1 h. After three 200µL washes with sodium azide-free wash buffer, 100µL of horse radish peroxidase-avidin wasadded to each well and incubated for 1 h at 37◦C. Following afurther three wash steps 90µL of TMB substrate was added andincubated at 37◦C in the dark before 50µL of stop solution wasadded. The plate was then read at 570 nm and 450 nm to enablewavelength correction. The assay’s detection range is 62.5−4000pg.mL−1 and limit of detection is 15.6 pg.mL−1. The intra-assayprecision was determined from duplicates of standards withinthe same plate (6.4%) and inter-assay precision determined fromstandards assessed across plates (8.2%).
Statistical AnalysisThe primary outcome measures of this study were an assessmentof whole body cardiovascular, thermoregulatory, metabolic andmHSP72, and eHIF-1α responses to the HST. Time trialcompletion time was the main variable of interest during theperformance component of the HST. In order to control for thefalse discovery rate and correct for multiple comparisons fourfamilies of hypothesis were tested according to the method ofBenjamini and Hochberg (1995); (1) Physiological responses to
Frontiers in Physiology | www.frontiersin.org 4 March 2016 | Volume 7 | Article 78
Lee et al. Heat Acclimation Improves Hypoxic Tolerance
acclimation; (2) Physiological responses to the hypoxic stresstests; (3) Cellular stress responses; and (4) Time trial performanceresponses.
All data were checked for normal distribution prior toanalysis and tests employing repeated measures were checked forsphericity before analysis with Mauchly’s sphericity test. Wheresphericity was broken, p-values were corrected using the Huynh-Feldt method. Resting andmean exercise data from day 1 and day10 of the acclimation period, and HST1 and HST2 were analyzedusing a 2 (time)× 3 (group)mixed effects linearmodel, with fixedeffects for acclimation day.
To enable an exploration of pacing strategies during the TTfollowing the acclimation period power output was averaged overeach km of the TT and analyzed using linear effects mixedmodelswith fixed effects for time and group. HR, Trectal and PSI duringthe TT were analyzed using the same method. Data are reportedas mean ± standard deviation for n = 7 in each experimentalgroup, unless otherwise stated. Precise p-values are reported, andboth Cohen’s D (with 95% confidence intervals) and partial etasquared (Pη2) effect sizes are presented to indicate the magnitudeof observed effects (Colquhoun, 2014). Cohens D effect sizesof 0.2, 0.5, and 0.8 and partial eta squared (Pη2) effect sizes of0.01, 0.06, and 0.13 are considered small, medium and large,respectively.
RESULTS
Heat Acclimation, Hypoxic Acclimation,and Exercise Control InterventionsPhysiological and thermoregulatory variables for eachexperimental group before and after day 1 and day 10 ofacclimation are displayed in Table 1. Participants were hydratedprior to each acclimation session, with no between-day orbetween group differences observed for pre-trial body mass,Uosmo or USG. On day 1 of acclimation, mean exercise HR wasgreater in HOT (p = 0.01) and HYP (p = 0.02) compared toCON. Additionally, HOT induced a greater mean exercise Trectal
and corresponding PSI compared to HYP (both p < 0.05) andCON (both p < 0.001), with no difference observed betweenHYP and CON (Table 1).
On day 10 of acclimation an interaction effect was observedfor resting plasma volume (f = 12.336, p < 0.0001, ηp2 = 0.58)which increased inHOT (d = 3.8, 95%CI= 1.9 to 5.2), decreasedin HYP (d = −1.7. 95% CI = −3.2 to −0.6) and remainedunchanged in CON (d = 0.7, 95% CI = −0.5 to 1.7). No maineffect for time (f = 3.346, p = 0.084, ηp2 = 0.16) or time ×
group interaction (f = 2.293, p = 0.13, ηp2 = 0.20) was observedfor resting HR, although a large effect size was noted for HOT(d = −0.73, 95% CI = −1.86 to 0.31). Resting Trectal was lowerfollowing acclimation in both HYP (d= −0.72, 95% CI= −1.69to 0.45) and HOT (d = −2.17, 95% CI = −2.3 to –0.1; p < 0.05for both).
Following acclimation PSI was reduced in both HYP (p =
0.001, d = −1.0, 95% CI = −2.2 to 0.1) and HOT (p = 0.005,d = −1.95, 95% CI = −3.4 to −0.8), and was unchanged inCON (d = −0.1, 95% CI = −1.2 to 0.9). The reduction in PSI
was mediated by a lower mean exercise HR in HYP (p = 0.01,d = −1.1, 95% CI = −2.3 to 0.0), and a lower mean exerciseHR (p = 0.04. d = −1.3, 95% CI = −2.3 to 0.0) and Trectal
(p = 0.001, d = 4.9, 95% CI= −5.0 to−1.7) in HOT. No changein these variables was observed in CON. A large effect for rate ofTrectal change was observed for HOT (d = −1.8, 95% CI = −2.6to –0.3) and not for CON (d = −0.3, 95% CI = −1.4 to 0.8),or HYP (d = −0.1, 95% CI = −1.1 to 1.0), with no main effectfor time (F = 4.240, p = 0.05, ηp2 = 0.19) or group × timeinteraction (f = 1.526, p = 0.244, ηp2 = 0.15) observed.
Monocyte HSP72 Before and AfterAcclimationNo between group difference was observed for mHSP72 prior toacclimation (Figure 2A).
Following exercise on day 1, mHSP72 was increased in HOT(p = 0.0015, d = 3.8, 95% CI= 1.9 to 5.2) and HYP (p = 0.0009,d = 1.5, 95%CI= 0.1 to 2.4), but not CON (p = 0.14, d = −0.3,95% CI = −0.5 to 0.7; Figure 2A). An inverse relationshipbetween resting mHSP72 and the magnitude of after exerciseexpression was observed for HOT (r = −0.88, p = 0.009), with aweaker relationship observed for HYP (r = −0.52, p = 0.23).
Prior to day 10 of acclimation, resting mHSP72 was increasedin HOT (p = 0.0006, d = 4.1, 95% CI = 1.4 to 4.4) andHYP (p = 0.013, d = 1.5, 95% CI = 0.04 to 2.3), andunchanged in CON (p = 0.21, d = −0.4, 95% = −1.4 to 0.7;Figure 2B). As a result of the increased resting concentrationsof mHSP72, no further after exercise changes in mHSP72 wereobserved in HOT (p = 0.53) or HYP (p = 0.24) on day 10(Figure 2B). Consequently, the before acclimation relationshipbetween resting mHSP72 and magnitude in after exercise changewas reduced in HOT (r = −0.05, p = 0.924), although similar inHYP (r = −0.55, p = 0.20).
Extracellular HIF-1α Before and AfterAcclimationFigure 3 illustrates eHIF1-α concentrations before and after day1 and day 10 of acclimation. Following exercise on day 1 ofacclimation eHIF-1α was increased in HYP (256 ± 290%, p =
0.011, d = 1.1, 95% CI = −0.2 to 2.0) and HOT (103 ± 162%,p = 0.076, d = 0.8, 95% CI = −0.4 to 2.0), and unchangedin CON (8 ± 29%, p = 0.95, d = 0.0, 95% = −1.1 to 1.0,Figure 3A). Prior to day 10 of acclimation eHIF-1αwas increasedin both HYP (292 ± 360%, p = 0.02, d = 1.2, 95% CI = −0.2 to2.0) and HOT (165 ± 66%, p = 0.031, d = 0.80, 95% = −0.4 to1.8), and unchanged in CON (5 ± 29%, p = 0.55, d = −0.1,95% −1.1 to 1.0, Figure 3B). On day 10 of acclimation eHIF-1α was no different from rest after exercise in HYP (21 ± 79%,p = 0.628) HOT (19 ± 33%, p = 0.112) or CON (−5 ± 17%,Figure 3B).
Hypoxic Tolerance TestsFollowing acclimation and immediately prior to the beginningof the HST trial, plasma volume remained elevated in HOT(p = 0.022, d = 1.0, 95% CI = −0.3 to 1.9), depressed in HYP(p = 0.056, d = −1.1, 95% CI = −1.9 to 0.3) and unchangedin CON (p = 0.41, d = −0.2, 95% CI = −1.2 to 0.9). Resting
Frontiers in Physiology | www.frontiersin.org 5 March 2016 | Volume 7 | Article 78
Data are means ± SD for all 21 participants.* Different from acclimation day 1 (p < 0.05) within group. # Different from acclimation day 1 (p < 0.01) within group. + Different from CON
(p < 0.05). ˆ Different from CON p (< 0.01). ψ Different from HYP (p < 0.05).
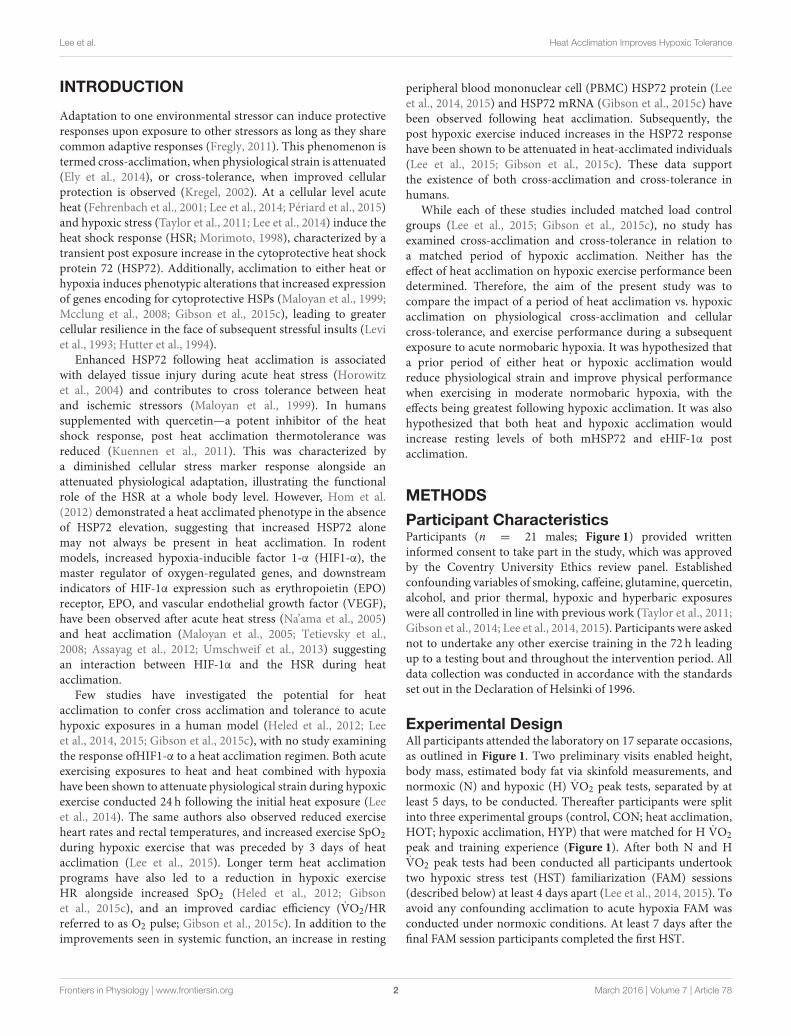
physiological and thermoregulatory parameters are displayed inTable 2. No resting physiological variable was affected as a resultof the intervention period (p > 0.05, Table 2). Table 3 presentsthe cardiovascular, metabolic, thermoregulatory, and perceptualresponses to the HST before and after acclimation. HR was lowerin HST2 compared to HST1 in HOT (p = 0.006, d = −0.6,95% CI = −1.8 to 0.4), and unchanged in CON (p = 0.44,d = 0.2, 95% CI = Hypoxic Tolerance Tests 0.9 to 1.2) andHYP (p = 0.38, d = −0.1, 95% CI = −1.1 to 1.0). Moderateand large effects were observed for an increased SpO2 in HOT(p = 0.0015, d = 0.70 95%CI =−0.5 to 1.8) andHYP (p = 0.023,d = 0.50, 95% CI= −0.7 to 1.4), with no effect observed in CON(p = 0.36 d = 0.0), neither was an interaction effect observed(f = 1.69, p = 0.212). A moderate effect was observed for SV inHOT (p = 0.06, d = 0.40, 95% CI = −0.7 to 1.40) but no effectwas observed for CON (p = 0.29, d = −0.1, 95% CI = −1.1to 1.0) or HYP (p = 0.11, −0.4, 95% CI = −1.5 to 0.7), and nointeraction effect was evident (f = 2.79, p = 0.08). As a resultof the increased SV and decreased HR in HOT, and no changesin either component variable for CON and HYP, no interactioneffect was observed for cardiac output (f = 0.50, p = 0.65),with small effects observed for CON (d = −0.1, 95% = −1.2to 1.0), HYP (d = −0.4, 95% CI = −1.5 to 0.7), and HOT (d= −0.2, 95% CI= −1.3 to 0.8). Cardiac efficiency, as determinedby O2 pulse, was improved in HOT (p = 0.01, d = 0.5, 95% CI= −0.6 to 1.5), and unchanged for CON (p = 0.50, d = 0.0,95% CI = −1.1 to 1.1) and HYP (p = 0.34, d = −0.1, 95%CI= −1.12 to 0.98), although no interaction effect was observed(f = 3.32, p = 0.059). No differences were observed betweenHST1 and HST2 for V̇Emin, V̇O2, V̇CO2, or RER (Table 3).
An interaction effect was observed for Trectal (f = 5.58, p =
0.013), with Trectal lower during HST2 for HOT (p = 0.002,d = −0.6, 95% CI = −1.7 to 0.5), and unchanged for CON(p = 0.28, d = 0.1, 95% CI = −0.9 to 1.20) and HYP (p = 0.17,d = −0.2, 95% CI = −1.2 to 0.9). The attenuated HR and Trectal
observed in HOT resulted in a reduced PSI during HST2 (p =
0.007, d = −0.9, 95% CI = −2.1 to 0.2). PSI was unchangedfrom HST1 to HST2 in CON (p = 0.30, d = −0.1, 95% CI= −1.2 to 0.9) and HYP (p = 0.47, d = 0.02, 95% CI = −1.0to 1.1). Additionally, the rate of Trectal change was attenuated inHST2 following HOT (p = 0.026, d = −0.44, 95% CI = −1.4 to0.7) but similar to HST1 in CON (p = 0.26, d= −0.1, 95% CI=−1.1to1.0) andHYP (p = 0.49, d= −0.2, 95%CI= −1.2 to 0.9).
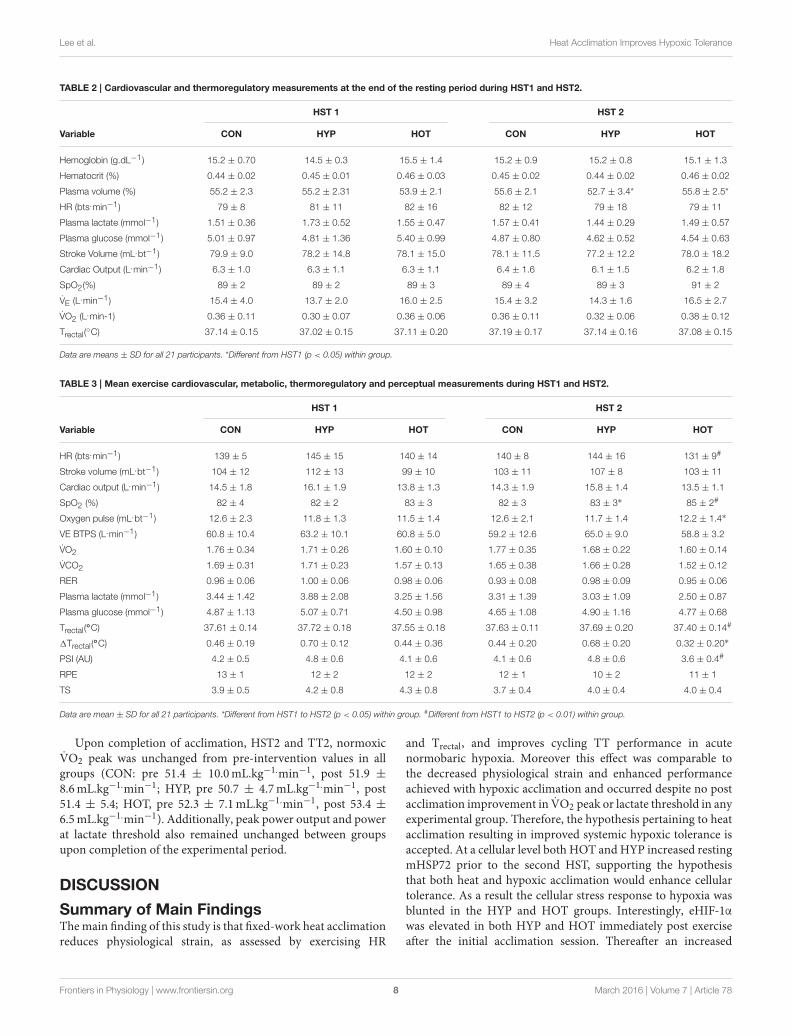
Monocyte HSP72 Responses to AcuteHypoxiaFigure 4 illustrates the mHSP72 response to hypoxia before(HST1) and after (HST2) the acclimation intervention. An acutebout of hypoxic exercise lead to increased mHSP72 MFI in allgroups prior to acclimation (main effect for time, F = 16.65, p <0.0001; Figure 4A), and the inverse relationship between restingmHSP72 and post exercise mHSP72 was observed (r = −0.51,p = 0.019 for the combined cohort, n = 21). Followingacclimation resting mHSP72 was increased in HYP (58 ± 52%,p = 0.014, d = 1.2, 95% CI= −0.02 to 2.2) and HOT (63± 46%,p = 0.008, d = 3.8, 95% CI = 0.7 to 3.2), remaining unchangedin CON (10 ± 46%, p = 0.83, d = −0.1, 95% CI = −1.1 to0.1; Figure 4B). Consequently, the mHSP72 response followingHST2 was blunted for HOT (p = 0.26) and HYP (p = 0.18), andwas comparable to HST1 in CON (Figure 4B).
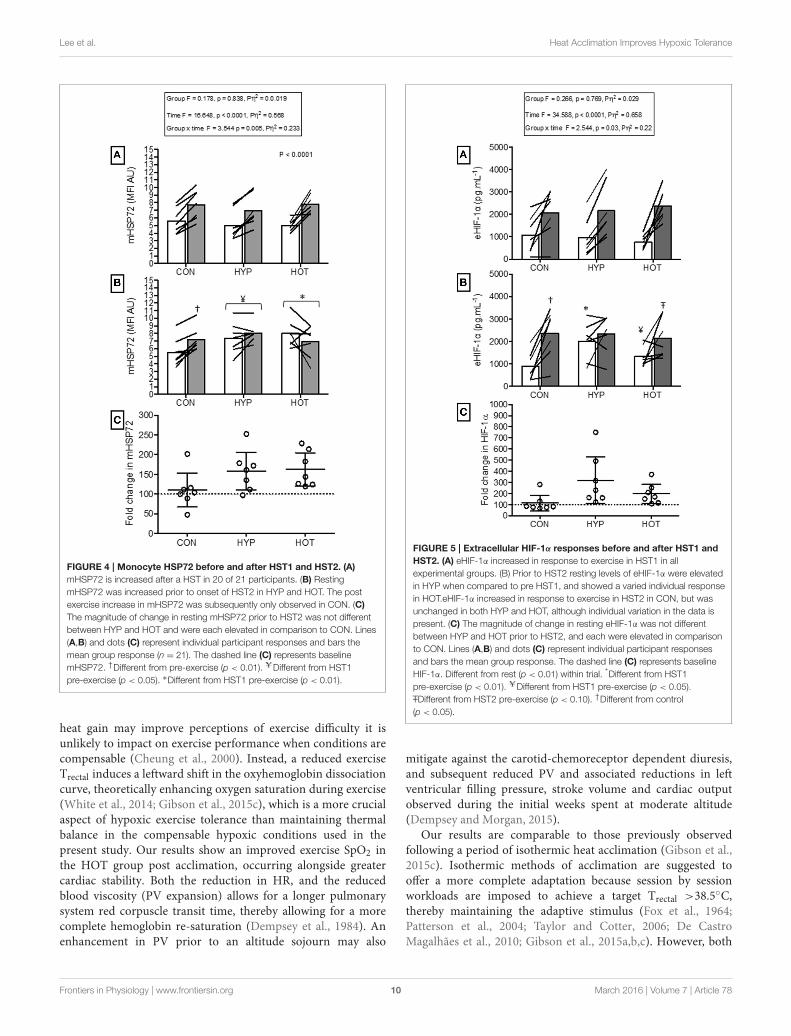
Extracellular HIF-1α Responses to AcuteHypoxiaFigure 5 illustrates the eHIF-1α response to hypoxia before(HST1) and after (HST2) the acclimation intervention. Priorto acclimation the HST induced a 171 ± 247%, 197 ± 125%,and 266 ± 192% increase in eHIF-1α in CON, HYP, and HOT,respectively (main effect for time, F = 34.59, p < 0.0001;Figure 5A). Following the 10 day acclimation period restingeHIF-1α was elevated in HYP (220 ± 128%, p = 0.002, d = 1.2,
Frontiers in Physiology | www.frontiersin.org 6 March 2016 | Volume 7 | Article 78
Lee et al. Heat Acclimation Improves Hypoxic Tolerance
FIGURE 2 | Monocyte HSP72 responses before and after the
acclimation period. (A) mHSP72 is increased post exercise on day 1 of HYP
and HOT, but not CON. (B) Resting mHSP72 was unchanged in CON and
increased in HYP and HOT on day 10 of acclimation compared to day 1 of
acclimation. Subsequently, the post exercise mHSP72 response in HYP and
HOT was attenuated compared to post exercise on day 1. (C) The magnitude
of change in resting mHSP72 on day 10 of acclimation was no different
between HYP and HOT (C). Open bars and shaded bars represent pre and
post exercise, respectively. Lines (A, B) and dots (C) represent individual
participant responses (n = 21) and bars show the mean group response. The
dashed line (C) represents baseline mHSP72. *Different from day 1
pre-exercise (p < 0.01). #Different from control (p < 0.01). †Different from
control (p < 0.05).
95% CI = −0.2 to 2.0) and HOT (98 ± 92%, p = 0.017, d = 0.8,95% CI = −0.4 to 1.8), and unchanged in CON (15 ± 76%,p = 0.62, d = 0.0, 95% CI= −1.1 to 1.0) (Figure 5B). Therefore,after acclimation eHIF-1α increased during exercise from rest inCON (241± 193%, p = 0.003, d = 2.3, 95% CI= 0.3 to 2.7) andHOT (76 ± 101%, p = 0.07, d = 1.8, 95% CI = −0.1 to 2.2),however this response was attenuated in HYP in comparison toHST1 (33 ± 83%, p = 0.30, d = 0.4, 95% CI = −0.7 to 1.4)(Figure 5B).
Time Trial PerformanceTable 4 illustrates performance changes for TT1 and TT2. Therewas no difference in TT times following the intervention in theCON group (TT1, 43:05min:s, 95% CI = 40:18 to 45:51min:s;
FIGURE 3 | Extracellular HIF-1α responses before and after the
acclimation period. (A) eHIF-1α is increased following an acute period of
hypoxic exercise and is more variable following HOT. No post exercise
changes in eHIF-1α were seen in CON (B) Resting eHIF-1α was elevated after
10 days of HYP and HOT acclimation, blunting the post exercise response on
day 10 of acclimation. No changes in eHIF-1α were observed in CON. (C) The
magnitude of change in resting eHIF-1α on day 10 of acclimation was no
different between HYP and HOT. Open bars and shaded bars represent pre
and post exercise, respectively. Lines (A,B) and dots (C) represent individual
participant responses (n = 21) and bars the mean group response. The
dashed line (C) represents baseline HIF-1α. +Different from day 1 rest
(p < 0.05). #Different from control (p < 0.01). ˆDifferent from day 1 pre
exercise (p < 0.10). *Different from control (p < 0.05).
TT2, 43:27min:s, 95% CI = 40:54 to 45:58min:s; d = 0.09). TheHYP group were quicker in TT2 (41:32min:s, 95% CI = 39:01to 44:03min:s) compared to TT1 (44:48min:s, 95% CI = 42:02to 47:33min:s; p = 0.006, d = −1.14). The HOT group werealso quicker in TT2 (40:41min:s, 95% CI= 38:10 to 43:12min:s)compared to TT1 (42:43min:s, 95% CI = 39:58 to 45:29min:s,p = 0.05, d =−0.70).
Power output during TT2 was increased from TT1 in theHYP and HOT groups (p < 0.05, Figure 6). Specifically PO wasgreater during each kilometer in HYP (Figure 6B), and greaterbetween 1–8 km and 14–16 km in HOT (Figure 6C). HR andTrectal were no different during the TT pre to post interventionin any experimental group (p > 0.05, Table 4). PSI was higher inthe post intervention TT in the CON (p = 0.02) and HYP groups(p = 0.03).
Frontiers in Physiology | www.frontiersin.org 7 March 2016 | Volume 7 | Article 78
Data are mean ± SD for all 21 participants. *Different from HST1 to HST2 (p < 0.05) within group. #Different from HST1 to HST2 (p < 0.01) within group.
Upon completion of acclimation, HST2 and TT2, normoxicV̇O2 peak was unchanged from pre-intervention values in allgroups (CON: pre 51.4 ± 10.0mL.kg−1.min−1, post 51.9 ±
8.6mL.kg−1.min−1; HYP, pre 50.7 ± 4.7mL.kg−1.min−1, post51.4 ± 5.4; HOT, pre 52.3 ± 7.1mL.kg−1.min−1, post 53.4 ±
6.5mL.kg−1.min−1). Additionally, peak power output and powerat lactate threshold also remained unchanged between groupsupon completion of the experimental period.
DISCUSSION
Summary of Main FindingsThemain finding of this study is that fixed-work heat acclimationreduces physiological strain, as assessed by exercising HR
and Trectal, and improves cycling TT performance in acutenormobaric hypoxia. Moreover this effect was comparable tothe decreased physiological strain and enhanced performanceachieved with hypoxic acclimation and occurred despite no postacclimation improvement in V̇O2 peak or lactate threshold in anyexperimental group. Therefore, the hypothesis pertaining to heatacclimation resulting in improved systemic hypoxic tolerance isaccepted. At a cellular level both HOT and HYP increased restingmHSP72 prior to the second HST, supporting the hypothesisthat both heat and hypoxic acclimation would enhance cellulartolerance. As a result the cellular stress response to hypoxia wasblunted in the HYP and HOT groups. Interestingly, eHIF-1αwas elevated in both HYP and HOT immediately post exerciseafter the initial acclimation session. Thereafter an increased
Frontiers in Physiology | www.frontiersin.org 8 March 2016 | Volume 7 | Article 78
resting concentration was only noted following HYP (48 h postHST). Increased baseline eHIF-1α led to a blunted post hypoxicexercise eHIF-1α response in the HYP group, whereas datafrom the HOT group was equivocal, indicating that furtherstudy on eHIF-1α and related downstream markers regulatedby this oxygen sensing gene following heat acclimation arewarranted.
Heat and Hypoxic Cross-AcclimationHeat acclimation induced a greater adaptive stimulus at lowerlevels of metabolic strain, and in a shorter time framecompared to hypoxic acclimation. This occurred despite theHYP group completing sessions at a higher relative intensity(61 ± 0.5% of H V̇O2 peak). Exercise durations of up to90min, as frequently utilized in acclimation protocols (De CastroMagalhães et al., 2010; Gibson et al., 2015b,c) increase thevariability in trial duration between hypoxia and heat stress(Lee et al., 2014). Therefore, matching both cardiovascular strainand exercise duration during the initial phase of acclimationwas achieved by using a workload of 50% N V̇O2 peak for60min (Lee et al., 2014). While cardiovascular strain in theHOT and HYP groups were each higher than CON during the
initial phases of acclimation, the total physiological strain wasgreatest in the HOT group as a result of the elevated Trectal
(Table 1).It is accepted that the sudomotor and cardiovascular
adaptations to heat stress are completed within 7–10 daysof daily exposure (Garrett et al., 2009; Castle et al., 2011).The typical indicators of heat acclimation, such as reducedexercising HR and Trectal and increased PV and sweat rate wereobserved in the present study and were similar in magnitudeto previous work using an identical heat acclimation protocol(Castle et al., 2011). We are confident therefore that participantsattained a heat acclimated state. Mechanistically, an increasedvascular filling time mediated by PV expansion is thoughtto improve cardiovascular stability during exercise-heat stress(Patterson et al., 2004). The observed PV expansion in thepresent study was maintained until the second HST (+4%,48 h after the final acclimation session). Although causalitycannot be determined, it is feasible that the greater PV inHST2 mediated the increase in exercise SV thereby reducingHR as observed in the HOT group. Additionally, exerciseTrectal and PSI were reduced during HST2, likely as a resultof the increased sweat rate. While a reduction in exercise
Frontiers in Physiology | www.frontiersin.org 9 March 2016 | Volume 7 | Article 78
heat gain may improve perceptions of exercise difficulty it isunlikely to impact on exercise performance when conditions arecompensable (Cheung et al., 2000). Instead, a reduced exerciseTrectal induces a leftward shift in the oxyhemoglobin dissociationcurve, theoretically enhancing oxygen saturation during exercise(White et al., 2014; Gibson et al., 2015c), which is a more crucialaspect of hypoxic exercise tolerance than maintaining thermalbalance in the compensable hypoxic conditions used in thepresent study. Our results show an improved exercise SpO2 inthe HOT group post acclimation, occurring alongside greatercardiac stability. Both the reduction in HR, and the reducedblood viscosity (PV expansion) allows for a longer pulmonarysystem red corpuscle transit time, thereby allowing for a morecomplete hemoglobin re-saturation (Dempsey et al., 1984). Anenhancement in PV prior to an altitude sojourn may also
FIGURE 5 | Extracellular HIF-1α responses before and after HST1 and
HST2. (A) eHIF-1α increased in response to exercise in HST1 in all
experimental groups. (B) Prior to HST2 resting levels of eHIF-1α were elevated
in HYP when compared to pre HST1, and showed a varied individual response
in HOT.eHIF-1α increased in response to exercise in HST2 in CON, but was
unchanged in both HYP and HOT, although individual variation in the data is
present. (C) The magnitude of change in resting eHIF-1α was not different
between HYP and HOT prior to HST2, and each were elevated in comparison
to CON. Lines (A,B) and dots (C) represent individual participant responses
and bars the mean group response. The dashed line (C) represents baseline
HIF-1α. Different from rest (p < 0.01) within trial. *Different from HST1
–TDifferent from HST2 pre-exercise (p < 0.10). †Different from control
(p < 0.05).
mitigate against the carotid-chemoreceptor dependent diuresis,and subsequent reduced PV and associated reductions in leftventricular filling pressure, stroke volume and cardiac outputobserved during the initial weeks spent at moderate altitude(Dempsey and Morgan, 2015).
Our results are comparable to those previously observedfollowing a period of isothermic heat acclimation (Gibson et al.,2015c). Isothermic methods of acclimation are suggested tooffer a more complete adaptation because session by sessionworkloads are imposed to achieve a target Trectal >38.5
◦C,thereby maintaining the adaptive stimulus (Fox et al., 1964;Patterson et al., 2004; Taylor and Cotter, 2006; De CastroMagalhães et al., 2010; Gibson et al., 2015a,b,c). However, both
Frontiers in Physiology | www.frontiersin.org 10 March 2016 | Volume 7 | Article 78
Lee et al. Heat Acclimation Improves Hypoxic Tolerance
FIGURE 6 | Mean power output during each kilometer of the 16.1 km
time trial for CON (A), HYP (B) and HOT (C). ∗Difference from TT1
(p < 0.05).
fixed work and isothermic models of acclimation have beenshown to offer comparable levels of acclimation at a systemic(Gibson et al., 2015b) and gene expression level (Gibson et al.,2015a), indicating each method possesses cross-acclimation andcross-tolerance potential.
We observed no change in absolute V̇O2, in addition toa reduction in hypoxic exercise HR 48 h after acclimation,indicating an improvement in gross efficiency as determinedfrom oxygen pulse(O2 pulse). Gibson et al. (2015c) noted similarimprovements in O2 pulse during hypoxic exercise completed24 h after the final isothermic acclimation session. Together thesedata illustrate that both fixed load and isothermic acclimationmethods induce a heat acclimated phenotype which also inducessimilar reductions in cardiovascular and thermoregulatory strainupon exposure to subsequent normobaric hypoxic exercise.We observed no post acclimation change in N V̇O2 peak inall experimental groups, thus the possibility that improvedphysiological strain occurred as a result of an improved postheat acclimation V̇O2 peak and subsequent reduction in relativeexercise intensity can be discounted (Lorenzo et al., 2010).Unfortunately we did not conduct a post-acclimation hypoxicV̇O2 peak test, so the role heat acclimation has on hypoxic aerobiccapacity could not be determined.
The duration, frequency and total number of intermittentnormobaric hypoxic exposures required to acclimate to later
normobaric hypoxia is unclear. Our present data indicates thatwhile SpO2 was increased during exercise in parallel with adecrease in exercising HR on day 10 of acclimation, full hypoxicacclimation was unlikely to have been achieved. The time courserequired to achieve a more complete adaptation to normobarichypoxia may therefore require either additional exposures, oran extended daily hypoxic exercise duration. For example,intermittent hypobaric hypoxic exposures have reported a 2–3%increase in exercise SpO2, a 9-20 bpm drop in heart rate, anda 150–160mL drop in V̇O2, and a 6.1min (16% improvement)in TT performance following 7 daily 4-h resting exposures(Beidleman et al., 2008). In contrast, the same authors reportedno change in performance following a matched experimentalapproach utilizing normobaric methods (Beidleman et al., 2009).The discrepancy in results was attributed to a loss of ventilatoryacclimation during the 60 h period between the last acclimationsession and follow up testing (Beidleman et al., 2009). In thepresent study it is possible a loss of ventilatory adaptationoccurred during the 48 h period between the last acclimationsession and second HST, accounting for the lack of improvedphysiological tolerance during HST2. The results suggest thatheat acclimation offers a more persistent and time efficient meansof improving cardiac stability during subsequent normobarichypoxic exercise. Furthermore, this was attained at a lowerlevel of metabolic strain compared to when the same absoluteexercise intensity was conducted in normobaric hypoxia. Theoptimal duration and frequency required to elicit adaptation tonormobaric hypoxia requires further study to enable additionalcomparisons between environments.
Heat and Hypoxic Cross-ToleranceOur data show that a 10 day period of fixed-work exerciseacclimation in both heat and hypoxic conditions enhancesbasal mHSP72 (Figure 2B). Interestingly, the magnitude ofmHSP72 accumulation was similar between HYP and HOTdespite the greater total physiological strain accrued duringheat acclimation (Figure 2C). The time course of HSP72accumulation throughout a period of heat or hypoxic acclimationhas not been studied. Therefore, it cannot be determined whetherthe different levels of physiological strain observed betweenconditions in the early phase of acclimation leads to a morerapid or more gradual induction of protective cellular processes.An enhanced reserve of HSP72 is one of the hallmarks of crosstolerance observed in rodent models (Maloyan et al., 1999;Horowitz, 2007; Horowitz and Robinson, 2007). In humans,acclimation to both heat and hypoxia has been shown to elicitincreases in basal HSP72 (Mcclung et al., 2008; De CastroMagalhães et al., 2010; Taylor et al., 2011, 2012) suggestingcross-tolerance potential exists. Increased post exercise mHSP72is likely mediated by an increase in thermal and physiologicalstrain in conditions of heat stress (Lee et al., 2014; Périardet al., 2015), and a transient increase in oxidative stress underhypoxic stress (Taylor et al., 2011, 2012). The results from theHOT group are similar to those reported by others using eitherfixed workload (Yamada et al., 2007; Mcclung et al., 2008; Homet al., 2012), or isothermic heat acclimation methods (De CastroMagalhães et al., 2010). Additionally, we observed increases in
Frontiers in Physiology | www.frontiersin.org 11 March 2016 | Volume 7 | Article 78
Lee et al. Heat Acclimation Improves Hypoxic Tolerance
resting mHSP72 following HYP acclimation, a response alsopreviously observed following 10 daily resting exposures to asimilar magnitude of hypoxia (Taylor et al., 2012). However,we are unable to determine whether the increase in mHSP72observed following hypoxic acclimation was a result of hypoxiaper-se, and the known increases in oxidative stress that occurin such conditions, or whether the increased relative work-load experienced in HYP was the main driver of the enhancedbasal mHSP72. The physiological and cellular strain induced inour control group was not sufficient to induce any changes inmHSP72, which may be due to no substantial exercise inducedchanges in Trectal, nor any exercise induced increase in oxidativestress.
It is well-established that the regulation of HSP synthesisis dependent on the levels existing within the cell (Kregel,2002). Consequently, prior to acclimation we observed an inverserelationship between basal mHSP72 and the magnitude ofpost exercise increase in this protein. After acclimation thisrelationship was no longer present as a result of the increasedpresence of mHSP72 within the cell. Under non-stressedconditions HSP72 is bound to HSF1. When the cell is exposedto one of the myriad of stressors that require HSP72 chaperonefunction, HSP72 binds to denatured proteins, freeing HSF1 tomigrate to the nucleus and bind with the heat shock element(HSE). More HSP72 protein is then transcribed, and continuesto bind with denatured proteins until equilibrium is restored.Excess HSP72 then binds with the HSF1 and transcription ishalted (Morimoto, 1998). Therefore, as acclimation progressesand basal HSP72 is accumulated, the cell becomes more robustto the daily challenge to homeostasis imparted via a fixed modelof acclimation. As a result, the stress required to sequester HSP72from HSF1, to begin further transcription, has to cross a newthreshold. It is this mechanism of HSP72 action that makesthe constant daily strain imparted by isothermic methods ofacclimation an attractive model for imparting cellular tolerance(Taylor and Cotter, 2006; Gibson et al., 2015c). However, as ourdata show,mHSP72 protein is enhanced after 10 days acclimationusing a simple fixed workload model, in agreement with theelegant work of Gibson et al. (2015a,c). Furthermore, the elevatedbasal mHSP72 persisted for at least 48 h after removal from theheat and hypoxic acclimation stimuli, suggesting achievementof a persistent phenotypic shift toward an acclimated state.Subsequently, basal mHSP72 was higher before HST2 comparedto HST1 in both the experimental groups and the post exerciseincrease in mHSP72 was attenuated in both HOT and HYP.The role of increased cellular tolerance on physiological functionrequires greater scrutiny, as we show that while both modesof acclimation enhance cellular reserves of mHSP72, only theheat acclimated group demonstrated improved physiologicalfunction in later hypoxic exercise. Our data support previousobservations pertaining to improved cellular tolerance followingheat and hypoxic acclimation (Levi et al., 1993; Maloyan et al.,1999; Taylor et al., 2012; Lee et al., 2015; Gibson et al.,2015c).
HIF-1α, the global regulator of cellular and systemic oxygenhomeostasis, has also been suggested to play an important rolein heat and hypoxic cross tolerance in rodent models (Maloyan
et al., 2001, 2005), with increased concentrations and relatedgene transcripts observed following heat acclimation (Maloyanet al., 1999). However, the role of HIF-1α during acclimation inhumans has not been studied. We show that hypoxic acclimationinduced a doubling of HIF-1α in the circulation, an increase thatwas maintained until the second HST. Subsequently, the postHST2 eHIF-1α response was blunted in HYP. We also show anincrease in eHIF-1α after the initial heat acclimation session,suggesting that this pathwaymay be an important mechanism forboth heat acclimation and cross-tolerance in humans. However,we acknowledge that the source, function and relationship eHIF-1α has with intracellular HIF-1α (iHIF-1α) is presently unknown.Therefore, while these results are novel, caution is required intheir interpretation. Further research is required to determinethe relationship between eHIF-1α and iHIF-1α and other HIF-1αassociated genes and circulating markers of hypoxic adaptation(e.g., erythropoietin). Doing so will establish the utility of eHIF-1α as a biomarker of acclimation and cross-acclimation.
Hypoxic Time Trial Performance Beforeand After AcclimationWe show, for the first time, that heat acclimation can improveexercise performance under conditions of acute normobarichypoxia to levels that were comparable to those observedfollowing hypoxic stress. TT performance may have beenenhanced following heat acclimation as a result of greatermetabolic efficiency and glycogen sparing during the initial 40-min steady-state pre-load trial (Febbraio et al., 2002; Lorenzoet al., 2010). Unfortunately no measurements of muscle glycogencontent were possible in the present investigation. The reducedpost exercise BLa in the absence of a change in V̇O2 peakor lactate thresholds, in combination with improved exerciseefficiency (O2 pulse) indicates a more efficient aerobic profile.Heat acclimation is known to reduce BLa concentrations fora given intensity (Young et al., 1985; Febbraio et al., 1994).In the present study, mean exercise blood lactate was lowerin HST2 following both heat and hypoxic acclimation. It hasbeen suggested that an increase in plasma volume followingheat acclimation may have an effect on BLa via an increase inblood flow through the splanchnic circulation, thereby enhancinglactate removal and delaying accumulation (Lorenzo et al., 2010).It is possible that such an effect during HST2 may have led toglycogen sparing via a reduced rate of glycogenesis prior to theTT, thereby preserving glycogen reserves and facilitating a greatermaintenance of power output during the TT. Alternatively, theincreased TT performance may have occurred as a result of alearning effect following the multiple exercise sessions. However,we took care to ensure that participants were familiarized to theTT protocol in advance. In addition, we validated the pre-loadedTT in our laboratory prior to testing using participants withsimilar characteristics (Lee et al., 2015). Finally, if performancechanges were a result of a learning effect we would expect to seea similar effect in the control group. Instead it appears that theexperimental groups had an altered pacing strategy as a result ofthe acclimation period, with systematic kilometer by kilometerincreases in power output, HR, and physiological strain observed
Frontiers in Physiology | www.frontiersin.org 12 March 2016 | Volume 7 | Article 78
Lee et al. Heat Acclimation Improves Hypoxic Tolerance
in the HYP group, and an altered starting and finishing strategyadopted by the HOT group (Figure 6).
Study LimitationsThe results of the present investigation are relevant onlyto those individuals with a moderate aerobic capacity andshould not be applied to those with elite physiology. However,the maintenance of SpO2 following either HOT or HYPacclimation is likely of more importance for more well-trainedindividuals, as they typically experience reduced hemoglobinsaturation due to typically larger cardiac outputs and reducedtime for gas exchange at higher work-rates (Powers et al.,1989). However, examining physiological responses to hypoxiafollowing acclimation to heat is of interest to athletes thatundergo hypoxic training camps. The potential use of heatacclimation to increase ability to tolerate greater work-rates uponarrival to altitude could allow for the maintenance of trainingvolumes and intensities during the initial sessions. However,the role prior acclimation to heat has on longer term hypoxicadaptation has yet to be explored. Additionally, our data onlyexamined normobaric hypoxia. It is possible that responsesunder ecologically valid hypobaric hypoxic conditions could bedifferent thus future study is required.
Wider Application of Our ResultsOur data indicate that heat based exercise offers a more efficientsystemic acclimation response to hypoxia in the time frameexamined than normobaric hypoxic training offers, which mayhave relevance to athletes and military personnel requiring atime-effectivemeans of increasing work capabilities in conditionsof moderate hypoxia. An enhancement in cardiac efficiencyfollowing repeated heat exposures may be desirable in militarypopulations or individuals sojourning to moderate altitude forshort durations without the means or time to fully acclimatizebefore completing work tasks. Additionally, implementing ahyperthermic stimulus to elicit cross-acclimation responses canbe achieved with little specialist equipment compared to thechambers or sojourns required to enable altitude adaptation.
CONCLUSION
We show, for the first time, that heat acclimation canimprove exercise performance under conditions of acutenormobaric hypoxia to levels that were comparable to thoseobserved following hypoxic acclimation. Fixed work heatacclimation is shown to be an effective intervention whenimprovements in hypoxic exercise tolerance or enduranceperformance are required. It was demonstrated that heatacclimation was a more effective and longer term (48 h postacclimation) means of improving systemic hypoxic tolerance,as quantified by exercise HR and SpO2, than a matchedduration and work period of hypoxic acclimation. Both heatand hypoxic acclimation elicit similar changes at the proteinlevel, with each increasing basal HSP72 and eHIF-1α, alongwith attenuation of post HST HSP72 and eHIF-1α responsesto an acute bout of hypoxic exercise. These data confirmprevious findings using isothermic models of acclimation and
illustrate that increasing physiological strain via exercise-heatstress is an effective, and simple to administer, intervention forinvoking both cross-acclimation and cellular cross-tolerance inhumans.
AUTHOR CONTRIBUTIONS
BL, CT, and RJ conceived the study. BL and AM collected the dataand performed the biochemical and data analysis. All authorswrote, reviewed, and approved the manuscript.
ACKNOWLEDGMENTS
The authors would like to thank the participants for theirtime and adherence during a demanding study period.We would also like to thank Miss Susie Wilson and MrRoy Petticrew for excellent technical assistance throughout,and Miss Rebecca Owen, Mr Michael Linney and MrTarran Peplar for their assistance during periods of datacollection.
REFERENCES
Assayag, M., Saada, A., Gerstenblith, G., Canaana, H., Shlomai, R., and Horowitz,
M. (2012). Mitochondrial performance in heat acclimation—a lesson from
ischemia/reperfusion and calcium overload insults in the heart. Am. J. Physiol.