+ All Categories
Home > Documents > Cross-border labour mobility: do East-West and East-East ...

Cross-border labour mobility: do East-West and East-East ...

Date post: 18-Nov-2021
Category:
Upload: others
View: 2 times
Download: 0 times
Share this document with a friend
20
1 Cross-border labour mobility: do East-West and East-East cross- border labour flows differ? 1 Tiiu Paas, Kaska Mart University of Tartu, Estonia Abstract The aim of this paper is to outline differences in the socio-demographic and employment characteristics of Estonian people who have worked in a neighbouring country Finland, Sweden, Latvia or Russia. In a broader context the paper tries to provide some new empirical evidence based knowledge of possible differences in determinants of the East-West and East- East cross-border labour flows. The empirical part of this paper relies on data from CV Centre an online employment portal bringing together jobseekers and vacant job posts. The results of our analysis show that different destination regions the wealthier countries of Finland and Sweden (referred to as East-West mobility) and Latvia and Russia (referred to as East-East mobility) have attracted workers with different personal and job-related characteristics. Ethnicity and higher education are important determinants in explaining differences between East-West and East-East labour flows. Non-Estonians and people with a higher education have been less likely to work in Finland or Sweden (East-West mobility). JEL Classification: J61, O57, R.23, P52 Key words: international labour mobility, cross-border labour flows, East-West and East-East labour migration, Estonia 1. Introduction The model of the European Single Market has increased awareness towards the mobility phenomenon. There is broad political consensus regarding the freedom of movement for capital, goods, services as well as labour in the European Union (EU). The European Commission announced 2006 as the European Year of Worker Mobility, and has continued to 1 Acknowledgements. The support is acknowledged from the Project IUT 20-49 Structural Change as the Factor of Productivity Growth in the Case of Catching up Economies. We are also thankful for the valuable feedback and comments received from our colleagues and projects’ partners (e.g. the NORFACE research program on Migration in Europe - Social, Economic, Cultural and Policy Dynamics project MIDI-REDIE, Migrant Diversity and Regional Disparity in Europe) during several seminars and discussions. Views expressed in the paper are solely those of the authors and, as such, should not be attributed to other parties. .
Transcript

1

Cross-border labour mobility: do East-West and East-East cross-border labour flows differ?1

Tiiu Paas, Kaska Mart

University of Tartu, Estonia

Abstract The aim of this paper is to outline differences in the socio-demographic and employment

characteristics of Estonian people who have worked in a neighbouring country – Finland,

Sweden, Latvia or Russia. In a broader context the paper tries to provide some new empirical

evidence based knowledge of possible differences in determinants of the East-West and East-

East cross-border labour flows. The empirical part of this paper relies on data from CV Centre

– an online employment portal bringing together jobseekers and vacant job posts. The results

of our analysis show that different destination regions – the wealthier countries of Finland and

Sweden (referred to as East-West mobility) and Latvia and Russia (referred to as East-East

mobility) have attracted workers with different personal and job-related characteristics.

Ethnicity and higher education are important determinants in explaining differences between

East-West and East-East labour flows. Non-Estonians and people with a higher education

have been less likely to work in Finland or Sweden (East-West mobility).

JEL Classification: J61, O57, R.23, P52

Key words: international labour mobility, cross-border labour flows, East-West and East-East

labour migration, Estonia

1. Introduction

The model of the European Single Market has increased awareness towards the mobility

phenomenon. There is broad political consensus regarding the freedom of movement for

capital, goods, services as well as labour in the European Union (EU). The European

Commission announced 2006 as the European Year of Worker Mobility, and has continued to

1 Acknowledgements. The support is acknowledged from the Project IUT 20-49 Structural Change as the Factor

of Productivity Growth in the Case of Catching up Economies. We are also thankful for the valuable feedback

and comments received from our colleagues and projects’ partners (e.g. the NORFACE research program on

Migration in Europe - Social, Economic, Cultural and Policy Dynamics project MIDI-REDIE, Migrant Diversity

and Regional Disparity in Europe) during several seminars and discussions. Views expressed in the paper are

solely those of the authors and, as such, should not be attributed to other parties.

.

2

consolidate new knowledge and practices as a means to facilitate geographic and job-to-job

mobility for the European labour force.

Geographic labour mobility covers both trans-national migration as well as cross-border

commuting. Although much research activity has been devoted to trans-national migration as

well as to different types of job-to-job migration since the eastward enlargement of the EU

(e.g. Zaitseva and Zimmermann, 2008; Kahanec and Zimmermann, 2010; Kahanec 2012), the

type of geographic labour mobility – cross-border commuting – has received less attention.

Our analysis provides some input in terms of research into cross-border labour flows,

focusing on labour mobility from Estonia to its neighbouring countries.

Geographic labour mobility, especially labour outflows, is a hot topic for Estonia – a small

EU Member State with a population of about 1.3 million, of whom around 30% are ethnic

minorities. Since joining the EU, the yearly out-migration figures in Estonia have more than

doubled compared to 2004, reaching 6,214 in 2011 and already 10,871 in 2012 (Statistics

Estonia, 2013). With around 50% of migrants moving there each year, Finland is the most

popular destination for Estonian migrants2. Migration has increased significantly in all age

groups with the exception of those aged 60 and more (Statistics Estonia, 2013). This means

that the country is losing (at least temporarily) people of prime working age.

International migration, especially labour outflows, is a hot topic for Estonia – a small EU

Member State with a population of about 1.3 million. Since joining the EU, the yearly out-

migration figures in Estonia have more than doubled compared to 2004, reaching 6,214 in

2011 and already 10,871 in 2012 (Statistics Estonia, 2013). With around 50% of migrants

moving there each year, neighbouring country Finland is the most popular destination for

Estonian migrants. Besides increasing migration numbers, Estonia is a country where the

number of cross-border commuters per 1,000 inhabitants is one of the highest in the EU,

reaching 15.8 (MKW Wirtschaftsforschung: 2009). The high level of cross-border commuting

and increasing migration numbers signal that the country’s institutions have to profoundly

monitor international labour mobility in order to elaborate and implement policy measures

that reduce permanent labour outflows and also attract labour force with a range of

knowledge, skills and new networks’ connections in order to benefit from the free movement

of labour in the long run.

2 Statistics Estonia data include only registerred flows that require a change of primary residence. Thus, official

statistics underestimate actual flows by 30-60% according to Eamets (2011)

3

The empirical part of the paper relies on data from CV Centre (CV Centre) – an online job

portal bringing together jobseekers and vacant job posts. This database makes it possible to

examine the main socio-demographic characteristics (e.g. age, gender, education, language

skills) and job characteristics (occupations, duration of employment) of Estonian people who

have worked in a neighbouring country – Finland, Sweden, Latvia or Russia. The former two

countries are among the wealthiest states in the EU, whereas the latter two are post-Soviet

states. The study outlines possible differences in the socio-demographic and job-related

characteristics of people who have worked in Finland and Sweden (this is referred to as East-

West mobility) compared to people who have worked in Latvia and Russia (this is referred to

as East-East mobility) implementing descriptive statistics and logistic regression models.

The paper is the first attempt to monitor Estonian labour flows to four neighbouring countries

– Finland, Latvia, Sweden and Russia based on the CV Centre database. In a broader context

the novelty of the paper is to provide some new empirical evidence based knowledge of

possible differences in determinants of the East-West and East-East cross-border labour

flows. We suppose that additional knowledge about cross-border labour movement and its

determinants provides valuable information for elaborating policy measures that can support

sustainable development and competitiveness of countries’ economies.

2. Framework for analysing labour mobility

Cross-border labour mobility, especially migration, has been a hot research topic for decades

and with numerous strands. Sjaastad (1962) established what has later been termed the

“human capital theory of migration,” a framework under which the decision to migrate is

considered an investment in an individual’s human capital, taking into account the costs and

benefits of the act of migration. Some years later Lee (1966) formulated a general framework

for migration analysis, distinguishing between mainly social or economic push and pull

factors in origin and destination regions, institutional or physical barriers to migration and

personal factors affecting the decision to migrate. Lee’s framework for studying migration

processes includes inter-regional macroeconomic disparities, as well as individual

characteristics of geographically mobile people. Departing from an individual framework,

Mincer (1978) further looked at migration decisions in the family context. Going ahead,

Massey (1990) argued that migration analysis should include the individual, household and

community level information, the latter being connected to macroeconomic disparities

between regions in income and employment levels. Although Lee (1966) and Massey (1990)

already noted the importance of pre-existing networks in the country of destination, this

4

aspect of migration has become a strand of research on its own, as migrant networks in the

destination country lower the costs of moving abroad for new migrants. Following Roy’s

(1951) discussion that was developed into a model by Borjas (1987), the question of the

positive and negative selectivity of immigrant workers has become an important field in

migration research focusing on examining possible impact of several determinants on

migration processes. Recent literature has further looked at the magnetic effects of several

welfare benefits; for example, Borjas (1999) found evidence from the US that generous

benefits attracted more immigrants with lower education.

Following literature about general framework for understanding migration processes,

numerous empirical studies have been conducted focusing several perspectives of

international mobility of people. Jennisen (2005) showed that GDP per capita has a positive

and unemployment rate a negative effect on net international migration in the EU. The young,

male, single and more educated people from urban areas are more likely to migrate (e.g.

Zaiceva & Zimmermann, 2008; European Commission, 2008). Delbecq and Waldorf (2010)

show that pre-existing communities in the destination country are the most important

predictor in East-West labour movements. These results confirm the findings of Pedersen et

al. (2004), who found distance (both physical and cultural) between the source and destination

country and pre-existing networks in the destination country to have a significant effect on

migration decisions. Evidence about the effects of welfare benefits from the EU is

controversial. De Giorgi and Pellizzari (2009) found that greater welfare benefits act as a

magnet for immigrants as include higher wages and lower unemployment rates. Giulietti et al.

(2011) find no significant effects of unemployment benefit systems on immigration for EU

migrants, although some significant effects for non-EU migrants.

Commuting literature has mainly focused on intra-regional (e.g. rural-urban commuting)

movements or, linked to our analysis, on specific border regions (e.g. Gottholmseder &

Theurl, 2011; Greve & Rydberg, 2003). To our knowledge, analyses of cross-border

commuting at EU level are scarce. Based on European Labour Force Survey data, Huber

(2011) shows that, compared to non-commuters, cross-border commuters are more often male

workers with medium level education who are more likely to be employed in manufacturing

or construction and less likely in non-market services. Comparing EU12-to-EU15 (East-West

mobility) with EU15-to-EU15 commuters (West-West mobility), Huber and Nowotny (2008)

show that the former group has a larger share of young people (aged 20–29) with medium

education levels who are more represented among construction, machine operating and

5

agricultural occupations. The results mainly indicate a negative selectivity of workers in

EU12 (new member states after the EU eastward enlargement) to EU15 the so-called old

member states) flows. High-skilled workers primarily commute between EU15 countries and

low-skilled between EU12 countries or from EU12 to EU15 (MKW, 2009).

Empirical evidence for Estonia shows that after joining the EU, people with university

degrees are significantly less likely to emigrate and people with primary education most likely

to do so (Anniste, et al., 2012a and 2012b). In addition, the majority of emigrants in 2007

were non-specialists and there were several times more manual workers compared to

professionals and managers that left Estonia (Eesti Pank, 2008). The European Commission

reports show that commuting between Estonia and Finland takes place weekly or even

monthly rather than daily (MKW, Wirtschaftsforschung, 2009). National labour market

experts highlighted construction and agriculture as important fields of activity for Estonian

workers in Finland.

3. Data on methodology

The paper provides a brief insight into some aspects of cross-border labour mobility focusing

on examining labour mobility in the EU, including movements between old member states

(EU15) and the new member states (EU12) that joined the EU in 2004 or after. We are

looking answer on the research question whether different destination regions of labour flows

(East-West and East-East flows) are characterised by differences in socio-demographic and

job-related characteristics of mobile workers.

The empirical part of the paper bases on the CV Centre (CV Centre) database. CV Market

Group (CV Centre) is the largest jobseeker database in the Baltic States. The database

includes information about the socio-demographic characteristics and employment history of

jobseekers. CV Centre data enables us to analyse cross-border movements of workers as CVs

include information about the past five jobs.

Our analysis bases on CVs that were updated between December 2004 and January 2010.

People with multiple jobs in abroad are considered more than once in this database. Our initial

sample size is nearly 10 000 observations. But after cleaning the database taking into account

availability of information about socio- demographic and occupational characteristics of

mobile people, the number of observations that include cross-border labour mobility cases

6

from Estonia to its neighbouring countries (Finland, Sweden, Latvia and Russia) is 8456:

83.8% belong to East-West flows (71.2 % in Finland; 12.6 % in Sweden) and 16.2 % belong

to East-East flows (12.7% in Russia and 3.5 % in Latvia).

Based on the CV Centre database which includes information of the past five jobs on mobile

people, we cannot clearly distinguish between past commuters and long-term and short-term

migrants. Around 25% of the cases declared in the CV-s show that the duration of jobs in

abroad lasted for up to three months and around 2% of the cases show that duration of jobs

lasted in a neighbouring country for at least ten years. Thus, in the majority cases, the duration

of jobs of mobile people lasted between four months and ten years.

We are aware that the database has several shortcomings that present limitations for

conducting an empirical analysis. First, it might not be representative of the population of

mobile workers as some occupational fields (e.g. medical workers) may be under represented.

Jobs abroad have also been categorized using a special approach, which sometimes makes

them difficult to group into larger categories (e.g. sectors). The data include demographic

information about each person – year of birth, education (with years of obtaining different

levels of education reported), language skills, marital status and number of children but this

information is not presented in all cases and the people present this information in their CV-s

according to their self-understanding and self-perceptions. We cannot correctly use data about

marital status and children of jobseekers because these variables are not always linked to a

year of marrying or ages of children as well as to previous job posts. The same applies to

language skills. English language skills could be regarded as a proxy for capabilities of people

who have worked in Estonia’s neighbouring countries, and therefore, we include these skills

in our analysis. Although the data does not necessarily consists of information about ethnicity,

we use mother tongue as a proxy for this. We are aware that mother tongue is not always fully

related to ethnicity.

In order to characterize labour flows between Estonia and its neighbouring countries we

provide some descriptive information about socio-demographic and job-related characteristics

of Estonian people who worked in a neighbouring country. We also estimate two logistic

regression models to enlarge the results of the descriptive analysis and to test whether the

socio-demographic and job related characteristics of the mobile Estonian people are

statistically different in the case the East-West and East-East labour flows.

The estimated logistic regressions are models are as follows:

7

(1)

Where

p(Yi =1) is the probability that an individual i = 1, … ,n worked in Finland or Sweden

(East–West cross-border mobility) and 1–p(Yi = 1) is the probability that an individual i = 1,

… n worked in Latvia or Russia (East-East mobility);

Xik are explanatory variables that contain socio-demographic (age, gender, education,

mother tongue) and job-related (occupations, job durations) characteristics for individual i (k

= 1, 1,…K, K-the number of explanatory variables). All explanatory variables are categorical.

The number of observations considered by the estimation of the logistics regressions is 5273.

Due to some missing information, the number of initially observed cross-border mobility

cases somewhat declined.

The logistic models look at the odds ratios of East-West flows (to Finland and Sweden)

compared to East-East flows (to Latvia and Russia). We consider the odds ratio as a measure

of effect size describing the strength of association between the outcome (dependent variable)

and an explanatory variable. The odds ratio represents the odds that an outcome (in our case

East-West mobility) will occur if a certain characteristic of an individual is present, compared

to the odds of the outcome occurring in the absence of that characteristic. The difference

between the two models is that the first model regresses only to socio-demographic variables,

the second additionally controls for the individuals’ job-related characteristics.

Although our analysis offers only a basic insight into a rather unique database of Estonian

jobseekers CV-s, we try to offer some broader contribution to research about cross border

labour mobility dealing with East-West and East-East labour flows. From this perspective,

Estonia offers an interesting case as it neighbours with wealthy Nordic countries (Finland and

Estonia) and post-socialist Eastern-European (Russia and Latvia) countries.

4. Empirical results

Table 1 presents descriptive information about socio-economic characteristics of Estonian

people who worked in neighbouring countries. This information bases on the self-reported

data of the past five jobs of the jobseekers presented in their CV-s and made public through

the CV Cenre database. Ethnicity (mother tongues is used for a proxy) and gender of cross-

border workers show some differences, when comparing East-West (working in Finland

iik

K

k

k

i

i uXYp

Yp

1

0)1(1

)1(log

8

and/or Sweden) and East-East labour (working in Russia and/or Latvia) flows from Estonia.

The former group is clearly dominated by males and Estonians. Workers in Latvia and Russia

have predominantly been non-Estonians, and male workers show only a slight majority.

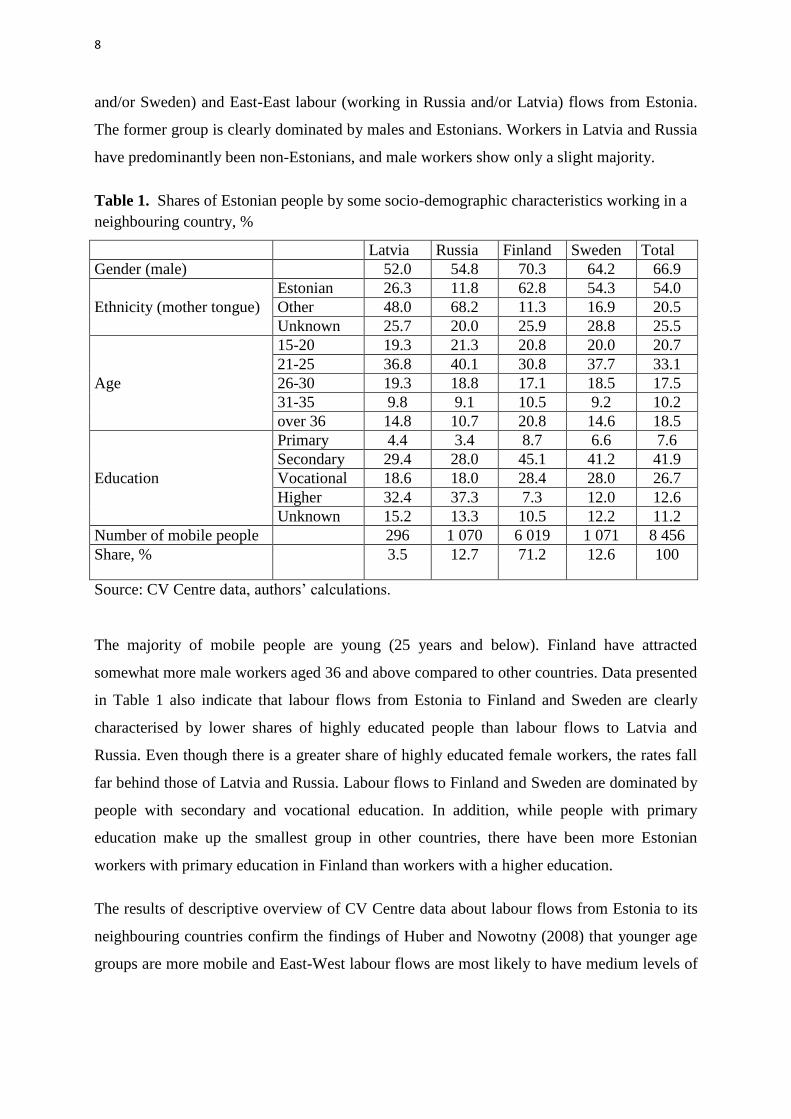
Table 1. Shares of Estonian people by some socio-demographic characteristics working in a

neighbouring country, %

Latvia Russia Finland Sweden Total

Gender (male) 52.0 54.8 70.3 64.2 66.9

Ethnicity (mother tongue)

Estonian 26.3 11.8 62.8 54.3 54.0

Other 48.0 68.2 11.3 16.9 20.5

Unknown 25.7 20.0 25.9 28.8 25.5

Age

15-20 19.3 21.3 20.8 20.0 20.7

21-25 36.8 40.1 30.8 37.7 33.1

26-30 19.3 18.8 17.1 18.5 17.5

31-35 9.8 9.1 10.5 9.2 10.2

over 36 14.8 10.7 20.8 14.6 18.5

Education

Primary 4.4 3.4 8.7 6.6 7.6

Secondary 29.4 28.0 45.1 41.2 41.9

Vocational 18.6 18.0 28.4 28.0 26.7

Higher 32.4 37.3 7.3 12.0 12.6

Unknown 15.2 13.3 10.5 12.2 11.2

Number of mobile people 296 1 070 6 019 1 071 8 456

Share, % 3.5 12.7 71.2 12.6 100

Source: CV Centre data, authors’ calculations.

The majority of mobile people are young (25 years and below). Finland have attracted

somewhat more male workers aged 36 and above compared to other countries. Data presented

in Table 1 also indicate that labour flows from Estonia to Finland and Sweden are clearly

characterised by lower shares of highly educated people than labour flows to Latvia and

Russia. Even though there is a greater share of highly educated female workers, the rates fall

far behind those of Latvia and Russia. Labour flows to Finland and Sweden are dominated by

people with secondary and vocational education. In addition, while people with primary

education make up the smallest group in other countries, there have been more Estonian

workers with primary education in Finland than workers with a higher education.

The results of descriptive overview of CV Centre data about labour flows from Estonia to its

neighbouring countries confirm the findings of Huber and Nowotny (2008) that younger age

groups are more mobile and East-West labour flows are most likely to have medium levels of

9

education. The descriptive information also shows that there are no remarkable differences

between East-East and East-West flows in terms of age groups.

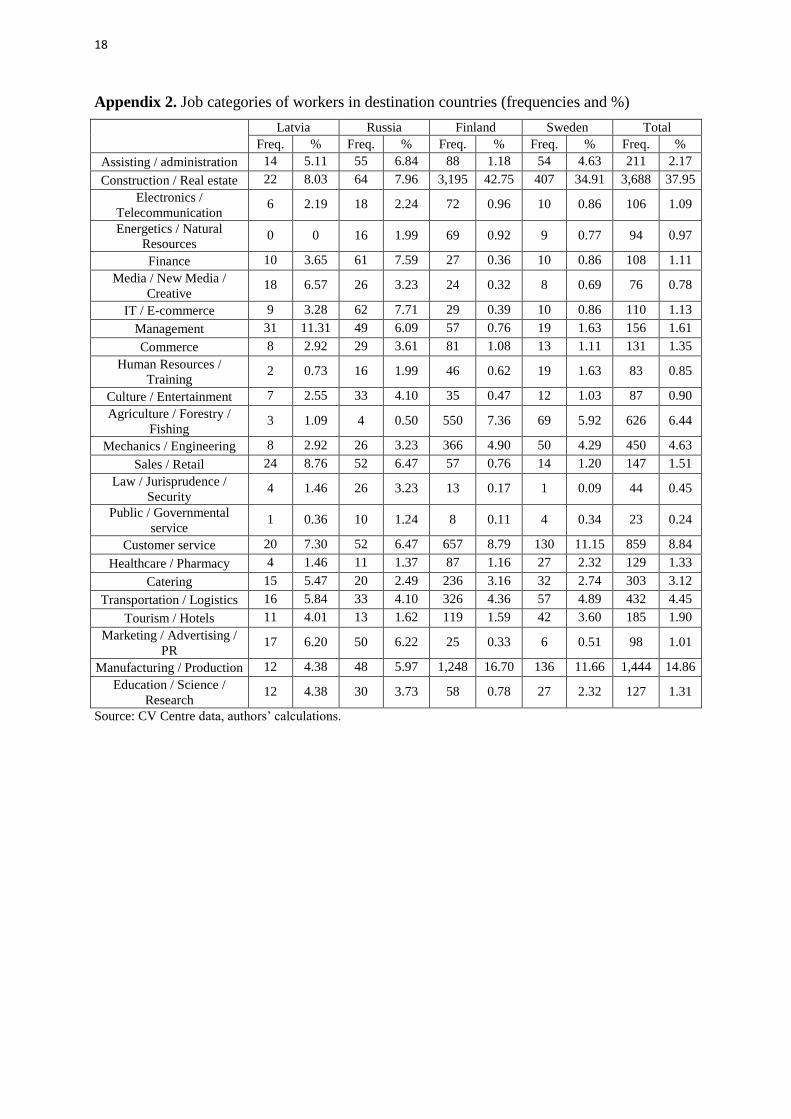
We also analysed mobility on the Estonian people to the neighbouring countries according

occupations. The job posts mentioned in the CV are classified relying on the occupation

categories of the U.S. The number of different job posts mentioned in the CV-s consists of 24

occupations (see also Kaska and Paas, 2013) and these are aggregated to the 5 main

occupation categories in this part of the analysis (Table 2). The East-West labour flows are in

most cases concerned with lower-skilled occupations (e.g. construction, maintenance,

transport, production). In the majority of cases, East-East labour flows concern managers and

professionals, but also sales and office posts. These results are also consistent with previous

empirical findings (MKW Wirtschaftsforschung, 2009; Huber & Nowotny, 2008) that East-

West flows in the EU are characterised by a high share of low-skilled workers, whereas high-

skilled workers move between EU15 (West-West mobility) or EU12 countries (East-East

mobility).

Table 2 . Shares of aggregated groups of occupations of Estonian workers in a neighbouring

country, %

Latvia Russia Finland Sweden Total

Management, Professional, and

Related Occupations 39.9 39.3 9.9 13.6 15.2

Service Occupations 11.8 9.9 6.9 11.8 8.1

Sales and Office Occupations 25.0 18.6 12.7 18.7 14.6

Agriculture, Construction, and

Maintenance Occupations 9.8 17.5 49.9 40.6 43.3

Manufacturing, Production, Transport 13.5 14.7 20.6 15.3 18.8

Source: CV Centre data, authors’ calculations.

We also analyse how long jobs in neighbouring countries have lasted (Table 3). It is worth

noting that job posts in Latvia and Russia lasted, on average, twice as long as in Finland and

Sweden. In all four destination countries the largest share of durations falls between 4 and 12

months. For East-West flows we can say that shorter job durations are dominant. However,

for East-East labour flows seasonal (up to 3 months) posts are most seldom. Over a third of

the people who worked in Russia or Latvia worked for more than two years on their most

previous job posst in those countries. The same figures for Finland and Sweden fall below

20%. We can conclude that job-related characteristics indicate that East-West flows are rather

concerned with lower-skilled and short-term occupations that are often seasonal.

10

Table 3. Share of average duration of jobs of Estonian people in neighbouring countries, %

Duration (months) Latvia Russia Finland Sweden Total

…-3 13.2 9.3 27.4 24.3 24.2

4-12 28.7 24.8 36.8 40.1 35.4

13-24 21.3 19.4 17.1 16.8 17.6

25-48 17.9 21.7 13.4 11.4 14.3

49-… 18.9 24.8 5.3 7.4 8.5

Source: CV Centre data, authors’ calculations.

In order to test whether there are statistically significant differences between the East-West

and East-East cross-border flows according to the socio-demographic and job-related

characteristics of the Estonian people, we estimate two logistic regression models. Table 4

reports the odds ratios from the two models along with robust standard errors below them in

brackets. Our study outlines possible differences in the socio-demographic and job-related

characteristics (age, gender, education, occupations, etc.) of people who have worked in

Finland and Sweden (East-West mobility) compared to people who have worked in Latvia

and Russia (East-East mobility) implementing descriptive statistics and logistic regression

models.

The first model includes socio-demographic variables and a dummy variable indicating

whether working abroad took place before or after joining the EU. Model 2 includes job-

related characteristics (occupations, durations). Both models look at labour flows after 1991

(i.e. after Estonia regained independence). Excluding the younger age groups (below 25) from

the analysis, to provide a higher probability that workers have obtained their highest level of

education, has very little effect on the results; these results are not reported in the table below.

Empirical results that rely on the Model 1 are generally in line with results from the

descriptive analysis. Men have been 1.5 times more likely to work in Finland or Sweden than

in Latvia or Russia. Minorities, however, work about 17 (1/0.06) times less likely in Finland

and Sweden. Results do not show significant differences between East-East and East-West

flows in the age groups of workers. People with higher education are 7.7 (1/0.130) times less

likely to follow the pattern of East-West cross-border labour mobility compared to East-East

mobility. When controlling for job-related characteristics in Model 2, the odds ratio is reduced

to 5.6 (1/0.180), but it still confirms that East-West labour flows are as a rule characterised by

less educated workers than East-East flows. More importantly, grouped job categories explain

gender differences resulting in an insignificant estimate for the gender variable in Model 2.

This indicates that the occupational choice between genders is not random.

11

Table 4. Odds ratios from logistic regressions comparing East-West to East-East labour flows

from Estonia

Model 1 Model 2

Male 1.521*** 0.960

(0.178) (0.137)

Ethnic minorities 0.060*** 0.061***

(0.007) (0.008)

Age 15-20 (Reference group) (Reference group)

Age 21-25 1.126 1.136

(0.194) (0.204)

Age 26-30 1.108 1.079

(0.210) (0.213)

Age 31-35 0.978 0.958

(0.216) (0.222)

Age 36-… 1.307 1.359

(0.261) (0.287)

Primary education (Reference group) (Reference group)

Secondary education 0.716 0.750

(0.147) (0.157)

Vocational education 0.839 0.892

(0.178) (0.195)

Higher education 0.130*** 0.180***

(0.029) (0.042)

After joining EU 5.927*** 4.040***

(0.681) (0.606)

English skills 1.102 1.193

(0.133) (0.153)

Managers and professionals - (Reference group)

Service - 2.152***

(0.454)

Sales and Office work - 1.427

(0.260)

Natural resources, construction, maintenance - 5.783***

(0.899)

Production, transport, materials - 5.711***

(1.019)

Duration up to 3 months - (Reference group)

Duration 4-12 months - 0.630**

(0.110)

Duration 13-24 months - 0.472***

(0.092)

Duration 25-48 months - 0.521**

(0.109)

Duration over 48 months - 0.375***

(0.092)

Constant 8.660*** 8.060***

(2.150) (2.669)

Number of observations 5273 5273

Akaike information criterion 2465.458 2286.785

Dependent variable equals 1 in case of East-West mobility and 0 in case of East-East mobility.

*** denotes significance at 5% level.

Source: CV Centre data, authors’ calculations.

12

The statistical significance of the dummy variable for the period of starting working abroad

indicates in both models that after Estonia joined the EU, East-West labour flows have

increased more than East-East flows.

Occupation groups show the strongest positive effects of jobs for Sweden and Finland in such

fields as natural resources, construction, production and transport compared to other fields.

Thus, the results from Model 2 confirm that East-East labour flows are more likely to

comprise high-skilled workers. Job posts in Sweden and Finland show a significantly lower

tendency for posts to last more than 3 months compared to posts in Latvia and Russia. As

durations increase the odds ratios get smaller indicating a higher probability of working in

Latvia or Russia for longer periods. There is a clear tendency for Estonian people to work on

seasonal or short-term job posts in Finland and Sweden (East-West mobility). East-East cross-

border labour flows are more long-term compared to the less educated and short-term East-

West labour flows.

5. Conclusion and discussions

The focus of the paper has been on the outlining the differences in the socio-demographic and

employment characteristics of Estonian people who have worked in a neighbouring country –

Finland, Sweden, Latvia or Russia. In a broader context the paper provides some new

empirical evidence based knowledge of possible differences in determinants of the East-West

and East-East cross-border labour flows. The empirical part of the paper relied on the data

from CV Centre – an online employment portal bringing together jobseekers and vacant job

posts.

The results of the study have confirmed that different destination regions – the wealthier

countries of Finland and Sweden (East –West flows) on the one hand and the post-socialist

countries of Latvia and Russia (East-East flows) on the other – have attracted workers with

different socio-demographic and job-related characteristics. Ethnicity and education are

important determinants in explaining differences in East-West and East-East cross-border

labour flows in the case of Estonia as a home country. Minorities and people with higher

education have been less likely to work in Finland or Sweden. Younger people have been

more mobile in the case of both East-East and East-West flows and there are no statistically

significant differences in age groups between the two groups of neighbouring countries. The

results of the study also indicate that East-East and East-West flows do not differ on the basis

of gender once job categories are controlled for.

East-West labour flows are statistically significantly more likely to be characterised by lower-

educated workers in fields such as construction, agriculture, manufacturing and production

and customer service. East-East flows are more evenly distributed between managerial

professions and more likely to be characterised by occupations that require higher education.

In addition, labour flows to wealthier neighbouring countries are characterised by

13

significantly shorter durations of job posts. More than 60% of people involved in cross-border

labour mobility worked in wealthier neighbouring countries for less than a year. Our results

are consistent with previous empirical studies of cross-border labour flows (Huber 2011;

MKW Wirtschaftsforschung 2009) indicating that international labour mobility in the case of

Estonia as a small country with post-socialist path-dependence follows similar patterns

compared to cross-border labour flows between larger and also richer countries and regions.

We argue that the possible consequences of cross-border labour mobility are twofold. On the

one hand, cross-border labour mobility may support the economic development of both

source and target country. For instance close proximity of wealthy neighbouring countries

(like Finland and Sweden) provides opportunities for Estonian workers to significantly

increase their income and to avoid unemployment, particularly in the rural areas, and thereby

diminishes pressure on the Estonian social system. The neighbouring countries Latvia and

Russia mainly attracted better educated and well qualified Estonian workers, who got new

challenges for developing their skills and obtaining experience of working in a new business

environment. As a rule, such workers also earned salaries above the Estonian average thereby

creating good preconditions for some new consumption demand in Estonia. Cross-border

labour mobility also provides possibilities to create new business networks and to get new

working skills and experience that can be useful for continuing working career after returning

to home country. Thus, in that sense cross-border labour mobility has a positive impact on the

economic development of both source and target countries. But one the other hand, cross-

border labour mobility provides some concern of brain waste taking into account the sharp

increase of lower-skilled jobs of Estonian people who are working in economically well-

developed neighbouring countries Sweden and Finland. People who are working in

economically more developed countries have often jobs that are below their qualifications.

In conclusion, to achieve the expected win-win situation of the increasing international labour

mobility, policy measures that reduce possible skill mismatches and brain waste and create

favourable preconditions for effective skills exchange and return migration should be further

elaborated and implemented. The packages of socio-economic policy measures should beside

others include comprehensive and supportive information for potential return migrants about

possible working and living conditions in home countries and regions, advisory services that

support adjustment of all family members in new working and living environment, working

places for spouses, suitable conditions for children in kindergartens and schools, language

support for children and spouses if necessary, psychological services, etc.

References

2010 Standard Occupational Classification, Standard Occupational Classification Policy

Committee (SOCPC), Bureau of Labour Statistics.

Anniste, K., Tammaru, T., Pungas, E., Paas, T. (2012), Emigration After EU Enlargement:

Was There a Brain Drain Effect in the Case of Estonia? University of Tartu – Faculty of

Economics and Business Administration Working Papers Series 87, 20 p.

14

Borjas, G. J. (1987), Self-Selection and the Earnings of Immigrants. The American Economic

Review, Vol. 77, No. 4, pp. 531-553.

Borjas, G. T. (1999), Immigration and Welfare Magnets. Journal of Labour Economics, Vol.

17, No. 4, pp. 607-637.

Borjas. J., Bratsberg B. (1996) Who leaves? The out-migration of the foreign-born. Review of

Economics Statistics, Vol. 78, No. 1, pp. 165-176.

Constant, A. F., Nottmeyer, O., Zimmermann, K. F. (2013) The Economics of Circular

Migration. In A. F. Constant, K. F. Zimmermann (Eds.), International Handbook on the

Economics of Migration, Edward Elgar 2013, Cheltenham, UK, and Northampton, USA, pp.

55-74.

De Giorgi, G., Pellizzari, M. (2009), Welfare Migration in Europe. Labour Economics,

Elsevier, Vol. 16, No. 4, pp. 353-363.

De Haas, H. (2007), Migration and Development: A Theoretical Perspective. Bielefeld:

COMCAD, 82 p.

Delbeck, B. A., Waldorf, B. S. (2010), Going West in the European Union: Migration and

EU-enlargement. Purdue University, Department of Agricultural Economics, Working

Paper 10-4.

Dustmann, C., Weiss Y. (2007), Return Migration: Theory and Empirical Evidence from the

UK. British Journal of Industrial Relations, London School of Economics, Vol. 45, No. 2, p

236-256.

Eamets, R. (2011), Employment, labour market flexibility and the economic crises in the

Baltic States, in Estonian Human Development Report 2010/2011, pp. 74–81.

Eesti Pank. Tööturu Ülevaade 2/2008.

Eliasson, K., Lindgren, U., Westerlund, O. (2003), Geographical Labour Mobility: Migration

or Commuting? Regional Studies, Vol. 37, No. 8, pp. 827-837.

EU Commission (2008), Employment in Europe, Chapter 3: Geographical labor mobility in

the context of EU enlargement. Directorate-General for. Employment, Social Affairs and

Equal Opportunities. Office for Official publications of the European Communities.

Luxembourg, October 2008.

Fihel, A, Kaczmarczyk, P, Okólski, M. (2006), Labour Mobility in the Enlarged European

Union. International Migration from the EU8 Countries. CMR Working Papers, No. 14/72,

96 p.

Giulietti, C., Guzy, M., Kahanec, M., Zimmermann, K. F. (2011), Unemployment Benefits

and Immigration: Evidence From the EU. IZA Discussion Paper No. 6075, 17 p.

Gottholmseder G., Theurl, E. (2007), Determinants of Cross-Border Commuting: Do Cross-

Border Commuters within the Household Matter? Journal of Borderland Studies, Vol. 22,

No. 2, pp. 97-112.

15

Greve, B., Rydberg, M. (2003), Cross Border Commuting in the EU: Obstacles and Barriers,

Country Report: the Oresund Region, University of Roskildens, Research Papers 11/03, 44 p.

Hazans, M. (2012). Selectivity of migrants from Baltic countries before and after enlargement

and responses to the crisis. In Galgóczi B., J. Leschke, A. Watt (eds.) EU Labour Migration

in Troubled Times: Skills Mismatch, Return and Policy Responses.

Hazans, M., Philips, K. (2011) The Post-Enlargement Migration Experience in the Baltic

Labour Markets. In Martin Kahanec and Klaus F. Zimmermann (eds), EU Labor Markets

After Post-Enlargement Migration, pp. 255-304.

Huber, P. (2011), Educational Attainment and Education-Job Mismatch of Cross-Border

Commuters in the EU. WIFO Working Papers, No. 388, 35 p.

Huber, P., Nowotny, K. (2008), Regional Effects of Labour Mobility, in European Integration

Consortium, Labour Mobility in the EI in the context of enlargement and functioning of the

transitional arrangements, EU Commission, Brussels, 132 p.

Huber, P., Nowotny, K. (2011), Moving Across Borders: Who is Willing to Migrate or to

Commute? Regional Studies.

Jennisen, R. (2005), Macro-Economic Determinants of International Migration in Europe.

Population Studies series, Purdue University Press, 206 p.

Kahanec, M., Zimmermann, K.F. (2010) (eds). EU Labour Markets after Post-Enlargement

migration. Springer: Berlin, et al.

Kahanec, M. (2012) Labour Mobility in an Enlarged European Union. IZA Discussion Paper

No 6465, 48 p.

Kallaste, E., Philips, K. (2004), Free Movement of Labour: A Threat to the Estonian Labour

Market? University of Tartu/PRAXIS Center for Policy Studies, 12p.

Lee, E. S. (1966), A Theory of Migration. Demography, Vol. 3, No. 1, pp. 47-57.

Massey, D. S. (1990), Social Structure, Household Strategies, and the Cumulative Causation

of Migration. Population Index, Vol. 56, No. 1, pp. 3-26.

MKW Wirtschaftsforschung, Empirica Kft. (2009), Scientific report on the mobility of cross-

border workers within the EU-27/EEA/EFTA countries. Final report.

Mincer, J. (1978), Family Migration Decisions. Journal of Political Economy, Vol. 86, No. 5,

pp. 749-773.

Pedersen, P. J., Pytlikova, M., Smith, N. (2004), Selection or Network liiEffects? Migration

Flows into 27 OECD Countries, 1990-2000. IZA Discussion Paper, No. 1104, 46 p.

Roy, A. D. (1951), Some Thoughts on the Distribution of Earnings. Oxford Economic Papers,

New Series, Vol. 3, No. 2, pp. 135-146.

16

Shuai, X. (2012), Does Commuting Lead to Migration? Regional Studies, Vol. 42, Nr. 3, pp.

237-250.

Sjaastad, L. A. (1962), The Costs and Returns of Human Migration. The Journal of Political

Economy, Vol. 70, No. 5, Part 2: Investment in Human Beings, pp. 80-93.

Skeldon, R. (2012), Going Round in Circles: Circular Migration, Poverty Alleviation and

Marginality. International Organization for Migration, Vol. 50, No. 3, pp. 43-60.

Statistics Estonia database. Available at: http://www.stat.ee, 01.03.2013.

Vertovec, S. (2007), Circular Migration: The Way Forward in Global Policy. International

Migration Institute, Working Paper 4, Oxford Institute.

Zaiceva, A., Zimmermann, K. F. (2008), Scale, Diversity, and Determinants of Labour

Migration in Europe, Oxford Review of Economic Policy, Vol. 24, No. 3, pp.428–452.

17

Appendix 1. Overview of the main demographic statistics by country of origin, as a %

Latvia Russia Finland Sweden Total

Gender Female 47.45 46.64 28.07 34.39 30.91

Male 52.55 53.36 71.93 65.61 69.09

Ethnicity Estonian 21.90 5.85 62.69 56.09 56.05

Non-Estonian 54.74 77.61 12.16 18.18 19.50

Unknown 23.36 16.54 25.14 25.73 24.45

Age at leaving 27.058394 25.929104 28.275391 26.751286 27.864053

Education Primary 20.07 26.37 21.72 19.47 21.79

Secondary 31.39 25.50 43.52 42.45 41.56

Vocational 17.88 10.70 28.21 28.04 26.45

Higher 30.66 37.44 6.56 10.03 10.21

Before joining EU Latvia Russia Finland Sweden Total

Gender Female 45.83 43.46 32.62 48.82 38.20

Male 54.17 56.54 67.38 51.18 61.80

Ethnicity Estonian 15.28 3.85 47.65 52.13 37.73

Non-Estonian 58.33 75.00 12.35 16.59 28.26

Unknown 26.39 21.15 40.00 31.28 34.01

Age at leaving

26.958333 25.292308 27.308725 26.199052 26.700311

Education Primary 22.22 22.69 24.03 22.27 23.37

Secondary 34.72 28.85 40.27 46.45 38.66

Vocational 19.44 13.08 27.38 23.70 23.45

Higher 23.61 35.38 8.32 7.58 14.52

After joining EU

Latvia Russia Finland Sweden Total

Gender Female 48.02 48.16 27.57 31.20 29.80

Male 51.98 51.84 72.43 68.80 70.20

Ethnicity Estonian 24.26 6.80 64.36 56.96 58.84

Non-Estonian 53.47 78.86 12.14 18.53 18.16

Unknown 22.28 14.34 23.50 24.50 22.99

Age at leaving

27.094059 26.233456 28.382432 26.873298 28.041879

Education Primary 19.31 28.13 21.46 18.85 21.54

Secondary 30.20 23.90 43.88 41.57 42.00

Vocational 17.33 9.56 28.30 29.01 26.91

Higher 33.17 38.42 6.36 10.58 9.55

Source: CV Centre data, authors’ calculations.

18

Appendix 2. Job categories of workers in destination countries (frequencies and %)

Latvia Russia Finland Sweden Total

Freq. % Freq. % Freq. % Freq. % Freq. %

Assisting / administration 14 5.11 55 6.84 88 1.18 54 4.63 211 2.17

Construction / Real estate 22 8.03 64 7.96 3,195 42.75 407 34.91 3,688 37.95

Electronics /

Telecommunication 6 2.19 18 2.24 72 0.96 10 0.86 106 1.09

Energetics / Natural

Resources 0 0 16 1.99 69 0.92 9 0.77 94 0.97

Finance 10 3.65 61 7.59 27 0.36 10 0.86 108 1.11

Media / New Media /

Creative 18 6.57 26 3.23 24 0.32 8 0.69 76 0.78

IT / E-commerce 9 3.28 62 7.71 29 0.39 10 0.86 110 1.13

Management 31 11.31 49 6.09 57 0.76 19 1.63 156 1.61

Commerce 8 2.92 29 3.61 81 1.08 13 1.11 131 1.35

Human Resources /

Training 2 0.73 16 1.99 46 0.62 19 1.63 83 0.85

Culture / Entertainment 7 2.55 33 4.10 35 0.47 12 1.03 87 0.90

Agriculture / Forestry /

Fishing 3 1.09 4 0.50 550 7.36 69 5.92 626 6.44

Mechanics / Engineering 8 2.92 26 3.23 366 4.90 50 4.29 450 4.63

Sales / Retail 24 8.76 52 6.47 57 0.76 14 1.20 147 1.51

Law / Jurisprudence /

Security 4 1.46 26 3.23 13 0.17 1 0.09 44 0.45

Public / Governmental

service 1 0.36 10 1.24 8 0.11 4 0.34 23 0.24

Customer service 20 7.30 52 6.47 657 8.79 130 11.15 859 8.84

Healthcare / Pharmacy 4 1.46 11 1.37 87 1.16 27 2.32 129 1.33

Catering 15 5.47 20 2.49 236 3.16 32 2.74 303 3.12

Transportation / Logistics 16 5.84 33 4.10 326 4.36 57 4.89 432 4.45

Tourism / Hotels 11 4.01 13 1.62 119 1.59 42 3.60 185 1.90

Marketing / Advertising /

PR 17 6.20 50 6.22 25 0.33 6 0.51 98 1.01

Manufacturing / Production 12 4.38 48 5.97 1,248 16.70 136 11.66 1,444 14.86

Education / Science /

Research 12 4.38 30 3.73 58 0.78 27 2.32 127 1.31

Source: CV Centre data, authors’ calculations.

19

Appendix 3. Job categories according to the US Bureau of Labour Statistics

Management, Professional, and Related Occupations includes the following categories from

CV Centre data:

- Energetics / Natural Resources

- Finance

- Media / New Media / Creative

- IT / E-commerce

- Management

- Culture / Entertainment

- Mechanics / Engineering

- Law / Jurisprudence / Security

- Marketing / Advertising / PR

- Education / Science / Research

Service Occupations includes the following categories of from CV Centre data:

- Human Resources / Training

- Public / Governmental service

- Healthcare / Pharmacy

- geographic labour mobility, neighbouring countries, cross-country labour flows,

Estonia

- Catering

- Tourism / Hotels

Sales and Office Occupations includes the following categories of from CV Centre data:

- Assisting / administration

- Commerce

- Sales / Retail

- Customer service

Natural Resources, Construction, and Maintenance Occupations includes the following

categories of from CV Centre data:

- Construction / Real estate

- Electronics / Telecommunication

- Agriculture / Forestry / Fishing

Production, Transportation, and Material Moving Occupations includes the following

categories of from CV Centre data:

- Transportation / Logistics

- Manufacturing / Production

Military workers were not reflected in CV Centre data. Problems in categorizing mainly

concerned such fields as electronics and telecommunications, energetics and natural

resources, human resources and training, public and government services and advertising,

marketing and PR. These categories made up less than 5% of all observations.

20

Appendix 4. Shares of job categories by destination countries before and after Estonia joined

the EU on May 1st 2004.

Duration

(months)

Latvia Russia Finland Sweden

Pre EU After EU Pre EU After EU Pre EU After EU Pre EU After EU

…-3 6.94 19.80 9.23 22.79 17.99 30.80 14.69 30.79

4-12 22.22 39.60 26.92 42.46 22.95 41.53 31.28 43.87

13-24 27.78 26.73 18.85 21.51 18.12 16.62 16.11 16.86

25-48 43.06 13.86 45.00 13.24 40.94 11.06 37.91 8.48

Source: CV Centre data, authors’ calculations.


Recommended