Cross-Cultural Consistency and Relativity in the Enjoyment of ThinkingVersus Doing
Nicholas Buttrick, Hyewon Choi,Timothy D. Wilson, Shigehiro Oishi,
and Steven M. BokerUniversity of Virginia
Daniel T. GilbertHarvard University
Sinan AlperMiddle East Technical University
Mark AveyardAmerican University of Sharjah
Winnee CheongHELP University
Marija V. ColicUniversity of Belgrade
Ilker Dalgar and Canay DoguluMiddle East Technical University
Serdar KarabatiIstanbul Bilgi University
Eunbee KimYonsei University
Goran KneževicUniversity of Belgrade
Asuka KomiyaKochi University of Technology
Camila Ordóñez LacléUniversidad de Iberoamérica
Caio Ambrosio LagePontifical Catholic University of Rio de Janeiro
Ljiljana B. Lazarevic and Dušanka LazarevicUniversity of Belgrade
Samuel LinsPontifical Catholic University of Rio de Janeiro
Mauricio Blanco MolinaUniversidad de Iberoamérica
Félix NetoUniversidade do Porto
Ana OrlicUniversity of Belgrade
Boban PetrovicInstitute of Criminological and Sociological Research,
Belgrade, Serbia
Massiel Arroyo Sibaja and David Torres FernándezUniversidad de Iberoamérica
Wolf Vanpaemel and Wouter VoorspoelsUniversity of Leuven
Daniela C. WilksUniversidade do Porto
Which is more enjoyable: trying to think enjoyable thoughts or doing everyday solitary activities? Wilsonet al. (2014) found that American participants much preferred solitary everyday activities, such as reading
Nicholas Buttrick, Hyewon Choi, Timothy D. Wilson, Shigehiro Oishi,and Steven M. Boker, Department of Psychology, University of Virginia;Daniel T. Gilbert, Department of ●●●, Harvard University; Sinan Alper,Department of ●●●, Middle East Technical University; Mark Aveyard,Department of ●●●, American University of Sharjah; Winnee Cheong,Department of ●●●, HELP University; Marija V. Colic, Department of
●●●, University of Belgrade; Ilker Dalgar and Canay Dogulu, Departmentof ●●●, Middle East Technical University; Serdar Karabati, Department of●●●, Istanbul Bilgi University; Eunbee Kim, Department of ●●●, YonseiUniversity; Goran Kneževic, Department of ●●●, University of Belgrade;Asuka Komiya, Department of ●●●, Kochi University of Technology;Camila Ordóñez Laclé, Department of ●●●, Universidad de Iberoamérica;Caio Ambrosio Lage, Department of ●●●, Pontifical Catholic University of
or watching TV, to thinking for pleasure. To see whether this preference generalized outside of the UnitedStates, we replicated the study with 2,557 participants from 12 sites in 11 countries. The results wereconsistent in every country: Participants randomly assigned to do something reported significantlygreater enjoyment than did participants randomly assigned to think for pleasure. Although we foundsystematic differences by country in how much participants enjoyed thinking for pleasure, thesedifferences were fully accounted for by country-level variation in 5 individual differences, 4 of whichwere positively correlated with thinking for pleasure (need for cognition, openness to experience,meditation experience, and initial positive affect) and 1 of which was negatively correlated (reportedphone usage).
Keywords: thinking, individual differences, cultural differences, replication
People prefer to do almost anything over doing nothing (Hsee,Yang, & Wang, 2010; Wilcox, Laran, Stephen, & Zubcsek, 2016),which may explain why so many of us reach for our phones whenwe have a spare moment. But why do not we reach into our ownminds instead, taking advantage of the opportunity to retrievepleasant memories, savor future events, construct fantasies, or insome other way enjoy our thoughts? Thinking for pleasure, the actof intentionally directing thoughts to enjoyable topics, could, inprinciple, be a way to generate positive affect. Some people areable to do this successfully, so much so that it interferes with theireveryday functioning, a phenomenon dubbed “maladaptive day-dreaming” (Bigelsen, Lehrfeld, Jopp, & Somer, 2016; Somer,2002). Many people, however, find thinking for pleasure to beeffortful and not particularly enjoyable (Wilson et al., 2014).
Recent research has examined why thinking for pleasure isdifficult and the conditions under which it can be done moreeffectively (Alahmadi et al., 2017; Westgate, Wilson, & Gilbert,2017). Westgate et al. (2017), for example, found that participantsinstructed to spend a few minutes enjoying their thoughts werebetter able to do when given a simple thinking aid (a reminder ofpleasant topics that they had generated). Alahmadi et al. (2017)found that participants reported greater enjoyment when given thegoal to think for pleasure as opposed to thinking about whateverthey wanted. The present study had a more basic purpose. Ratherthan examining the conditions under which people enjoy thinking,it reexamined a simple question investigated by Wilson et al.(2014): Which is more enjoyable—finding pleasure in one’s in-ternal world or engaging with the external world?
Wilson et al. (2014, Study 8) randomly assigned participants toeither spend 12 min enjoying their thoughts in their own homes or
spend the same amount of time on solitary external distractions,such as watching a video or surfing the web. Those in the formercondition could choose to think about a virtually endless array oftopics, by recalling pleasant events from their pasts, anticipatingpleasurable events yet to occur, or fantasizing about events thatmight never occur. And yet, perhaps because intentional thinkinginvolves mental effort (Westgate et al., 2017), participants foundthinking for pleasure to be less enjoyable than performing theexternal activities. As a convenient shorthand, we will refer to thisas a preference for “doing” over “thinking,” although it should bekept in mind that these terms refer to specific kinds of bothactivities, not for all things that can be done or mental activitygenerally. In the former case, we use doing to stand in for doingeveryday solitary activities, and in the latter case, we use thinkingspecifically for the act of intentionally trying to enjoy one’sthoughts.
The present study had two goals: First, because the initial studydemonstrating the preference for doing over thinking had a rela-tively small sample size, we assessed its replicability. Of moretheoretical interest, we examined cultural variations in the prefer-ence for doing over thinking. To date, research on thinking forpleasure has been conducted solely with American participants;thus, it is important to assess the generalizability of the phenom-enon (e.g., Henrich, Heine, & Norenzayan, 2010). We did so byconducting a direct replication of Study 8 by Wilson et al. (2014)in 11 countries.
Our primary prediction was that the basic preference for doingover thinking would be robust across cultural contexts. The humanmind evolved to engage with the world and to be vigilant fordangers and alert for opportunities (Fiske, 1992; James, 1890),
Rio de Janeiro; Ljiljana B. Lazarevic and Dušanka Lazarevic, Departmentof ●●●, University of Belgrade; Samuel Lins, Department of ●●●, Pontif-ical Catholic University of Rio de Janeiro; Mauricio Blanco Molina,Department of ●●●, Universidad de Iberoamérica; Félix Neto, Departmentof ●●●, Universidade do Porto; Ana Orlic, Department of ●●●, Universityof Belgrade; Boban Petrovic, Department of ●●●, Institute of Criminolog-ical and Sociological Research, Belgrade, Serbia; Massiel Arroyo Sibaja andDavid Torres Fernández, Department of ●●●, Universidad de Iberoamérica;Wolf Vanpaemel and Wouter Voorspoels, Department of ●●●, University ofLeuven; Daniela C. Wilks, Department of ●●●, Universidade do Porto.
Sinan Alper and Canay Dogulu are now at Department of ●●●, BaskentUniversity. Asuka Komiya is now at Department of ●●●, School of
Integrated Arts and Sciences, Hiroshima University. Samuel Lins is now atDepartment of ●●●, University of Porto.
The research reported here was supported by National Science Foun-dation Grant BCS-1423747. We thank Charlie Ebersole, Richard Klein,and Olivia Atherton for use of the Many Lab collaboration tool (https://osf.io/89vqh); Seher Raza and Julia Boyles for help with responsecoding; and Courtney Soderberg for statistical advice. Materials, data,and analysis scripts can be found at https://osf.io/av2t9/
Correspondence concerning this article should be addressed to NicholasButtrick or Timothy D. Wilson, Department of Psychology, Gilmer Hall,P.O. Box 400400, Charlottesville, VA 22904-4400. E-mail: [email protected] or [email protected]
suggesting that there may be a general preference for engaging inthe world. In addition, research has found few cultural differencesin the preference for action over inaction (Fulmer et al., 2010),suggesting that turning one’s attention inward requires cognitiveresources that most people—regardless of culture—do not partic-ularly want to spend, especially when pitted against the allure ofenjoyable activities such as reading, watching a video, or surfingthe web.
Nonetheless, there may be cultural variations in the extent towhich people prefer doing over thinking, and a second purpose ofthe present study was to explore such differences and the reasonsfor them. If such variation is found, it would increase our under-standing of both the mechanisms responsible for the enjoyment ofthinking and the nature of the cultural practices that promote them.Research on culture, thought, and personality does in fact suggestthat there may be systematic differences in the degree to whichpeople enjoy their own thoughts, but cases can be made for anumber of different relationships. On the one hand, one mightexpect that East Asians would enjoy thinking more than Westernparticipants do, given the dominant religious traditions of eachculture. Christianity, in its practice (H. Smith, 1991) and texts(Tsai, Miao, & Seppala, 2007), endorses a more active stancetoward the world, whereas Buddhism endorses a more contempla-tive approach; the latter might result in more experience andcomfort with thinking for pleasure. Indeed, in previous studies, wehave found that reported experience with meditation modestlypredicts how much people enjoying being alone with theirthoughts (Wilson, Westgate, Buttrick, & Gilbert, 2018a), suggest-ing that participants in countries where meditation is a commonpractice might have an easier time thinking for pleasure. Alsoconsistent with this prediction, Americans strongly prefer doingthings to sitting still (e.g., Fulmer et al., 2010; Tsai, Knutson, &Rothman, 2007) and prefer high-arousal positive emotional statessuch as excitement, whereas East Asians tend to prefer low-affectpositive emotional states, such as calm (Tsai, Knutson, & Fung,2006; Yoshioka, Nilson, & Simpson, 2002).
In addition, cultural differences in technology use, such as timespent on cell phones, might influence the amount of time peoplespend “just thinking.” Americans often use their cell phones inpublic, for example, whereas such usage is frowned upon in Japan,so much so that Japanese bus drivers will not allow passengers toboard if they are talking on their phones (Canton, 2012). The lessthat people use electronic devices, the more opportunities they mayhave to practice enjoying their own thoughts, thus suggesting thatresidents of countries that use phones less might enjoy thinking forpleasure more.
On the other hand, some studies have found systematic culturaldifferences in personality that might predict that East Asians mayenjoy thinking for pleasure less than Westerners do. In particular,Schmitt, Allik, McCrae, Benet-Martinez, and Zupanèiè (2007)found that, of the 56 countries in their sample, residents of EastAsian countries such as Japan, South Korea, and China had someof the lowest scores on openness to experience. Given that there isa modest positive correlation between openness to experience andthe enjoyment of thinking for pleasure (Wilson et al., 2018a), EastAsians might enjoy thinking for pleasure less than Westerners do.Another personality variable that correlates with the enjoyment ofthinking for pleasure is the need for cognition (Wilson et al.,2018a), which is “the tendency for an individual to engage in and
enjoy thinking” (Cacioppo & Petty, 1982, p. 116). We are unawareof any research on cultural differences in the need for cognition,but to the extent that such differences exist, we would expectcorresponding differences in thinking for pleasure.
Research on how people actually spend their time suggests adifferent pattern of cultural differences in the enjoyment of think-ing. The Multinational Time-Use Study, a harmonization of morethan 60 daily diary studies from 25 countries across over 50 years,shows that Americans report experiencing roughly, on average, 18min more of “relaxing/doing nothing” on a typical day than doresidents of countries such as Israel and Australia (who reportexperiencing roughly 1 and 3 min, respectively) but less thanresidents of the United Kingdom (who report experiencing roughly31 min) or South Africa (who report experiencing roughly 42 min;Gershuny & Fisher, 2013). These differences may be related to thepace of life in these countries: Running around without pauseleaves few opportunities to retreat into one’s own mind. BecauseAmericans live at a relatively average pace of life (Levine &Norenzayan, 1999), citizens of countries with slower paces, suchas Brazil, may have more opportunities to practice enjoying theirthoughts and thus may enjoy doing so more than Americans do.
In short, there are a number of differences in practices andpersonality that might lead people in different cultures to experi-ence different amounts of pleasure and displeasure when “justthinking,” but past research makes no clear predictions aboutwhich areas of the world should enjoy thinking the most or theleast. Indeed, prior studies lead to opposite predictions. Based onexperience with meditation, for example, we would expect resi-dents of East Asian countries to enjoy thinking for pleasure morethan residents of Western countries, but based on differences inopenness to experience, we would expect the opposite.
In the end, it may not be people’s country of residence thatmatters as much as their standing on the specific variables that arecorrelated with thinking for pleasure. To the extent that theseinterpersonal differences are geographically clustered, they couldresult in regional differences. If residents of Country A meditatemore often and are higher in openness to experience and need forcognition than residents of Country B, for example, then we mightobserve country-level differences in the enjoyment of thinking forpleasure (with higher levels in Country A than B). Many countries,however, are likely to be high on some predictors and low onothers. An understanding of thinking for pleasure and what pre-dicts it may best be advanced by an analysis of individual-levelvariables and how these variables cluster (or do not) in variouscultures.
To address these questions, we conducted a direct replication ofWilson et al.’s (2014) Study 8 at 12 sites in 11 countries. In theoriginal study, college student participants were asked to spend 10to 15 min alone in their rooms either thinking for pleasure or doingan enjoyable solitary activity of their choice (such as reading,watching TV, or surfing the Internet). Those who were asked tothink for pleasure reported less enjoyment (M ! 3.20 on a 9-pointscale) than did those who were asked to do an external activity(M ! 6.87, p " .001, d ! 1.83). Given the magnitude of thisfinding, and the finding that a preference for action over idlenessappears cross-culturally stable (Fulmer et al., 2010), we expectedparticipants in all countries to enjoy thinking less than they en-joyed doing. However, we also expected that there would becultural differences in the degree to which participants found
thinking for pleasure to be unpleasant and that these would berelated to differences in cultural practices and personality.
Method
Overview
In Study 8 by Wilson et al. (2014), 30 college student partici-pants, while alone in their own rooms, were randomly assigned tospend 10 to 15 min either thinking for pleasure or doing anenjoyable solitary activity of their choice. We performed a directreplication of this study at 12 sites in 11 countries to explorepossible cultural variations in this finding and to see whether suchvariations were related to reported use of technology or othercultural variables. We also included individual-difference vari-ables that have been found to correlate with the enjoyment ofthinking for pleasure, such as need for cognition (Cacioppo &Petty, 1982), to see whether they mediated any cultural differencesthat were observed. All materials, data, and analysis scripts can befound at https://osf.io/av2t9.
Institutional Review Board Statement
The research reported here was approved by the University ofVirginia Institutional Review Board for the Social and BehavioralSciences [U.S. & Japan] (Protocol #2014–0185, “Thinking &Doing”); by the Social and Societal Ethics Committee of theUniversity of Leuven [Belgium] (Protocol #G- 2015 08 306,“Cross-Cultural Thinking Enjoyment”); by the Yonsei UniversityInstitutional Review Board [Korea] (Protocol #201508-SB-502–02, “Cross-Cultural Thinking Enjoyment”); by the HELP Univer-sity Ethics Review Board for the Department of Psychology [Ma-laysia] (Protocol #N/A, “Cross-Cultural Thinking Enjoyment”); bythe Institutional Review Board of the Faculty of Sport and PhysicalEducation, University of Belgrade [Serbia] (Protocol #2014–2,“Cross Cultural Thinking Enjoyment”); by the Middle East Tech-nical University Institutional Review Board for the GraduateSchool of Social Sciences [both sites in Turkey] (Protocol #2015-SOS-127, “Cross-Cultural Thinking Enjoyment”); and by the In-stitutional Review Board of the American University of Sharjah[UAE] (Protocol #351, “Cross-Cultural Thinking Enjoyment”). Noformal IRB approval was deemed necessary by the departments atthe Pontifical Catholic University of Rio de Janeiro [Brazil], theUniversidad de Iberoamerica [Costa Rica], or the University ofPorto [Portugal]. All studies were run in accordance with theHelsinki convention on human experimentation.
Procedure
Site selection. We recruited collaborators from 12 sites at 11countries around the world using the Many Lab collaboration tool(https://osf.io/89vqh/). We aimed to recruit countries with differentreligious and cultural traditions from the United States, differentpaces of life, and different levels of economic development, butaside from directly recruiting collaborators in Japan and Korea totest theories about differences between Western and East Asianculture, we did not target any countries specifically. Informationabout the aims of the project, the requirements for authorship(translation, sample recruitment, data collection), and a timeline
were posted to the Many Lab page for potential collaborators. Allcollaborators who agreed to these requirements were accepted intothe project, resulting in teams from Belgium, Brazil, Costa Rica,Japan, Korea, Malaysia, Portugal, Serbia, the United Arab Emir-ates, the United States, and two teams from Turkey. Researchersfrom Nigeria and Tanzania dropped out before collecting databecause of participant recruitment issues.
Participants. A power analysis based on the effect size ofWilson et al. (2014), Study 8, indicated that at least 91 participantswould be needed at each site for 90% power to detect 50% of theoriginal effect size of d ! 1.83. Because we were interested inmediation analyses as well as between-conditions differences, weaimed to recruit at least 150 participants at each site. When theoriginal recruitment goal proved infeasible at some sites, we low-ered the threshold to 100 participants, which ultimately all but onesite cleared. We included all collected data in our analyses, in-cluding data from one site that recruited fewer than 100 partici-pants. Each site recruited participants from university participantpools, advertising to prospective participants that the study wasabout how people spend time when they are alone and that thestudy would take 20 to 25 min to complete, during which theywould have to be alone. All participants received course credit fortheir participation. The final sample consisted of 2,557 collegestudents attending universities at 12 sites in 11 countries. Thenumber of participants at each site and their demographics aredisplayed in Table 1.
Translation. Researchers at each site were provided with theQualtrics program that ran the study, which was identical to theone used by Wilson et al. (2014), with the addition of individual-difference measures. If translation was required, a member of eachteam translated the text in the program into the primary languageof their country and then a different member back-translated thetext into English. The back-translation was reviewed by the leadauthors to ensure fidelity. In total, the program was available to allparticipants in English, Spanish, Portuguese, Brazilian Portuguese,Japanese, Korean, Serbian, Dutch, and Turkish.
Procedure. The procedures of Wilson et al. (2014, Study 8)were followed as closely as possible except for the followingchanges: In the original study, participants first attended a labora-tory session in which they completed individual-difference mea-sures and were instructed that they would receive a link to aprogram over e-mail, which they should open only when they werealone in their rooms, had at least 30 min to spare, and were free ofdistractions. Because the study has been successfully replicatedusing Amazon’s Mechanical Turk participants who did not attendan initial session (E. N. Smith & Frank, 2015; n ! 81, d ! 1.32),we eliminated the initial session in our replications. Participantswere instructed to open the link to the study at a time when theywere alone and had at least 30 min to spare. They were pre-sented with the study in the language of their web browser, withthe opportunity to shift the translation to any of the otheravailable options. The Qualtrics program used to run the studyis available at https://goo.gl/BxR51v.
After giving consent, participants agreed to turn off all elec-tronic devices and put away any possible distractors, such as paperor pencils, and to close any other browser tabs. Once they con-firmed that their distractors had been put away and that they werealone in their rooms, they were allowed to continue. Participantsthen filled out a mood index (using a 5-point scale from 1 ! very
slightly or not at all to 5 ! extremely) to indicate how “Happy,Bored, Irritable, Stressed Out, Attentive, and Cheerful” they werecurrently feeling and indicated how long they had slept the previ-ous night (in hours, from “0” to “10 or more”). Mood items werecollapsed into a measure of positive affect (“Happy, Attentive, andCheerful”; # ! .65) and a measure of negative affect (“Bored,Irritable, and Stressed Out”; # ! .62). Participants then learnedthat they would be asked to sit by themselves in their room withoutfalling asleep or getting up to walk around in a 10- to 15-min “FreeTime” period.
Participants were randomly assigned either to the thinking con-dition or the doing condition and were given the same instructionsused in Wilson et al. (2014), Study 8. Participants in the thinkingcondition were told that they could spend the Free Time periodthinking about whatever they wanted but that they should spendthe time entertaining themselves with their thoughts as best as theycould, with the goal of having a pleasant experience, as opposed tospending the time focusing on everyday activities or negativethings. They were told not to use any external devices during theirtime, including phones, tablets, TVs, or computers. Participants inthe doing condition were told to entertain themselves during theupcoming Free Time period with activities from a list that includedwatching TV, reading a book or magazine, working on a puzzle,looking at the Internet, playing a videogame, or listening to musicor the radio. They were told that they could switch activitieswhenever they wanted and that they could do multiple activities atonce (e.g., listening to music while surfing the Internet). Theywere also told that their goal for the period was to have anenjoyable time and that they should not spend their time focusingon everyday activities or doing schoolwork. It was stressed in bothconditions that the Free Time period should be experienced alone,without the presence of, or communication with, other people.After reading the instructions, the 12-min Free Time period began.
After a chime indicated the end of the period, participants wereasked, on 9-point scale (from 1 ! not at all to 9 ! extremely, witha midpoint of 5 ! somewhat) how enjoyable, entertaining, andboring the Free Time period had been. Using similarly labeled9-point scales, participants were also asked to what extent theyfound their minds wandering and how hard it was for them toconcentrate. They were also asked to estimate the length of theFree Time period and to write about what they had thought ordone, depending on the condition.
To assess whether participants faithfully followed the instruc-tions or engaged in forbidden activities, we asked how long (in-cluding the option of “0 minutes ! no time”) they had performedeach of 14 activities, such as “talked with someone,” “watchedtelevision or a movie,” and “opened other windows on my com-puter, such as Facebook.” Participants were additionally askedwhether anyone else had been in the room during their Free Timeperiod, whether they had gotten up during the period, and whetherthey had timed the period with a watch.
To determine whether participants remembered what they weresupposed to do during the Free Time period, we asked them torecall how long they had been told the Free Time period wouldlast, what they were supposed to do during the Free Time period,and where they currently were.
Participants then provided demographic information and com-pleted questions about their religions, religious histories, experi-ences with meditation, histories of residential mobility, the size ofthe cities in which they grew up, and the size of their current cities,followed by the individual-difference measures described next.
Big Five personality traits. The 10-Item Personality Inventory(Gosling, Rentfrow, & Swann, 2003) assessed participants’ levelof openness, conscientiousness, extraversion, agreeableness, andemotional stability using two items for each trait (alphas ! .47,.56, .67, .14, and .53, respectively).
Need for cognition. We used an abbreviated three-item ver-sion of the Need for Cognition scale (Cacioppo & Petty, 1982)using the items that loaded most strongly on the overall construct.Participants were asked whether or not the following were char-acteristic of them, on a 5-point scale, from 1 ! extremely unchar-acteristic of me to 5 ! extremely characteristic of me: “Thinkingis not my idea of fun,” “I like to have the responsibility of handlinga situation that requires a lot of thinking,” and “I prefer complexto simple problems.” Alpha for the abbreviated scale was .56.
Time affluence. We used an abbreviated three-item version ofthe Time Affluence scale (Kasser & Sheldon, 2009) using theitems that loaded most strongly on the overall construct. Partici-pants were asked whether they agreed with the following state-ments, on a 5-point scale, from 1 ! strongly disagree to 5 !strongly agree: “I have enough time to do what I need to do,” “Ihave been able to take life at a reasonable pace,” and “I have feltlike things have been really hectic.” Alpha for the abbreviatedscale was .66.
Table 1Participant Demographics
Site n
Gender Age Religion
Females Males Other Range Mean (SD) Christian Muslim Buddhist None Atheist Other
Socioeconomic status. We measured socioeconomic statuswith two questions, asking where an individual would place them-selves on a slider relative to the worst-off/best-off people in theircommunities and in their nations as a whole (Adler et al., 2008).
Life satisfaction. Life satisfaction was measured with the fullfive-item Satisfaction with Life Scale (Diener, Emmons, Larsen, &Griffin, 1985). Alpha for the scale was .83.
Locomotion. We measured participants’ tendency toward ac-tion with an abbreviated four-item version of the Locomotion scale(Kruglanski et al., 2000) using the items that loaded most stronglyon the original construct. Participants were asked, using a 6-pointscale, where 1 ! strongly disagree and 6 ! strongly agree,whether they agreed with the following statements: “I enjoy ac-tively doing things, more than just watching and observing,”“When I decide to do something, I can’t wait to get started,” “Bythe time I accomplish a task, I already have the next one in mind,”and “Most of the time my thoughts are occupied with the task Iwish to accomplish.” Alpha for the abbreviated scale was .70.
Intrinsic religiosity. Intrinsic religiosity was measured withan abbreviated three-item version of the Intrinsic Religiosity scale(Hoge, 1972) using items that loaded most strongly on the originalscale. Participants were asked to rate, using a 5-point scale, where1 ! strongly disagree and 5 ! strongly agree, the followingstatements: “My faith involves all of my life,” “My religiousbeliefs are what really lie behind my whole approach to life,” and“Although I believe in my religion, I feel there are many moreimportant things in life.” Alpha for the abbreviated scale was .57.
Phone use and spare-time activities. We also asked how oftenparticipants used their phones on a daily basis, using a 6-pointscale from 1 ! no time to 6 ! more than 2 hr per day, and howlikely they would be to read a book or magazine, to listen to music,to watch TV, to sit and think, to meditate, and to check their phonewhen they had time to spare, all on 7-point scales from 1 ! veryunlikely and 7 ! very likely. We conducted a principal-components analysis with a promax rotation to reduce the numberof items, which produced a three-component solution: one com-ponent indexing phone usage, one component indexing internalthought, and one component indexing media usage. Finally, par-ticipants were asked to describe their impressions of the study.
Country-level measures. In order to conduct nation-levelanalyses we included the following variables: each country’s GDP/capita, country population, and population density (World Bank,2014), as well as the four cultural measures (of the six possible)that were available for all 11 countries from Hofstede, Hofstede,and Minkov (2010). These were masculinity (how driven theculture is by competition, with higher scores indicating moreachievement orientation and lower scores indicating more of afocus on quality of life and caring for others), power distance(cultural attitudes toward inequality, with higher scores indicatingmore acceptance and endorsement of inequalities by the less-powerful members of the culture), uncertainty avoidance (attitudestoward the future, with high scores indicating a stronger need tocontrol the future and lower scores indicating a willingness to justlet the future happen however it may), and individualism (the levelof interdependence of individuals within the culture, with higherscores indicating a more individualistic mentality and lower scoresindicating a more collectivistic mentality). Table 2 and Table S2 inthe online supplemental materials provide country-level summa-ries of these variables.
Results
Forbidden Activities
A large proportion of participants (40%) reported that they hadperformed at least one forbidden activity during the Free Timeperiod, with the most common being calling someone on theirphone (16%) and checking their e-mail (12%). The proportionof people who “cheated” was significantly higher in the thinkingcondition than in the doing condition, 54% versus 26%, $2(1) !208.2, p " .001, perhaps because there were more ways to cheatin the thinking condition (i.e., all of the activities listed wereforbidden to thinkers, but some, such as watching TV or a movie,were permissible for doers). Although these proportions are quitelarge, the total amount of time that people spent on forbiddenactivities was relatively small (M ! 3.38 min [SE ! 4.43] and 1.81min [SE ! 3.24] in the thinking and doing conditions, respec-tively). Perhaps because of this, the results are very similar regard-less of whether cheaters are included or removed from the analy-ses. We therefore opted to include them. It is also worth noting thatthese are liberal estimates of time spent on forbidden activitiesbecause they are the sum of participants’ reports of the time spenton each activity, and some of these activities could be donesimultaneously, such as listening to music and texting someone.Indeed, in some cases, the sum of the times exceeded the 12 minduration of the thinking period, and in those cases, we truncatedthe number at 12.
Reported Enjoyment of Thinking Versus Doing
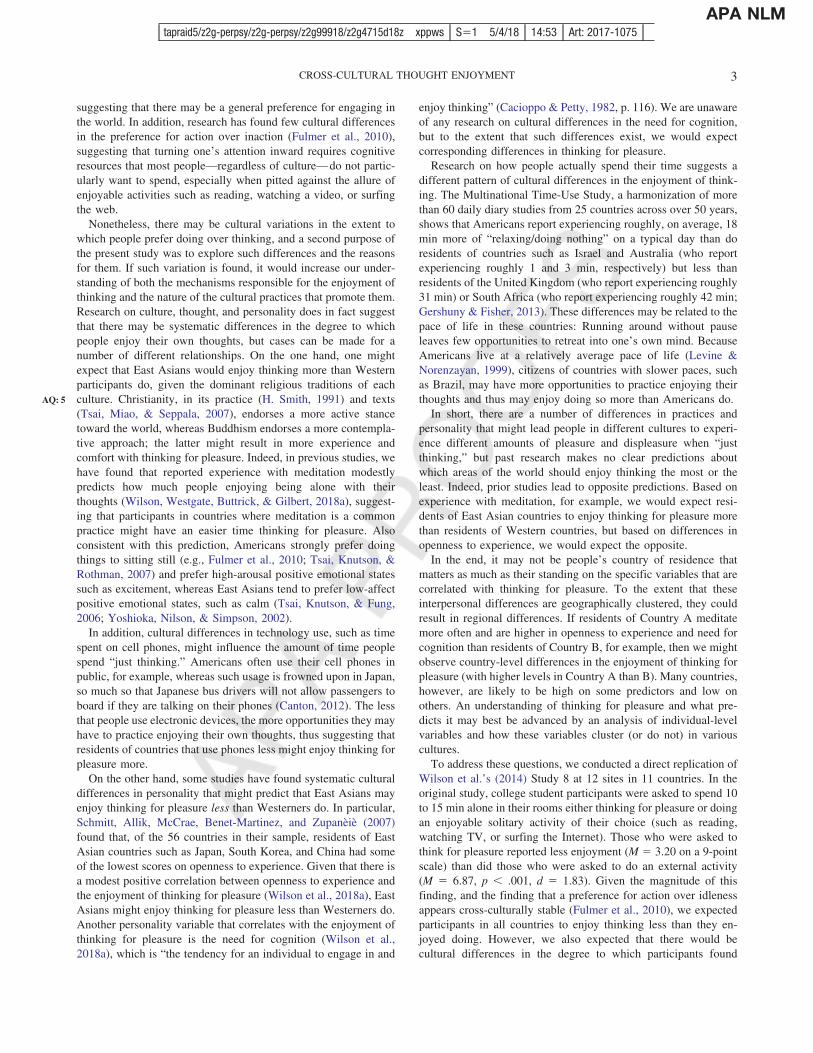
As in Wilson et al. (2014), we computed an enjoyment index byaveraging participants’ ratings of how enjoyable, entertaining, andboring (reverse scored) the Free Time period was (# ! .91).1 Werethe results of Wilson et al.’s Study 8 successfully replicated?Clearly, the answer is “yes.” Overall, participants in the thinkingcondition reported significantly less enjoyment than“ participantsin the doing condition (M ! 4.54, SD ! 1.90 vs. M ! 6.35, SD !1.80), t(2555) ! 24.66, p " .001, d ! .98, 95% confidenceinterval [CI] [.89, 1.06]. In all 11 countries, participants in thedoing condition reported significantly more enjoyment than didparticipants in the thinking condition, as shown in Table 3 andFigure 1. Notably, participants in the country that enjoyed thinkingfor pleasure the most (Costa Rica) still reported lower enjoymentthan participants in the doing condition in every country exceptJapan (see Figure 1).
Individual and Cultural Differences in the Enjoymentof Thinking for Pleasure
The magnitude of the preference for doing over thinking variedby country. Because participants were nested within country, weanalyzed the data with a set of multilevel models in a series ofexploratory analyses. Separate intraclass correlation analyses forthe thinking and doing conditions indicated that country-level
1 Alpha levels were similar in the different countries, with one excep-tion: The alpha in Costa Rica, the country with the smallest sample size,was somewhat lower (alpha ! .82). See the online supplemental materialsfor more details.
effects accounted for 4.0% of the variance in the thinking periodand 7.8% of the variance in the doing period. We next createdmodels predicting enjoyment from condition, with a random con-dition slope and intercept for each country. The effect of conditionwas highly significant, b ! 1.83, t(2556) ! 12.82, p " .001, anda model-selection approach indicated that removing the randomcondition slope led to a significantly worse-fitting model, $2(2) !22.039, p " .001, indicating that condition effects differed signif-icantly by country.2
Next, we examined the individual-difference and cultural-levelvariables that predicted cultural differences in the enjoyment ofthinking. Because our main focus is on thinking for pleasure, wedo not report variations in the enjoyment of doing by country,other than to note that the pattern of results reported below wasdistinctive to thinking; that is, the individual-difference variablesthat explained cultural differences in the enjoyment of thinkingwere not the same individual-difference variables that explaineddifferences in the enjoyment of doing. Details can be found in theonline supplemental materials.
Individual-difference variables. We first examined whethervariation in individual differences explained cultural differences inthe enjoyment of thinking for pleasure. Collectively, the 23 pre-dictors explained 12.5% of the variance (9.0% without takingcountry-level effects into account). Eight of the individual-difference variables correlated significantly with the enjoyment ofthinking for pleasure. They were need for cognition, reportedphone usage, openness to experience, meditation experience, ini-tial positive affect, locomotion, conscientiousness, and life satis-faction. All of these correlations were positive except for phoneusage, which was negative. The magnitude of these correlationswas modest, ranging from .10 to .26. All eight of these variablesvaried significantly by country (see Tables S1 and S2 in the onlinesupplemental materials).
To better understand the relationship between the eightindividual-difference predictors and the enjoyment of thinking for
pleasure across countries, we fitted a series of nested structuralequation models with submodels for each country, using theOpenMx R package (Neale et al., 2016). All models estimated boththe country-specific means and variances of the eight individual-difference variables that correlated significantly with enjoymentand their country-specific intercorrelations with each other. Ourinitial model (Model A) allowed each individual-difference pre-dictor to freely predict the enjoyment of thinking between coun-tries, so that each country could have its own coefficients from theindividual-difference measures to the enjoyment of thinking. Inaddition, both the mean and variance for the enjoyment of thinkingwere allowed to vary across countries. Model B constrained theregression coefficient between the predictor variables and theenjoyment of thinking to be equal across countries to test whetherneed for cognition, for example, had a different relationship toenjoyment in the United States versus Malaysia. This constraintdid not significantly decrease model fit, $2(8)] ! 95.31, p ! .11.Model C added the constraint that the residual variance of enjoy-ment was equal across countries to test whether the varianceunexplained by the predictors differed between countries. Thisconstraint did not significantly decrease model fit, $2(10) ! 11.54,p ! .31. Model D added the additional constraint that the interceptof the enjoyment of thinking was equal across countries to testwhether the inclusion of individual-difference measures reducedthe difference in enjoyment between countries to nonsignificance.This constraint did not significantly decrease model fit, $2(10) !16.53 p ! .09. Model E adjusted Model D to remove threemeasures (locomotion, life satisfaction, and conscientiousness)that had 95% CIs for regression coefficients predicting enjoymentthat overlapped zero. As this is a model-determined choice, p
2 We also analyzed differences by site, allowing the two collection sitesin Turkey to differ from each other. Because the conclusions do notchange, we report the two Turkish sites collapsed together.
Figure 1. Enjoyment by country and condition. See the online article for the color version of this figure.
values are not interpretable, but nevertheless, the value of thechi-square test indicates a negligible loss of model fit, $2(3) !1.12 (p ! .77).
In order to understand whether the cumulative impact of eachstep led to an overall decrease in model fit from the initial ModelA to the final Model E, even if no single step was significant, wedirectly compared the starting Model A with the final Model E andfound that the sum total of constraints did not significantly de-crease model fit, $2(103) ! 124.49, p ! .07. Table 4 providesmodel comparison and statistics, and Figure 2 provides path dia-grams. In other words, even with its additional constraints, ModelE fit the data as well as the previous models did, suggesting that itis the best description of the data.
The bottom line is that five of the individual-difference vari-ables (need for cognition, reported phone usage, openness toexperience, meditation experience, and initial positive affect) eachpredicted the enjoyment of thinking for pleasure, but this relation-ship did not vary by country. The reason there were variations bycountry in the enjoyment of thinking was largely because the meanlevels of these individual-difference variables differed by country(see Table 2). Once these variations were accounted for, there wereno remaining country-level differences in the enjoyment of think-ing for pleasure, as Model E was statistically indistinguishablefrom initial Model A. In short, the five individual-differencevariables shown in Table 5 fully accounted for any country-leveldifferences in enjoyment of thinking for pleasure.
Country-level variables. Next, we examined whether any ofthe country-level variables predicted the enjoyment of thinking forpleasure by constructing a multilevel model with random inter-cepts for country, regressing enjoyment in the thinking conditionon the seven country-level measures listed in Table 2. Collectively,the seven predictor variables explained 6.8% of the total variancein the enjoyment of thinking (3.2% without taking country-leveldifferences into account; Nakagawa & Schielzeth, 2013). Zero-order correlations, Holm-corrected for multiple tests, showed thatthree of the predictors were weakly correlated with the enjoymentof thinking: population density, r(1272) ! % .11, 95% CI[% .17, % .06], GDP, r(1272) ! % .13, 95% CI [% .18, % .07], andmasculinity, r(1272) ! % .14, 95% CI [% .19, % .08]. Thus, theresults show that residents of countries with lower population
densities and lower GDPs, and that were lower in masculinity(competitiveness), enjoyed thinking for pleasure somewhat more.
Discussion
As we predicted, Wilson et al.’s (2014) finding that participantsenjoyed doing an external activity more than they enjoyed thinkingfor pleasure proved to be quite robust, replicating in all 11 of thecountries studied. The average effect size was quite large, thoughsmaller than in the original study (d ! .98 vs. 1.83). The unifor-mity of this finding among the participants and countries sampledhere suggests that, across a wide variety of cultures, turning one’sattention inward to focus on enjoyable topics in the absence of anyexternal cues is far less enjoyable than engaging in everydayactivities such as reading or watching a video.
One reason for this is that thinking for pleasure is difficult. Asnoted by Westgate et al. (2017), to think for pleasure, one mustchoose topics to think about, maintain attention to those topics, andkeep competing thoughts outside of awareness, all of which maytax mental resources (Wegner, 1994). Consistent with this view,participants in the thinking condition of the present study reportedthat it was somewhat difficult to concentrate on their thoughts(M ! 5.18 on a 9-point scale), and the more difficulty theyreported, the less they enjoyed thinking, r(1271) ! % .36, p ".001. Notably, this correlation did not differ between countries,Q(10) ! 3.20, p ! .98. One implication of these findings is thatpeople might enjoy thinking for pleasure more if it were madeeasier, and indeed, as noted earlier, Westgate et al. found thatgiving people a simple thinking aid—a reminder of topics they hadsaid they would enjoy thinking about—significantly increasedtheir enjoyment of thinking.
An additional purpose of the present study was to explorecultural differences in the extent to which people enjoy thinkingfor pleasure, and some country-level differences emerged. Thesedifferences, however, were fully explained by international varia-tions in five individual differences, and once country-level differ-ences in those variables were taken into account, the country-leveldifferences themselves were no longer significant. Participantswere more likely to enjoy their thoughts to the extent that theypracticed meditation, were high in the need for cognition, high in
Table 4Model Comparison from SEM Models
• • • Model A Model B Model C Model D Model E Model E vs. Model A
Note. • • •.a These two p values are for informational purposes only since the step from Model D to Model E was not aplanned comparison, but was made after noting that confidence intervals for three parameters in Model D crossedzero.
openness to experience, reported a low level of phone usage, andwere in a positive mood. What might explain these relationships?
The correlation of the enjoyment of thinking with meditation isconsistent with the idea that cultural practices and norms influencethe amount of experience people have spending time alone withtheir thoughts, and that those with greater experience enjoy think-ing more (e.g., H. Smith, 1991; Tsai et al., 2006; Tsai, Knutson, etal., 2007; Tsai, Miao, et al., 2007; Yoshioka et al., 2002). Thecorrelation of the enjoyment of thinking with need for cognition isconsistent with the idea that thinking for pleasure is effortful andthus is more enjoyable for those who typically find thinking to be
an attractive activity (e.g., Westgate et al., 2017; Wilson et al.,2018a). The correlation of the enjoyment of thinking with open-ness to experience suggests that those who value creativity andnew experiences are more motivated to think for pleasure (or moreskilled at it). Alahmadi et al. (2017) found that motivating peopleto think for pleasure increases their enjoyment considerably, and itis possible that such motivation is associated with openness toexperience. The fact that people who were in positive moodsenjoyed thinking more is consistent with research that those in apositive mood are likely to find it easier to recruit and think aboutpositive topics (Matt, Vázquez, & Campbell, 1992).
We also found that the five key individual-difference vari-ables varied by culture, which fully explained why residents ofsome countries enjoyed thinking more than others. For exam-ple, Japanese participants enjoyed thinking the least, perhapsbecause they were the lowest in openness to experience andneed for cognition, among the lowest in initial positive affectand in experience with meditation (surprisingly), and among thehighest in reported phone use. In contrast, American partici-pants were in the middle of the pack in the enjoyment ofthinking, probably because they were also in the middle of thepack on most of the important predictor variables (e.g., open-
Figure 2. Path diagrams for SEM models. NfC ! need for cognition; IPA ! initial positive affect; OtE !openness to experience; ME ! experience with meditation; PU ! phone usage; Loc ! locomotion; SWLS !Satisfaction with Life; Conc ! conscientiousness; EoT ! enjoyment of thinking.
Table 5Regression Coefficients of Individual Difference MeasuresPredicting Enjoyment of thinking, SEM Model E
Predictor Coefficient 95% confidence interval
Need for cognition .35 [.24, .46]Initial positive affect .21 [.11, .32]Openness to experience .20 [.09, .31]Meditation experience .11 [.003, .22]Phone use % .14 [% .25, % .04]
ness to experience, experience with meditation, initial positiveaffect). These findings suggest that to understand cultural vari-ations in the enjoyment of thinking for pleasure, it is best toexamine cultural differences in the individual practices andpersonality variables that are associated with it.
We additionally found evidence that three country-level vari-ables—population density, GDP, and “masculinity” (aka cultural lev-els of interpersonal competitiveness)—weakly predicted individuals’enjoyment of thinking. One possible (speculative) explanation forthese findings is that people who grew up in a more rural area or ina poorer country may have had less opportunity to distract themselveswith external entertainments and more practice thinking for pleasure.Alternately, the experience of living in densely populated cities maylead to residents feeling that their lives are less meaningful and moreoverloaded (Buttrick, Heintzelman, Weser, & Oishi, 2018; Milgram,1970), potentially demotivating them from making the effort to turninward. In addition, cultures that stress masculinity and competitive-ness may be more likely to view thinking for pleasure as a waste oftime. It should be noted, though, that even in the countries with thelowest population densities (e.g., Brazil and the United States) and thelowest GDPs (e.g., Serbia, Costa Rica), participants enjoyed thinkingless than doing.
The present study naturally has some limitations. First, as in Wilsonet al. (2014) Study 8, all participants were college students, thuslimiting the generalizability of the results. However, whereas collegestudents may be an unusual population in some regards (e.g., Henrichet al., 2010), studies show that nonstudents also have difficulty think-ing for pleasure (Westgate et al., 2017; Wilson et al., 2014, Study 9).Second, although our sample of countries represents a wide variety ofcultures, we did not sample the entirety of the world’s population, andit is possible that enjoyment of thinking for pleasure differs in someof the cultures that we did not sample.
Third, for practical reasons, we used shortened versions of mostof the individual-difference measures, which resulted in reducedreliability. For example, we used Gosling et al.’s (2003) 10-itemmeasure of the Big Five personality traits, which had low alphas,particularly for agreeableness. In this regard, it is interesting tocompare the cultural differences in Big Five traits that we obtainedwith those obtained by Schmitt et al. (2007), who used Benet-Martinez and John’s (1998) 44-item measure. The correlationsbetween mean levels of openness to experience, conscientiousness,emotional stability, extraversion, and agreeableness, in the ninecountries included in both our study and theirs, were, respectively,r(8) ! .92, .90, .62, .49, and .30. This increases our confidence inthe reliability of our results for some traits (particularly opennessto experience and conscientiousness) but decreases it for others(e.g., agreeableness).
In sum, the preference for doing external activities such as reading,watching TV, or surfing the Internet rather than “just thinking”appears to be strong throughout the world. The magnitude of thispreference is systematically related to several individual differencesthat characterize the residents of some countries more than others.These findings raise the question of whether there are conditionsunder which people throughout the world might enjoy thinking moreand whether there would be value in doing so. Progress is being madeon these fronts; as mentioned, Westgate et al. (2017) found that peopleenjoy thinking more when cognitive load is reduced by giving thema simple thinking aid, and studies have found other benefits to think-
ing for pleasure, namely a sense of personal meaningfulness (Alah-madi et al., 2017; Raza et al., 2018).
The fact that thinking for pleasure can be made easier is interestingin light of the present finding that reported cell phone usage wasnegatively associated enjoying one’s thoughts. Although much hasbeen written about the increasing reliance on electronic devices andthe possible negative consequences of “device obsession” (e.g., Carr,2011; Kushlev & Dunn, 2015; Powers, 2010), our study is the first tolink device usage to a decrease in the ability to sit alone and enjoyone’s thoughts. The present findings are correlational, of course, sowe do not know whether using cell phones makes it more difficult forpeople to enjoy thinking or whether people who do not enjoy thinkingare especially likely to use cell phones, or whether some third variablecauses both. It is a provocative possibility, though, that the allure ofelectronic devices is preventing people from making an effort to findpleasure in their thoughts.
If so, efforts to encourage people to put away their phones and “justthink” may be of some benefit. For example, in a field study byWilson, Westgate, Buttrick, and Gilbert (2018b), participants whowere randomly assigned to spend spare moments during their daythinking for pleasure (with thinking aids) found this experience to bemore personally meaningful, and as enjoyable, as did participants whowere randomly assigned to spend their spare moments as they nor-mally did (which often involved using electronic devices). Muchmore work needs to be done to determine who values thinking forpleasure and when, but this initial evidence suggests that people mayfind it to be worth the effort if they gave it a try.
References
Adler, N., Singh-Manoux, A., Schwartz, J., Stewart, J., Matthews, K., &Marmot, M. G. (2008). Social status and health: A comparison of Britishcivil servants in Whitehall-II with European- and African-Americans inCARDIA. Social Science & Medicine, 66, 1034–1045. http://dx.doi.org/10.1016/j.socscimed.2007.11.031
Alahmadi, S., Buttrick, N. R., Gilbert, D. T., Hardin, A. M., Westgate,E. C., & Wilson, T. D. (2017). You can do it if you really try: The effectsof motivation on thinking for pleasure. Motivation and Emotion, 41,545–561. http://dx.doi.org/10.1007/s11031-017-9625-7
Benet-Martínez, V., & John, O. P. (1998). Los Cinco Grandes acrosscultures and ethnic groups: Multitrait multimethod analyses of the BigFive in Spanish and English. Journal of Personality and Social Psychol-ogy, 75, 729–750. http://dx.doi.org/10.1037/0022-3514.75.3.729
Bigelsen, J., Lehrfeld, J. M., Jopp, D. S., & Somer, E. (2016). Maladaptivedaydreaming: Evidence for an under-researched mental health disorder.Consciousness and Cognition: An International Journal, 42, 254–266.http://dx.doi.org/10.1016/j.concog.2016.03.017
Buttrick, N. R., Heintzelman, S. J., Weser, V. U., & Oishi, S. (2018,March). Higher population density, lower individual meaning in life.Poster presented at the 2018 Meeting of the Society for Personality andSocial Psychology, Atlanta, GA.
Cacioppo, J. T., & Petty, R. E. (1982). The need for cognition. Journal ofPersonality and Social Psychology, 42, 116–131. http://dx.doi.org/10.1037/0022-3514.42.1.116
Canton, N. (2012). Cell phone culture: How cultural differences affectmobile phone use. Retrieved from https://www.cnn.com/2012/09/27/tech/mobile-culture-usage/index.html
Carr, N. (2011). The shallows: What the internet is doing to our brains.New York, NY: W. W. Norton.
Diener, E., Emmons, R. A., Larsen, R. J., & Griffin, S. (1985). Thesatisfaction with life scale. Journal of Personality Assessment, 49, 71–75. http://dx.doi.org/10.1207/s15327752jpa4901_13
Feldt, L. S., Woodruff, D. J., & Salih, F. A. (1987). Statistical inference forcoefficient alpha. Applied Psychological Measurement, 11, 93–103.http://dx.doi.org/10.1177/014662168701100107
Fiske, S. T. (1992). Thinking is for doing: Portraits of social cognition fromdaguerreotype to laserphoto. Journal of Personality and Social Psychol-ogy, 63, 877–889. http://dx.doi.org/10.1037/0022-3514.63.6.877
Fulmer, C. A., Gelfand, M. J., Kruglanski, A. W., Kim-Prieto, C., Diener,E., Pierro, A., & Higgins, E. T. (2010). On “feeling right” in culturalcontexts: How person-culture match affects self-esteem and subjectivewell-being. Psychological Science, 21, 1563–1569. http://dx.doi.org/10.1177/0956797610384742
Gershuny, J., & Fisher, K. (2013). Multinational time use study. Centre forTime Use Research, University of Oxford. Retrieved from https://www.timeuse.org/mtus
Gosling, S. D., Rentfrow, P. J., & Swann, W. B., Jr. (2003). A very briefmeasure of the Big Five personality domains. Journal of Research inPersonality, 37, 504 –528. http://dx.doi.org/10.1016/S0092-6566(03)00046-1
Henrich, J., Heine, S. J., & Norenzayan, A. (2010). Most people are notWEIRD. Nature, 466, 29. http://dx.doi.org/10.1038/466029a
Hofstede, G., Hofstede, G. J., & Minkov, M. (2010). Cultures and orga-nizations: Software of the mind. (3rd ed.). New York, NY: McGraw-Hill.
Hoge, D. R. (1972). A validated Intrinsic Religious Motivation Scale.Journal for the Scientific Study of Religion, 11, 369–376. http://dx.doi.org/10.2307/1384677
Hsee, C. K., Yang, A. X., & Wang, L. (2010). Idleness aversion and theneed for justifiable busyness. Psychological Science, 21, 926–930.http://dx.doi.org/10.1177/0956797610374738
James, W. (1890). The principles of psychology. New York, NY: Holt.Kasser, T., & Sheldon, K. M. (2009). Time affluence as a path toward
personal happiness and ethical business practice: Empirical evidencefrom four studies. Journal of Business Ethics, 84, 243–255. http://dx.doi.org/10.1007/s10551-008-9696-1
Kruglanski, A. W., Thompson, E. P., Higgins, E. T., Atash, M. N., Pierro,A., Shah, J. Y., & Spiegel, S. (2000). To “do the right thing” or to “justdo it”: Locomotion and assessment as distinct self-regulatory impera-tives. Journal of Personality and Social Psychology, 79, 793–815.http://dx.doi.org/10.1037/0022-3514.79.5.793
Kushlev, K., & Dunn, E. W. (2015). Checking email less frequentlyreduces stress. Computers in Human Behavior, 43, 220–228. http://dx.doi.org/10.1016/j.chb.2014.11.005
Levine, R. V., & Norenzayan, A. (1999). The pace of life in 31 countries.Journal of Cross-Cultural Psychology, 30, 178–205. http://dx.doi.org/10.1177/0022022199030002003
Matt, G. E., Vázquez, C., & Campbell, W. K. (1992). Mood-congruentrecall of affectively toned stimuli: A meta-analytic review. ClinicalPsychology Review, 12, 227–255. http://dx.doi.org/10.1016/0272-7358(92)90116-P
Milgram, S. (1970). The experience of living in cities. Science, 167,1461–1468. http://dx.doi.org/10.1126/science.167.3924.1461
Nakagawa, S., & Schielzeth, H. (2013). A general and simple method forobtaining R2 from generalized linear mixed-effects models. Methods inEcology and Evolution, 4, 133–142. http://dx.doi.org/10.1111/j.2041-210x.2012.00261.x
Neale, M. C., Hunter, M. D., Pritikin, J. N., Zahery, M., Brick, T. R.,Kirkpatrick, R. M., . . . Boker, S. M. (2016). OpenMx 2.0: Extendedstructural equation and statistical modeling. Psychometrika, 81, 535–549. http://dx.doi.org/10.1007/s11336-014-9435-8
Pennebaker, J. W., Boyd, R. L., Jordan, K., & Blackburn, K. (2015). Thedevelopment and psychometric properties of LIWC2015. Austin, TX:University of Texas at Austin.
Powers, W. (2010). Hamlet’s blackberry: Building a good life in the digitalage. New York, NY: Harper.
Raza, S., Buttrick, N. R., Wilson, T. D., Westgate, E. C., Heintzelman,S. J., & Gilbert, D. T. (2018). Thinking for pleasure and personalmeaningfulness. Unpublished raw data, Department of ●●●, Universityof Virginia, ●●●.
Schmitt, D. P., Allik, J., McCrae, R. R., Benet-Martinez, V., & Zupanèiè,A. (2007). The geographic distribution of Big Five personality traits:Patterns and profiles of human self-description across 56 nations. Jour-nal of Cross-Cultural Psychology, 38, 173–212. http://dx.doi.org/10.1177/0022022106297299
Smith, E. N., & Frank, M. C. (2015). Replication of “Just think: Thechallenges of the disengaged mind; Study 8” by Wilson et al. (2014,Science). Unpublished manuscript, Department of ●●●, Stanford Uni-versity, ●●●.
Smith, H. (1991). The world’s religions. New York, NY: Harper Collins.Somer, E. (2002). Maladaptive daydreaming: A qualitative inquiry. Jour-
nal of Contemporary Psychotherapy, 32, 197–212. http://dx.doi.org/10.1023/A:1020597026919
Tsai, J. L., Knutson, B., & Fung, H. H. (2006). Cultural variation in affectvaluation. Journal of Personality and Social Psychology, 90, 288–307.http://dx.doi.org/10.1037/0022-3514.90.2.288
Tsai, J. L., Knutson, B., & Rothman, A. (2007). The pursuit of ideal affect:Variation in mood-producing behavior. Unpublished manuscript, De-partment of ●●●, Stanford University, ●●●.
Tsai, J. L., Miao, F. F., & Seppala, E. (2007). Good feelings in Christianityand Buddhism: Religious differences in ideal affect. Personality andSocial Psychology Bulletin, 33, 409–421. http://dx.doi.org/10.1177/0146167206296107
Wegner, D. M. (1994). Ironic processes of mental control. PsychologicalReview, 101, 34–52. http://dx.doi.org/10.1037/0033-295X.101.1.34
Westgate, E. C., Wilson, T. D., & Gilbert, D. T. (2017). With a little helpfor our thoughts: Making it easier to think for pleasure. Emotion, 15,828–839. http://dx.doi.org/10.1037/emo0000278
Wilcox, K., Laran, J., Stephen, A. T., & Zubcsek, P. P. (2016). How beingbusy can increase motivation and reduce task completion time. Journalof Personality and Social Psychology, 110, 371–384. http://dx.doi.org/10.1037/pspa0000045
Wilson, T. D., Reinhard, D. A., Westgate, E. C., Gilbert, D. T., Ellerbeck,N., Hahn, C., . . . Shaked, A. (2014). Just think: The challenges of thedisengaged mind. Science, 345, 75–77. http://dx.doi.org/10.1126/science.1250830
Wilson, T. D., Westgate, E. C., Buttrick, N. R., & Gilbert, D. T. (2018a).Thinking for pleasure. Unpublished raw data, Department of ●●●, Uni-versity of Virginia, ●●●.
Wilson, T. D., Westgate, E. C., Buttrick, N. R., & Gilbert, D. T. (2018b).Taking a thinking break: Pros and cons of thinking during spare mo-ments. Manuscript under review.
World Bank. (2014). World development indicators. Retrieved from http://data.worldbank.org/data-catalog/world-development-indicators
Yoshioka, C. F., Nilson, R., & Simpson, S. (2002). A cross-cultural studyof desired psychological benefits to leisure of American, Canadian,Japanese and Taiwanese college students. LARNet: The Cyber Journal ofApplied Leisure and Recreation Research, 1–11. Retrieved from http://larnet.org/2002-4.html
Received October 3, 2017Revision received March 9, 2018