CROWD-SOURCED PRICE DATA COLLECTION THROUGH MOBILE PHONES New Techniques and Technologies for Statistics NTTS 2013 NADA HAMADEH, Senior Statistician MARKO RISSANEN, Consultant MIZUKI YAMANAKA, Consultant
Transcript
CROWD-SOURCED PRICE DATA COLLECTION THROUGH MOBILE
PHONES
New Techniques and Technologies for Statistics
NTTS 2013
NADA HAMADEH, Senior Statistician MARKO RISSANEN, Consultant
MIZUKI YAMANAKA, Consultant
INTRODUCTION
if there would be a new way to collect price data that is
Cost-efficient and timely
Enables high item and geographical coverage
Comparable across countries
Open to users
The World Bank Pilot Study for Crowd-Sourced Price Data Collection through Mobile Phones combines the need for high-frequency data, the recent developments in the ICT sector,
and the power of the crowd in an innovative way.
IMAGINE
ICT Development
Over 6 BILLION mobile subscriptions worldwide – 75 % of the world population
now has ACCESS to a MOBILE PHONE
…is making crowd-
sourcing possible
PROJECT DESIGN
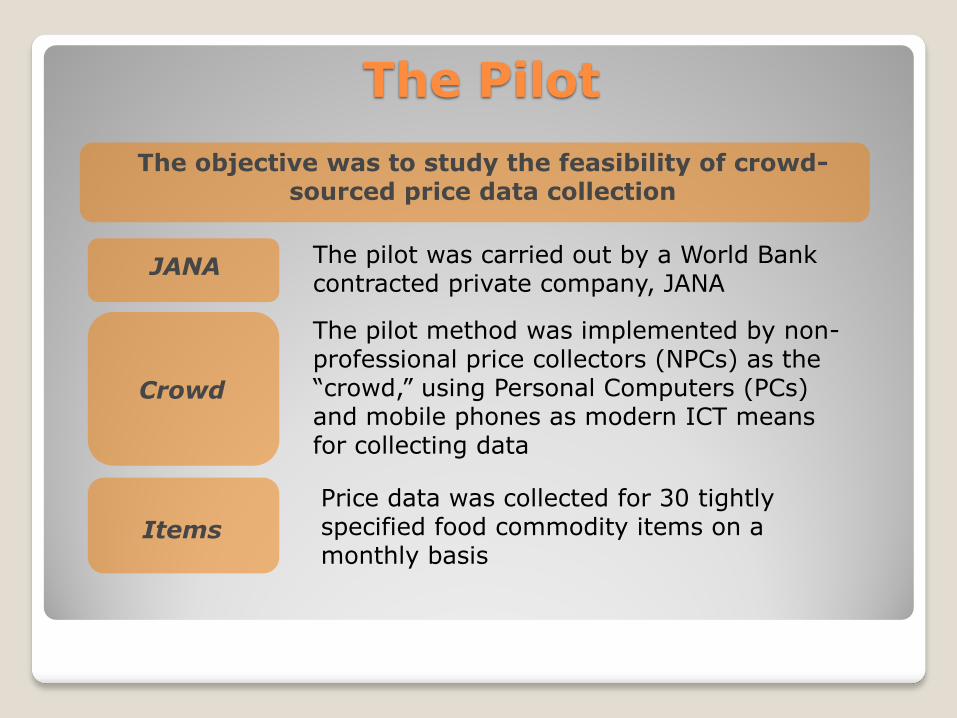
The Pilot
The objective was to study the feasibility of crowd-sourced price data collection
JANA
Crowd
The pilot method was implemented by non-professional price collectors (NPCs) as the “crowd,” using Personal Computers (PCs) and mobile phones as modern ICT means for collecting data
The pilot was carried out by a World Bank contracted private company, JANA
Price data was collected for 30 tightly specified food commodity items on a monthly basis
Items
Country Coverage
Country # of
Survey Locations
# of Supermarkets
Language Status Months covered
Bangladesh 47 1,282 English implemented Jan'12 - May'12
Brazil 13 41 Portuguese implemented Jan'12 - May'12
China - - n/a not implemented
Egypt - - English stopped Aug'11 - Sep'11
India 33 405 English implemented Aug'11 - May'12
Indonesia 41 237 Indonesian implemented Sep'11 - May'12
Kenya 41 1,447 English implemented Sep'11 - May'12
Nigeria 35 1,023 English implemented Sep'11 - May'12
Pakistan 49 516 English implemented Dec'11 - May'12
Philippines 38 212 English implemented Dec'11 - May'12
Uganda - - English stopped Oct'11 - Nov'11
Total 297 5,163
In summary, the survey process gathered data successfully for at least six months in India, Kenya and Nigeria, and for at least four months in
Bangladesh, Indonesia, Philippines, Pakistan and, to a lesser degree, in Brazil
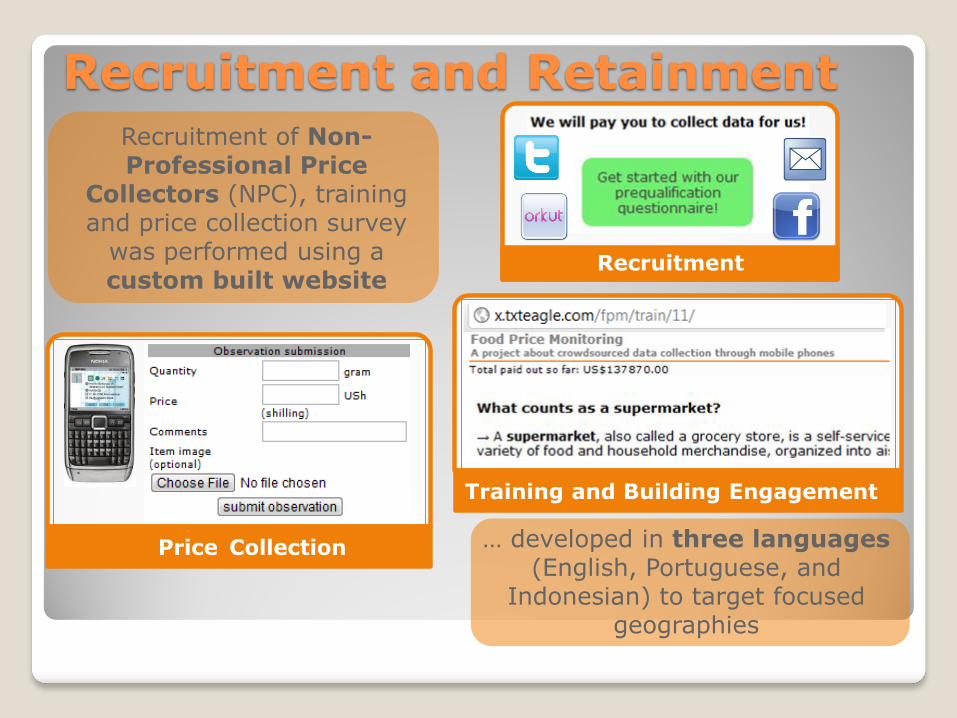
Recruitment and Retainment Recruitment of Non-Professional Price
Collectors (NPC), training and price collection survey
was performed using a custom built website
Recruitment
Training and Building Engagement
Price Collection … developed in three languages (English, Portuguese, and
Indonesian) to target focused geographies
Compensation Unique feature of the pilot was payment by airtime using
JANA’s international network of mobile operators
The data collection method benefits NPCs in low and middle income countries
PLI is defined as the ratio of the Purchasing Power Parities (PPPs), which is price relatives between countries, to the exchange rate and is expressed as a percentage.
Comparison of PLIs
147
124 100 97 97
122 112 100 104
82
0
50
100
150
200
Philippines Indonesia Bangladesh Pakistan India
Pilot ADB
Relationship of price levels is similar to official statistics released by the Asian Development Bank (ADB) for 2009
For the pilot, the PLI is for all 30 food items, based on the data for the 7 pilot countries. For the ADB study, the PLI is for Food and Non-Alcoholic
Beverages, based on the data for the 21 participating countries in the Asia comparison. Both figures are recalculated to make Bangladesh as the base
(Bangladesh PLI = 100).
CHALLENGES, SUCCESSES AND LESSONS LEARNED
Challenges
Local laws pertaining to the use of the Internet, mobile phones, data collection and photography can cause problems
Cultural and language barriers can significantly impact the success of the data collection process
Legal Cultural
Language
Building Trust
A sense of trust had to be achieved to ensure utmost data quality while balancing with fraudulent identification measures
Incentive level
The incentive level and structure affected the recruitment and retainment of NPCs; high income countries may need more incentive
Challenges
Survey Coverage
The purpose of this pilot was to check what kind of penetration and survey coverage can be achieved
In the future, a survey framework needs to be established at the beginning of the project
Working with a huge dataset of microdata that results from such a project can be challenging
This requires database and validation systems to be put in place, in order to ensure robustness of the data validation process
One way to ensure the quality is having data collectors and data users validate the data
Managing and
Analyzing Big Data
Successes
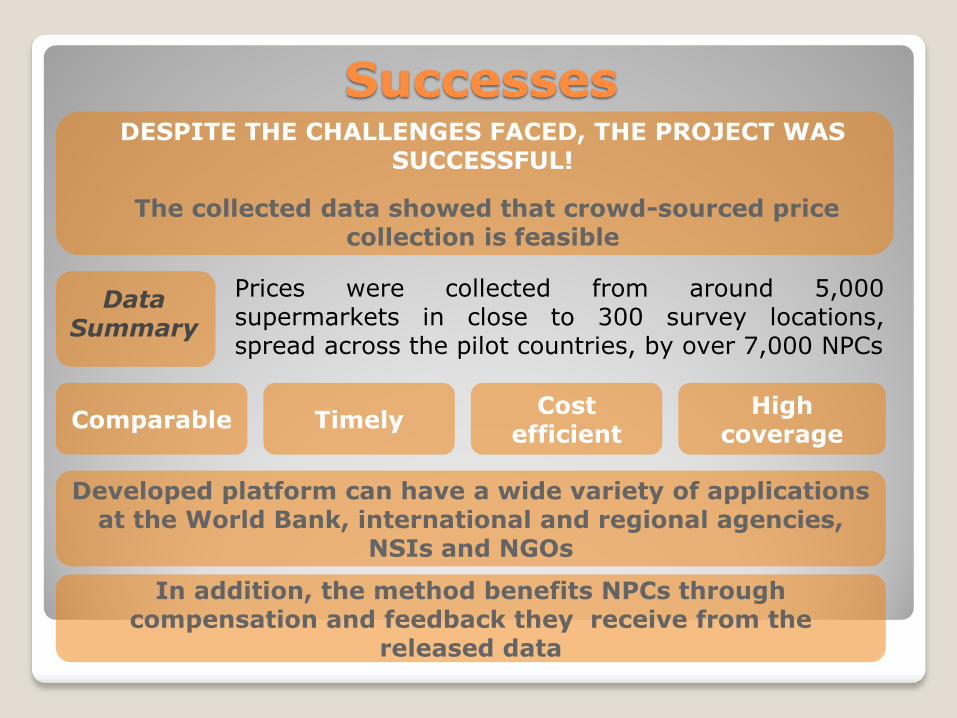
Prices were collected from around 5,000 supermarkets in close to 300 survey locations, spread across the pilot countries, by over 7,000 NPCs
DESPITE THE CHALLENGES FACED, THE PROJECT WAS SUCCESSFUL!
The collected data showed that crowd-sourced price collection is feasible
Data Summary
Developed platform can have a wide variety of applications at the World Bank, international and regional agencies,
NSIs and NGOs
Comparable Timely Cost
efficient High
coverage
In addition, the method benefits NPCs through compensation and feedback they receive from the