32
Capital Markets | Hotels Offering Memorandum Crowne Plaza San Francisco International Airport BURLINGAME, CALIFORNIA

Capital Markets | Hotels Offering Memorandum
Crowne Plaza San Francisco International Airport
BURLINGAME, CALIFORNIA

Affiliated Business Disclosure And Confidentiality Agreement
CB Richard Ellis, Inc. operates within a global family of companies with many subsidiaries and/or related entities (each an “Affiliate”) engaging in a broad range of commercial real estate businesses including, but not limited to, brokerage services, property and facilities management, valuation, investment fund management and development. At times different Affiliates may represent various clients with competing interests in the same transaction. For example, this Memorandum may be received by our Affiliates, including CB Richard Ellis Investors, Inc. or Trammell Crow Company. Those, or other, Affiliates may express an interest in the property described in this Memorandum (the “Property”) may submit an offer to purchase the Property and may be the successful bidder for the Property. You hereby acknowledge that possibility and agree that neither CB Richard Ellis, Inc. nor any involved Affiliate will have any obligation to disclose to you the involvement of any Affiliate in the sale or purchase of the Property. In all instances, however, CB Richard Ellis, Inc. will act in the best interest of the client(s) it represents in the transaction described in this Memorandum and will not act in concert with or otherwise conduct its business in a way that benefits any Affiliate to the detriment of any other offeror or prospective offeror, but rather will conduct its business in a manner consistent with the law and any fiduciary duties owed to the client(s) it represents in the transaction described in this Memorandum.
This is a confidential Memorandum intended solely for your limited use and benefit in determining whether you desire to express further interest in the acquisition of the Property.
This Memorandum contains selected information pertaining to the Property and does not purport to be a representation of the state of affairs of the Property or the owner of the Property (the “Owner”), to be all-inclusive or to contain all or part of the information which prospective investors may require to evaluate a purchase of real property. All financial projections and information are provided for general reference purposes only and are based on assumptions relating to the general economy, market conditions, competition and other factors beyond the control of the Owner and CB Richard Ellis, Inc. Therefore, all projections, assumptions and other information provided and made herein are subject to material variation. All references to acreages, square footages, and other measurements are approximations. Additional information and an opportunity to inspect the Property will be made available to interested and qualified prospective purchasers. In this Memorandum, certain documents, including leases and other materials, are described in summary form.
These summaries do not purport to be complete nor necessarily accurate descriptions of the full agreements referenced. Interested parties are expected to review all such summaries and other documents of whatever nature independently and not rely on the contents of this Memorandum in any manner.
Neither the Owner or CB Richard Ellis, Inc, nor any of their respective directors, officers, Affiliates or representatives make any representation or warranty, expressed or implied, as to the accuracy or completeness
of this Memorandum or any of its contents, and no legal commitment or obligation shall arise by reason of your receipt of this Memorandum or use of its contents; and you are to rely solely on your investigations and inspections of the Property in evaluating a possible purchase of the real property.
The Owner expressly reserved the right, at its sole discretion, to reject any or all expressions of interest or offers to purchase the Property, and/or to terminate discussions with any entity at any time with or without notice which may arise as a result of review of this Memorandum. The Owner shall have no legal commitment or obligation to any entity reviewing this Memorandum or making an offer to purchase the Property unless and until written agreement(s) for the purchase of the Property have been fully executed, delivered and approved by the Owner and any conditions to the Owner’s obligations therein have been satisfied or waived.
By receipt of this Memorandum, you agree that this Memorandum and its contents are of a confident nature, that you will hold and treat it in the strictest confidence and that you will not disclose this Memorandum or any of its contents to any other entity without the prior written authorization of the Owner or CB Richard Ellis, Inc. You also agree that you will not use this Memorandum or any of its contents in any manner detrimental to the interest of the Owner or CB Richard Ellis, Inc. If after reviewing this Memorandum, you have no further interest in purchasing the Property, kindly return this Memorandum to CB Richard Ellis, Inc.
© 2011 CB Richard Ellis, Inc. This information has been obtained from sources believed reliable. We have not verified it and make no guarantee, warranty or representation about it. Any projections, opinions, assumptions or estimates used are for example only and do not represent the current or future performance of the property. You and your advisors should conduct a careful, independent investigation of the property to determine to your satisfaction the suitability of the property for your needs. 07/11 PMC0002397.
Crowne Plaza San Francisco International Airport BURLINGAME, CALIFORNIA
Henry E. Bose, JrSenior Vice PresidentCalifornia Lic. [email protected]
Mark H. McDermottSenior Vice PresidentCalifornia Lic. [email protected]
Investment Contacts
Section One EXECUTIVE SUMMARY
Section TwoPROPERTY DESCRIPTION
Section Three AREA OVERVIEW
Section FourLODGING MARKET OVERVIEW
Section FiveFINANCIAL PERFORMANCE
Table of Contents
Crowne Plaza San Francisco International Airport BURLINGAME, CALIFORNIA

Executive Summary
Crowne Plaza San Francisco International Airport BURLINGAME, CALIFORNIA
1Executive Summary
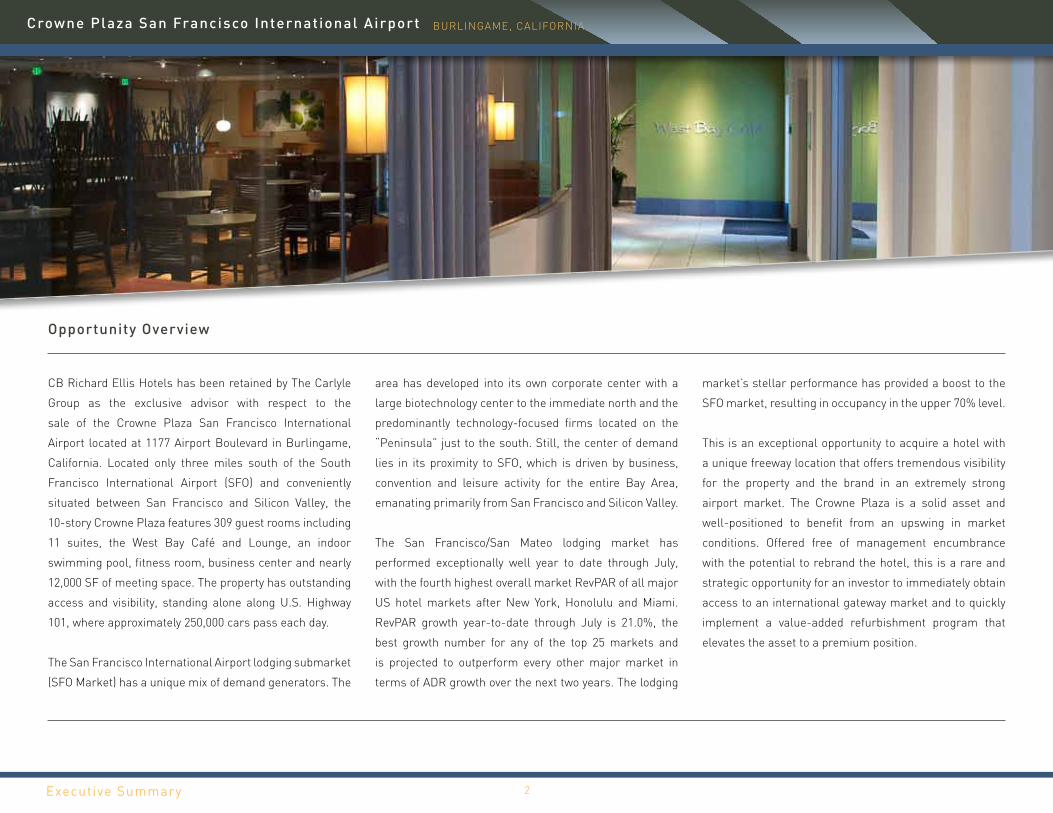
CB Richard Ellis Hotels has been retained by The Carlyle
Group as the exclusive advisor with respect to the
sale of the Crowne Plaza San Francisco International
Airport located at 1177 Airport Boulevard in Burlingame,
California. Located only three miles south of the South
Francisco International Airport (SFO) and conveniently
situated between San Francisco and Silicon Valley, the
10-story Crowne Plaza features 309 guest rooms including
11 suites, the West Bay Café and Lounge, an indoor
swimming pool, fitness room, business center and nearly
12,000 SF of meeting space. The property has outstanding
access and visibility, standing alone along U.S. Highway
101, where approximately 250,000 cars pass each day.
The San Francisco International Airport lodging submarket
(SFO Market) has a unique mix of demand generators. The
area has developed into its own corporate center with a
large biotechnology center to the immediate north and the
predominantly technology-focused firms located on the
“Peninsula” just to the south. Still, the center of demand
lies in its proximity to SFO, which is driven by business,
convention and leisure activity for the entire Bay Area,
emanating primarily from San Francisco and Silicon Valley.
The San Francisco/San Mateo lodging market has
performed exceptionally well year to date through July,
with the fourth highest overall market RevPAR of all major
US hotel markets after New York, Honolulu and Miami.
RevPAR growth year-to-date through July is 21.0%, the
best growth number for any of the top 25 markets and
is projected to outperform every other major market in
terms of ADR growth over the next two years. The lodging
market’s stellar performance has provided a boost to the
SFO market, resulting in occupancy in the upper 70% level.
This is an exceptional opportunity to acquire a hotel with
a unique freeway location that offers tremendous visibility
for the property and the brand in an extremely strong
airport market. The Crowne Plaza is a solid asset and
well-positioned to benefit from an upswing in market
conditions. Offered free of management encumbrance
with the potential to rebrand the hotel, this is a rare and
strategic opportunity for an investor to immediately obtain
access to an international gateway market and to quickly
implement a value-added refurbishment program that
elevates the asset to a premium position.
Opportunity Overview
Crowne Plaza San Francisco International Airport BURLINGAME, CALIFORNIA
2Executive Summary

ROLLINS ROAD
BAYSHORE
FREEWAY
BROADWAY
City of SanFrancisco
San Francisco International Airport
101
N
C r o w n e P l a z a S a n F r a n c i s c o I n t e r n a t i o n a l A i r p o r t B u r l i n g a m e , C a l i f o r n i a
Crowne Plaza San Francisco International
Airport
Crowne Plaza San Francisco International Airport BURLINGAME, CALIFORNIA
3Executive Summary

Address 1177 Airport BoulevardBurlingame, California 94010
Site 4.97-acres
Zoning SL (Shoreline District), Permitted uses in this district include a wide variety of commercial, retail and recreational uses. Hotels with more than 65 rooms are a conditional use.
Property Design 10-story interior corridor tower with two single story wings
Number of Rooms 309, including 11 suites
Year Built 1973
Food and Beverage West Bay Café and Lounge
Meeting Space ± 12,000 SF, including 5,040 SF Plaza Ballroom and 2,640 SF Peninsula Ballroom
Additional Amenities Gift shop, fitness center, business center, indoor swimming pool with whirlpool, room service, barber shop, wireless internet access and courtesy airport shuttles
Parking 337 total parking spaces, allocated among 277 surface and 60 subterranean parking spaces
Management The property is being offered free of any management encumbrances
Franchise The hotel is subject to a Crowne Plaza franchise agreement executed on July 2007 for a term of 10 years. Termination of this agreement results in liquidated damages based on 36 months of calculated fees, as such: (1) 5% royalty fee of gross room revenue, (2) 3% service contribution fee of gross room revenue, (3) monthly technology fee of $11.34 per guest room
Union Local 39 – EngineersLocal 856 – Front Desk, Bell Stand, AccountingLocal 2 Unite Here – Restaurant, Banquets
Crowne Plaza San Francisco International Airport BURLINGAME, CALIFORNIA
4Executive Summary
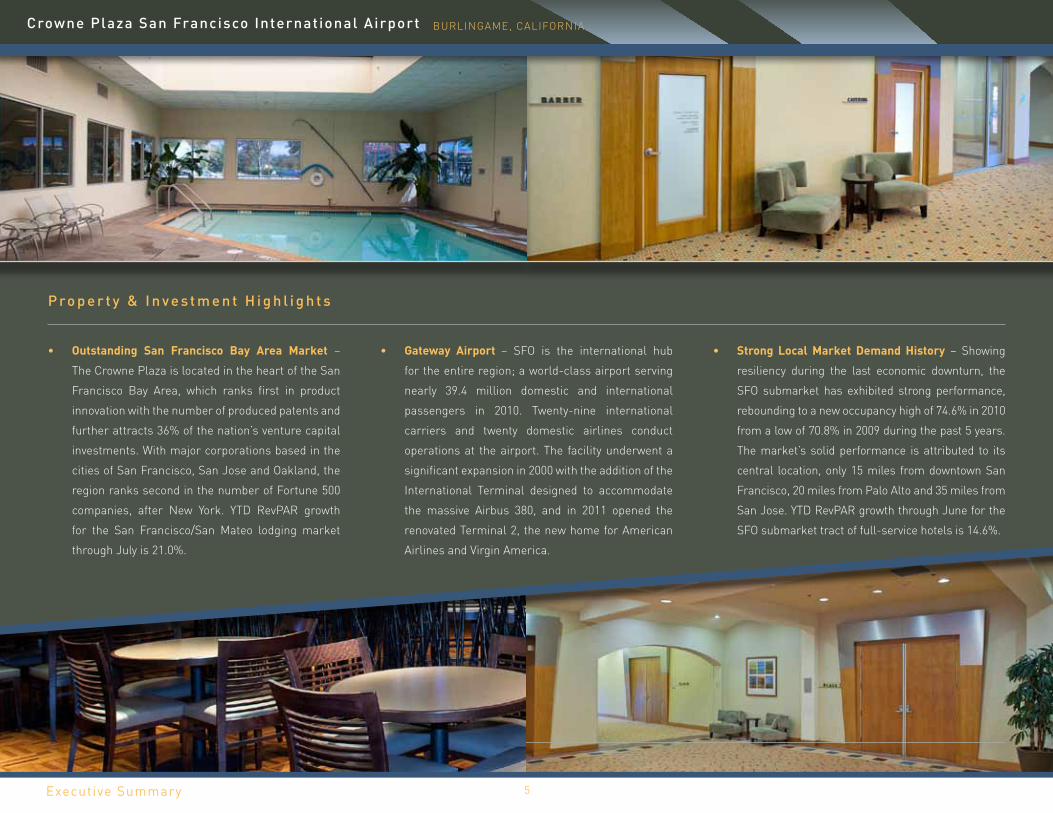
• Outstanding San Francisco Bay Area Market –
The Crowne Plaza is located in the heart of the San
Francisco Bay Area, which ranks first in product
innovation with the number of produced patents and
further attracts 36% of the nation’s venture capital
investments. With major corporations based in the
cities of San Francisco, San Jose and Oakland, the
region ranks second in the number of Fortune 500
companies, after New York. YTD RevPAR growth
for the San Francisco/San Mateo lodging market
through July is 21.0%.
• Gateway Airport – SFO is the international hub
for the entire region; a world-class airport serving
nearly 39.4 million domestic and international
passengers in 2010. Twenty-nine international
carriers and twenty domestic airlines conduct
operations at the airport. The facility underwent a
significant expansion in 2000 with the addition of the
International Terminal designed to accommodate
the massive Airbus 380, and in 2011 opened the
renovated Terminal 2, the new home for American
Airlines and Virgin America.
• Strong Local Market Demand History – Showing
resiliency during the last economic downturn, the
SFO submarket has exhibited strong performance,
rebounding to a new occupancy high of 74.6% in 2010
from a low of 70.8% in 2009 during the past 5 years.
The market’s solid performance is attributed to its
central location, only 15 miles from downtown San
Francisco, 20 miles from Palo Alto and 35 miles from
San Jose. YTD RevPAR growth through June for the
SFO submarket tract of full-service hotels is 14.6%.
P ro p e r t y & I n v e s t m e n t H i g h l i g h t s
Crowne Plaza San Francisco International Airport BURLINGAME, CALIFORNIA
5Executive Summary
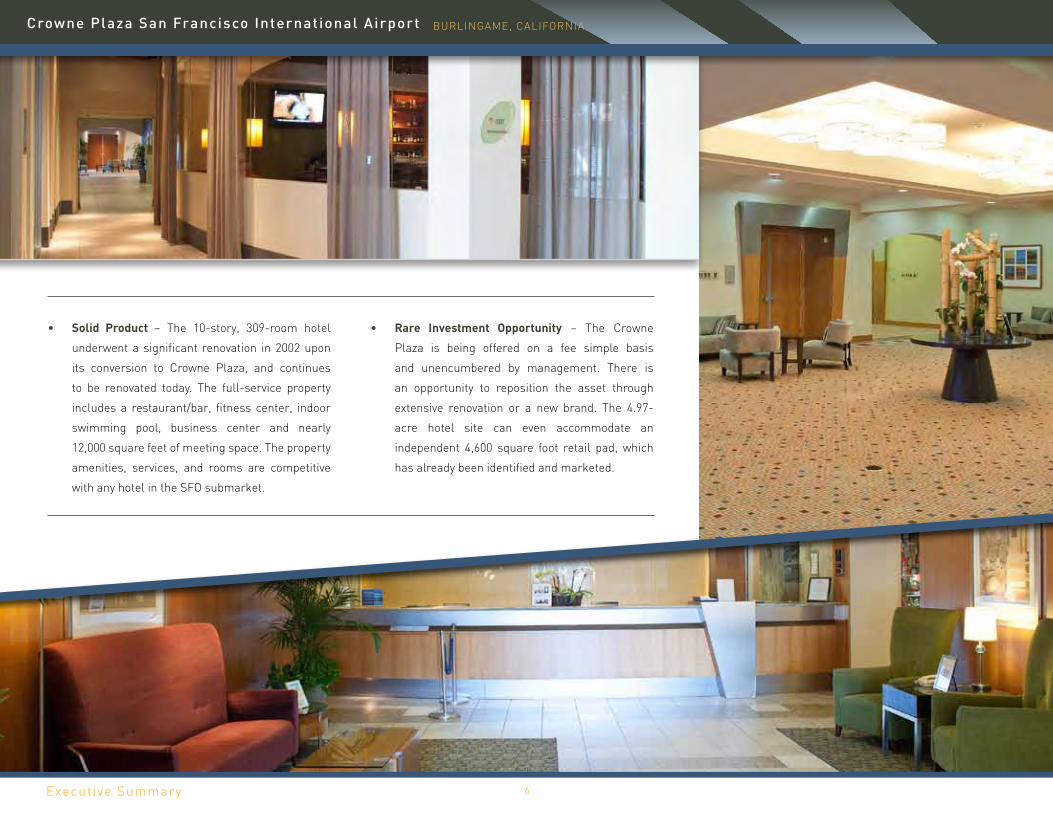
• Solid Product – The 10-story, 309-room hotel
underwent a significant renovation in 2002 upon
its conversion to Crowne Plaza, and continues
to be renovated today. The full-service property
includes a restaurant/bar, fitness center, indoor
swimming pool, business center and nearly
12,000 square feet of meeting space. The property
amenities, services, and rooms are competitive
with any hotel in the SFO submarket.
• Rare Investment Opportunity – The Crowne
Plaza is being offered on a fee simple basis
and unencumbered by management. There is
an opportunity to reposition the asset through
extensive renovation or a new brand. The 4.97-
acre hotel site can even accommodate an
independent 4,600 square foot retail pad, which
has already been identified and marketed.
Crowne Plaza San Francisco International Airport BURLINGAME, CALIFORNIA
6Executive Summary

Property Description
Crowne Plaza San Francisco International Airport BURLINGAME, CALIFORNIA
7Property Description
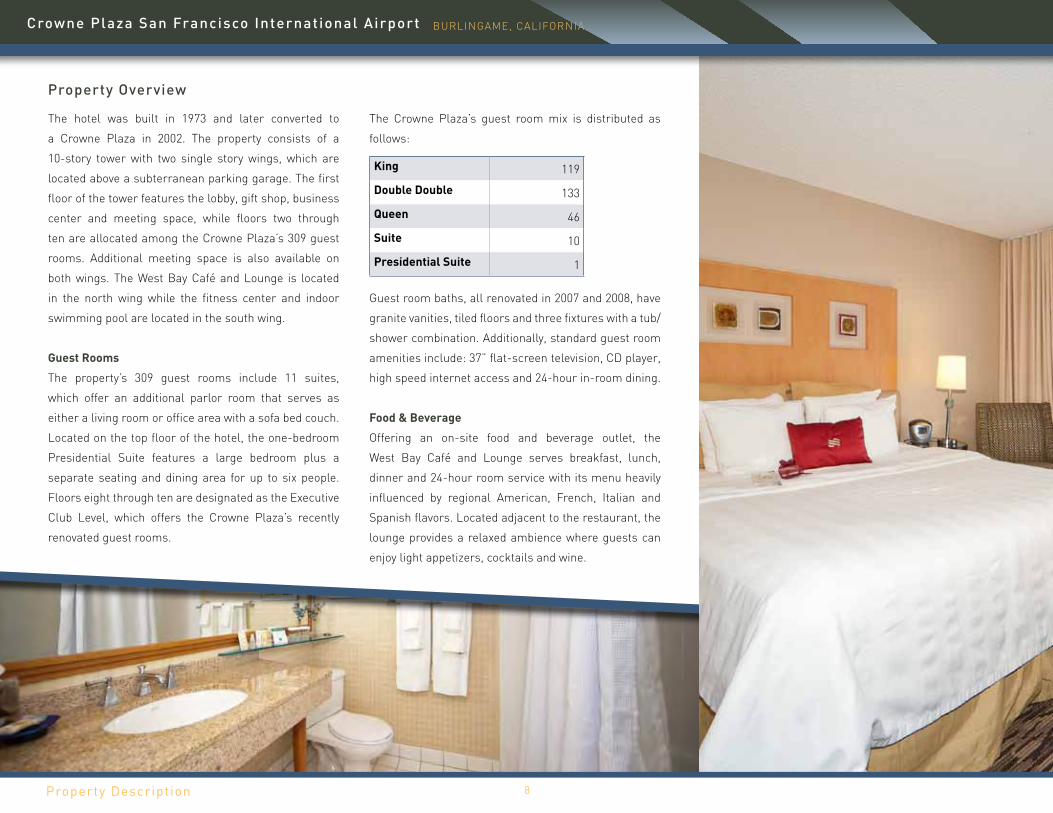
Property Overview
The hotel was built in 1973 and later converted to
a Crowne Plaza in 2002. The property consists of a
10-story tower with two single story wings, which are
located above a subterranean parking garage. The first
floor of the tower features the lobby, gift shop, business
center and meeting space, while floors two through
ten are allocated among the Crowne Plaza’s 309 guest
rooms. Additional meeting space is also available on
both wings. The West Bay Café and Lounge is located
in the north wing while the fitness center and indoor
swimming pool are located in the south wing.
Guest Rooms
The property’s 309 guest rooms include 11 suites,
which offer an additional parlor room that serves as
either a living room or office area with a sofa bed couch.
Located on the top floor of the hotel, the one-bedroom
Presidential Suite features a large bedroom plus a
separate seating and dining area for up to six people.
Floors eight through ten are designated as the Executive
Club Level, which offers the Crowne Plaza’s recently
renovated guest rooms.
The Crowne Plaza’s guest room mix is distributed as
follows:
Guest room baths, all renovated in 2007 and 2008, have
granite vanities, tiled floors and three fixtures with a tub/
shower combination. Additionally, standard guest room
amenities include: 37” flat-screen television, CD player,
high speed internet access and 24-hour in-room dining.
Food & Beverage
Offering an on-site food and beverage outlet, the
West Bay Café and Lounge serves breakfast, lunch,
dinner and 24-hour room service with its menu heavily
influenced by regional American, French, Italian and
Spanish flavors. Located adjacent to the restaurant, the
lounge provides a relaxed ambience where guests can
enjoy light appetizers, cocktails and wine.
King 119
Double Double 133
Queen 46
Suite 10
Presidential Suite 1
Crowne Plaza San Francisco International Airport BURLINGAME, CALIFORNIA
8Property Description
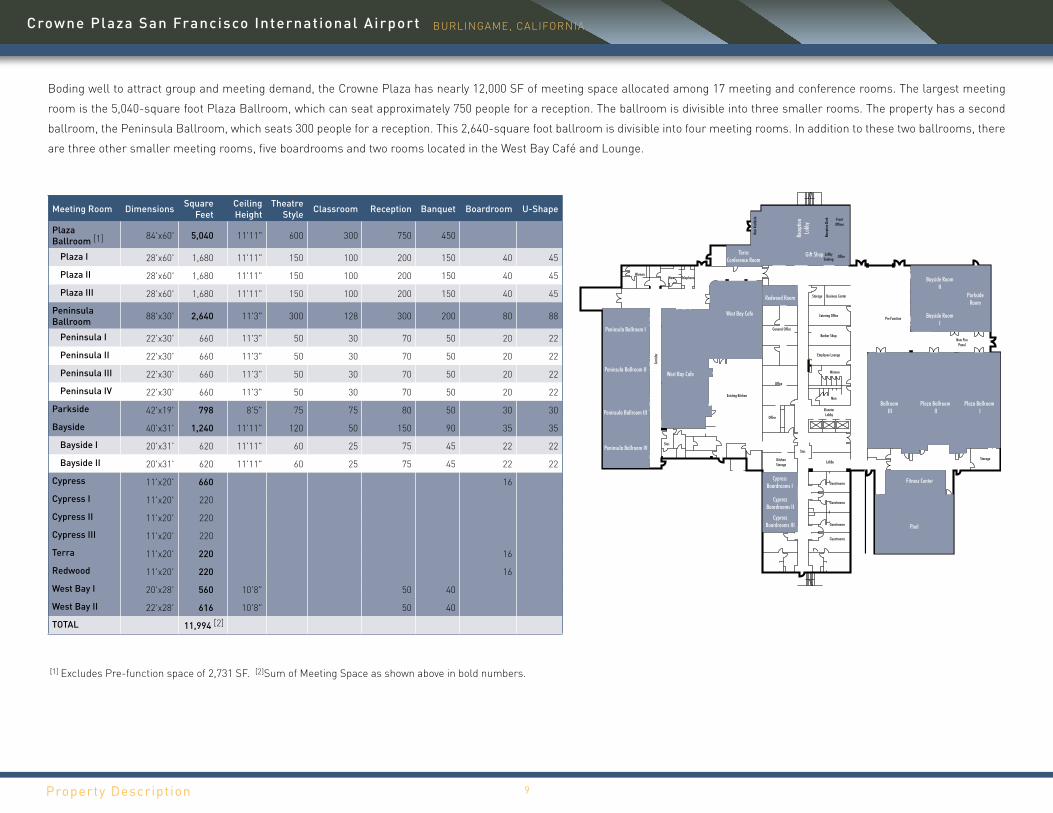
Boding well to attract group and meeting demand, the Crowne Plaza has nearly 12,000 SF of meeting space allocated among 17 meeting and conference rooms. The largest meeting
room is the 5,040-square foot Plaza Ballroom, which can seat approximately 750 people for a reception. The ballroom is divisible into three smaller rooms. The property has a second
ballroom, the Peninsula Ballroom, which seats 300 people for a reception. This 2,640-square foot ballroom is divisible into four meeting rooms. In addition to these two ballrooms, there
are three other smaller meeting rooms, five boardrooms and two rooms located in the West Bay Café and Lounge.
Meeting Room Dimensions Square Feet
Ceiling Height
Theatre Style Classroom Reception Banquet Boardroom U-Shape
Plaza Ballroom [1] 84'x60' 5,040 11'11" 600 300 750 450
Plaza I 28'x60' 1,680 11'11" 150 100 200 150 40 45
Plaza II 28'x60' 1,680 11'11" 150 100 200 150 40 45
Plaza III 28'x60' 1,680 11'11" 150 100 200 150 40 45
Peninsula Ballroom 88'x30' 2,640 11'3" 300 128 300 200 80 88
Peninsula I 22'x30' 660 11'3" 50 30 70 50 20 22
Peninsula II 22'x30' 660 11'3" 50 30 70 50 20 22
Peninsula III 22'x30' 660 11'3" 50 30 70 50 20 22
Peninsula IV 22'x30' 660 11'3" 50 30 70 50 20 22
Parkside 42'x19' 798 8'5" 75 75 80 50 30 30
Bayside 40'x31' 1,240 11'11" 120 50 150 90 35 35
Bayside I 20'x31' 620 11'11" 60 25 75 45 22 22
Bayside II 20'x31' 620 11'11" 60 25 75 45 22 22
Cypress 11'x20' 660 16
Cypress I 11'x20' 220
Cypress II 11'x20' 220
Cypress III 11'x20' 220
Terra 11'x20' 220 16
Redwood 11'x20' 220 16
West Bay I 20'x28' 560 10'8" 50 40
West Bay II 22'x28' 616 10'8" 50 40
TOTAL 11,994 [2]
CypressBoardrooms III
CypressBoardrooms II
Guestrooms
Guestrooms
Guestrooms
Guestrooms
CypressBoardrooms I
OfficeGift Shop
Storage Business Center
LobbySeating
Rece
ption
Des
k
Rece
ption
Lobb
y
New
Vesti
bule Front
Offices
Catering Office
Barber Shop
Employee Lounge
Ballroom III
Fitness Center
Pool
Plaza Ballroom II
New FirePanel
Pre Function
Plaza Ballroom I
Storage
TerraConference Room
West Bay Cafe
Existing Kitchen
Corri
dor
TelephoneMenWomen
Office
Office
ElevetorLobby
Men
Women
KitchenStorage
Stor.
Lobby
General Office
Redwood Room
West Bay Cafe
Stor.
Bayside RoomI
Bayside RoomII
ParksideRoom
Peninsula Ballroom IV
Peninsula Ballroom III
Peninsula Ballroom II
Peninsula Ballroom I
[1] Excludes Pre-function space of 2,731 SF. [2]Sum of Meeting Space as shown above in bold numbers.
Crowne Plaza San Francisco International Airport BURLINGAME, CALIFORNIA
9Property Description
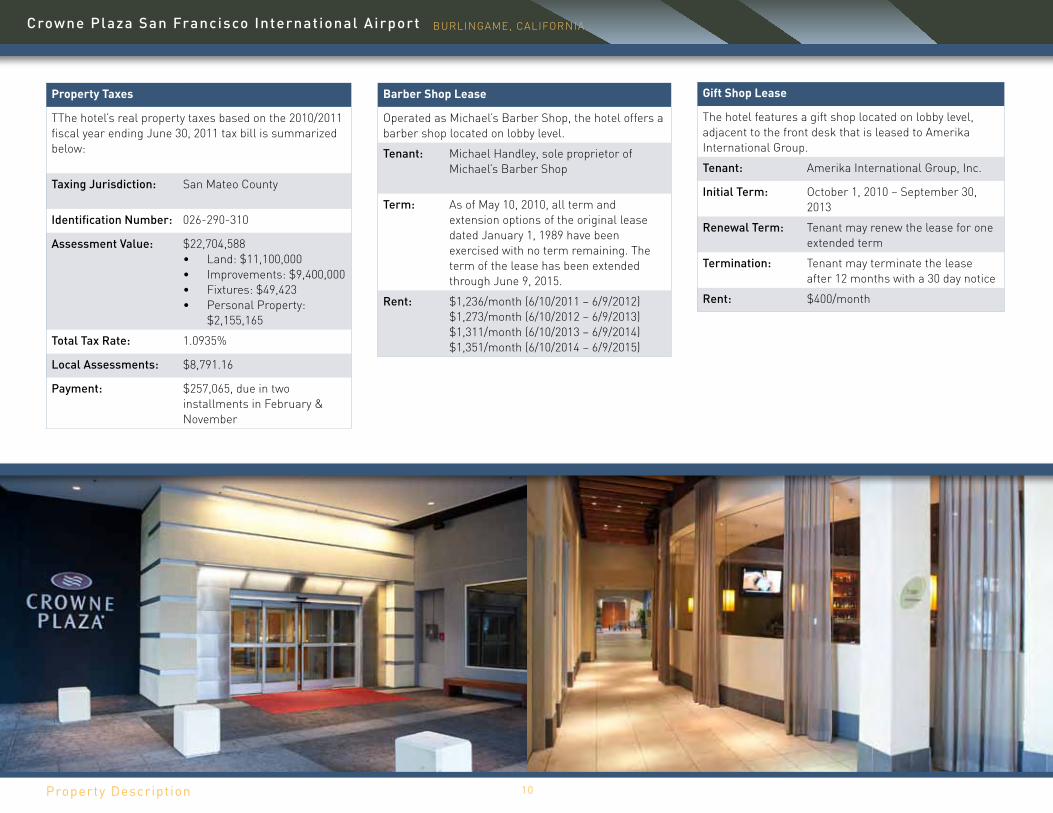
Property Taxes
TThe hotel’s real property taxes based on the 2010/2011 fiscal year ending June 30, 2011 tax bill is summarized below:
Taxing Jurisdiction: San Mateo County
Identification Number: 026-290-310
Assessment Value: $22,704,588• Land: $11,100,000• Improvements: $9,400,000• Fixtures: $49,423• Personal Property:
$2,155,165
Total Tax Rate: 1.0935%
Local Assessments: $8,791.16
Payment: $257,065, due in two installments in February & November
Gift Shop Lease
The hotel features a gift shop located on lobby level, adjacent to the front desk that is leased to Amerika International Group.
Tenant: Amerika International Group, Inc.
Initial Term: October 1, 2010 – September 30, 2013
Renewal Term: Tenant may renew the lease for one extended term
Termination: Tenant may terminate the lease after 12 months with a 30 day notice
Rent: $400/month
Barber Shop Lease
Operated as Michael’s Barber Shop, the hotel offers a barber shop located on lobby level.
Tenant: Michael Handley, sole proprietor of Michael’s Barber Shop
Term: As of May 10, 2010, all term and extension options of the original lease dated January 1, 1989 have been exercised with no term remaining. The term of the lease has been extended through June 9, 2015.
Rent: $1,236/month (6/10/2011 – 6/9/2012) $1,273/month (6/10/2012 – 6/9/2013) $1,311/month (6/10/2013 – 6/9/2014) $1,351/month (6/10/2014 – 6/9/2015)
Crowne Plaza San Francisco International Airport BURLINGAME, CALIFORNIA
10Property Description

F lo o r P l a n s
201
202 204 206 208 210 212 214
Lobby
CorridorCorridorStair Exit Stair ExitCorridor
Linen Closet
Elev. 1
Elev. 2
Elev. 3216
218 220 222 224 226 228 230 232 234
203 205 207 209 211 213 217 219 221 223 225 227 229 231 233 235
2ND THRU 9TH FLOOR PLAN
1001
1002 1004 1006 1008 1010 1012 1014
Lobby
CorridorCorridorStair Exit Stair ExitCorridor
Linen Closet
Elev. 1
Elev. 2
Elev. 3
10161020 1022 1024 1026 1028 1030 1032 1034
1003 1005 1007 1009 1011 1013 1017 1019 1021 1023 1025 1027 1029 1031 1033 1035
10TH FLOOR PLAN
Typical Guest Room 2nd Through 9th Floor
Typical Guest Room 10th Floor
Crowne Plaza San Francisco International Airport BURLINGAME, CALIFORNIA
11Property Description

Site Plan
Cypress Boardrooms III
Cypress Boardrooms II
Guestrooms
Guestrooms
Guestrooms
Guestrooms
Cypress Boardrooms I
Loading Dock Area
Peninsula Ballroom IV
Peninsula Ballroom III
Peninsula Ballroom II
Peninsula Ballroom I
OfficeGift Shop
Storage Business Center
LobbySeating
Rece
ption
Des
k
Rece
ption
Lobb
y
New
Vesti
bule Front
Offices
Catering Office
Barber Shop
Employee Lounge
Ballroom III
Fitness Center
Pool
Plaza Ballroom II
New FirePanel
Pre Function
Plaza Ballroom I
Storage
Terra Conference Room
West Bay Cafe
Existing Kitchen
Corri
dor
TelephoneMenWomen
Office
Office
ElevetorLobby
Men
Women
KitchenStorage
Stor.
Lobby
General Office
Redwood Room
West Bay Cafe
Stor.
Bayside RoomI
Bayside RoomII
Parkside Room
BAYSHORE FWY
AIR
PO
RT
BLV
D
N
Crowne Plaza San Francisco International Airport BURLINGAME, CALIFORNIA
12Property Description

Area Overview
Crowne Plaza San Francisco International Airport BURLINGAME, CALIFORNIA
13Area Overview

The Crowne Plaza is located in the heart of the San
Francisco Bay Area, which consists of nine counties
including San Francisco, San Mateo, Santa Clara, Alameda,
Contra Costa, Solano, Napa, Sonoma and Marin, situated
on the perimeter of San Francisco Bay and San Pablo Bay.
• Ranked first in product innovation with the number of
produced patents, and further attracting 36% of the
nation’s venture capital investments, the Bay Area is
anchored by three major cities: San Francisco, San
Jose and Oakland. Major corporations in these cities
and surrounding area make the region second in the
nation in concentration of Fortune 500 companies,
after New York.
• Well-known for its iconic skyline, steep hills, cable
cars and historic streetcars, Fisherman’s Wharf and
the Golden Gate Bridge, the city of San Francisco
is voted the Best US City per Conde Nast Traveler
magazine and has maintained this ranking for the
past 18 years. The cultural and financial center
of the metropolitan area and Northern California,
noteworthy company headquarters in San Francisco
include Gap Inc., McKesson Corporation, Charles
Schwab and Wells Fargo.
• Located in the South Bay, the cities of San Jose,
Santa Clara, Sunnyvale, Mountain View, Palo Alto,
Menlo Park and Redwood Shores are home to the
world renown technology hub known as the Silicon
Valley with numerous tech companies headquartered
here, including are AMD, Adobe, Intel, Cisco Systems,
Hewlett-Packard, Apple, Google, eBay, Netflix,
Facebook and Yahoo!.
• Serving as a central hub for the East Bay, Oakland
is major industrial center and contains the Port
of Oakland, which is the fifth busiest intermodal
container port in the US.
• Recognized for its natural beauty attracting
international tourists, the region’s northern counties
compose California’s famous Wine Country, home to
hundreds of vineyards and wineries, and its Pacific
Ocean coastline features numerous beautiful beaches,
national and regional parks and quaint coastal towns.
• Having a significant economic impact, the Bay Area is
a leader in sustainable agriculture, organic farming
and sustainable energy and is also a recognized
innovator in the culinary arts.
San Francisco Bay Area
Crowne Plaza San Francisco International Airport BURLINGAME, CALIFORNIA
14Area Overview

Known as the “gateway to the Pacific”, San Francisco International Airport is a world-class airport serving nearly 39.4 million domestic and international passengers in 2010. The Bay Area’s largest airport is only 15 miles south of San Francisco, and offers travelers a direct link from the airport to the city on BART, the region’s principal rail system.
• Ranked as the tenth busiest airport in the United States in 2009, San Francisco International Airport is currently the twentieth largest airport in the world in terms of passenger volume. In 2010 SFO was voted “North America’s Best Airport” by passengers.
• The airport is comprised of four different terminals, including a separate international terminal that offers non-stop flights to more than 31 international points on 29 international carriers. SFO connects passengers to more than 69 cities in the U.S. on 20 domestic airlines.
• In April 2011, Terminal 2 completed a $383 million renovation making it one of the most sustainable and modern airport terminals in the United States. American Airlines and Virgin America will be the airlines utilizing the renovated terminal. Positioned to handle increased traffic activity, the renovation allows capacity for 5.5 million enplaned passengers per year with a projected 3.2 million enplaned passengers in the first full year in operation.
• SFO’s total number of passengers increased year-over-year by nearly 5% in 2010, marking the sixth consecutive year of growth at the airport. The strong growth in traffic can be attributed to several factors, including the addition of international service Air Berlin, Swiss, LAN-Peru and Virgin America, as well as continued expansion of service from United Airlines, Continental, Delta, Virgin America, JetBlue and Southwest.
• In 2010, the airport also raised its overall share of Bay Area traffic, handling 63.5% of all domestic passengers and 96.1% of all international passengers in the Bay Area.
• Year to date July 2011 passenger activity is up 3.5%. With increased tourism driving the number of travelers that come through SFO, the future outlook for passenger activity at SFO continues to appear positive. The city recently hosted the US Travel Association’s International Pow Wow convention in May 2011, where the greater San Francisco Bay Area was showcased to convention attendees including tour operators, travel wholesalers, travel agents and travel journalists. An economic impact of $350 million from tourism over the next three years is anticipated from the International Pow Wow convention.
San Francisco International Airport (SFO)
SFO Passenger & Cargo Activity
0
100,000
200,000
300,000
400,000
500,000
600,000
0 5,000,000
10,000,000 15,000,000 20,000,000 25,000,000 30,000,000 35,000,000 40,000,000 45,000,000
2004 2005 2006 2007 2008 2009 2010
CCaarr
ggoo ((tt
oonnss))
PPaassss
eennggee
rr AAcc
ttiivviittyy
SSFFOO PPaasssseennggeerr && CCaarrggoo AAccttiivviittyy
Cargo (tons) Passenger Activity
Crowne Plaza San Francisco International Airport BURLINGAME, CALIFORNIA
15Area Overview
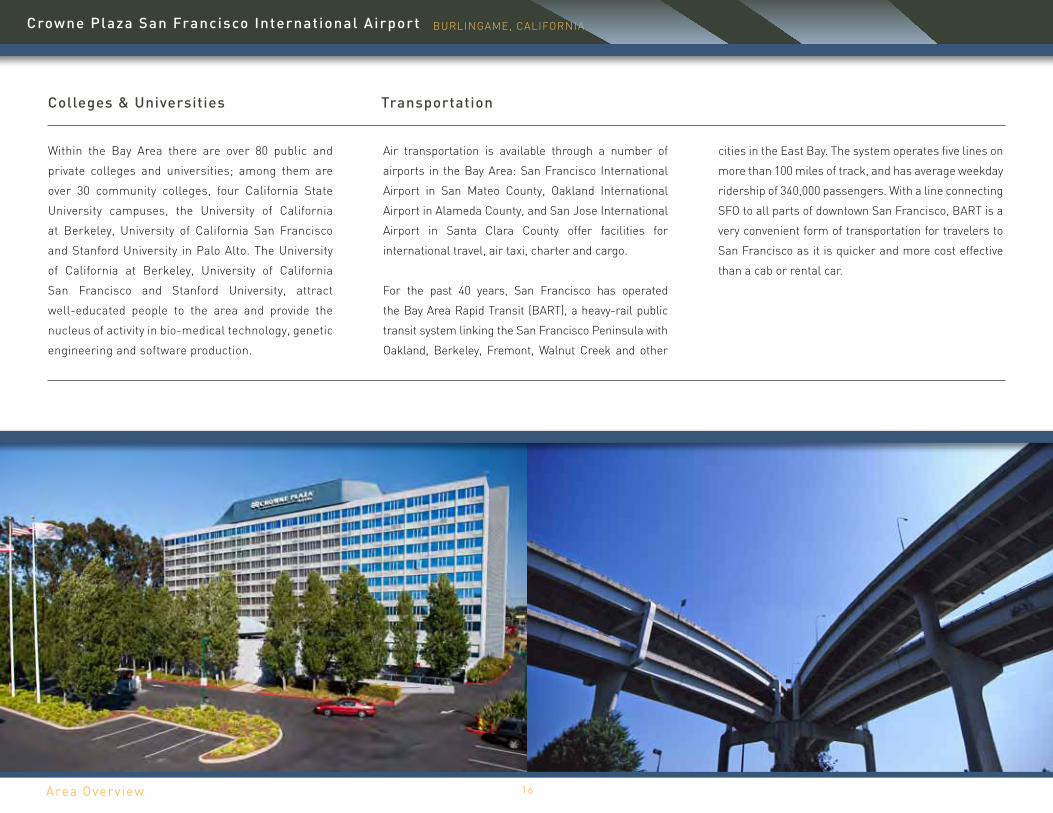
Within the Bay Area there are over 80 public and
private colleges and universities; among them are
over 30 community colleges, four California State
University campuses, the University of California
at Berkeley, University of California San Francisco
and Stanford University in Palo Alto. The University
of California at Berkeley, University of California
San Francisco and Stanford University, attract
well-educated people to the area and provide the
nucleus of activity in bio-medical technology, genetic
engineering and software production.
Air transportation is available through a number of
airports in the Bay Area: San Francisco International
Airport in San Mateo County, Oakland International
Airport in Alameda County, and San Jose International
Airport in Santa Clara County offer facilities for
international travel, air taxi, charter and cargo.
For the past 40 years, San Francisco has operated
the Bay Area Rapid Transit (BART), a heavy-rail public
transit system linking the San Francisco Peninsula with
Oakland, Berkeley, Fremont, Walnut Creek and other
cities in the East Bay. The system operates five lines on
more than 100 miles of track, and has average weekday
ridership of 340,000 passengers. With a line connecting
SFO to all parts of downtown San Francisco, BART is a
very convenient form of transportation for travelers to
San Francisco as it is quicker and more cost effective
than a cab or rental car.
Colleges & Universities Transportation
Crowne Plaza San Francisco International Airport BURLINGAME, CALIFORNIA
16Area Overview

San Francisco is the cultural center of the Bay Area. Cultural and entertainment activities
include nationally renowned live theaters, art museums, local symphonies, operas and
dance companies. In addition, local theaters, symphonies and ballet companies are found
in Oakland, San Jose and other communities. The area supports six major professional
sports teams, as well as college-level athletic programs of the University of California at
Berkeley, Stanford University and other regional colleges and universities.
• Tourism has a significant impact on San Francisco’s economy, and in 2010 the city
welcomed 15.92 million visitors, up 3.1% from 2009 visitation. With spending of $8.34
billion (up 6.2% from 2009), the tourism industry supports more than 67,000 jobs with
a payroll of $1.9 billion.
• The city of San Francisco is a leading U.S. tourist destination with its diversity of visitor
attractions that generates demand in the lodging market. Guests at the Crowne Plaza
are only a short drive away from popular tourist attractions such as Candlestick Park
(home of the San Francisco 49ers), Ferry Building Marketplace, Cable Cars, Lombard
Street, Pier 39, Chinatown, Union Square (downtown San Francisco), Alcatraz Island
Tour and the Golden Gate Bridge.
• With its beautiful coastline, tourists can enjoy blocks of popular waterfront attractions
such as Fisherman’s Wharf and Ghirardelli Square. Considered a major and diverse
international center of culture, travelers can also enjoy the many museums and arts
of San Francisco including the Museum of Modern Art, Asian Art Museum, Palace of
Fine Arts, Yerba Buena Center for Arts and the Contemporary Jewish Museum.
Tourism
Crowne Plaza San Francisco International Airport BURLINGAME, CALIFORNIA
17Area Overview

The Crowne Plaza is located in Burlingame, San Mateo County, situated approximately 17 miles south of San Francisco and 30 miles north of San Jose within the San Francisco Peninsula. Showcasing a significant shoreline of the San Francisco Bay, the Peninsula is the area defined from San Francisco to the Silicon Valley.
• With the presence of Stanford University, San Mateo County continues to a center for innovation, developing a diversified economy well-represented by bioscience, computer software, green technology, hospitality, financial management, health care and transportation companies. Top employers in the Peninsula include: United Airlines, Genentech Inc., Oracle Corporation, Kaiser Permanente, Safeway Inc., Electronic Arts Inc. and Mills-Peninsula Health Services.
• Known as the Gateway to San Francisco, the city of Burlingame benefits from its central location; attracting visitors year round with its beautiful view of the San Francisco Bay shoreline. Only three miles from San Francisco International Airport, the area provides excellent access and is
nearly 17 miles from both the famous attractions in downtown San Francisco and to the heart of Silicon Valley, which is home to several Fortune 1000 technology companies such as Hewlett-Packard, McKesson, Cisco Systems, Intel and Apple. Other local technology companies include Oracle, Google, eBay and Applied Materials among other notables.
• Signifying growth in the market, the new $630 million Mills-Peninsula Medical Center in Burlingame opened in mid-May 2011, replacing the existing hospital.
• To better facilitate increased traffic from growth in this vibrant market, the California Department of Transportation and the San Mateo County Transportation Authority are planning to reconfigure the US 101/Broadway interchange in Burlingame with the construction of a new seven lane overpass to replace the existing four lane Broadway overcrossing. The proposed project is designed to improve traffic movements and access around the interchange, accommodate future traffic increases at
adjacent intersections, improve operations at the southbound US 101 ramps and increase bicyclist, and pedestrian access.
• The San Francisco Peninsula office market experienced positive absorption in 2010, as the Peninsula usually outpaces national trends with its presence of leading-edge technology companies. Vacancy rates had dropped to 16.3% in 2010 while net asking rent on a price per SF basis remained relatively flat year over year around $23.00.
• Given the array of industries, the Bay area is clearly leading the state of California’s recovery with 19,500 jobs added in June 2011, accounting for more than half of the state’s nearly 29,000 added payroll jobs. According to Beacon Economics, the Bay area is anticipated to continue this leadership.
• With minimal additions in office supply, the CBRE-EA Q2 2011 San Francisco Peninsula office market forecast estimates positive net absorption coupled with a 8.3% compound annual growth rate for rental rates from 2011 through 2015.
Year NRA[1] Completions(SF x 1000) Vacancy Rate (%) Net Absorption
(SF x 1000)Gross Asking Rent
($/SF) % SF Quoting Gross Net Asking Rent($/SF) % SF Quoting Net
2005 (SF x 1000)" 0 19.20 1,140 25.97 52.90 14.54 47.10
2006 15,175 0 13.80 784 26.80 63.40 20.60 36.60
2007 15,175 0 13.80 -75 39.89 55.40 29.90 44.60
2008 15,175 783 12.90 870 36.76 60.80 23.16 39.20
2009 15,958 116 19.20 -940 31.40 65.00 18.14 35.00
2010 16,074 0 16.50 462 27.70 63.70 18.58 36.30
2011 16,074 0 12.70 622 29.35 67.00 23.92 33.00
San Francisco Peninsula
Source: CBRE-EA[1] NRA is Net Rentable Area
San Francisco Peninsula Office Market (Class A) Fundamentals Data as of Q2 2011
Crowne Plaza San Francisco International Airport BURLINGAME, CALIFORNIA
18Area Overview
Lodging Market Overview
Crowne Plaza San Francisco International Airport BURLINGAME, CALIFORNIA
19Lodging Market Overview
Market Summary SFO Hotel Submarket
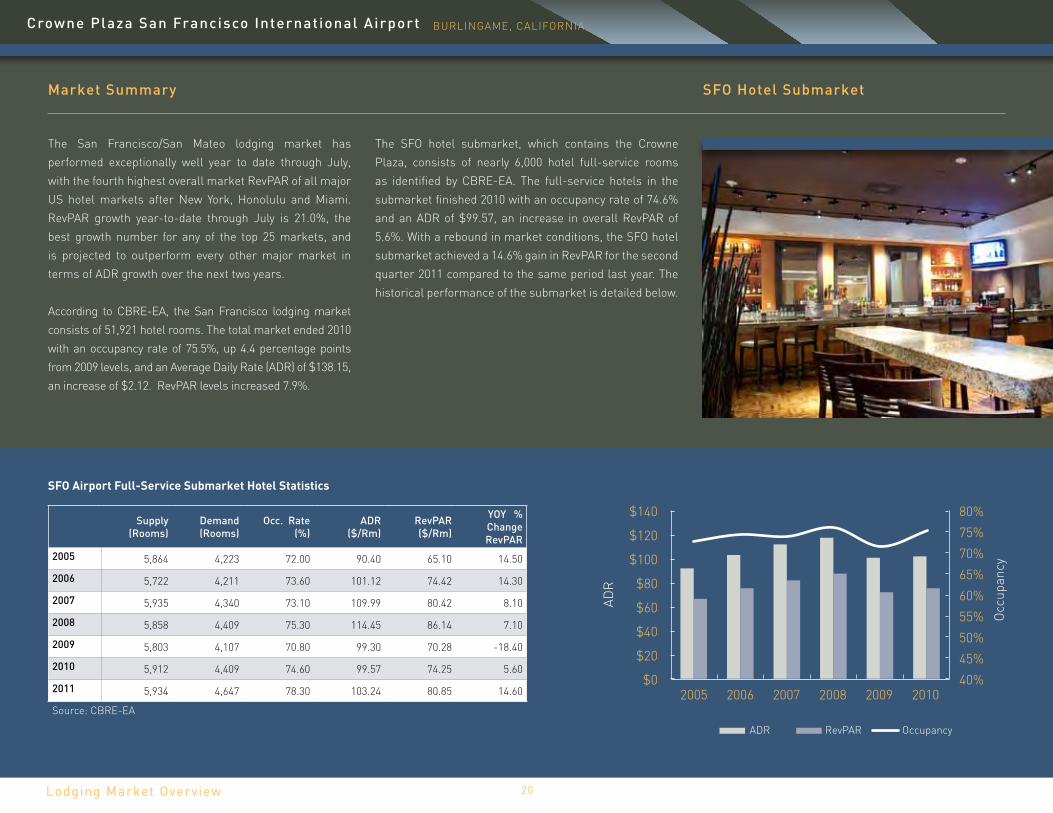
SFO Airport Full-Service Submarket Hotel Statistics
Supply (Rooms)
Demand (Rooms)
Occ. Rate (%)
ADR ($/Rm)
RevPAR ($/Rm)
YOY % Change RevPAR
2005 5,864 4,223 72.00 90.40 65.10 14.50
2006 5,722 4,211 73.60 101.12 74.42 14.30
2007 5,935 4,340 73.10 109.99 80.42 8.10
2008 5,858 4,409 75.30 114.45 86.14 7.10
2009 5,803 4,107 70.80 99.30 70.28 -18.40
2010 5,912 4,409 74.60 99.57 74.25 5.60
2011 5,934 4,647 78.30 103.24 80.85 14.60
Source: CBRE-EA
40% 45% 50% 55% 60% 65% 70% 75% 80%
$0
$20
$40
$60
$80
$100
$120
$140
2005 2006 2007 2008 2009 2010
Occ
upan
cy
ADR
ADR RevPAR Occupancy
The San Francisco/San Mateo lodging market has performed exceptionally well year to date through July, with the fourth highest overall market RevPAR of all major US hotel markets after New York, Honolulu and Miami. RevPAR growth year-to-date through July is 21.0%, the best growth number for any of the top 25 markets, and is projected to outperform every other major market in terms of ADR growth over the next two years.
According to CBRE-EA, the San Francisco lodging market consists of 51,921 hotel rooms. The total market ended 2010 with an occupancy rate of 75.5%, up 4.4 percentage points from 2009 levels, and an Average Daily Rate (ADR) of $138.15, an increase of $2.12. RevPAR levels increased 7.9%.
The SFO hotel submarket, which contains the Crowne Plaza, consists of nearly 6,000 hotel full-service rooms as identified by CBRE-EA. The full-service hotels in the submarket finished 2010 with an occupancy rate of 74.6% and an ADR of $99.57, an increase in overall RevPAR of 5.6%. With a rebound in market conditions, the SFO hotel submarket achieved a 14.6% gain in RevPAR for the second quarter 2011 compared to the same period last year. The historical performance of the submarket is detailed below.
Crowne Plaza San Francisco International Airport BURLINGAME, CALIFORNIA
20Lodging Market Overview

A competitive set of six hotels in the SFO hotel submarket, including the Crowne Plaza, are identified in the property’s Smith Travel Research Report. This set consist of properties that are all full-service hotels with national franchise affiliations. The properties range in size from 132 to 400 rooms with an average size of 282 rooms.
Competitive Hotel Market
N
Crowne Plaza San Francisco International
Airport
Crowne Plaza San Francisco International Airport BURLINGAME, CALIFORNIA
21Lodging Market Overview

HOTELCrowne Plaza San
Francisco Intrntl AirportHilton San Francisco
AirportClarion Hotel San
Francisco Airport[1]Doubletree San Francisco
Airport
Hilton Garden Inn San Francisco Airport
BurlingameRadisson San Francisco
Airport Bay FrontADDRESS 1177 Airport Blvd 600 Airport Blvd 401 E. Millbrae Ave 835 Airport Blvd 765 Airport Blvd 5000 Sierra Point ParkwayCITY Burlingame Burlingame Millbrae Burlingame Burlingame BrisbaneOPENING 1984 1983 1962 1986 2000 2000NUMBER OF ROOMS 309 400 251 388 132 210
RESTAURANT/LOUNGES West Bay Café & Lounge Windows on the BayLobby Lounge Bay Side Bar and Grill Chutney Grill & Lounge Great American Grill Xebec Restaurant & Bar
MEETING SPACETotal Net Meeting Space (SF) 11,944 11,000 20,000 8,400 1,830 3,500Largest Room / Ballroom (SF) 5,040 5,832 3,420 4,050 1,323 1,550Space (SF) / Guest Room 39 28 80 22 14 17
AMENITIESSwimming Pool Indoor Indoor Outdoor None Indoor IndoorFitness Room Yes Yes Yes Yes Yes YesBusiness Center Yes Yes Yes Yes Yes Yes
[1] Clarion Hotel now undergoing a renovation plan to convert to an Aloft, a vision of W Hotels
Crowne Plaza San Francisco International Airport BURLINGAME, CALIFORNIA
22Lodging Market Overview
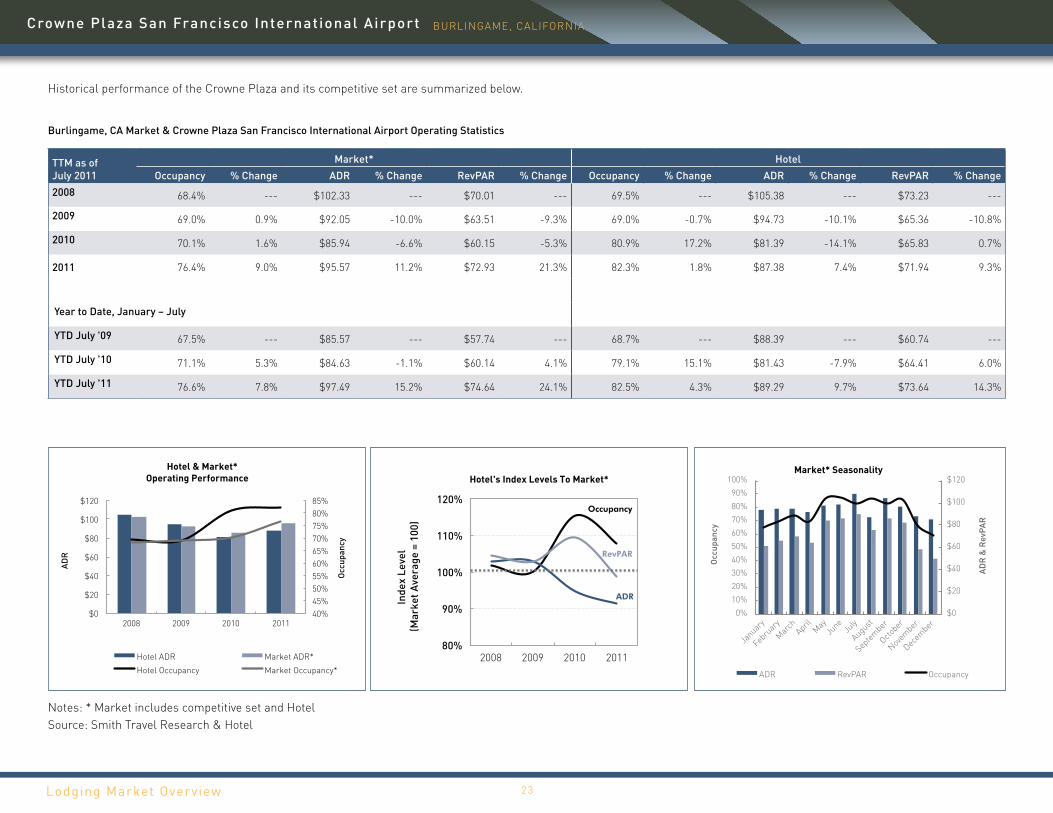
TTM as ofJuly 2011
Market* HotelOccupancy % Change ADR % Change RevPAR % Change Occupancy % Change ADR % Change RevPAR % Change
2008 68.4% --- $102.33 --- $70.01 --- 69.5% --- $105.38 --- $73.23 ---
2009 69.0% 0.9% $92.05 -10.0% $63.51 -9.3% 69.0% -0.7% $94.73 -10.1% $65.36 -10.8%
2010 70.1% 1.6% $85.94 -6.6% $60.15 -5.3% 80.9% 17.2% $81.39 -14.1% $65.83 0.7%
2011 76.4% 9.0% $95.57 11.2% $72.93 21.3% 82.3% 1.8% $87.38 7.4% $71.94 9.3%
Year to Date, January – July
YTD July '09 67.5% --- $85.57 --- $57.74 --- 68.7% --- $88.39 --- $60.74 ---
YTD July '10 71.1% 5.3% $84.63 -1.1% $60.14 4.1% 79.1% 15.1% $81.43 -7.9% $64.41 6.0%
YTD July '11 76.6% 7.8% $97.49 15.2% $74.64 24.1% 82.5% 4.3% $89.29 9.7% $73.64 14.3%
Historical performance of the Crowne Plaza and its competitive set are summarized below.
Notes: * Market includes competitive set and Hotel Source: Smith Travel Research & Hotel
Burlingame, CA Market & Crowne Plaza San Francisco International Airport Operating Statistics
Hotel & Market* Operating Performance
Hotel's Index Levels To Market*
$0
$20
$40
$60
$80
$100
$120
0% 10% 20% 30% 40% 50% 60% 70% 80% 90%
100%
Januar
y
Febru
ary
March
Apr
il May
Ju
ne Ju
ly
August
Septem
ber
Octobe
r
Novem
ber
Decem
ber
ADR
& R
evPA
R
Occ
upan
cy
Market* Seasonality
ADR RevPAR Occupancy
40% 45% 50% 55% 60% 65% 70% 75% 80% 85%
$0
$20
$40
$60
$80
$100
$120
2008 2009 2010 2011
Occ
upan
cy
ADR
Hotel ADR Market ADR*
Hotel Occupancy Market Occupancy*
80%
90%
100%
110%
120%
2008 2009 2010 2011
Inde
x Le
vel
(Mar
ket A
vera
ge =
100
)
Occupancy
RevPAR
ADR
Crowne Plaza San Francisco International Airport BURLINGAME, CALIFORNIA
23Lodging Market Overview

• Occupancy: Room night demand has grown for
both the Crowne Plaza and competitive market at
a compound annual growth rate of nearly 6% and
4% per year, respectively since the trailing twelve
months (TTM) July 2008, attributed to the market’s
diverse base of demand generators. This dynamic
activity resulted in occupancy growth of 9.0% and
1.8% for the competitive set and Crowne Plaza,
respectively, bringing occupancy to levels exceeding
75% for TTM July 2011. With lower growth in year
over year occupancy compared to the competitive
market, the Crowne Plaza’s occupancy index
dropped from nearly 115% to 108%.
• Average Daily Rate: ADR for the Crowne Plaza and
market achieved peak room rates around $100 in
2008, but then declined in 2010 to ADR levels in
the low to mid $80 range as the overall economy
suffered. Levels have rebounded significantly
in 2011, with increases of 15.2% for the market
and 9.7% for the Crowne Plaza during year
to date through July.
• RevPAR: The Crowne Plaza and market have
achieved explosive double-digit gains in RevPAR
through this year ending July, with increases of
14.3% and 24.1%, respectively. Achieving a RevPAR
around $70 for TTM July 2011, performance
for the market has quickly rebounded exceeding
peak levels in 2008. With a drop in RevPAR index
from approximately 109% to 99%, an opportunity
exists to increase the Crowne Plaza’s fair share
with value-add strategies, including property
renovation and brand repositioning.
Segmentation
The Crowne Plaza and its full-service competitors
target transient, group and contract business, where
the market’s close proximity to SFO particularly lends
well for airline contract business. A property renovation
and brand repositioning may provide an opportunity to
raise the Crowne Plaza’s transient and contract room
rates, which appear to significantly lag the competitive
market as highlighted below.
Occupancy (%)
Transient Group Contract Total
My Prop Comp Set My Prop Comp Set My Prop Comp Set My Prop Comp Set
Running 12 Month (July)
2009 43.9 42.3 14.5 7.5 10.7 19.2 69.0 69.0
2010 56.4 45.7 12.6 7.8 11.9 14.2 80.9 67.7
2011 56.1 49.7 10.8 10.8 15.4 14.6 82.3 75.1
ADR ($)
Running 12 Month (July)
2009 96.9 99.2 103.6 105.6 74.0 68.9 94.7 91.4
2010 83.9 94.0 92.2 85.2 58.0 65.1 81.4 87.0
2011 92.7 107.1 101.4 90.2 57.9 69.7 87.4 97.4
Crowne Plaza San Francisco International Airport BURLINGAME, CALIFORNIA
24Lodging Market Overview
Financial Performance
Crowne Plaza San Francisco International Airport BURLINGAME, CALIFORNIA
25Financial Performance
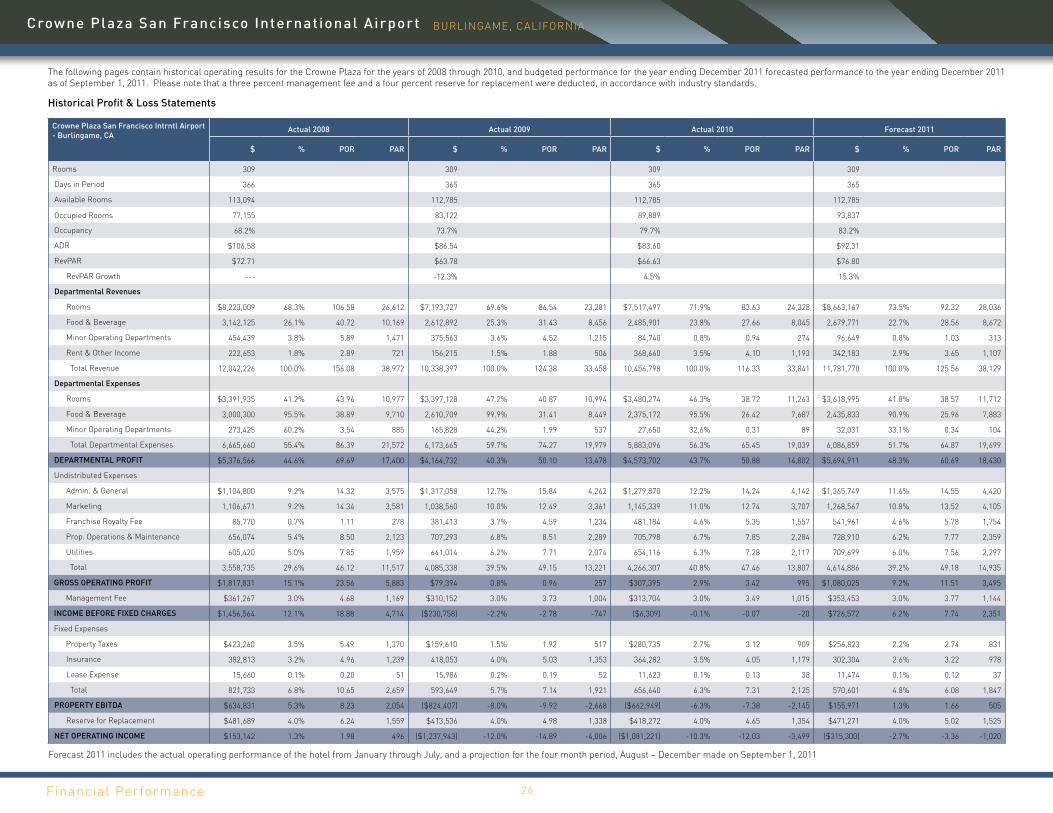
The following pages contain historical operating results for the Crowne Plaza for the years of 2008 through 2010, and budgeted performance for the year ending December 2011 forecasted performance to the year ending December 2011 as of September 1, 2011. Please note that a three percent management fee and a four percent reserve for replacement were deducted, in accordance with industry standards.
Crowne Plaza San Francisco Intrntl Airport - Burlingame, CA
Actual 2008 Actual 2009 Actual 2010 Forecast 2011
$ % POR PAR $ % POR PAR $ % POR PAR $ % POR PAR
Rooms 309 309 309 309
Days in Period 366 365 365 365
Available Rooms 113,094 112,785 112,785 112,785
Occupied Rooms 77,155 83,122 89,889 93,837
Occupancy 68.2% 73.7% 79.7% 83.2%
ADR $106.58 $86.54 $83.60 $92.31
RevPAR $72.71 $63.78 $66.63 $76.80
RevPAR Growth --- -12.3% 4.5% 15.3%
Departmental Revenues
Rooms $8,223,009 68.3% 106.58 26,612 $7,193,727 69.6% 86.54 23,281 $7,517,497 71.9% 83.63 24,328 $8,663,167 73.5% 92.32 28,036
Food & Beverage 3,142,125 26.1% 40.72 10,169 2,612,892 25.3% 31.43 8,456 2,485,901 23.8% 27.66 8,045 2,679,771 22.7% 28.56 8,672
Minor Operating Departments 454,439 3.8% 5.89 1,471 375,563 3.6% 4.52 1,215 84,740 0.8% 0.94 274 96,649 0.8% 1.03 313
Rent & Other Income 222,653 1.8% 2.89 721 156,215 1.5% 1.88 506 368,660 3.5% 4.10 1,193 342,183 2.9% 3.65 1,107
Total Revenue 12,042,226 100.0% 156.08 38,972 10,338,397 100.0% 124.38 33,458 10,456,798 100.0% 116.33 33,841 11,781,770 100.0% 125.56 38,129
Departmental Expenses
Rooms $3,391,935 41.2% 43.96 10,977 $3,397,128 47.2% 40.87 10,994 $3,480,274 46.3% 38.72 11,263 $3,618,995 41.8% 38.57 11,712
Food & Beverage 3,000,300 95.5% 38.89 9,710 2,610,709 99.9% 31.41 8,449 2,375,172 95.5% 26.42 7,687 2,435,833 90.9% 25.96 7,883
Minor Operating Departments 273,425 60.2% 3.54 885 165,828 44.2% 1.99 537 27,650 32.6% 0.31 89 32,031 33.1% 0.34 104
Total Departmental Expenses 6,665,660 55.4% 86.39 21,572 6,173,665 59.7% 74.27 19,979 5,883,096 56.3% 65.45 19,039 6,086,859 51.7% 64.87 19,699
DEPARTMENTAL PROFIT $5,376,566 44.6% 69.69 17,400 $4,164,732 40.3% 50.10 13,478 $4,573,702 43.7% 50.88 14,802 $5,694,911 48.3% 60.69 18,430
Undistributed Expenses
Admin. & General $1,104,800 9.2% 14.32 3,575 $1,317,058 12.7% 15.84 4,262 $1,279,870 12.2% 14.24 4,142 $1,365,749 11.6% 14.55 4,420
Marketing 1,106,671 9.2% 14.34 3,581 1,038,560 10.0% 12.49 3,361 1,145,339 11.0% 12.74 3,707 1,268,567 10.8% 13.52 4,105
Franchise Royalty Fee 85,770 0.7% 1.11 278 381,413 3.7% 4.59 1,234 481,184 4.6% 5.35 1,557 541,961 4.6% 5.78 1,754
Prop. Operations & Maintenance 656,074 5.4% 8.50 2,123 707,293 6.8% 8.51 2,289 705,798 6.7% 7.85 2,284 728,910 6.2% 7.77 2,359
Utilities 605,420 5.0% 7.85 1,959 641,014 6.2% 7.71 2,074 654,116 6.3% 7.28 2,117 709,699 6.0% 7.56 2,297
Total 3,558,735 29.6% 46.12 11,517 4,085,338 39.5% 49.15 13,221 4,266,307 40.8% 47.46 13,807 4,614,886 39.2% 49.18 14,935
GROSS OPERATING PROFIT $1,817,831 15.1% 23.56 5,883 $79,394 0.8% 0.96 257 $307,395 2.9% 3.42 995 $1,080,025 9.2% 11.51 3,495
Management Fee $361,267 3.0% 4.68 1,169 $310,152 3.0% 3.73 1,004 $313,704 3.0% 3.49 1,015 $353,453 3.0% 3.77 1,144
INCOME BEFORE FIXED CHARGES $1,456,564 12.1% 18.88 4,714 ($230,758) -2.2% -2.78 -747 ($6,309) -0.1% -0.07 -20 $726,572 6.2% 7.74 2,351
Fixed Expenses
Property Taxes $423,260 3.5% 5.49 1,370 $159,610 1.5% 1.92 517 $280,735 2.7% 3.12 909 $256,823 2.2% 2.74 831
Insurance 382,813 3.2% 4.96 1,239 418,053 4.0% 5.03 1,353 364,282 3.5% 4.05 1,179 302,304 2.6% 3.22 978
Lease Expense 15,660 0.1% 0.20 51 15,986 0.2% 0.19 52 11,623 0.1% 0.13 38 11,474 0.1% 0.12 37
Total 821,733 6.8% 10.65 2,659 593,649 5.7% 7.14 1,921 656,640 6.3% 7.31 2,125 570,601 4.8% 6.08 1,847
PROPERTY EBITDA $634,831 5.3% 8.23 2,054 ($824,407) -8.0% -9.92 -2,668 ($662,949) -6.3% -7.38 -2,145 $155,971 1.3% 1.66 505
Reserve for Replacement $481,689 4.0% 6.24 1,559 $413,536 4.0% 4.98 1,338 $418,272 4.0% 4.65 1,354 $471,271 4.0% 5.02 1,525
NET OPERATING INCOME $153,142 1.3% 1.98 496 ($1,237,943) -12.0% -14.89 -4,006 ($1,081,221) -10.3% -12.03 -3,499 ($315,300) -2.7% -3.36 -1,020
Historical Profit & Loss Statements
Forecast 2011 includes the actual operating performance of the hotel from January through July, and a projection for the four month period, August – December made on September 1, 2011
Crowne Plaza San Francisco International Airport BURLINGAME, CALIFORNIA
26Financial Performance

AssumptionsRoom Count: 309Inflation: 3 percent
Top Line PerformanceAverage Daily Rate (ADR): With a planned product improvement along with continued market growth for the remainder of 2011 and for the near term, the Crowne Plaza is anticipated to increase its ADR performance, stabilizing at $136.75 in year four with inflationary growth thereafter.
Occupancy: Driven by strong room demand in the SFO market plus a renovated hotel product, the Crowne Plaza is estimated to achieve a stabilized occupancy level of 81%. Accounting for renovations, we projected a dip in occupancy level in year one.
Departmental RevenuesFood and Beverage: Revenues for Food and Beverage are estimated at $34.00 per occupied room and increased based on completion of property renovations, achieving a stabilized revenue level of approximately $3.8 million in year four.
Minor Operating Departments (MOD): This line item includes revenues from telecommunications and guest laundry, and is projected at $0.90 per occupied room and increased with inflation.
Rent & Other Income: This income has been estimated in line with Budget 2011, accounting for items such as space rental and concessions.
Departmental ExpensesRooms: With improved top line performance, Rooms expense is assumed to stabilize near the low-30 percent level of departmental revenues.
Food and Beverage: This expense is anticipated to stabilize near the low 80 percent level of departmental revenue.
MOD: Departmental expenses are based on 2011 budget levels.
Undistributed ExpensesAdministrative & General (A&G): This expense is based on Budget 2011, and assumed to stabilize near 9.0 percent of Total Revenue. Marketing: Expenses related to sales and marketing are assumed to stabilize at approximately 6 percent of Total Revenue.
Franchise Royalty Fee: Based on Budget 2011, Crowne Plaza licensing fees are estimated at 6.4 percent of Rooms Revenue.
Property Operations and Maintenance: With estimates in line per Budget 2011, this line item is assumed to stabilize near 4.5 percent of Total Revenue.
Utilities: Expenses for utilities are anticipated to stabilize near 5.0 percent of Total Revenue.
Fixed ExpensesManagement Fees: 3.0 percent of Gross Revenues.
Taxes: Based on California tax codes, set at 1.2 percent of property value and increased at an estimated growth rate of 2.0 percent per year.
Insurance: Estimates are based on 2011 Budget.
Lease: Estimates related to the expense for equipment rental are based on 2011 Budget.
FF&E Reserve: With completion of property renovations, FF&E Reserve is estimated to ramp up from 0.0 percent, 2.0 percent, 3.0 percent, and 4.0 percent of Gross Revenues in years 1 through 4 of the prospective financial analysis, respectively.
Disclaimer: © 2011, CB Richard Ellis, Inc. We obtained the information above from sources we believe to be reliable. However, we have not verified its accuracy and make no guarantee, warranty or representation about it. It is submitted subject to the possibility of errors, omissions, change of price, rental or other conditions, prior sale, lease or financing, or withdrawal without notice. We include projections, opinions, assumptions or estimates for example only, and they may not represent current or future performance of the property. You and your tax and legal advisors should conduct your own investigation of the property and transaction.
Crowne Plaza San Francisco International Airport BURLINGAME, CALIFORNIA
27Financial Performance

Crowne Plaza San Francisco Intrntl Airport - Burlingame, CA
Year 1 Year 2 Year 3 Year 4 Year 5
$ % $ % $ % $ % $ %
Rooms 309 309 309 309 309
Days in Period 366 365 365 365 366
Available Rooms 113,094 112,785 112,785 112,785 113,094
Occupied Rooms 88,213 90,228 91,356 91,356 91,606
Occupancy 78.0% 80.0% 81.0% 81.0% 81.0%
ADR $95.00 $115.25 $130.25 $136.75 $140.75
RevPAR $74.10 $92.20 $105.50 $110.77 $114.01
RevPAR Growth 4.4% 24.4% 14.4% 5.0% 2.9%
Departmental Revenues
Rooms $8,380,265 69.9% $10,398,777 72.5% $11,899,099 73.9% $12,492,912 74.3% $12,893,564 74.3%
Food & Beverage 3,167,670 26.4% 3,484,437 24.3% 3,728,347 23.2% 3,840,198 22.8% 3,955,404 22.8%
Minor Operating Departments 84,882 0.7% 88,286 0.6% 91,499 0.6% 94,244 0.6% 97,338 0.6%
Rent & Other Income 354,078 3.0% 364,605 2.5% 376,007 2.3% 387,287 2.3% 399,999 2.3%
Total Revenue 11,986,895 100.0% 14,336,105 100.0% 16,094,954 100.0% 16,814,642 100.0% 17,346,305 100.0%
Departmental Expenses
Rooms 3,544,770 42.3% 3,677,640 35.4% 3,806,768 32.0% 3,844,836 30.8% 3,883,284 30.1%
Food & Beverage 2,837,675 89.6% 2,977,524 85.5% 3,014,743 80.9% 3,075,038 80.1% 3,167,289 80.1%
Minor Operating Departments 28,766 33.9% 29,920 33.9% 31,009 33.9% 31,939 33.9% 32,987 33.9%
Total Departmental Expenses 6,411,211 53.5% 6,685,084 46.6% 6,852,520 42.6% 6,951,813 41.3% 7,083,561 40.8%
DEPARTMENTAL PROFIT 5,575,684 46.5% 7,651,021 53.4% 9,242,433 57.4% 9,862,829 58.7% 10,262,744 59.2%
Undistributed Expenses
Admin. & General 1,303,639 10.9% 1,381,109 9.6% 1,450,847 9.0% 1,499,648 8.9% 1,548,869 8.9%
Marketing 1,035,600 8.6% 1,040,778 7.3% 1,045,982 6.5% 1,051,212 6.3% 1,056,468 6.1%
Franchise Royalty Fee 536,337 4.5% 665,522 4.6% 761,542 4.7% 799,546 4.8% 825,188 4.8%
Prop. Operations & Maintenance 659,320 5.5% 685,474 4.8% 711,581 4.4% 733,961 4.4% 758,051 4.4%
Utilities 681,483 5.7% 736,368 5.1% 782,945 4.9% 810,996 4.8% 837,615 4.8%
Total 4,216,379 35.2% 4,509,251 31.5% 4,752,897 29.5% 4,895,363 29.1% 5,026,191 29.0%
GROSS OPERATING PROFIT 1,359,305 11.3% 3,141,770 21.9% 4,489,536 27.9% 4,967,466 29.5% 5,236,553 30.2%
Management Fee 359,607 3.0% 430,083 3.0% 482,849 3.0% 504,439 3.0% 520,389 3.0%
INCOME BEFORE FIXED EXPENSES 999,698 8.3% 2,711,687 18.9% 4,006,688 24.9% 4,463,027 26.5% 4,716,164 27.2%
Fixed Expenses
Property Taxes 381,600 3.2% 389,232 2.7% 397,017 2.5% 404,957 2.4% 413,056 2.4%
Insurance 353,528 2.9% 363,139 2.5% 374,033 2.3% 385,254 2.3% 397,899 2.3%
Lease Expense 12,105 0.1% 12,434 0.1% 12,807 0.1% 13,191 0.1% 13,624 0.1%
Total 747,233 6.2% 764,805 5.3% 783,857 4.9% 803,402 4.8% 824,579 4.8%
PROPERTY EBITDA 252,465 2.1% 1,946,882 13.6% 3,222,831 20.0% 3,659,624 21.8% 3,891,585 22.4%
Reserve for Replacement 0 0.0% 286,722 2.0% 482,849 3.0% 672,586 4.0% 693,852 4.0%
NET OPERATING INCOME 252,465 2.1% 1,660,160 11.6% 2,739,982 17.0% 2,987,039 17.8% 3,197,732 18.4%
Prospective Financial Analysis
Crowne Plaza San Francisco International Airport BURLINGAME, CALIFORNIA
28Financial Performance

Henry E. Bose, JrSenior Vice PresidentCalifornia Lic. [email protected]
Mark H. McDermottSenior Vice PresidentCalifornia Lic. [email protected]
I N V E S T M E N T C O N TA CT SCrowne Plaza San Francisco International Airport
BURLINGAME, CALIFORNIA


