Page 1
CRU Consulting Steelmaking raw materials – key trends
Prepared for the 82nd Session of the OECD Steel Committee
Prepared by CRU Consulting
Laura Brooks, Principal Consultant
e: [email protected]
t: +44 (0) 20 7903 2239
23rd March 2017
Page 2
2
Agenda
• Recent trends for the bulks
• Snapshot of base case long-run forecasts
• 4 key trends to watch
• Why are these trends important?
• Conclusion
OECD Steel Committee
Page 3
3
2014 - 2015: prices crashed due to over-investment in supply
CRU uses super cycles to justify expectations for long-run price trends
1. Super cycles typically take about 25 years peak to peak or trough to trough
2. High capital cost commodities (hard rock or bulks) have a wide amplitude, while less capital- intensive
industries have a narrow amplitude
3. Super cycles come about because of an overreaction of investment following a price spike
-150
-100
-50
0
50
100% Price 2015/2011 % Volume 2015/2011
Price versus volume change
Upstream steel market
OECD Steel Committee
Source: CRU
Page 4
4
Lower costs also helped to drive prices down
CRU Business Cost Curve
x axis: cumulative production, Mt
y axis: Business Cost (normalised to 62% Fe fines, CFR China, $/t
Downwards pressure from lower oil prices, currency depreciation, lower
contractor costs, reduction in headcounts, change in mine plans etc.
Are the cost reductions sustainable?
….this is critical for CRU’s price forecasts
OECD Steel Committee
Source: CRU
Page 5
5
A recovery ensued in 2016, followed by sharp gains in 2017. Why?
0
50
100
150
200
250
Ja
n-0
8
Apr-
08
Ju
l-0
8
Oct-
08
Ja
n-0
9
Apr-
09
Ju
l-0
9
Oct-
09
Ja
n-1
0
Apr-
10
Ju
l-1
0
Oct-
10
Ja
n-1
1
Apr-
11
Ju
l-1
1
Oct-
11
Ja
n-1
2
Apr-
12
Ju
l-1
2
Oct-
12
Ja
n-1
3
Apr-
13
Ju
l-1
3
Oct-
13
Ja
n-1
4
Apr-
14
Ju
l-1
4
Oct-
14
Ja
n-1
5
Apr-
15
Ju
l-1
5
Oct-
15
Ja
n-1
6
Apr-
16
Ju
l-1
6
Oct-
16
Ja
n-1
7
Monthly price, 62% Fe fines, CFR China Average monthly price
0
50
100
150
200
250
300
350
Ja
n-0
8
Apr-
08
Ju
l-0
8
Oct-
08
Ja
n-0
9
Apr-
09
Ju
l-0
9
Oct-
09
Ja
n-1
0
Apr-
10
Ju
l-1
0
Oct-
10
Ja
n-1
1
Apr-
11
Ju
l-1
1
Oct-
11
Ja
n-1
2
Apr-
12
Ju
l-1
2
Oct-
12
Ja
n-1
3
Apr-
13
Ju
l-1
3
Oct-
13
Ja
n-1
4
Apr-
14
Ju
l-1
4
Oct-
14
Ja
n-1
5
Apr-
15
Ju
l-1
5
Oct-
15
Ja
n-1
6
Apr-
16
Ju
l-1
6
Oct-
16
Ja
n-1
7
Australian quarterly contract HCC Average quarterly price
Iron ore price
Hard coking coal price
OECD Steel Committee
Source: CRU
Page 6
6
An improved demand side picture stabilisation in global crude steel production…
0
500
1000
1500
2000
2000 2001 2002 2003 2004 2005 2006 2007 2008 2009 2010 2011 2012 2013 2014 2015 2016
ROW
China
Global crude steel production
-8%
-6%
-4%
-2%
0%
2%
4%
6%
Q12014
Q32014
Q12015
Q32015
Q12016
Q32016
Rest of world China
Carbon crude steel production growth, y/y %
-30%
-20%
-10%
0%
10%
20%
China North America Europe
HR coil EBITDA margin for Chinese producers, %
A slight increase in demand and expectations of production cuts in China drove steel prices higher
Steel margins fattened despite the increases in iron ore and coking coal prices
…and higher steel prices and margins
OECD Steel Committee
Source: CRU, WSA
Page 7
7
For iron ore = a Chinese import boom, not a demand boom, drove prices higher
-4 -4 -9
78
-20
5
30
55
80
Crude steel Hot metal Iron ore consumption Iron ore imports
Chinese crude steel production and iron ore consumption, 2016, y/y change, Mt
The result of a
sharper cut in
Chinese
domestic iron
ore production
OECD Steel Committee
Source: CRU, WSA
Page 8
8
For coking coal = the Chinese government’s policies played a central role in price movements
China coal capacity, annualised, bn t
NB. Total capacity figures exclude idled capacity.
3
4
2
1
0
5
16 Q3 16 Q4 16 Q2 15 16 Q1 17 Q1
+13%
Operating new capacity Permanently closed capacity Operating capacity
276 working day policy in China Implementation Relaxation
Global prices Global prices
OECD Steel Committee
Source: CRU
Page 9
9
Agenda
• Recent trends for the bulks
• Snapshot of base case long-run forecasts
• 4 key trends to watch
• Why are these trends important?
• Conclusion
OECD Steel Committee
Page 10
India will be the largest driver of steel demand growth
-5%
0%
5%
10%
15%
20%
25%
30%
0
100
200
300
400
500
600
700
800
900
China has not yet hit peak steel but it will no longer drive growth LHS: finished steel consumption, Mt (bars)
RHS: growth in apparent demand, % (line)
10
0
500
1000
1500
2000
2500
2015 2020 2025 2030 2035North America Europe Asia-Pacific advanced Latin America
Russia & CIS China Asia-Pacific, developing India
Middle East Africa
Global finished steel demand, Mt
OECD Steel Committee
Source: CRU, WSA
Page 11
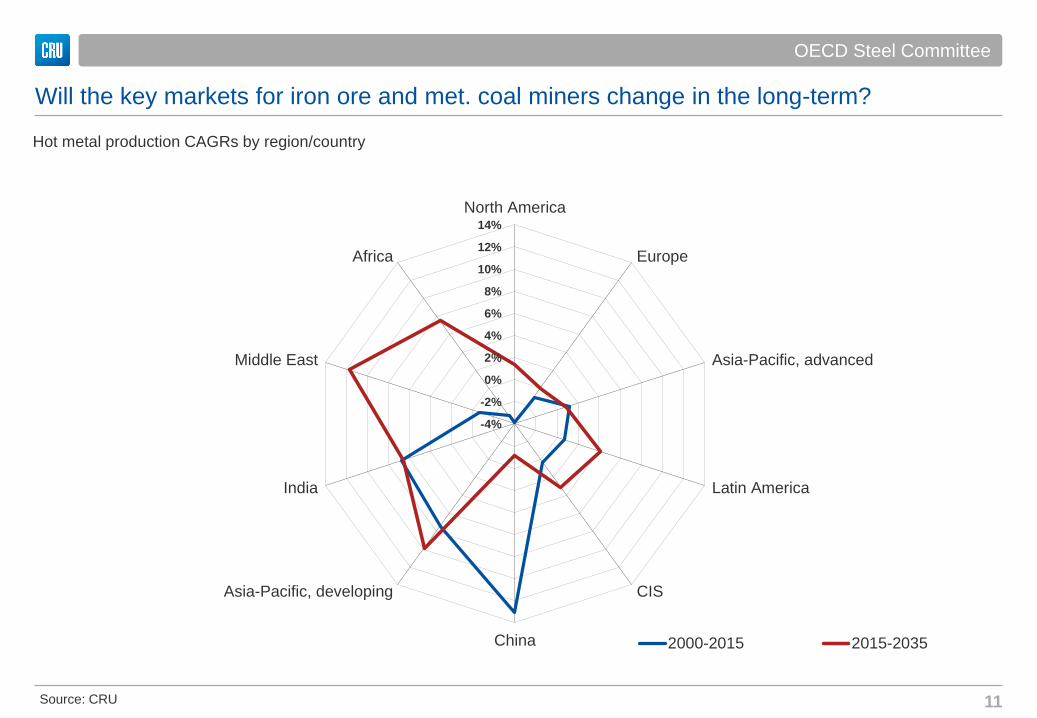
Will the key markets for iron ore and met. coal miners change in the long-term?
-4%
-2%
0%
2%
4%
6%
8%
10%
12%
14%
North America
Europe
Asia-Pacific, advanced
Latin America
CIS
China
Asia-Pacific, developing
India
Middle East
Africa
Hot metal production CAGRs by region/country
2000-2015 2015-2035
11
OECD Steel Committee
Source: CRU
Page 12
Supply/demand “gap” is very different when comparing the bulks
12
800
900
1,000
1,100
1,200
1,300
1,400
16 17 18 19 20 21 22 23 24 25 26 27 28 29 30 31 32 33 34 35
Possible Probable Idled Committed Demand
Gap analysis: met. coal market, demand and potential supply, Mt
Met. coal
S/D “gap” to be filled
by new projects
• IRON ORE - no new greenfield investment is
required in iron ore in the long term, i.e. there is
no gap between supply and demand.
• This does not mean that no new projects will
enter the market.
OECD Steel Committee
Source: CRU
Page 13
13
Agenda
• Recent trends for the bulks
• Snapshot of base case long-run forecasts
• 4 key trends to watch: scrap generation and usage in China
• Why are these trends important?
• Conclusion
OECD Steel Committee
Page 14
China’s construction industry has evolved dramatically over the past 20-30 years
The Shanghai skyline highlights one of many examples of the transition to modern construction methods:
OECD Steel Committee
Page 15
15
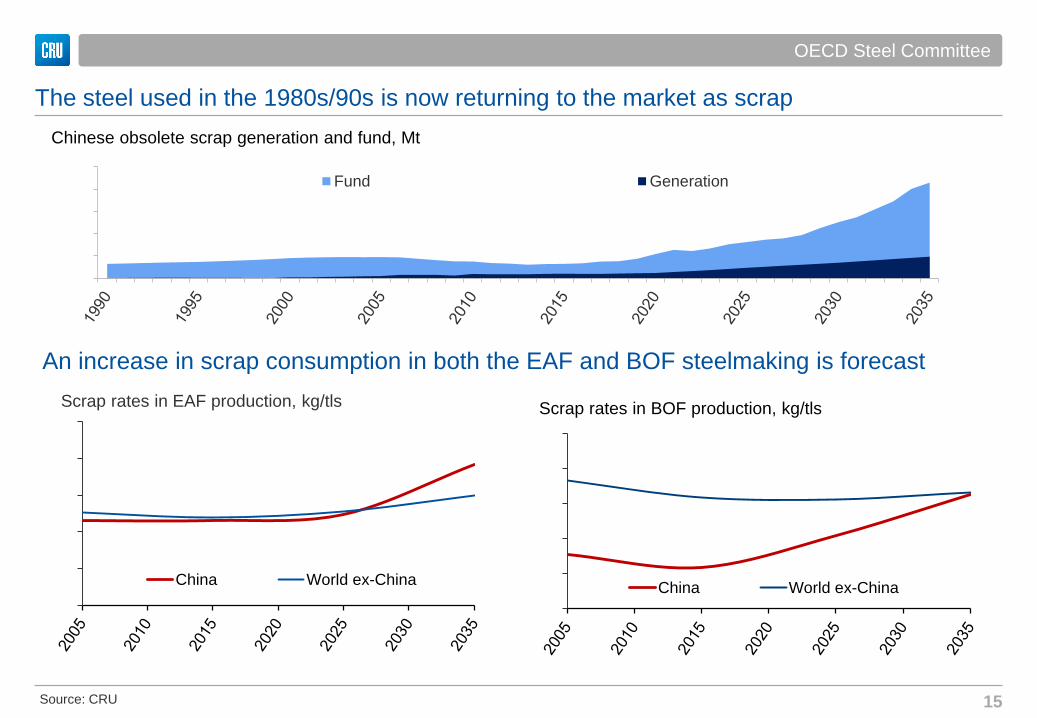
The steel used in the 1980s/90s is now returning to the market as scrap
0
300
600
900
1,200
1,500Fund Generation
Chinese obsolete scrap generation and fund, Mt
500
650
800
950
1,100
1,250
China World ex-China
Scrap rates in EAF production, kg/tls
0
60
120
180
240
300
China World ex-China
Scrap rates in BOF production, kg/tls
An increase in scrap consumption in both the EAF and BOF steelmaking is forecast
OECD Steel Committee
Source: CRU
Page 16
16
End of boom times for hot metal production and iron ore and met. coal demand
0
240
480
720
960
1,200
1,440
1,680
RoW India China
Global hot metal production, Mt
This is a negative for the miners
What does this mean for steel
producers?
China’s hot metal production falls at a faster rate
than crude steel due to increasing scrap use
OECD Steel Committee
Source: CRU, WSA
Page 17
17
Agenda
• Recent trends for the bulks
• Snapshot of base case long-run forecasts
• 4 key trends to watch: influence of Chinese government on supply
• Why are these trends important?
• Conclusion
OECD Steel Committee
Page 18
18
Chinese domestic production is critical for the market balance (and price) for both bulks
0
50
100
150
200
250
300
350
400
450
500
0
20
40
60
80
100
120
140
160
180
2000 2001 2002 2003 2004 2005 2006 2007 2008 2009 2010 2011 2012 2013 2014 2015 2016
Iron ore price Chinese domestic iron ore production
Historical relationship between price and Chinese domestic production
Chin
ese
do
me
stic
iron
ore
pro
du
ctio
n, M
t Iron
ore
price
, $
/t
0 50 100 150 200 250
China
Indonesia
Iran
Mexico
Other Africa
Russia
South Africa
Ukraine
USA
Iron ore supply exits by country, 2013 -2016
Production idled in Australia and Brazil
(combined) in 2016 was well below China’s
volume of exits
OECD Steel Committee
Source: CRU
Page 19
(3)
(2)
(1)
0
1
2
0
2
4
6
8
Production m/m change
LHS: Yangquan coal production, Mt
RHS: Yangquan coal production, m/m change, Mt
(3)
(2)
(1)
0
1
0
2
4
6
8
10
Production m/m change
LHS: Shanxi Coking Coal Group coal production, Mt
RHS: Shanxi Coking Coal Group coal production, m/m change, Mt
Policies to reduce coal production lately have had a dramatic impact on coking coal prices
There is high uncertainty over future policies. Met. coal is likely to be more impacted than iron ore.
OECD Steel Committee
Page 20
20
Agenda
• Recent trends for the bulks
• Snapshot of base case long-run forecasts
• 4 key trends to watch: steel industry restructuring in China
• Why are these trends important?
• Conclusion
OECD Steel Committee
Page 21
21
Restructuring of the Chinese steel industry means a switch to medium-sized blast furnaces
0
100
200
300
400
500
600
700
800
900
1,000Number of blast furnaces in China by size
>4,000 m3 3,000-4,000 m3 2,000-3,000 m3
1,000-2,000 m3 <1,000 m3
0
50
100
150
200
250
300
350
400
450
Pellet rate in China, kg/thm
Outdated
Environmentally un-friendly
Inefficient
….steel capacity is being, and will continue to be, closed
• A focus on productivity drives greater demand
for higher quality blast furnace inputs
• This is a positive for producers of high grade
iron ore products
OECD Steel Committee
Source: CRU
Page 22
22
European blast furnace data demonstrates increased pellet rates aiding higher PCI use
0
50
100
150
200
250
300
0 100 200 300 400 500 600 700 800
Working Volume
x-axis: pellet rate, kg/thm y-axis: PCI rate, kg/thm Bubble size: working volume, m3
OECD Steel Committee
Source: CRU
Page 23
23
Agenda
• Recent trends for the bulks
• Snapshot of base case long-run forecasts
• 4 key trends to watch: flattening and lower of industry cost curves
• Why are these trends important?
• Conclusion
OECD Steel Committee
Page 24
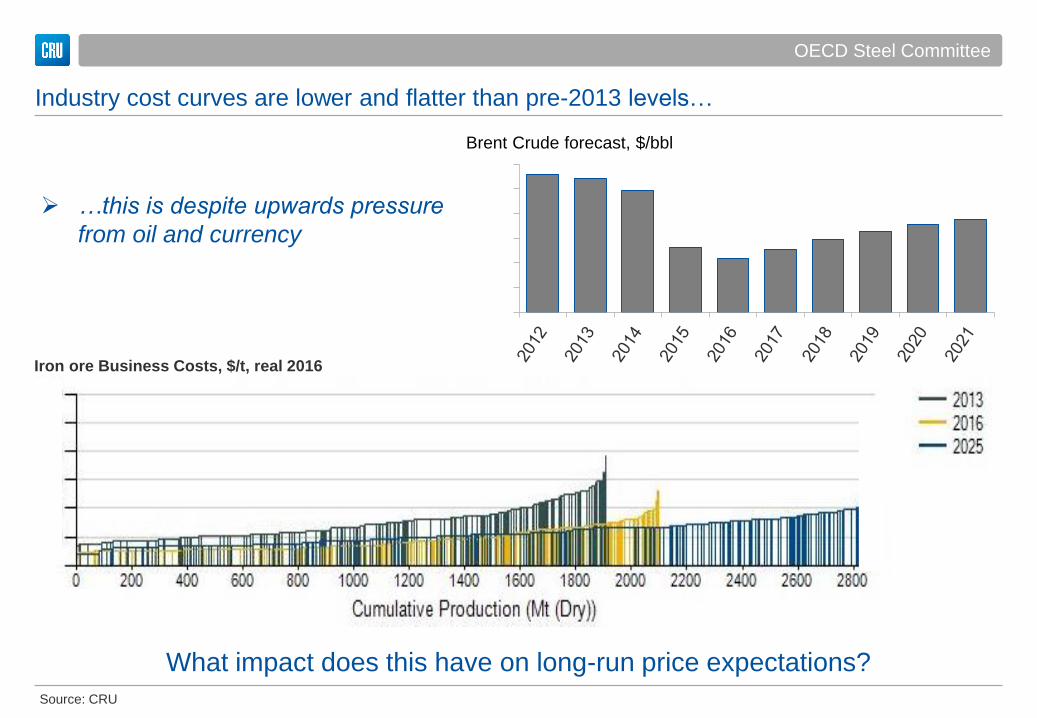
Industry cost curves are lower and flatter than pre-2013 levels…
Iron ore Business Costs, $/t, real 2016
0
20
40
60
80
100
120
Brent Crude forecast, $/bbl
…this is despite upwards pressure
from oil and currency
What impact does this have on long-run price expectations?
OECD Steel Committee
Source: CRU
Page 25
25
Agenda
• Recent trends for the bulks
• Snapshot of base case long-run forecasts
• 4 key trends to watch
• Why are these trends important?
• Conclusion
OECD Steel Committee
Page 26
26
Summary: what do these key trends mean for the bulks markets and for steel?
• Scrap lower demand for raw materials, lower prices
for raw materials, lower input costs for steel
• Chinese domestic mining industry volatility
(scenario analysis!)
• Rationalisation of Chinese steel sector (environmental
trigger) change in demand for different raw
materials product segments
• Lower industry costs and a flatter curve lower
steady-state prices, an end to 70% EBITDA margins
(iron ore), slower supply response, lower input costs
for steel compared to early 2010s levels
OECD Steel Committee
Page 27
27
Our value proposition
Recognition We have a reputation as the foremost name in metals, minerals
and fertilizers consulting and analysis
Independence
We are privately owned and not associated with any producer, consumer, financial community or other stakeholder interest in the industry.
Industry knowledge
Our business is mining, metals and fertilizers and we have been active in this field for over 45 years. You do not pay us to ascend the industry learning curve.
Our people
Our consultants and analysts are subject matter experts within your industry, supported by rigorous economic analysis.
Speed of response
Through CRU Analysis we have existing data and models that can rapidly be customised. Our team is dedicated to single client work
Global presence
We have offices in the key regions – Europe, North & South America, China, India, and Australia
OECD Steel Committee
Page 28
Thank you for listening
28
If you have any questions, please don’t hesitate to contact us:
Laura Brooks
Principal Consultant, CRU Consulting
e: [email protected]
t: +44 (0) 20 7903 2239
Matthew Poole
Head of Ferrous, CRU Consulting
e: [email protected]
t: +44 (0) 20 7903 2179
OECD Steel Committee