48
June 2009 Crude Oil Forecast, Markets & Pipeline Expansions (A47595)
Crude Oil Forecast, Markets & Pipeline Expansions 1
June 2009
Crude OilForecast, Markets & Pipeline Expansions
(A47595)

2 Canadian assOCiatiOn OF PEtrOlEuM PrOduCErs
(A47595)

Crude Oil Forecast, Markets & Pipeline Expansions i
EXECUTIVE SUMMARY For several years, the forecasted growth in Canadian crude oil supply, primarily due to the development of the Alberta oil sands, led industry to conclude there was an urgent need for additional pipeline capacity to connect to new and expanded markets. Growth in crude oil supply is still being forecast; only at a slower rate than previously anticipated. While access to markets remains an important consideration for producers, the need for additional pipeline capacity has been tempered by a lower outlook for supply growth and significant new pipeline capacity now underway.
On average, current oil prices are significantly lower than in recent years. The economic downturn in major market areas has also impacted the industry and the global financial crisis has hindered the ability of companies to acquire investment capital. In line with a lower forecasted growth in crude oil supply, a lower growth in market demand is also anticipated given the economic downturn and the fact that refinery conversions and expansions are proceeding at a slower pace.
0
1,000
2,000
3,000
4,000
5,000thousand barrels per day
Actual Forecast
2005 2007 2009 2011 2013 2015 2017 2019 2021 2023 2025
June '08 ModerateGrowth Forecast
Atlantic Canada
Conventional HeavyConventional LightPentanes
Oil Sands Growth
Oil Sands Operating & In Construction
Canadian Oil Sands & Conventional Production
Canadian Crude Oil Production and SupplyCAPP conducted a survey of oil sands producers in early 2009 to determine their plans for production of both bitumen and upgraded crude oil for the period from 2009 to 2025. From this data, CAPP has prepared a “Growth Case” and an “Operating & In Construction Case.” The Growth Case represents the expected outlook, which assumes the current investment climate will improve over time. The Operating & In Construction Case, a more conservative outlook, only includes projects that are currently in operation or are under construction. As such, this latter case represents a minimum potential growth outlook from the oil sands. The forecast for Canadian crude oil production under both cases is shown in the following table.
Canadian Crude Oil Production
million b/d 2008 2015 2020 2025
Growth 2.72 3.29 4.00 4.17
Operating & In Construction
2.72 3.02 3.03 2.84
In the Operating & In Construction Case, production is forecast at only 2.8 million b/d by 2025 due to the decline in conventional production. Although conventional production as a whole is expected to decline gradually, this rate of decline is offset somewhat by an increase in light crude oil production from the Bakken field in Saskatchewan, which is expected to exhibit strong growth in the next few years. Later in the forecast, the Hebron heavy oil project in Atlantic Canada is expected to come on stream by 2017.
(A47595)
ii Canadian assOCiatiOn OF PEtrOlEuM PrOduCErs
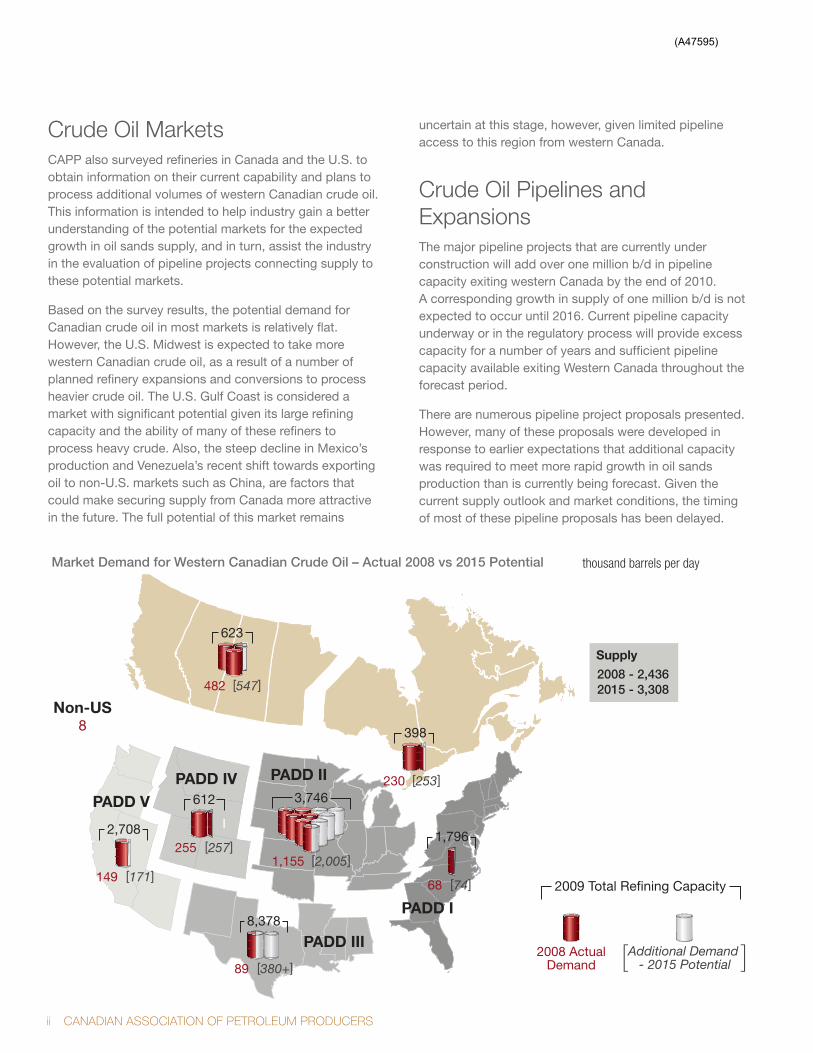
Crude Oil Markets CAPP also surveyed refineries in Canada and the U.S. to obtain information on their current capability and plans to process additional volumes of western Canadian crude oil. This information is intended to help industry gain a better understanding of the potential markets for the expected growth in oil sands supply, and in turn, assist the industry in the evaluation of pipeline projects connecting supply to these potential markets.
Based on the survey results, the potential demand for Canadian crude oil in most markets is relatively flat. However, the U.S. Midwest is expected to take more western Canadian crude oil, as a result of a number of planned refinery expansions and conversions to process heavier crude oil. The U.S. Gulf Coast is considered a market with significant potential given its large refining capacity and the ability of many of these refiners to process heavy crude. Also, the steep decline in Mexico’s production and Venezuela’s recent shift towards exporting oil to non-U.S. markets such as China, are factors that could make securing supply from Canada more attractive in the future. The full potential of this market remains
uncertain at this stage, however, given limited pipeline access to this region from western Canada.
Crude Oil Pipelines and ExpansionsThe major pipeline projects that are currently under construction will add over one million b/d in pipeline capacity exiting western Canada by the end of 2010. A corresponding growth in supply of one million b/d is not expected to occur until 2016. Current pipeline capacity underway or in the regulatory process will provide excess capacity for a number of years and sufficient pipeline capacity available exiting Western Canada throughout the forecast period.
There are numerous pipeline project proposals presented. However, many of these proposals were developed in response to earlier expectations that additional capacity was required to meet more rapid growth in oil sands production than is currently being forecast. Given the current supply outlook and market conditions, the timing of most of these pipeline proposals has been delayed.
PADD II
PADD I
PADD V
PADD III
68 [74]
89 [380+]
3,746
1,155 [2,005]
482 [547]
623
2,708
Non-US8
149 [171]
230 [253]
Supply
2008 - 2,4362015 - 3,308
1,796
8,378
398
PADD IV
255 [257]
612
2009 Total Refining Capacity
2008 ActualDemand
Additional Demand - 2015 Potential
Market Demand for Western Canadian Crude Oil – Actual 2008 vs 2015 Potential thousand barrels per day
(A47595)
Crude Oil Forecast, Markets & Pipeline Expansions iii
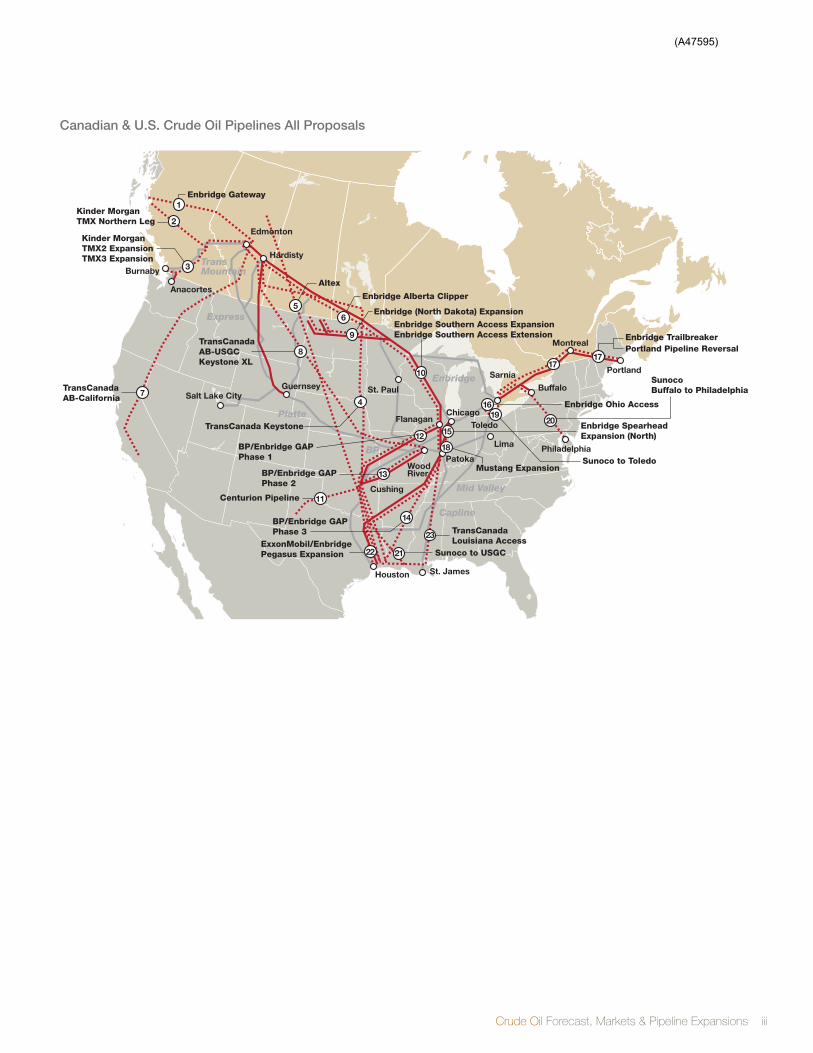
Canadian & U.S. Crude Oil Pipelines All Proposals
Portland
Montreal
Sarnia
Buffalo
Philadelphia
Toledo
Lima
Chicago
Patoka
Cushing
St. PaulSalt Lake City
St. JamesHouston
Edmonton
Anacortes
Burnaby
TransCanada Keystone
BP/Enbridge GAPPhase 1
BP/Enbridge GAP Phase 2
BP/Enbridge GAP Phase 3
Altex
Enbridge Southern Access ExpansionEnbridge Southern Access Extension
TransCanadaLouisiana Access
Mustang Expansion
Enbridge Alberta Clipper
TransMountain
BP
Enbridge
Mid Valley
Capline
Flanagan
WoodRiver
Hardisty
Centurion Pipeline
ExxonMobil/EnbridgePegasus Expansion
Enbridge SpearheadExpansion (North)
Express
Platte
Guernsey
Enbridge Gateway1
Kinder MorganTMX2 ExpansionTMX3 Expansion
2
3
Kinder MorganTMX Northern Leg
56
Enbridge (North Dakota) Expansion
9TransCanadaAB-USGCKeystone XL
8
TransCanadaAB-California 7
22 Sunoco to USGC21
23
18
10
15
4 Enbridge Ohio Access16
Sunoco to Toledo
19
14
13
12
11
SunocoBuffalo to Philadelphia
20
17
Enbridge TrailbreakerPortland Pipeline Reversal
17
Canadian & U.S. Crude Oil Pipelines All Proposals
(A47595)

iv Canadian assOCiatiOn OF PEtrOlEuM PrOduCErs
TABLE OF CONTENTSExECUtivE SUMMAry i
LiSt Of figUrES AnD tAbLES v
1 intrODUCtiOn 1
2 CrUDE OiL PrODUCtiOn AnD SUPPLy fOrECASt 2
2.1 Canadian Crude Oil Production 2
2.2 Western Canadian Crude Oil Production 3
2.2.1 Oil Sands 3
2.2.2 Conventional Crude Oil Production 5
2.3 Western Canadian Crude Oil Supply 6
2.4 Methodology 7
2.5 Production and Supply Summary 8
3 CrUDE OiL MArkEtS 9
3.1 Canada 10
3.1.1 Western Canada 10
3.1.2 Ontario 10
3.1.3 Québec 10
3.2 United States 11
3.2.1 PADD I (East Coast) 11
3.2.2 PADD II (Midwest) 12
3.2.3 PADD III (Gulf Coast) 14
3.2.4 PADD IV (Rockies) 15
3.2.5 PADD V (West Coast) 15
3.3 Asia 17
3.4 Methodology 17
3.5 Markets Summary 18
4 CrUDE OiL PiPELinES 19
4.1 Major Crude Oil Pipelines 19
4.1.1 Existing Major Crude Oil Pipelines 19
4.2 Crude Oil Transportation Requirements 21
4.3 Crude Oil Pipeline Expansions/Proposals 22
4.3.1 Crude Oil Pipeline Expansions/Proposals to the U.S. Midwest, Ontario, Québec and the East Coast 22
4.3.2 Crude Oil Pipeline Expansions/Proposals to the U.S. Gulf Coast 25
4.3.3 Crude Oil Pipeline Expansions/Proposals to the West Coast 27
4.3.4 Other Proposals 28
4.3.5 Diluent Pipeline Proposals 29
4.4 Pipeline Summary 29
Glossary 30
aPPENDIX a: acronyms, abbreviations, Units and Conversion Factors 32
aPPENDIX B: CaPP Canadian Crude oil Production and supply Forecast 2009 – 2025 33
aPPENDIX C: Canadian and U.s. Crude oil Pipeline Expansions/Proposals 37
aPPENDIX D: Crude oil Pipelines and refineries 39
(A47595)

Crude Oil Forecast, Markets & Pipeline Expansions v
LIST OF FIgURES ANd TABLESFiguresFigure 2.1 Canadian Oil Sands & Conventional Production 3
Figure 2.2 Oil Sands Regions 4
Figure 2.3 Growth Case - Western Canada Oil Sands & Conventional Production 4
Figure 2.4 Operating & In Construction - Western Canada Oil Sands & Conventional Production 5
Figure 2.5 Growth Case - Western Canada Oil Sands & Conventional Supply 7
Figure 2.6 Operating & In Construction - Western Canada Oil Sands & Conventional Supply 8
Figure 3.1 Market Demand for Western Canadian Crude Oil – 2008 Actual vs 2015 Potential 9
Figure 3.2 Western Canada: Forecast Western Canadian Crude Oil Receipts 10
Figure 3.3 Ontario: Forecast Western Canadian Crude Oil Receipts 10
Figure 3.4 Petroleum Administration for Defense Districts 11
Figure 3.5 2008 PADD I: Foreign Sourced Supply by Type and Domestic Crude Oil 11
Figure 3.6 2008 PADD II: Foreign Sourced Supply by Type and Domestic Crude Oil 12
Figure 3.7 PADD II (North): Forecast Western Canadian Crude Oil Receipts 12
Figure 3.8 PADD II (East): Forecast Western Canadian Crude Oil Receipts 13
Figure 3.9 PADD II (South): Forecast Western Canadian Crude Oil Receipts 14
Figure 3.10 2008 PADD III: Foreign Sourced Supply by Type and Domestic Crude Oil 14
Figure 3.11 PADD IV: Forecast Western Canadian Crude Oil Receipts 15
Figure 3.12 2008 PADD V: Foreign Sourced Supply by Type and Domestic Crude Oil 16
Figure 3.13 Washington: Forecast Western Canadian Crude Oil Receipts 16
Figure 3.14 2008 PADD V (California): Foreign Sourced Supply by Type and Domestic Crude Oil 17
Figure 4.1 Current Crude Oil Expansions from Western Canada 21
Figure 4.2 Pipeline Proposals to the U.S. Midwest, Ontario and U.S. East Coast 22
Figure 4.3 Pipeline Proposals to the U.S. Gulf Coast 25
Figure 4.4 Pipeline Proposals to U.S. West Coast 27
Figure 4.5 Diluent Pipeline Proposals 28
TablesTable 2.1 Canadian Crude Oil Production 2
Table 2.2 Western Canadian Crude Oil Production 3
Table 2.3 Western Canadian Crude Oil Supply 6
Table 3.1 Summary of Major Announced Refinery Upgrades in Eastern PADD II 13
Table 3.2 Summary of Major Announced Refinery Upgrades in PADD III 15
Table 3.3 Total Oil Product Demand in Major Asian Countries 17
Table 4.1 Approved Oil Pipeline Expansions from Western Canada 21
(A47595)
1 Canadian assOCiatiOn OF PEtrOlEuM PrOduCErs
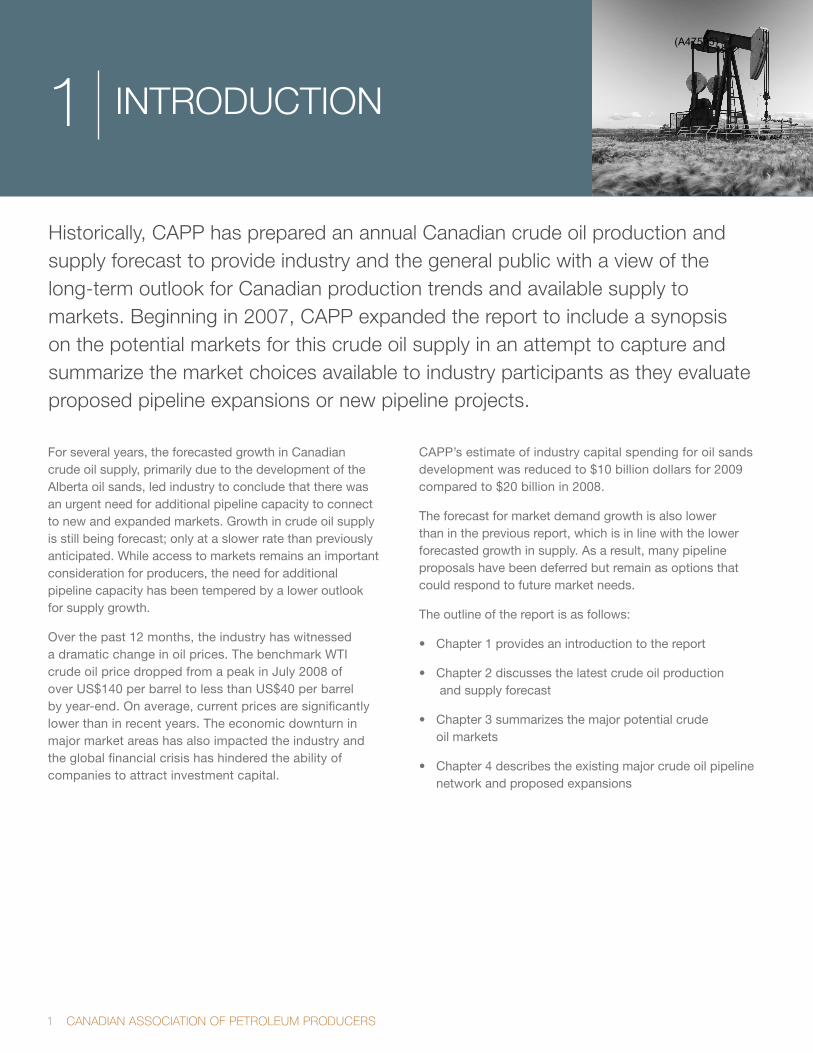
INTROdUCTION
Historically, CAPP has prepared an annual Canadian crude oil production and supply forecast to provide industry and the general public with a view of the long-term outlook for Canadian production trends and available supply to markets. Beginning in 2007, CAPP expanded the report to include a synopsis on the potential markets for this crude oil supply in an attempt to capture and summarize the market choices available to industry participants as they evaluate proposed pipeline expansions or new pipeline projects.
1
For several years, the forecasted growth in Canadian crude oil supply, primarily due to the development of the Alberta oil sands, led industry to conclude that there was an urgent need for additional pipeline capacity to connect to new and expanded markets. Growth in crude oil supply is still being forecast; only at a slower rate than previously anticipated. While access to markets remains an important consideration for producers, the need for additional pipeline capacity has been tempered by a lower outlook for supply growth.
Over the past 12 months, the industry has witnessed a dramatic change in oil prices. The benchmark WTI crude oil price dropped from a peak in July 2008 of over US$140 per barrel to less than US$40 per barrel by year-end. On average, current prices are significantly lower than in recent years. The economic downturn in major market areas has also impacted the industry and the global financial crisis has hindered the ability of companies to attract investment capital.
CAPP’s estimate of industry capital spending for oil sands development was reduced to $10 billion dollars for 2009 compared to $20 billion in 2008.
The forecast for market demand growth is also lower than in the previous report, which is in line with the lower forecasted growth in supply. As a result, many pipeline proposals have been deferred but remain as options that could respond to future market needs.
The outline of the report is as follows:
• Chapter1providesanintroductiontothereport
• Chapter2discussesthelatestcrudeoilproduction and supply forecast
• Chapter3summarizesthemajorpotentialcrude oil markets
• Chapter4describestheexistingmajorcrudeoilpipelinenetwork and proposed expansions
(A47595)

Crude Oil Forecast, Markets & Pipeline Expansions 2
CAPP conducted a survey of oil sands producers in early 2009 to determine their planned production of bitumen and upgraded crude oil for the period from 2009 to 2025. These results were subsequently adjusted to reflect: the historical performance trends of oil sands projects following start up, the status of projects, and potential labour and capital constraints. The majority of oil sands projects, particularly in situ, are executed in multiple phases. Historically, in situ projects require some time to ramp up to capacity while new mining projects typically require some fine tuning before full capacity is maintained on a consistent basis. From this data, CAPP has prepared a “Growth Case”, representing the expected outlook which assumes the eventual return of higher oil prices and investment activity. In addition, a lower forecast has also been prepared using the same risk factors but includes only projects currently in operation or under construction. This latter case represents a minimum potential growth from the oil sands.
2.1 Canadian Crude Oil ProductionWestern Canadian crude oil production averaged 2.4 million b/d in 2008 and is projected to grow significantly over the forecast period due to development of the oil sands. On the conventional side, both light and heavy production in the WCSB is declining. Production in Atlantic Canada is expected to grow in 2017 with the expected start of production from the Hebron heavy oil project.
In 2008, production in Atlantic Canada was 342,000 b/d, which accounted for about 13 percent of total Canadian crude oil production of 2.7 million b/d.
table 2.1 Canadian Crude Oil Production
million b/d 2008 2015 2020 2025
Growth 2.72 3.29 4.00 4.17
Operating & In Construction 2.72 3.02 3.03 2.84
Table 2.1 shows the forecast for Canadian crude oil production under the Growth Case and the “Operating & In-Construction” Case. In latter case, the production is forecast at only 2.8 million b/d by 2025 due to the decline in conventional production (Figure 2.1).
CRUdE OIL PROdUCTION ANd SUPPLY FORECAST2
According to the Oil and gas Journal, Canada has total proven oil reserves of over 178 billion barrels. The two major oil producing areas in Canada are the Western Canada Sedimentary Basin (WCSB) and Atlantic Canada. While CAPP has included a forecast of production from Atlantic Canada in this report, the primary focus will be on production from Western Canada since most of the growth in oil production is expected to be derived from the oil sands areas located primarily in the western province of Alberta.
(A47595)

3 Canadian assOCiatiOn OF PEtrOlEuM PrOduCErs
2.2 Western Canadian Crude Oil ProductionIn 2008, over 87 percent of all Canadian crude oil production came from Western Canada.
Western Canadian crude oil production is comprised of conventional oil and oil sands production. In 2006, oil sands production reached over 1.1 million b/d and surpassed conventional crude oil production for the first time. Table 2.2 shows the forecast for total western Canadian crude oil production in both cases.
table 2.2 Western Canadian Crude Oil Production
million b/d 2008 2015 2020 2025
Growth 2.38 3.16 3.78 4.05
Operating & In Construction 2.38 2.89 2.81 2.72
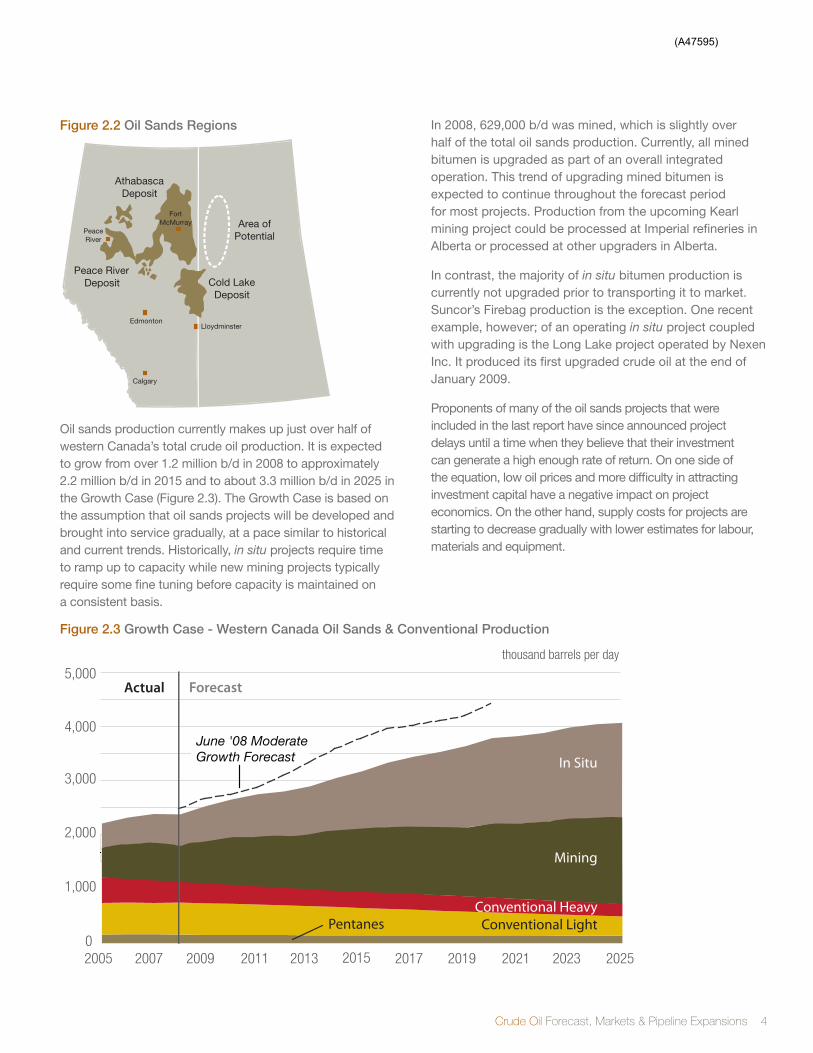
2.2.1 Oil SandsThe three main oil sands deposits are located in the Peace River, Athabasca and Cold Lake areas in the province of Alberta (Figure 2.2). The Alberta Energy Resources and Conservation Board (ERCB) has designated three geological zones for the major oil sands areas and estimated that these areas contain an ultimate recoverable resource of 315 billion barrels, with remaining established reserves of 173 billion barrels at year-end 2007. There are also smaller deposits in northwest Saskatchewan, next to the Athabasca oil sands deposit. The Saskatchewan Ministry of Energy and Resources has estimated 2.7 million hectares of potential land but the resource base has not been officially determined.
Bitumen is produced from the oil sands by mining and extraction, in situ thermal recovery and in situ non-thermal recovery. In areas where the oil is located near the surface, open-pit mining is the most efficient method. However, to recover oil that is located further below the surface, in situ techniques are employed. Common in situ thermal extraction techniques include Steam Assisted Gravity Drainage (SAGD) and Cyclic Steam Stimulation (CSS). Of the remaining established reserves, 142 billion barrels, or 82 percent, is considered recoverable by in situ methods and 31 billion barrels from surface mining.
0
1,000
2,000
3,000
4,000
5,000thousand barrels per day
Actual Forecast
2005 2007 2009 2011 2013 2015 2017 2019 2021 2023 2025
June '08 ModerateGrowth Forecast
Atlantic Canada
Conventional HeavyConventional LightPentanes
Oil Sands Growth
Oil Sands Operating & In Construction
figure 2.1 Canadian Oil Sands & Conventional Production
(A47595)
Crude Oil Forecast, Markets & Pipeline Expansions 4
figure 2.2 Oil Sands regions
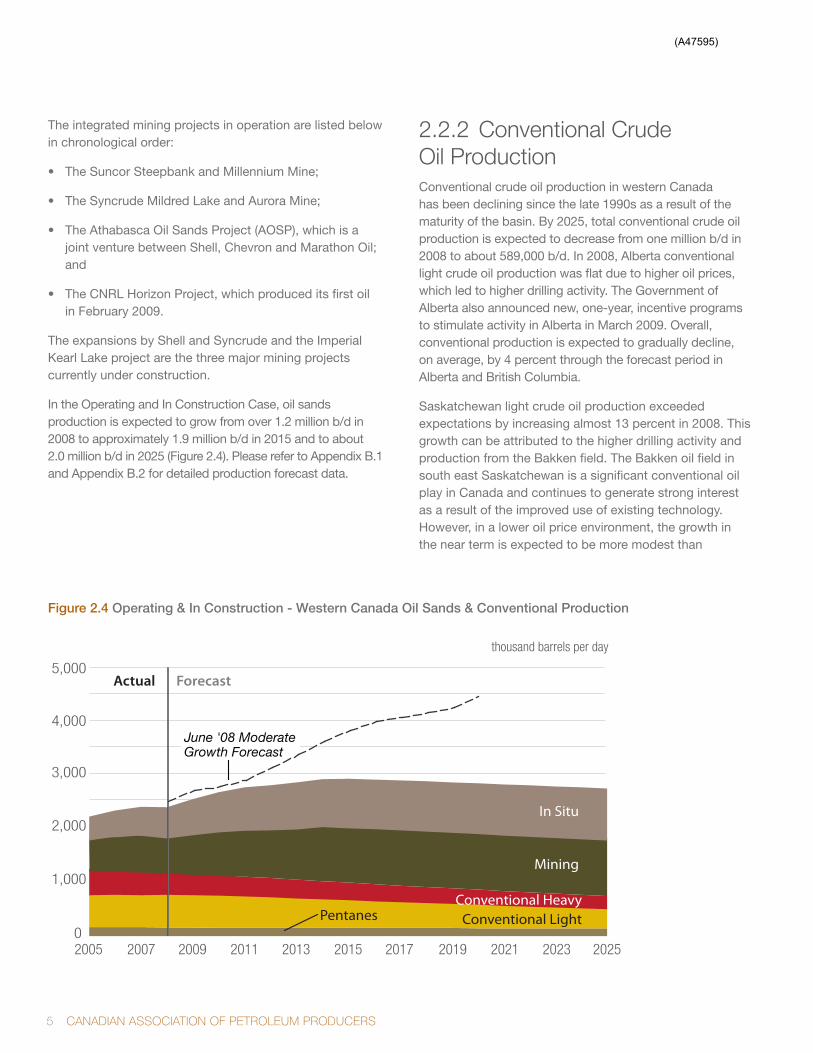
Oil sands production currently makes up just over half of western Canada’s total crude oil production. It is expected to grow from over 1.2 million b/d in 2008 to approximately 2.2 million b/d in 2015 and to about 3.3 million b/d in 2025 in the Growth Case (Figure 2.3). The Growth Case is based on the assumption that oil sands projects will be developed and brought into service gradually, at a pace similar to historical and current trends. Historically, in situ projects require time to ramp up to capacity while new mining projects typically require some fine tuning before capacity is maintained on a consistent basis.
In 2008, 629,000 b/d was mined, which is slightly over half of the total oil sands production. Currently, all mined bitumen is upgraded as part of an overall integrated operation. This trend of upgrading mined bitumen is expected to continue throughout the forecast period for most projects. Production from the upcoming Kearl mining project could be processed at Imperial refineries in Alberta or processed at other upgraders in Alberta.
In contrast, the majority of in situ bitumen production is currently not upgraded prior to transporting it to market. Suncor’s Firebag production is the exception. One recent example, however; of an operating in situ project coupled with upgrading is the Long Lake project operated by Nexen Inc. It produced its first upgraded crude oil at the end of January 2009.
Proponents of many of the oil sands projects that were included in the last report have since announced project delays until a time when they believe that their investment can generate a high enough rate of return. On one side of the equation, low oil prices and more difficulty in attracting investment capital have a negative impact on project economics. On the other hand, supply costs for projects are starting to decrease gradually with lower estimates for labour, materials and equipment.
2005 2007 2009 2011 2013 2015 2017 2019 2021 2023 2025
Actual Forecast
In Situ
Mining
Conventional HeavyConventional LightPentanes
thousand barrels per day
June '08 ModerateGrowth Forecast
0
1,000
2,000
3,000
4,000
5,000
Edmonton
Calgary
Lloydminster
Peace River
Fort McMurray Area of
Potential
Athabasca Deposit
Cold Lake Deposit
Peace River Deposit
figure 2.3 growth Case - Western Canada Oil Sands & Conventional Production
(A47595)
5 Canadian assOCiatiOn OF PEtrOlEuM PrOduCErs
The integrated mining projects in operation are listed below in chronological order:
• TheSuncorSteepbankandMillenniumMine;
• TheSyncrudeMildredLakeandAuroraMine;
• TheAthabascaOilSandsProject(AOSP),whichisajoint venture between Shell, Chevron and Marathon Oil; and
• TheCNRLHorizonProject,whichproduceditsfirstoil in February 2009.
The expansions by Shell and Syncrude and the Imperial Kearl Lake project are the three major mining projects currently under construction.
In the Operating and In Construction Case, oil sands production is expected to grow from over 1.2 million b/d in 2008 to approximately 1.9 million b/d in 2015 and to about 2.0 million b/d in 2025 (Figure 2.4). Please refer to Appendix B.1 and Appendix B.2 for detailed production forecast data.
2.2.2 Conventional Crude Oil ProductionConventional crude oil production in western Canada has been declining since the late 1990s as a result of the maturity of the basin. By 2025, total conventional crude oil production is expected to decrease from one million b/d in 2008 to about 589,000 b/d. In 2008, Alberta conventional light crude oil production was flat due to higher oil prices, which led to higher drilling activity. The Government of Alberta also announced new, one-year, incentive programs to stimulate activity in Alberta in March 2009. Overall, conventional production is expected to gradually decline, on average, by 4 percent through the forecast period in Alberta and British Columbia.
Saskatchewan light crude oil production exceeded expectations by increasing almost 13 percent in 2008. This growth can be attributed to the higher drilling activity and production from the Bakken field. The Bakken oil field in south east Saskatchewan is a significant conventional oil play in Canada and continues to generate strong interest as a result of the improved use of existing technology. However, in a lower oil price environment, the growth in the near term is expected to be more modest than
2005 2007 2009 2011 2013 2015 2017 2019 2021 2023 2025
thousand barrels per day
0
1,000
2,000
3,000
4,000
5,000Actual Forecast
June '08 ModerateGrowth Forecast
In Situ
Mining
Conventional HeavyConventional LightPentanes
figure 2.4 Operating & in Construction - Western Canada Oil Sands & Conventional Production
(A47595)
Crude Oil Forecast, Markets & Pipeline Expansions 6
in recent experience. The decline in heavy crude oil production in Saskatchewan has been offset somewhat by the production from the Lower Shaunavon field.
In Manitoba, production rose 6 percent in 2008. However, it should be noted that the Sinclair field, which was designated in 2005, and was the first major discovery in Manitoba in many years, accounted for 30 percent of the province’s crude oil production. Production is expected to start declining within the next 2 years as the field matures.
2.3 Western Canadian Crude Oil SupplyOf particular interest to market participants is the supply of actual crude oil types that will be available from initial production. On a volumetric basis, supply is greater than production because supply includes pentanes/condensate volumes that have been imported to supplement the locally produced volumes of condensate for use as diluent. Diluent is necessary in order to transport the non-upgraded bitumen production to market.
The CAPP forecast categorizes the various crude oil types that comprise western Canadian crude oil supply into four major categories: Conventional Light, Conventional Heavy, Upgraded Light and Bitumen Blend. The “Bitumen Blend” category includes upgraded heavy sour crude, bitumen diluted with upgraded light crude oil (also known as “SynBit”) and bitumen diluted with condensate (also known as “Dilbit”). The most common form of Bitumen Blend is bitumen blended with a standard condensate such as pentanes plus, which is mainly recovered from processing natural gas, to create a type of crude oil that meets pipeline specifications for density and viscosity. An example of such a Dilbit would be Cold Lake crude oil, which has a density of about 930 kg/m3 (21° API) and a sulfur content of 3.6 percent.
As discussed above, the main source of diluent is natural gas condensates that are produced in western Canada. However, this diluent supply has not been sufficient to meet the needs of growing bitumen production. Companies imported over 60,000 b/d of diluent into Alberta by rail in 2008. To meet growing demand for diluent, Enbridge is building the Southern Lights diluent pipeline from Chicago to Alberta. The pipeline will have an initial capacity of 180,000 b/d and is expected to be in service in July 2010. Demand for condensate imports will exceed the initial capacity of this pipeline by 2015 in the Growth Case.
Subsequently, rail and truck imports could be used to increase the condensate supply available to market in the interim. Potential longer-term solutions include blending more upgraded light crude oil with bitumen or the consideration of additional diluent pipeline options.
It should be noted that this latest forecast incorporates the fact that fewer companies reported an intention to use upgraded synthetic crude oil as a source of diluent this year than in the past. Blending with a traditional condensate diluent requires a 70:30 bitumen to condensate ratio. When upgraded light crude is used as the diluent, the blending ratio is approximately 50:50.
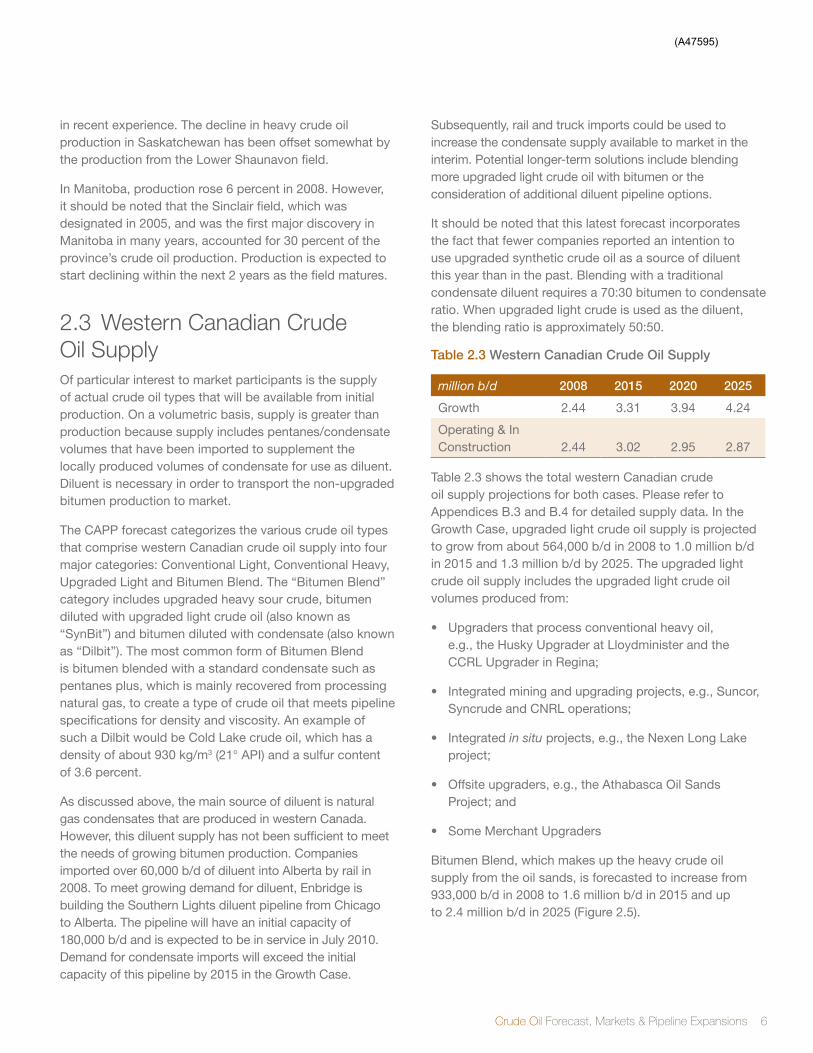
table 2.3 Western Canadian Crude Oil Supply
million b/d 2008 2015 2020 2025
Growth 2.44 3.31 3.94 4.24
Operating & In Construction 2.44 3.02 2.95 2.87
Table 2.3 shows the total western Canadian crude oil supply projections for both cases. Please refer to Appendices B.3 and B.4 for detailed supply data. In the Growth Case, upgraded light crude oil supply is projected to grow from about 564,000 b/d in 2008 to 1.0 million b/d in 2015 and 1.3 million b/d by 2025. The upgraded light crude oil supply includes the upgraded light crude oil volumes produced from:
• Upgradersthatprocessconventionalheavyoil, e.g., the Husky Upgrader at Lloydminister and the CCRL Upgrader in Regina;
• Integratedminingandupgradingprojects,e.g.,Suncor,Syncrude and CNRL operations;
• Integratedin situ projects, e.g., the Nexen Long Lake project;
• Offsiteupgraders,e.g.,theAthabascaOilSandsProject; and
• SomeMerchantUpgraders
Bitumen Blend, which makes up the heavy crude oil supply from the oil sands, is forecasted to increase from 933,000 b/d in 2008 to 1.6 million b/d in 2015 and up to 2.4 million b/d in 2025 (Figure 2.5).
(A47595)
7 Canadian assOCiatiOn OF PEtrOlEuM PrOduCErs
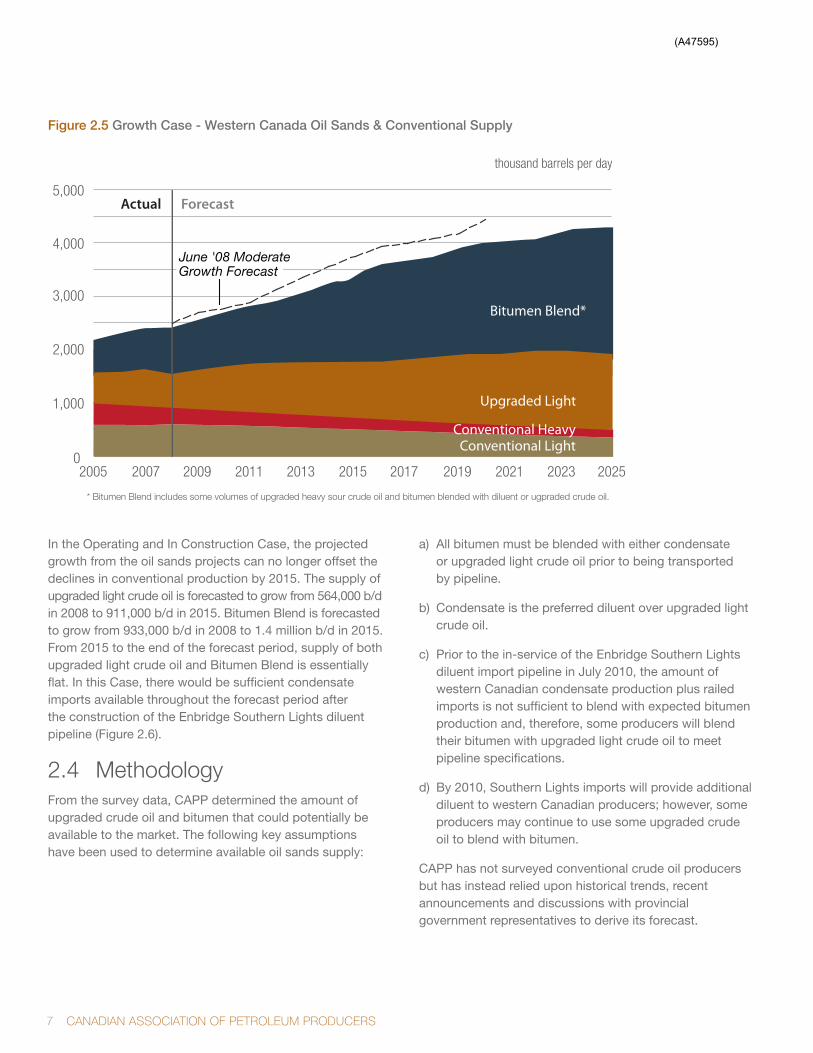
figure 2.5 growth Case - Western Canada Oil Sands & Conventional Supply
thousand barrels per day
Actual Forecast
Conventional Light
Bitumen Blend*
Upgraded Light
Conventional Heavy
* Bitumen Blend includes some volumes of upgraded heavy sour crude oil and bitumen blended with diluent or ugpraded crude oil.
June '08 ModerateGrowth Forecast
0
1,000
2,000
3,000
4,000
5,000
2005 2007 2009 2011 2013 2015 2017 2019 2021 2023 2025
In the Operating and In Construction Case, the projected growth from the oil sands projects can no longer offset the declines in conventional production by 2015. The supply of upgraded light crude oil is forecasted to grow from 564,000 b/d in 2008 to 911,000 b/d in 2015. Bitumen Blend is forecasted to grow from 933,000 b/d in 2008 to 1.4 million b/d in 2015. From 2015 to the end of the forecast period, supply of both upgraded light crude oil and Bitumen Blend is essentially flat. In this Case, there would be sufficient condensate imports available throughout the forecast period after the construction of the Enbridge Southern Lights diluent pipeline (Figure 2.6).
2.4 MethodologyFrom the survey data, CAPP determined the amount of upgraded crude oil and bitumen that could potentially be available to the market. The following key assumptions have been used to determine available oil sands supply:
a) All bitumen must be blended with either condensate or upgraded light crude oil prior to being transported by pipeline.
b) Condensate is the preferred diluent over upgraded light crude oil.
c) Prior to the in-service of the Enbridge Southern Lights diluent import pipeline in July 2010, the amount of western Canadian condensate production plus railed imports is not sufficient to blend with expected bitumen production and, therefore, some producers will blend their bitumen with upgraded light crude oil to meet pipeline specifications.
d) By 2010, Southern Lights imports will provide additional diluent to western Canadian producers; however, some producers may continue to use some upgraded crude oil to blend with bitumen.
CAPP has not surveyed conventional crude oil producers but has instead relied upon historical trends, recent announcements and discussions with provincial government representatives to derive its forecast.
(A47595)

Crude Oil Forecast, Markets & Pipeline Expansions 8
2.5 Production and Supply SummaryMuch has changed over the last year. A number of oil sands projects have been deferred or cancelled due to factors including lower oil prices and challenges in attracting investment capital. CAPP’s latest forecast reflects the changed business environment and is consequently lower than its June 2008 Moderate Growth Case. The average annual growth rate in oil sands production is 6 percent over the forecast period. Current oil sands production of 1.2 million b/d is forecasted to increase to 2.2 million b/d in 2015 then to 3.3 million b/d by 2025.
Canadian conventional production is expected to decline gradually however; light crude oil production from the Bakken field in Saskatchewan is expected to grow in the next few years. Further out on the horizon, the Hebron heavy oil project in Atlantic Canada is expected to come on stream by 2017 thereby increasing crude oil supply in the region.
Actual Forecast
Conventional Light
Bitumen Blend*
Upgraded Light
Conventional Heavy
* Bitumen Blend includes some volumes of upgraded heavy sour crude oil and bitumen blended with diluent or ugpraded crude oil.
June '08 ModerateGrowth Forecast
0
1,000
2,000
3,000
4,000
5,000
2005 2007 2009 2011 2013 2015 2017 2019 2021 2023 2025
thousand barrels per day
figure 2.6 Operating & in Construction - Western Canada Oil Sands & Conventional Supply
(A47595)

9 Canadian assOCiatiOn OF PEtrOlEuM PrOduCErs
3
In addition to examining the prospects for crude oil production, it is useful to have an understanding of the potential market demand for the expected growth in oil sands supply. This assessment will, in turn, assist the industry in the evaluation of the various pipeline projects that are being proposed. In this context, CAPP surveyed refineries in Canada and the U.S. to obtain information on their current capability and plans to process additional volumes of western Canadian crude oil and, in particular, oil sands to 2015.
CRUdE OIL MARkETS
PADD II
PADD I
PADD V
PADD III
68 [74]
89 [380+]
3,746
1,155 [2,005]
482 [547]
623
2,708
Non-US8
149 [171]
230 [253]
Supply
2008 - 2,4362015 - 3,308
1,796
8,378
398
PADD IV
255 [257]
612
2009 Total Refining Capacity
2008 ActualDemand
Additional Demand - 2015 Potential
In 2008, total crude oil supply from western Canada was over 2.4 million b/d. Domestic demand for western Canadian crude oil was approximately 712,000 b/d and the remaining supply of over 1.7 million b/d or 70 percent was exported (Figure 3.1). The primary markets for western Canadian crude oil are currently: British Columbia; Alberta; Saskatchewan; Ontario; Minnesota; eastern PADD II
(particularly, Illinois, Indiana, Michigan, and Ohio); PADD IV; California and Washington in PADD V. Since the reversal of the Enbridge Spearhead pipeline and the ExxonMobil Pegasus pipeline in early 2006, western Canadian crude oil has flowed to the Cushing, Oklahoma hub and the U.S. Gulf Coast, respectively.
figure 3.1 Market Demand for Western Canadian Crude Oil – Actual 2008 vs 2015 Potential
thousand barrels per day
(A47595)

Crude Oil Forecast, Markets & Pipeline Expansions 10
3.1 CanadaCanadian refineries that have access to western Canadian crude oil have a total refining capacity of over one million b/d. In 2008, these refineries processed about 712,000 b/d of western Canadian crude oil. This is expected to increase to approximately 788,000 b/d by 2015 with planned refinery expansions.
3.1.1 Western Canada There are eight refineries located in western Canada with a total refining capacity of about 622,500 b/d. These refineries process western Canadian crude oil exclusively. The Moose Jaw asphalt plant in Moose Jaw, Saskatchewan produces mostly asphalt while other refineries manufacture a wide range of petroleum products. In 2008, they received 481,800 b/d of crude oil and this is expected to increase to 547,200 b/d in 2015 (Figure 3.2).
figure 3.2 Western Canada: forecast Western Canadian Crude Oil receipts
Receipts of conventional light sweet crude oil are expected to fall, in part due to the maturity of the basin as well as refinery conversions. Receipts of light synthetic and heavy crude oil are expected to increase throughout the forecast period.
Of note, the Petro-Canada conversion project at its Edmonton refinery has been completed; the refinery began to process 100 percent oil sands feedstock in January 2009. Also, there are plans for the Consumers’ Co-operative refinery located in Regina to expand by 30,000 b/d and to use some light synthetic crude oil as feedstock by 2012.
3.1.2 OntarioThere are four refineries (excluding the Nova Chemical refinery and petrochemical complex in Sarnia) located in Ontario with a total refining capacity of 398,000 b/d. These refineries process western Canadian crude oil as well as crude oil (foreign imports and Atlantic Canada production) that is received by tankers via the Portland-to-Montréal pipeline and, subsequently, the Enbridge Montréal-to-Sarnia pipeline (Line 9). Ontario refineries have, for a number of years, selected their feedstock sources based on both availability and pricing.
According to Statistics Canada, Ontario refineries received 367,400 b/d of crude oil in 2008 from the following sources: Western Canada (230,300 b/d or 63 percent); Eastern Canada (18,700 b/d or 5 percent); the United Kingdom (33,200 b/d or 9 percent); Saudi Arabia (31,200 b/d or 8 percent); United States (23,900 b/d or 6 percent); and other foreign sources (30,100 b/d or 8 percent). Receipts of western Canadian crude oil are projected to remain flat for the forecast period (Figure 3.3.)
figure 3.3 Ontario: forecast Western Canadian Crude Oil receipts
3.1.3 QuébecQuébec has three refineries. The two refineries located in Montréal have a combined refining capacity of 260,000 b/d, and the refinery in Québec City has a capacity of 215,000 b/d. The Montréal refineries process both crude from Eastern Canada and foreign sources received from the Portland-to-Montréal pipeline. If the Enbridge Montréal-to-Sarnia pipeline (Line 9) is reversed in the future, the Montréal market could be a new outlet for western Canadian crude oil supply. As noted in the 2008 report, Petro-Canada
thousand barrels per dayTotal refining capacity = 622
Light SyntheticConventional Light SweetConventional Medium SourHeavy
2008 2009 2010 2011 2012 2013 2014 20150
100
200
300
400
500
600
Total refining capacity = 398
Light SyntheticConventional Light SweetConventional Medium SourHeavy
2008 2009 2010 2011 2012 2013 2014 20150
50
100
150
200
250
300
350
400thousand barrels per day
(A47595)

11 Canadian assOCiatiOn OF PEtrOlEuM PrOduCErs
had previously announced that it was considering adding a 25,000 b/d coker at its refinery in Montréal, which would displace some light crude oil with heavy crude oil. However, a decision on this project had been deferred. The Suncor and Petro-Canada merger was announced in March 2009. At this time, it is uncertain if the merger will have any impact on the timing of this project.
3.2 United StatesThe United States, with a total refining capacity of almost 18 million b/d, is Canada’s largest market for crude oil exports. In 2008, Canada was the largest exporter of crude oil to the U.S., ahead of both Mexico and Saudi Arabia. Canada exported over 1.9 million b/d, which was equivalent to almost 19 percent of total U.S. imports from foreign sources. Of this volume, 1.7 million b/d was sourced from Western Canada (Figure 3.1). The U.S. demand for western Canadian oil supply is expected to reach 2.9 million b/d in 2015. The bulk of this growth is expected to be heavy crude oil. The U.S. is a natural market for much of Canada’s rising crude oil supply, in CAPP’s view, because of its geographic proximity to the U.S. and the geopolitical stability in the country.
The U.S. Department of Energy divides the 50 states in the U.S. into five Petroleum Administration for Defense Districts or PADDs (Figure 3.4). The PADDs were originally delineated during World War II for oil allocation purposes and are helpful in this report to facilitate the following discussion on the various markets in the U.S.
figure 3.4 Petroleum Administration for Defense Districts
3.2.1 PAdd I (East Coast)PADD I is located along the east coast of the United States. There are 14 refineries in Delaware, Georgia, New Jersey, Pennsylvania, Virginia and West Virginia with a total capacity of over 1.8 million b/d.
In 2008, refinery imports of foreign crude oil totaled 1.4 million b/d and over half of these volumes were light sweet crude oil (Figure 3.5). Over 259,000 b/d (or 2 percent) of the crude oil processed in PADD I refineries was sourced from Canada. Of these volumes, 68,200 b/d came from western Canada. These receipts, with the bulk being heavy crude oil, were delivered by pipeline. Without additional pipeline access to this market, western Canadian crude oil deliveries are expected to remain relatively flat through 2015. PADD I refineries have the potential to process western Canadian crude oil by displacing imports of other foreign sourced crude oil, in particular, light sweet crude oil. There are pipeline proposals being assessed to serve this market with western Canadian crude oil.
figure 3.5 2008 PADD i: foreign Sourced Supply by type and Domestic Crude Oil
thousand barrels per dayTotal refining capacity = 1,796
307
304
803
7
Light/Medium Sour
* Includes small volumes of Medium Sweet Source: EIA
Heavy
Light Sweet*
Domestic Crude
PADD II:Midwest
PADD I:East Coast
PADD IV:Rockies
PADD V:West Coast, AK, HI
PADD III:Gulf Coast
AL
AK
AZ
AR
CACO
CT
DE
GA
ID
IL IN
IA
KSKY
LA
ME
MD
MA
MI
MN
MS
MO
MT
NE
NV
NH
NJ
NM
NY
ND
OH
OK
OR
PA
SD
TN
TX
UT
VT
VA
WA
WV
WI
HI
SC
NC
FL
RIWY
(A47595)
Crude Oil Forecast, Markets & Pipeline Expansions 12
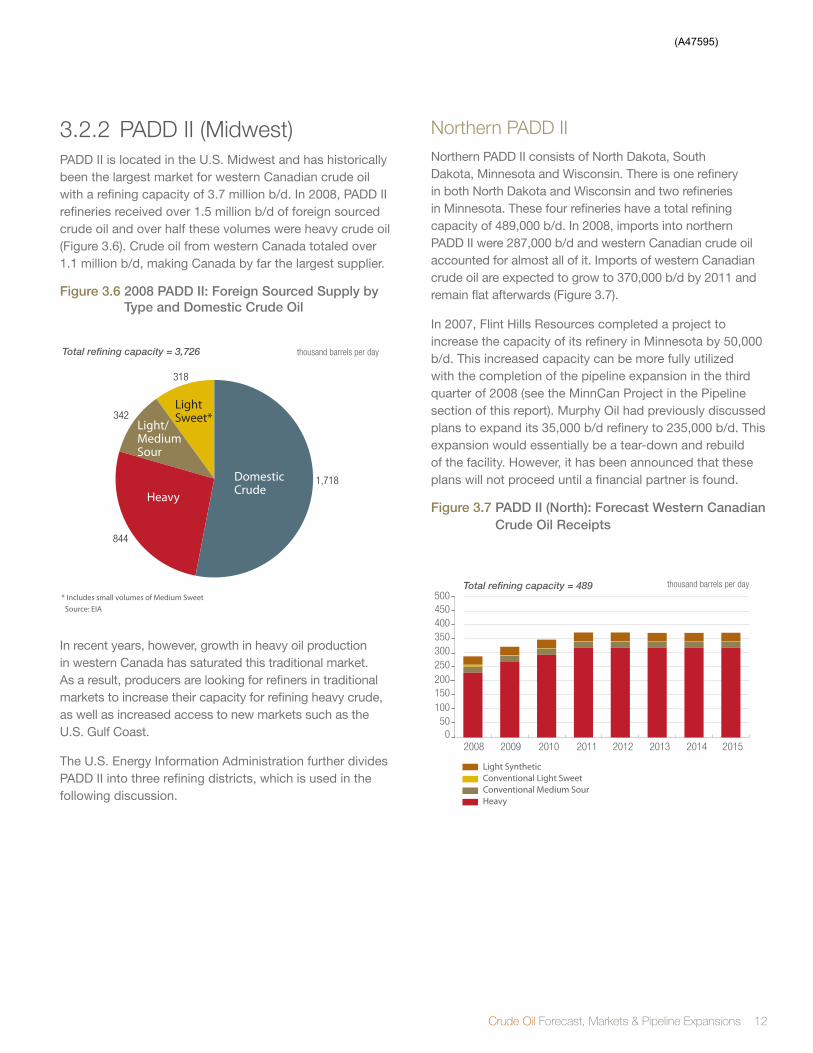
3.2.2 PAdd II (Midwest)PADD II is located in the U.S. Midwest and has historically been the largest market for western Canadian crude oil with a refining capacity of 3.7 million b/d. In 2008, PADD II refineries received over 1.5 million b/d of foreign sourced crude oil and over half these volumes were heavy crude oil (Figure 3.6). Crude oil from western Canada totaled over 1.1 million b/d, making Canada by far the largest supplier.
figure 3.6 2008 PADD ii: foreign Sourced Supply by type and Domestic Crude Oil
In recent years, however, growth in heavy oil production in western Canada has saturated this traditional market. As a result, producers are looking for refiners in traditional markets to increase their capacity for refining heavy crude, as well as increased access to new markets such as the U.S. Gulf Coast.
The U.S. Energy Information Administration further divides PADD II into three refining districts, which is used in the following discussion.
Northern PAdd IINorthern PADD II consists of North Dakota, South Dakota, Minnesota and Wisconsin. There is one refinery in both North Dakota and Wisconsin and two refineries in Minnesota. These four refineries have a total refining capacity of 489,000 b/d. In 2008, imports into northern PADD II were 287,000 b/d and western Canadian crude oil accounted for almost all of it. Imports of western Canadian crude oil are expected to grow to 370,000 b/d by 2011 and remain flat afterwards (Figure 3.7).
In 2007, Flint Hills Resources completed a project to increase the capacity of its refinery in Minnesota by 50,000 b/d. This increased capacity can be more fully utilized with the completion of the pipeline expansion in the third quarter of 2008 (see the MinnCan Project in the Pipeline section of this report). Murphy Oil had previously discussed plans to expand its 35,000 b/d refinery to 235,000 b/d. This expansion would essentially be a tear-down and rebuild of the facility. However, it has been announced that these plans will not proceed until a financial partner is found.
figure 3.7 PADD ii (north): forecast Western Canadian Crude Oil receipts
thousand barrels per dayTotal refining capacity = 3,726
342
1,718
844
318
Light/MediumSour
Heavy
Light Sweet*
Domestic Crude
* Includes small volumes of Medium Sweet Source: EIA
Total refining capacity = 489
Light Synthetic Conventional Light SweetConventional Medium SourHeavy
2008 2009 2010 2011 2012 2013 2014 20150
50100150200250300350400450500
thousand barrels per day
(A47595)

13 Canadian assOCiatiOn OF PEtrOlEuM PrOduCErs
figure 3.8 PADD ii (East): forecast Western Canadian Crude Oil receipts
Southern PAdd II Southern PADD II has eight refineries located in Kansas and Oklahoma with a total refining capacity of 823,500 b/d. With the reversal of the Enbridge Spearhead pipeline in March 2006, western Canadian producers were able to deliver up to 125,000 b/d of crude oil into Cushing, Oklahoma. In April 2009, Enbridge completed the expansion of this pipeline to 190,000 b/d. Access to the Cushing market offers western Canadian crude oil producers some opportunities to penetrate other markets (e.g. PADD III) through existing pipelines. Based on the survey responses, this market is not expected to be a large growth area for western Canadian crude oil. In 2008, refineries in this market received about 64,900 b/d of western Canadian crude oil, and this is projected to rise to 96,600 b/d in 2015 (Figure 3.9).
Eastern PAdd IIEastern PADD II consists of Michigan, Illinois, Indiana, Kentucky, Tennessee and Ohio and has 14 refineries with a total refining capacity of 2.4 million b/d. In 2008, western Canadian crude oil accounted for 802,800 b/d
or 74 percent of the total foreign imports into the region. Proposed expansions and conversions could result in higher runs of western Canadian heavy crude oil in the next several years (Figure 3.8). Table 3.1 summarizes announced projects designed to process additional volumes of Canadian crude oil.
Total refining capacity = 2,414
Light Synthetic Conventional Light SweetConventional Medium SourHeavy
2008 2009 2010 2011 2012 2013 2014 20150
200400600800
100012001400160018002000
thousand barrels per day
table 3.1 Summary of Announced refinery Upgrades in Eastern PADD ii
Operator LocationCurrent Capacity (thousand b/d)
Scheduled in-Service Description
ExxonMobil Joliet, IL 239 TBD Increased ability to process heavy crude oil
WRB Refining Roxana, IL 306 2011 (originally end 2009)
Add a 65,000 b/d coker; increase total crude oil refining capacity by 50,000 b/d; double heavy oil refining capacity to 240,000 b/d
BP Whiting, IN 160 2012 (originally 2011)
Construction of new coker and a new crude distillation unit
Marathon Detroit, MI 100 Mid 2012 (originally Q4 2010)
Increase heavy oil processing capacity by 80,000 b/d and increase total crude oil refining capacity to 115,000 b/d
BP Toledo, OH 155 (60 heavy) Dependant on market conditions (originally 2015)
Reconfigured to process 120,000 b/d of bitumen (180,000 b/d total capacity)
Husky Lima, OH 165 TBD Conversion to process 105,000 of heavy crude oil (170,000 b/d total)
Valero Memphis, TN 195 2012 (originally 2009) Cat-cracking unit upgrade
(A47595)

Crude Oil Forecast, Markets & Pipeline Expansions 14
figure 3.9 PADD ii (South): forecast Western Canadian Crude Oil receipts
3.2.3 PAdd III (gulf Coast)PADD III is comprised of Alabama, Arkansas, Louisiana, Mississippi, New Mexico and Texas. There are 51 refineries in this market with a total refining capacity of over 8.4 million b/d, of which a significant portion has heavy crude oil processing capabilities. It is the largest and most complex refining district in the United States and is considered to be potentially well suited and capable of processing Canadian heavy crude oil.
In 2008, PADD III imported 5.3 million b/d of crude oil from foreign sources, of which 2.2 million b/d was heavy crude oil (Figure 3.10). These imports came from 43 different countries with the top suppliers being Mexico (22 percent), Saudi Arabia (17 percent), Venezuela (17 percent) and Nigeria (11 percent). Deliveries of western Canadian heavy crude oil to this market totaled about 88,800 b/d. The only pipeline access for delivery of western Canadian crude oil to the Gulf Coast is through the ExxonMobil Pegasus pipeline. This pipeline originates at Patoka, Illinois and ends at Corsicana, Texas and has a capacity of 66,000 b/d. This pipeline is currently being expanded by 30,000 b/d, and is expected to be in-service in June 2009. In 2008, approximately 22,800 b/d that were shipped off the Westridge dock in Burnaby, British Columbia arrived via tanker. In addition, about 11,700 b/d of light sweet crude was also imported from Atlantic Canada by tanker.
figure 3.10 2008 PADD iii: foreign Sourced Supply by type and Domestic Crude Oil
The steep decline in production from Mexico’s Cantarell field could make securing supply from Canada more attractive in the future. In addition, Canada’s other major competitor, Venezuela, has recently signed agreements to ship oil to other markets such as China. In recent years, PADD III refineries have added several new cokers which will enable them to run heavier and more sour grades of crude oil, which are becoming increasingly predominant in the world’s oil production slate. Table 3.2 summarizes the major refinery upgrades announced for the region. Although these upgrades may not all be specifically designed to process Canadian crude oil, many of these companies have confirmed that their refineries are planning to take more Canadian crude. Thus the main constraint to the growth of supply of western Canadian heavy crude used in this region is not available refining capacity but is in fact the availability of pipeline capacity to the region. There are a number of pipeline proposals to increase pipeline capacity to the U.S. Gulf Coast scheduled for as early as 2012 or 2013. CAPP has estimated that this market could receive at least 380,000 b/d of western Canadian crude oil by 2013 based on announced contractual commitments.
Total refining capacity = 824
Light Synthetic Conventional Light SweetConventional Medium SourHeavy
2008 2009 2010 2011 2012 2013 2014 20150
20406080
100120140160180200
thousand barrels per day thousand barrels per dayTotal refining capacity = 8,378
2,237
1,834
1,204
1,623
* Includes small volumes of Medium Sweet Source: EIA
Light/MediumSour
Heavy
Light Sweet*
Domestic Crude
(A47595)

15 Canadian assOCiatiOn OF PEtrOlEuM PrOduCErs
3.2.4 PAdd IV (Rockies)PADD IV includes the states of Colorado, Montana, Utah, Wyoming and Idaho. It has 14 refineries located in four of the five states (there are no refineries in Idaho), and has a total refining capacity of 611,500 b/d. Although PADD IV is smaller than the other core markets, it has been a stable market for western Canadian crude oil supply.
In 2008, PADD IV processed 255,000 b/d of Canadian crude oil or about 48 percent of its feedstock requirements. Canada is the only source of foreign crude oil to this market. Throughout the forecast period, western Canadian crude oil receipts are forecasted to remain relatively flat (Figure 3.11). Some refiners have indicated, however, that once crude oil production from certain areas of PADD IV declines, there could be opportunities for Canadian crude oil to replace these supplies. In addition, a few refiners have either recently invested in upgrading projects that could enable their refinery to process oil from the oil sands or have plans to do so in the future. As a result, the feedstock slate for this market could become slightly heavier.
figure 3.11 PADD iv: forecast Western Canadian Crude Oil receipts
3.2.5 PAdd V (West Coast)PADD V includes the states of Alaska, Washington, Oregon, California, Nevada, Arizona and Hawaii. The majority of PADD V is geographically divided from the rest of the United States by the Rocky Mountains, and has very good access to tankers, and is located in close proximity to production from Alaska and California. Nonetheless, this market still depends on foreign imports for almost half of its requirements (Figure 3.12).
Total refining capacity = 612
Light Sweet*Light/Medium SourHeavy
2008 2009 2010 2011 2012 2013 2014 20150
100
200
300
400
500
600
*Includes small volumes of Medium Sweet
thousand barrels per day
table 3.2 Summary of Major Announced refinery Upgrades in PADD iii
Operator LocationCurrent Capacity (thousand b/d)
Scheduled in-Service Description
Marathon Oil Garyville, LA 256 4Q 2009 Increase capacity to 425,000 b/d
Valero St. Charles, LA 250 2012 (originally 2011)
New 50,000 b/d hydrocracker and 10,000 b/d expansions to the crude and coker units
Holly Artesia, NM 85 2009 Additional 25,000 b/d capacity and capability to run up to 40,000 b/d of heavy crude oil
Motiva Enterprises
Port Arthur, TX 285 2012 (originally late 2010)
Increase capacity to over 600,000 b/d
Valero Port Arthur, TX 310 2011 (originally 2010)
New 50,000 b/d hydrocracker. Plans for previously announced 45,000 b/d coker addition is on hold
WRB Refining Borger, TX 146 2009+ Debottleneck to add 20,000 b/d bitumen capacity
(A47595)
Crude Oil Forecast, Markets & Pipeline Expansions 16
figure 3.12 2008 PADD v: foreign Sourced Supply by type and Domestic Crude Oil
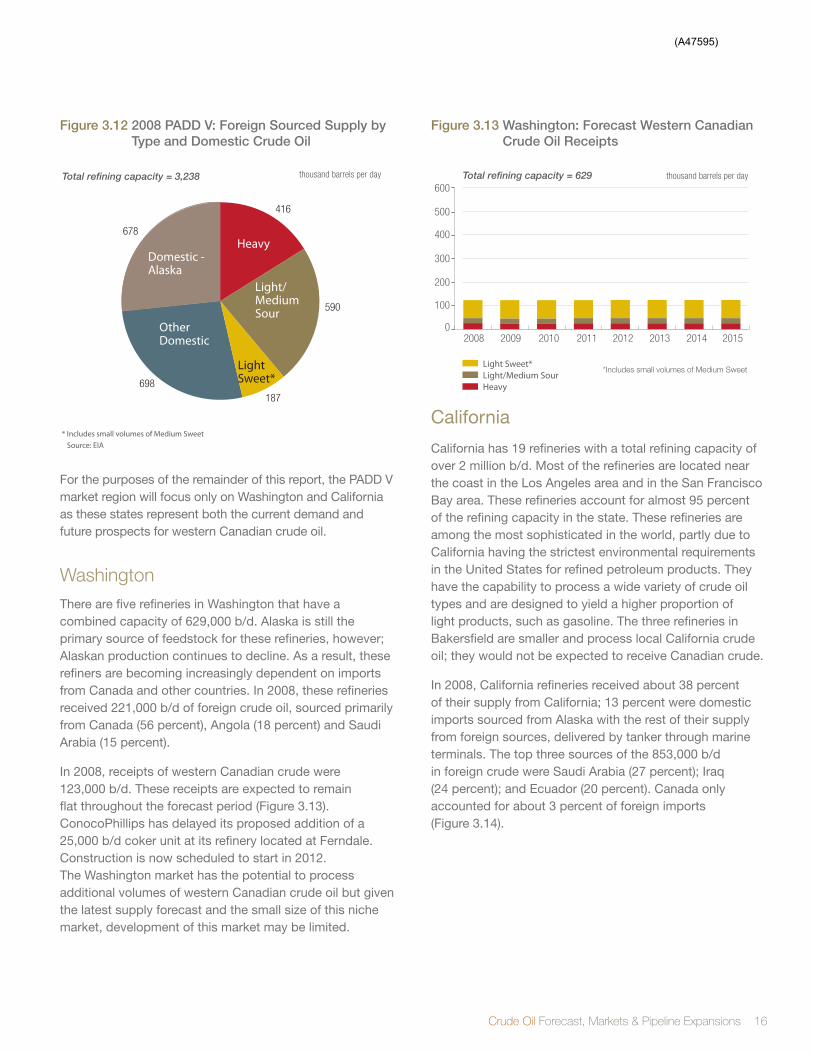
For the purposes of the remainder of this report, the PADD V market region will focus only on Washington and California as these states represent both the current demand and future prospects for western Canadian crude oil.
WashingtonThere are five refineries in Washington that have a combined capacity of 629,000 b/d. Alaska is still the primary source of feedstock for these refineries, however; Alaskan production continues to decline. As a result, these refiners are becoming increasingly dependent on imports from Canada and other countries. In 2008, these refineries received 221,000 b/d of foreign crude oil, sourced primarily from Canada (56 percent), Angola (18 percent) and Saudi Arabia (15 percent).
In 2008, receipts of western Canadian crude were 123,000 b/d. These receipts are expected to remain flat throughout the forecast period (Figure 3.13). ConocoPhillips has delayed its proposed addition of a 25,000 b/d coker unit at its refinery located at Ferndale. Construction is now scheduled to start in 2012. The Washington market has the potential to process additional volumes of western Canadian crude oil but given the latest supply forecast and the small size of this niche market, development of this market may be limited.
figure 3.13 Washington: forecast Western Canadian Crude Oil receipts
California
California has 19 refineries with a total refining capacity of over 2 million b/d. Most of the refineries are located near the coast in the Los Angeles area and in the San Francisco Bay area. These refineries account for almost 95 percent of the refining capacity in the state. These refineries are among the most sophisticated in the world, partly due to California having the strictest environmental requirements in the United States for refined petroleum products. They have the capability to process a wide variety of crude oil types and are designed to yield a higher proportion of light products, such as gasoline. The three refineries in Bakersfield are smaller and process local California crude oil; they would not be expected to receive Canadian crude.
In 2008, California refineries received about 38 percent of their supply from California; 13 percent were domestic imports sourced from Alaska with the rest of their supply from foreign sources, delivered by tanker through marine terminals. The top three sources of the 853,000 b/d in foreign crude were Saudi Arabia (27 percent); Iraq (24 percent); and Ecuador (20 percent). Canada only accounted for about 3 percent of foreign imports (Figure 3.14).
Total refining capacity = 3,238
416
590
187698
678
Light/MediumSour
Heavy
Light Sweet*
Other Domestic
Domestic -Alaska
* Includes small volumes of Medium Sweet Source: EIA
thousand barrels per day Total refining capacity = 629
Light Sweet*Light/Medium SourHeavy
2008 2009 2010 2011 2012 2013 2014 20150
100
200
300
400
500
600
*Includes small volumes of Medium Sweet
thousand barrels per day
(A47595)
17 Canadian assOCiatiOn OF PEtrOlEuM PrOduCErs
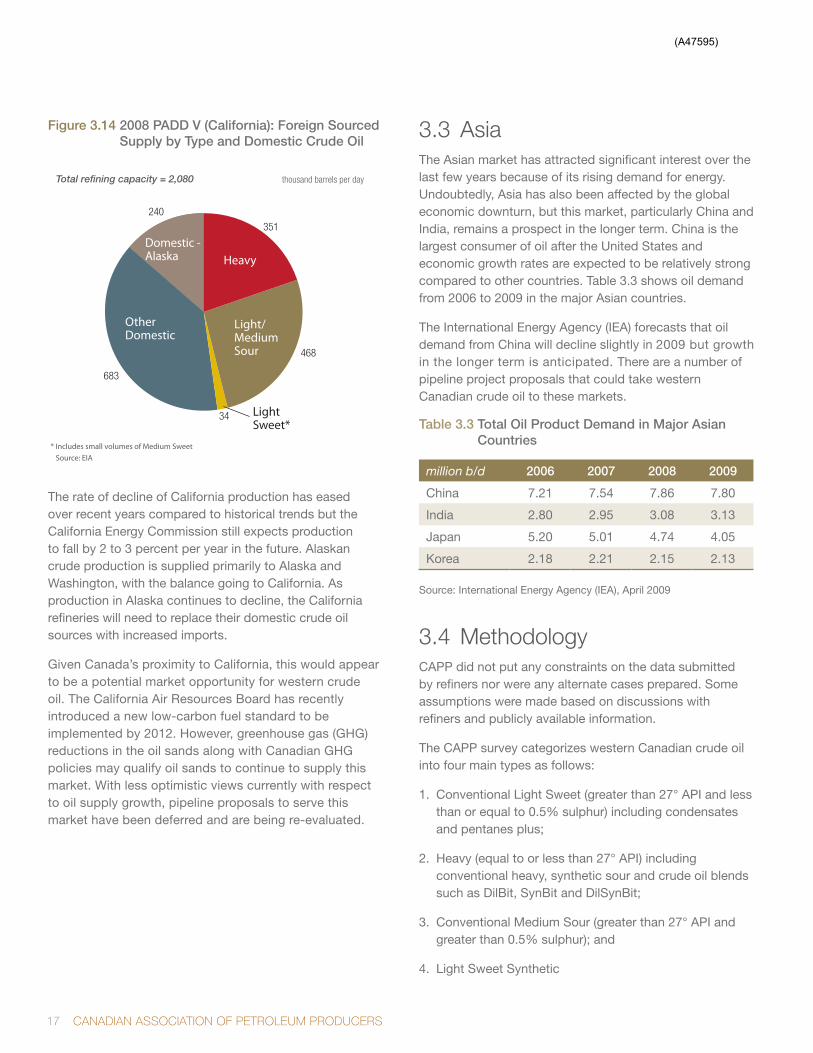
figure 3.14 2008 PADD v (California): foreign Sourced Supply by type and Domestic Crude Oil
The rate of decline of California production has eased over recent years compared to historical trends but the California Energy Commission still expects production to fall by 2 to 3 percent per year in the future. Alaskan crude production is supplied primarily to Alaska and Washington, with the balance going to California. As production in Alaska continues to decline, the California refineries will need to replace their domestic crude oil sources with increased imports.
Given Canada’s proximity to California, this would appear to be a potential market opportunity for western crude oil. The California Air Resources Board has recently introduced a new low-carbon fuel standard to be implemented by 2012. However, greenhouse gas (GHG) reductions in the oil sands along with Canadian GHG policies may qualify oil sands to continue to supply this market. With less optimistic views currently with respect to oil supply growth, pipeline proposals to serve this market have been deferred and are being re-evaluated.
3.3 AsiaThe Asian market has attracted significant interest over the last few years because of its rising demand for energy. Undoubtedly, Asia has also been affected by the global economic downturn, but this market, particularly China and India, remains a prospect in the longer term. China is the largest consumer of oil after the United States and economic growth rates are expected to be relatively strong compared to other countries. Table 3.3 shows oil demand from 2006 to 2009 in the major Asian countries.
The International Energy Agency (IEA) forecasts that oil demand from China will decline slightly in 2009 but growth in the longer term is anticipated. There are a number of pipeline project proposals that could take western Canadian crude oil to these markets.
table 3.3 total Oil Product Demand in Major Asian Countries
million b/d 2006 2007 2008 2009
China 7.21 7.54 7.86 7.80
India 2.80 2.95 3.08 3.13
Japan 5.20 5.01 4.74 4.05
Korea 2.18 2.21 2.15 2.13
Source: International Energy Agency (IEA), April 2009
3.4 MethodologyCAPP did not put any constraints on the data submitted by refiners nor were any alternate cases prepared. Some assumptions were made based on discussions with refiners and publicly available information.
The CAPP survey categorizes western Canadian crude oil into four main types as follows:
1. Conventional Light Sweet (greater than 27° API and less than or equal to 0.5% sulphur) including condensates and pentanes plus;
2. Heavy (equal to or less than 27° API) including conventional heavy, synthetic sour and crude oil blends such as DilBit, SynBit and DilSynBit;
3. Conventional Medium Sour (greater than 27° API and greater than 0.5% sulphur); and
4. Light Sweet Synthetic
Total refining capacity = 2,080
351
468
34
683
240
Light/MediumSour
Heavy
Light Sweet*
Other Domestic
Domestic -Alaska
thousand barrels per day
* Includes small volumes of Medium Sweet Source: EIA
(A47595)
Crude Oil Forecast, Markets & Pipeline Expansions 18
For the purposes of the historical data in this section of the report, the following crude types and definitions apply:
• Sweet:crudeoilwithasulphurcontentoflessthan or equal to 0.5%
• Sour:crudeoilwithasulphurcontentofgreater than 0.5%
• Light:crudeoilwithanAPIofatleast30°
• Medium:crudeoilwithanAPIgreaterthan27°but less than 30°
• Heavy:crudeoilwithanAPIof27°APIorless
No differentiation is made between sweet and sour crude oil that falls in the heavy category because heavy crude oil is generally sour.
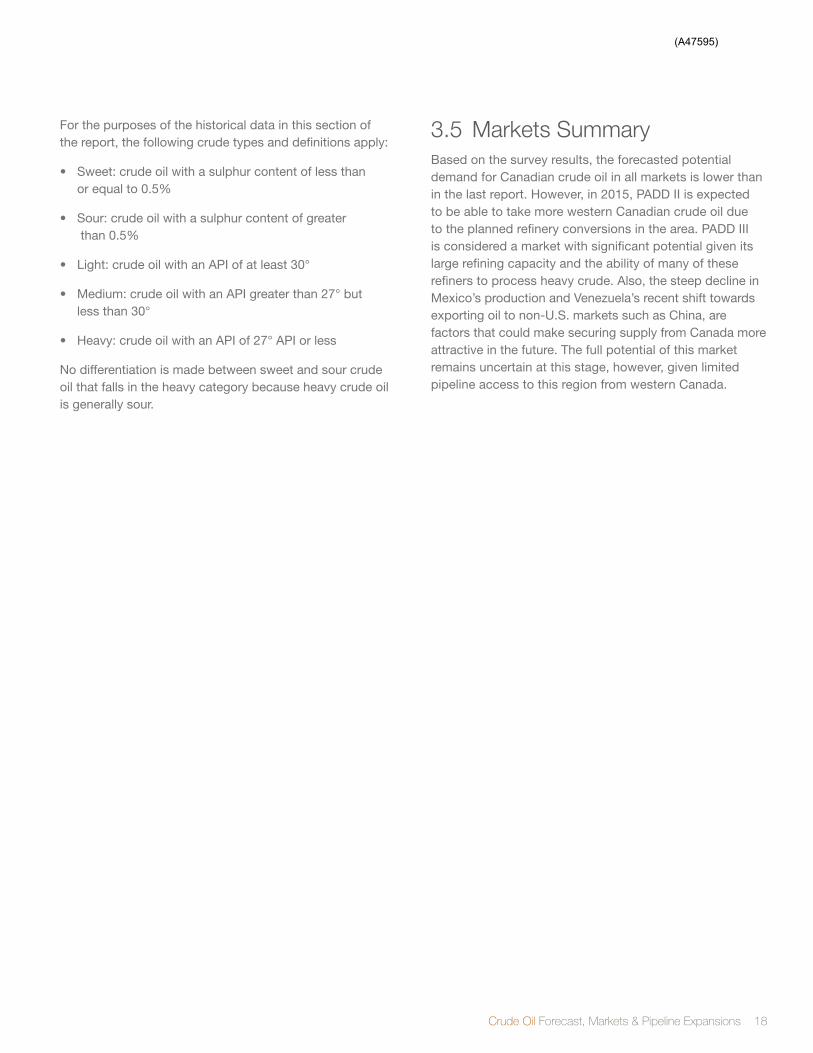
3.5 Markets SummaryBased on the survey results, the forecasted potential demand for Canadian crude oil in all markets is lower than in the last report. However, in 2015, PADD II is expected to be able to take more western Canadian crude oil due to the planned refinery conversions in the area. PADD III is considered a market with significant potential given its large refining capacity and the ability of many of these refiners to process heavy crude. Also, the steep decline in Mexico’s production and Venezuela’s recent shift towards exporting oil to non-U.S. markets such as China, are factors that could make securing supply from Canada more attractive in the future. The full potential of this market remains uncertain at this stage, however, given limited pipeline access to this region from western Canada.
(A47595)

19 Canadian assOCiatiOn OF PEtrOlEuM PrOduCErs
Pipelines are the main connection between the crude oil supply areas to the end markets since they are generally the most efficient and reliable mode of transporting crude oil. As such, pipeline developments determine the destination of Canadian crude oil. The additional capacity from all currently active (i.e. in construction or in the regulatory process) pipeline projects would result in total available pipeline capacity in excess of forecast supply through to the end of the forecast period. In addition, there remain a number of proposals that have been grouped into three main areas: U.S. Midwest, Ontario, Québec, U.S. East Coast; the U.S. gulf Coast; and the West Coast. However, the proposed timing for many of these proposals is uncertain.
4 CRUdE OIL PIPELINES
4.1 Major Crude Oil PipelinesHistorically, major Canadian crude oil pipelines such as the Enbridge Pipeline and the Kinder Morgan Trans Mountain pipeline operated as common carriers. The exceptions are the Kinder Morgan Express pipeline and the Enbridge Line 9 (Montreal, Québec to Sarnia, Ontario) that operate as contract carriers (i.e. require long-term take-or-pay commitments). On common carrier pipelines, shippers nominate monthly for space on the pipeline without a contract. The TransCanada Keystone pipeline, which is scheduled to be in-service by the end of 2009, will operate as a contract carrier while the Enbridge Alberta Clipper pipeline will be a common carrier.
4.1.1 Existing Major Crude Oil PipelinesWestern Canadian crude oil is delivered to markets or other pipelines by three major Canadian trunklines – Enbridge, Trans Mountain and Express pipelines.
The following table provides the estimated current crude oil capacity on these trunklines.
Pipeline Crude typeEstimated
Annual Capacity (thousand b/d)
EnbridgeLight 692
Heavy 1,186
Express Light/heavy (35/65) 280
Trans Mountain Light/heavy (80/20) 300
ToTal 2,458
Enbridge PipelinesThe Enbridge system which operates in Canada and the U.S. is the world's longest crude oil pipeline. It can deliver more than 2 million b/d of crude oil and other commodities from primarily western Canada to other markets in western Canada, the U.S. upper Midwest and Ontario. In addition, it connects to various pipelines in the U.S. such as Spearhead and Mustang. It also receives crude oil from U.S. pipelines for deliveries to markets in the U.S. Midwest and Ontario.
(A47595)
Crude Oil Forecast, Markets & Pipeline Expansions 20
In 2007, Enbridge added about 45,000 b/d of capacity downstream of Superior, Wisconsin while no additional capacity was added upstream of Superior. In April 2008, Enbridge completed Stage 1 of the Southern Access program (Line 61) from Superior to Delavan adding about 46,000 b/d of capacity, while the remainder of Line 61 from Delevan to Flanagan began operating in May 2009.
kinder Morgan Trans Mountain PipelineThe Trans Mountain system originates in Edmonton, Alberta and transports crude oil to the Vancouver area, including its Westridge dock for vessel or barge loadings, and by pipeline to refineries in Washington State. The system also ships refined petroleum products from the Edmonton refineries to Kamloops, British Columbia and Vancouver.
It can currently transport about 300,000 b/d assuming 20 percent of the volumes are heavy crude oil. Note that the actual available capacity varies depending on the amount of heavy crude oil transported. Currently, about 25 percent of the volumes shipped are heavy crude oil. In 2008, Trans Mountain completed TMX1, which consisted of a Pump Station Expansion (PSE) and the Anchor Loop Expansion (ALE) project.
kinder Morgan Express-Platte PipelinesThe Express pipeline ships crude oil from Hardisty, Alberta to PADD IV and has a capacity of 280,000 b/d. The pipeline is underpinned by contracts, many of which expire in 2012, totaling 231,000 b/d with the remaining space being available for spot shippers.
The Platte system connects to Express at Casper, Wyoming and extends to Guernsey, Wyoming then to Wood River, Illinois. Capacity from Guernsey to Wood River is about 145,000 b/d and because of strong demand, pipeline capacity has been constrained since January 2007. Therefore, Express is not operating at capacity due to insufficient capacity on the Platte system.
Enbridge Spearhead (South) PipelineThe Spearhead pipeline is connected to the Enbridge Lakehead system at the Enbridge terminal near Chicago and delivers light and heavy crude oil to Cushing, Oklahoma. As of May 2009, the initiation point has been changed to Flanagan, Illinois and the pipeline capacity was increased by 65,000 b/d to 190,000 b/d.
Committed shippers have been allocated 30,000 b/d out of this expanded capacity. This portion of the pipeline will continue to operate in southbound service and is referred to as Spearhead South. There are plans to reverse the remaining portion of the pipeline that runs from Flanagan to Hartsdale, Illinois to operate in northbound service. The pipeline originally operated in northbound service but was reversed in March 2006.
Enbridge Light Sour LineAs part of its Southern Lights diluent project, Enbridge constructed a 20-inch diameter light sour crude oil line from Cromer, Manitoba to Clearbrook, Minnesota. This line came into service in February 2009 and has a capacity of 185,000 b/d. This expansion was built to provide access to growing crude oil deliveries into the Enbridge Cromer terminal from southeast Saskatchewan.
ExxonMobil Mustang PipelineThe Mustang pipeline is jointly owned by Enbridge Pipelines and ExxonMobil and is connected to the Enbridge Lakehead system at Lockport, Illinois and extends to the Patoka, Illinois terminal. It has a heavy crude oil capacity of about 91,000 b/d of which 88,000 b/d is committed capacity. Nominations on the pipeline have exceeded capacity since December 2005 and this trend is expected to continue until there is new pipeline capacity into the region.
ExxonMobil Pegasus PipelineThe Pegasus pipeline was reversed in March 2006 and runs from Patoka, Illinois to Nederland, Texas. It currently provides western Canadian crude oil producers with the only pipeline access to the U.S. Gulf Coast. It has a heavy crude oil capacity of 66,000 b/d, of which 50,000 b/d is committed capacity. Pegasus is scheduled to be expanded to 96,000 b/d by the end of June 2009. Nominations have exceeded capacity since it was reversed.
MinnCan ProjectThe Minnesota Pipeline is connected to the Enbridge system at Clearbrook, Minnesota and transports crude oil from Canada to Minnesota refineries owned by Flint Hills in Rosemount and Marathon Oil in St. Paul.
(A47595)

21 Canadian assOCiatiOn OF PEtrOlEuM PrOduCErs
figure 4.1 Current Crude Oil Expansions from Western Canada
This line was operating at its capacity of 300,000 b/d. The MinnCan project was designed to bring additional crude oil supply from Canada to these refineries. It is a new 24-inch diameter pipeline that follows most of the original system’s route but ends at the Flint Hills refinery. This endpoint provides a direct interconnection with that facility and a direct interconnection, through existing pipeline facilities, with Marathon’s refinery. The MinnCan project was completed in the third quarter of 2008, providing up to 165,000 b/d additional crude to these refineries. This new pipeline can also be expanded up to 350,000 b/d.
4.2 Crude Oil Transportation Requirements Given that the growth in western Canadian crude oil supply is expected to be lower than in recent forecasts, the main driver behind the proposals for new pipeline projects has diminished substantially.
In 2008, the three major trunklines from western Canada transported over 1.8 million b/d of crude oil. These pipelines operated close to full available capacity for most of the year. The pipeline expansion projects that have already been approved and are in construction will add over one million b/d in pipeline capacity by the end of 2010 (Table 4.1). This capacity will meet and exceed the forecast supply through to 2019 (Figure 4.1).
table 4.1 Approved Oil Pipeline Expansions from Western Canada
Pipeline Proposed in Service Date
Capacity (thousand b/d)
TransCanada Keystone Dec 2009 435
Enbridge Alberta Clipper Jul 2010 450
TransCanada Keystone Extension 4Q 2010 155
tOtAL Capacity 1,040
PortlandSarnia
Buffalo
Philadelphia
Toledo
Lima
Chicago
PatokaWoodRiver
Cushing
Flanagan
St. PaulGuernsey
Salt Lake City
St. JamesHouston
Hardisty
Edmonton
Anacortes
Burnaby
Express
TransMountain
Platte
BP
Enbridge
Mid Valley
Capline
Current Oil Pipeline Expansions from Western Canada
Enbridge Alberta Clipper
TransCanada Keystone
4
6
Montreal
(A47595)
Crude Oil Forecast, Markets & Pipeline Expansions 22
Current Oil Pipeline Expansions/Proposals to the U.S.Midwest, Ontario, Québec and U.S. East Coast
Portland
Montreal
SarniaBuffalo
Philadelphia
Toledo
Lima
Chicago
PatokaWoodRiver
Cushing
Flanagan
St. Paul
GuernseySalt Lake City
St. JamesHouston
Hardisty
Edmonton
Anacortes
Burnaby
Express
TransMountain
PlatteBP
Enbridge
Mid Valley
Capline
TransCanada Keystone4
Enbridge Ohio Access
Enbridge Alberta Clipper
EnbridgeSouthern Access Expansion
Enbridge Southern Access Extension
10
16
SunocoBuffalo to Philadelphia
Sunoco to Toledo19 20
Enbridge TrailbreakerPortland Pipeline Reversal
1717
Mustang Expansion
Enbridge SpearheadExpansion (North)
Enbridge (North Dakota) Expansion
96
10
1518
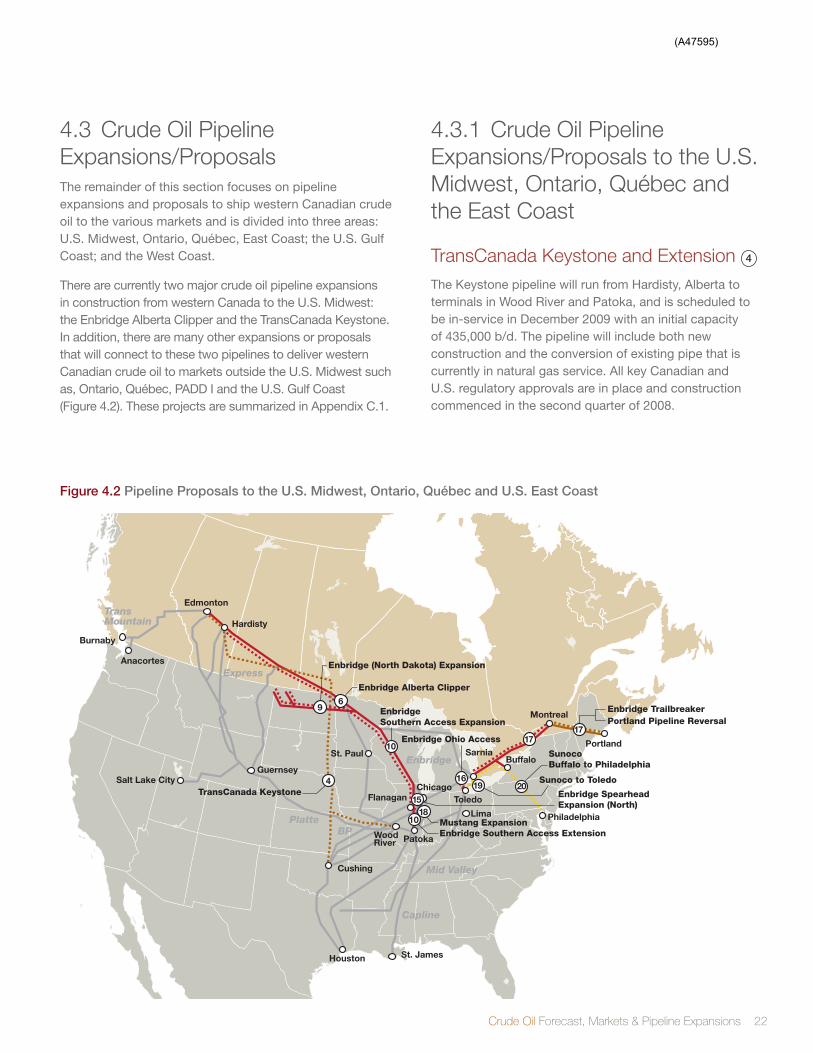
4.3 Crude Oil Pipeline Expansions/ProposalsThe remainder of this section focuses on pipeline expansions and proposals to ship western Canadian crude oil to the various markets and is divided into three areas: U.S. Midwest, Ontario, Québec, East Coast; the U.S. Gulf Coast; and the West Coast.
There are currently two major crude oil pipeline expansions in construction from western Canada to the U.S. Midwest: the Enbridge Alberta Clipper and the TransCanada Keystone. In addition, there are many other expansions or proposals that will connect to these two pipelines to deliver western Canadian crude oil to markets outside the U.S. Midwest such as, Ontario, Québec, PADD I and the U.S. Gulf Coast (Figure 4.2). These projects are summarized in Appendix C.1.
4.3.1 Crude Oil Pipeline Expansions/Proposals to the U.S. Midwest, Ontario, Québec and the East Coast
TransCanada keystone and Extension 4
The Keystone pipeline will run from Hardisty, Alberta to terminals in Wood River and Patoka, and is scheduled to be in-service in December 2009 with an initial capacity of 435,000 b/d. The pipeline will include both new construction and the conversion of existing pipe that is currently in natural gas service. All key Canadian and U.S. regulatory approvals are in place and construction commenced in the second quarter of 2008.
figure 4.2 Pipeline Proposals to the U.S. Midwest, Ontario, Québec and U.S. East Coast
(A47595)
23 Canadian assOCiatiOn OF PEtrOlEuM PrOduCErs
TransCanada is also proposing two extensions to the Keystone pipeline. The first one is an extension to Cushing, Oklahoma, which would connect at the Nebraska/Kansas border. The extension would increase capacity by 155,000 b/d to an ultimate capacity of 590,000 b/d, and is scheduled to be in-service in the fourth quarter 2010. The second one is a Heartland Extension, which is a 600,000 b/d oil pipeline from Fort Saskatchewan to the Keystone connection at Hardisty. It is scheduled to be in service in the 2012 or 2013 timeframe.
TransCanada dilBit PipelineTransCanada is proposing a 400,000 b/d DilBit line from the oil sands area of Fort McMurray to Hardisty, Alberta with multiple receipt points. Potential timing for this project is sometime between 2012 and 2014.
Enbridge Alberta Clipper 6
The 36-inch diameter Clipper pipeline is an expansion of the Enbridge existing mainline system and will extend from Hardisty, Alberta to Superior, Wisconsin with a connection to the Minnesota pipeline at Clearbrook. The initial capacity is 450,000 b/d of heavy crude oil and could be further expanded to 800,000 b/d. It is scheduled to be in-service in July 2010.
In May 2009, Enbridge extended Line 4 from Hardisty to Edmonton by connecting currently deactivated 48-inch diameter segments with a new 36-inch diameter pipeline. This extension was built to ensure sufficient heavy crude oil capacity for Enbridge Alberta Clipper and has a capacity of 450,000 b/d. It can be expanded to an ultimate capacity of 800,000 b/d.
Enbridge Southern Access Expansion/Extension 10
Enbridge completed construction of its Southern Access expansion program. The first phase, completed in April 2008, was a new 42-inch diameter pipeline from Superior to Delavan, Wisconsin. The second phase build out to Flanagan, Illinois was subsequently completed in May 2009 adding about 400,000 b/d of capacity. Further expansions to 600,000 b/d and 800,000 b/d can be achieved by adding pump stations. The Southern Access pipeline will connect to the Enbridge Spearhead pipeline at Flanagan. See sections on Enbridge Spearhead South and Enbridge Spearhead North.
Enbridge is also proposing to extend the Southern Access pipeline to the Patoka, Illinois hub from Flanagan with a 36-inch diameter line that would have an initial capacity of 400,000 b/d. The pipeline could be in-service as early as 2012 but the actual timing will depend on the market and regulatory approvals.
Enbridge Spearhead North 15
Since May 2009, the Southern Access pipeline has connected with Spearhead at Flanagan. Currently, Spearhead flows southbound but Enbridge intends to reverse the segment of the pipeline between Flanagan, Illinois to Hartsdale, Indiana (near Chicago) as part of the Southern Access project. This segment, referred to as Spearhead North, has a capacity of 130,000 b/d and is scheduled to be in-service by Q3 2009.
Bow River Pipeline The Bow River Pipeline system gathers oil production in southern Alberta for delivery north to Hardisty, Alberta and south to interconnecting export pipelines near the Montana border. Inter Pipeline Fund (Inter Pipeline) plans to expand oil delivery capabilities on the Bow River Pipeline system and has received support in terms of 7-year contractual commitments to transport 30,000 b/d. The project includes the construction of 135 kilometres of new pipeline and will enable the shipment of segregated crude oil streams from Hardisty, Alberta to refining markets in Montana. The intent of this project is to allow crude oil types sourced at Hardisty to be shipped south as a distinct, segregated stream and give Montana refineries access to multiple grades of oil available at Hardisty without commingling with the locally gathered Bow River oil stream. The project is scheduled for completion in the first quarter of 2010.
Enbridge Line 5 ExpansionLine 5 extends from Superior, Wisconsin to Sarnia, Ontario. The expansion consists of adding Drag Reducing Agent (DRA), and is expected to add 50,000 b/d of new light crude oil capacity. Total capacity will then approximate 540,000 b/d. The timing for this project is undetermined.
(A47595)
Crude Oil Forecast, Markets & Pipeline Expansions 24
Enbridge Line 6B debottleneck and ExpansionEnbridge is exploring various options to expand Line 6B which extends from Chicago, Illinois to Sarnia. Tank constraints are currently limiting usable capacity from 290,000 b/d to 190,000 b/d. The project scope includes two new tanks and pump stations which could add between 65,000 and 135,000 b/d of capacity. Total new capacity would approximate up to 425,000 b/d and the projected in-service date is in the first quarter of 2010. This new capacity would be required should Enbridge’s Line 9 be reversed.
Enbridge Trailbreaker 17
Enbridge had been in discussions with industry to reverse Line 9 from Sarnia to Montreal in order to access markets in Ontario, Quebéc, the Maritimes and U.S. markets. If reversed, Line 9 could ship up to 215,000 b/d of crude. The project proposal included the reversal of one line on the Portland Pipeline system to ship 200,000 b/d that would be loaded on tankers. Portland Pipeline conducted an open season for the reversal but did not receive the level of firm volume commitments required to proceed. At this time Enbridge is continuing its discussions with industry with respect to appropriate timing and market conditions needed to reconsider this proposal.
Enbridge North dakota 9
The North Dakota pipeline connects to the Enbridge Lakehead pipeline at Clearbrook, Minnesota and provides producers in Montana and North Dakota with access to markets in PADD II and Ontario. Increased production in these areas has resulted in a need for additional pipeline capacity. Enbridge added 30,000 b/d of capacity to the North Dakota system in January 2007 and is planning another expansion of 52,000 b/d by January 2010, which would increase total system capacity to 162,000 b/d.
ExxonMobil Mustang Expansion 18
The Mustang expansion proposal would increase throughput by adding new and modifying existing pump stations. The pipeline can transport both light and heavy crude. With the proposed expansion, the capacity could increase by 38,000 b/d to 131,000 b/d.
Enbridge Line 6C Enbridge is considering a new 36-inch diameter line from its Griffith/Hartsdale terminal to Stockbridge, Michigan that would parallel Line 6B. The intent is to deliver additional supply to refineries in Michigan and Ohio. The estimated capacity would be 400,000 b/d with an in-service date of 2012. If needed, the line could be extended to Sarnia, Ontario.
Sunoco Pipeline 19 20
Sunoco is proposing a crude oil pipeline to refineries in the Philadelphia area. The market in this area includes Sunoco’s two refineries in Pennsylvania and its New Jersey refinery as well as the ConocoPhillips and Valero refineries in Pennsylvania, New Jersey and Delaware. The project includes an expansion on the Enbridge system to Buffalo and the use of the existing Sunoco right-of-way to build a new 24-inch diameter pipeline from Buffalo to Philadelphia. The capacity of the pipeline would be about 400,000 b/d.
Sunoco is also considering expanding its Marysville to Toledo pipeline from 190,000 b/d to 288,000 b/d.
Enbridge Ohio Access 16
Enbridge is proposing a phased approach to increase the ability to transport additional deliveries of western Canadian crude oil. The timing is scheduled to coincide with the timing of expansions and conversions to process more heavy crude oil at refineries in Detroit and Ohio. The first phase would entail a debottlenecking of Line 17 and a new pipeline ex-Griffith which would increase capacity by 20,000 b/d to 120,000 b/d to serve increased demand by Marathon’s Detroit refinery.
Phase 2 would increase pipeline capacity from 120,000 b/d to 400,000 b/d to serve the refineries in Toledo and Lima, Ohio. Phase 2 includes a new 36-inch diameter line from Stockbridge to Samaria and then 20-inch diameter laterals to Toledo and Lima.
(A47595)

25 Canadian assOCiatiOn OF PEtrOlEuM PrOduCErs
4.3.2 Crude Oil Pipeline Expansions/Proposals to the U.S. gulf CoastThe U.S. Gulf Coast began receiving western Canadian crude oil by pipeline in April 2006 through the reversed ExxonMobil Pegasus pipeline, which is scheduled to be expanded in June 2009. Prior to this, there were and continue to be spot vessel movements of western Canadian crude oil from the Trans Mountain Westridge dock. Due to the large refining capacity of the PADD III market, Canadian producers have been assessing various pipeline proposals to the Gulf Coast (Figure 4.3).
There are two proposals for bullet lines from Alberta to the U.S. Gulf Coast: the TransCanada Keystone XL and Altex Energy - with total capacity of about 1,565,000 b/d. Four pipeline companies (ExxonMobil/Enbridge, Sunoco,
ExxonMobil and Centurion) are proposing new pipelines, expansions or reversal of existing lines to transport western Canadian crude oil from the U.S. Midwest to the Gulf Coast. The in-service dates for these proposals will depend on market conditions. Proposals for projects targeting the U.S. Gulf Coast are summarized in Appendix C.2.
BP/Enbridge gulf Access Pipeline 12 13 14
BP and Enbridge are proposing the Gulf Access Pipeline which, in Phase 1, consists of the reversal and expansion of BP #1 pipeline which will interconnect with Southern Access at Flanagan, Indiana to move between 150,000 b/d and 200,000 b/d of crude oil to Cushing, Oklahoma. From Cushing, a new 250,000 b/d crude oil pipeline would be built to the U.S. Gulf Coast with interconnections to the Houston, Texas area refineries. Extensions could also be built to reach either Port Arthur, Texas or Nederland, Texas.
Current Oil Pipeline Expansions/Proposals to the U.S. Gulf Coast
Portland
Montreal
SarniaBuffalo
Philadelphia
Toledo
Lima
Chicago
Patoka
Cushing
St. Paul
Salt Lake City
St. JamesHouston
Edmonton
Anacortes
Burnaby
TransCanadaKeystone XL
Altex
Express
TransMountain
Platte
BP
Enbridge
Mid Valley
Capline
Flanagan
Guernsey
WoodRiver
Hardisty
4
5
8 6
10
11
12
13
14
22
21
23
TransCanada Keystone
BP/Enbridge GAPPhase 1
BP/Enbridge GAP Phase 2
BP/Enbridge GAP Phase 3
Enbridge Southern Access ExpansionEnbridge Southern Access Extension
TransCanadaLouisiana Access
Enbridge Alberta Clipper
Centurion Pipeline
ExxonMobil/EnbridgePegasus Expansion
Sunoco to USGC
figure 4.3 Pipeline Proposals to the U.S. gulf Coast
(A47595)
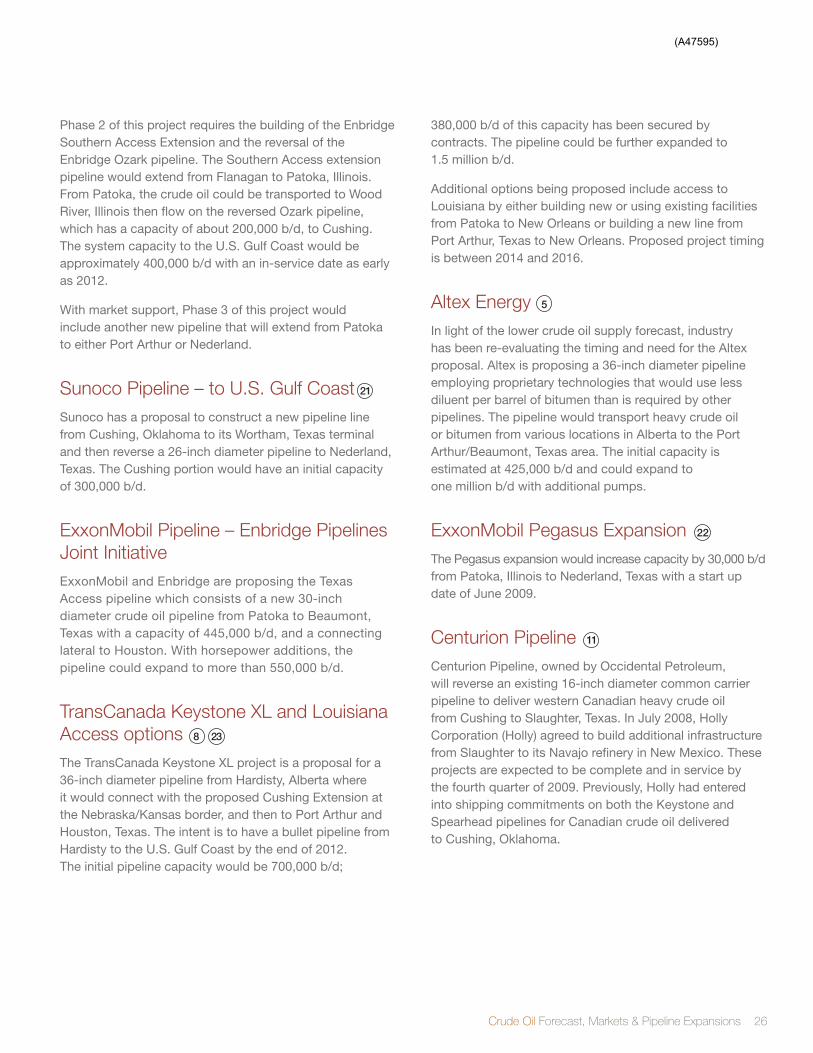
Crude Oil Forecast, Markets & Pipeline Expansions 26
Phase 2 of this project requires the building of the Enbridge Southern Access Extension and the reversal of the Enbridge Ozark pipeline. The Southern Access extension pipeline would extend from Flanagan to Patoka, Illinois. From Patoka, the crude oil could be transported to Wood River, Illinois then flow on the reversed Ozark pipeline, which has a capacity of about 200,000 b/d, to Cushing. The system capacity to the U.S. Gulf Coast would be approximately 400,000 b/d with an in-service date as early as 2012.
With market support, Phase 3 of this project would include another new pipeline that will extend from Patoka to either Port Arthur or Nederland.
Sunoco Pipeline – to U.S. gulf Coast 21
Sunoco has a proposal to construct a new pipeline line from Cushing, Oklahoma to its Wortham, Texas terminal and then reverse a 26-inch diameter pipeline to Nederland, Texas. The Cushing portion would have an initial capacity of 300,000 b/d.
ExxonMobil Pipeline – Enbridge Pipelines Joint InitiativeExxonMobil and Enbridge are proposing the Texas Access pipeline which consists of a new 30-inch diameter crude oil pipeline from Patoka to Beaumont, Texas with a capacity of 445,000 b/d, and a connecting lateral to Houston. With horsepower additions, the pipeline could expand to more than 550,000 b/d.
TransCanada keystone XL and Louisiana Access options 8 23
The TransCanada Keystone XL project is a proposal for a 36-inch diameter pipeline from Hardisty, Alberta where it would connect with the proposed Cushing Extension at the Nebraska/Kansas border, and then to Port Arthur and Houston, Texas. The intent is to have a bullet pipeline from Hardisty to the U.S. Gulf Coast by the end of 2012. The initial pipeline capacity would be 700,000 b/d;
380,000 b/d of this capacity has been secured by contracts. The pipeline could be further expanded to 1.5 million b/d.
Additional options being proposed include access to Louisiana by either building new or using existing facilities from Patoka to New Orleans or building a new line from Port Arthur, Texas to New Orleans. Proposed project timing is between 2014 and 2016.
Altex Energy 5 In light of the lower crude oil supply forecast, industry has been re-evaluating the timing and need for the Altex proposal. Altex is proposing a 36-inch diameter pipeline employing proprietary technologies that would use less diluent per barrel of bitumen than is required by other pipelines. The pipeline would transport heavy crude oil or bitumen from various locations in Alberta to the Port Arthur/Beaumont, Texas area. The initial capacity is estimated at 425,000 b/d and could expand to one million b/d with additional pumps.
ExxonMobil Pegasus Expansion 22
The Pegasus expansion would increase capacity by 30,000 b/d from Patoka, Illinois to Nederland, Texas with a start up date of June 2009.
Centurion Pipeline 11
Centurion Pipeline, owned by Occidental Petroleum, will reverse an existing 16-inch diameter common carrier pipeline to deliver western Canadian heavy crude oil from Cushing to Slaughter, Texas. In July 2008, Holly Corporation (Holly) agreed to build additional infrastructure from Slaughter to its Navajo refinery in New Mexico. These projects are expected to be complete and in service by the fourth quarter of 2009. Previously, Holly had entered into shipping commitments on both the Keystone and Spearhead pipelines for Canadian crude oil delivered to Cushing, Oklahoma.
(A47595)
27 Canadian assOCiatiOn OF PEtrOlEuM PrOduCErs
4.3.3 Crude Oil Pipeline Expansions/Proposals to the West CoastThe map in Figure 4.4 illustrates crude oil pipeline expansions from western Canada to the West Coast. Appendix C.3 provides a summary of all proposals.
kinder Morgan TMX2, TMX3 and Northern Leg Expansion 2 3
The TMX2 expansion could increase capacity by 80,000 b/d by 2012. The scope of TMX2 includes a new line from Edmonton, Alberta to Kamloops, British Columbia. TMX3 includes a new line to the Washington State refineries and a second berth at the Westridge dock. TMX3 could provide an additional 320,000 b/d of new
capacity by 2013. These expansions would provide additional access to Vancouver, Washington State and other markets served by oil tankers and barges which load at its Westridge dock.
TMX Northern Leg is a pipeline with a capacity of 400,000 b/d, extending from its existing system near Rearguard, British Columbia to a deep water port facility at Kitimat, British Columbia that would accommodate Very Large Crude Carriers (VLCC) for delivery to PADD V or the Far East. Depending on industry support, the pipeline could be in service as early as 2014.
Portland
SarniaBuffalo
Philadelphia
Toledo
Lima
Chicago
PatokaWoodRiver
Cushing
Flanagan
St. PaulGuernsey
Salt Lake City
St. JamesHouston
Hardisty
Edmonton
Anacortes
Burnaby
Express
TransMountain
PlatteBP
Enbridge
Mid Valley
Capline
Crude Oil Pipeline Expansion/Proposals to the West Coast
Enbridge GatewayKitimat
Kinder MorganTMX2 ExpansionTMX3 Expansion
3
1
2
TransCanadaAB-California7 Montreal
figure 4.4 Pipeline Proposals to the U.S. West Coast
(A47595)

Crude Oil Forecast, Markets & Pipeline Expansions 28
kinder Morgan Vancouver Port developmentKinder Morgan is proposing further development at the Vancouver port area by building a pipeline from the Westridge Dock to the Vancouver Wharves and/or building a line to the Delta Port enabling access to larger tanks thereby increasing export capacity.
Enbridge Northern gateway 1The Northern Gateway project includes the construction of a new 36-inch diameter pipeline from Edmonton, Alberta to a deep water port at Kitimat, British Columbia and is being designed to provide 500,000 b/d of crude oil export capacity. Crude oil would be loaded on tankers for delivery to PADD V and the Far East. Enbridge is, depending on industry support, anticipating submitting an application to the National Energy Board in the second quarter of 2009.
TransCanada AB – California 7TransCanada is in discussion with parties to transport 400,000 b/d of western Canadian crude oil by pipeline to California to access over 1.8 million b/d of refining capacity. The estimated in-service date is 2016.
4.3.4 Other ProposalsCanadian National (CN) Railways and Altex are jointly explorting a “Pipeline on Rail” strategy. This proposal could transport as little as 10,000 to 20,000 b/d of undiluted or under-diluted bitumen in heated railcars. Through connections to other railroads, CN can access the majority of U.S. Gulf Coast refineries. This rail solution would also be suitable for condensate imports. CN has expressed that if there was interest, there would be no upper limit to the volumes that could be transported via rail.
Diluent Pipeline Proposals
Portland
Sarnia
Philadelphia
Toledo
Lima
Chicago
Cushing
St. Paul
Salt Lake City
St. JamesHouston
Anacortes
Burnaby
Express
TransMountain
Platte
Enbridge
Mid Valley
Guernsey
Hardisty
Capline
Capline/Chicap
Enbridge Southern Lights
Enbridge Gateway Condensate Import
TransCanadaEdmonton
PatokaWoodRiver
24
25
26
27
Montreal
figure 4.5 Diluent Pipeline Proposals
(A47595)
29 Canadian assOCiatiOn OF PEtrOlEuM PrOduCErs
4.3.5 diluent Pipeline ProposalsFigure 4.5 shows the current diluent pipeline proposals.
Enbridge Southern Lights 26
The project is in response to demand by western Canadian heavy crude oil producers for additional diluent supply from various sources in the U.S. Midwest. The project includes a new 16-inch diameter diluent line from Flanagan, Illinois (near Chicago) to Clearbrook, Minnesota, and the reversal of Line 13 from Clearbrook to Edmonton, Alberta.
The capacity of the diluent import line is 180,000 b/d, of which 77,000 b/d is for committed shippers, and can be expanded to 300,000 b/d. The in-service date of July 2010 will coincide with crude oil expansions on the Enbridge mainline system (i.e. Southern Access and Alberta Clipper/Line 4 extension) in order that eastbound capacity is unaffected.
Joint Capline/Chicap Industry Initiative 27
The owners of both Chicap and Capline are co-operating to enable the movement of a limited amount of diluent from the U.S. Gulf Coast to Chicago by mid 2010. The plan is for the Chicap pipeline to connect to the Enbridge Southern Lights pipeline. Chicap runs from Patoka, Illinois to Manhattan and Mokena, Illinois. Ultimate capacity on the pipeline is estimated to be 320,000 b/d operating in batched diluent and light crude oil service. Initial total capacity of the pipeline in 2010 will be about 50 percent of the ultimate capacity. Capline extends from St. James, Louisiana to Patoka and has a capacity of more than one million b/d. The level of diluent deliveries is not known at this time.
Enbridge Northern gateway diluent 24
As part of its Northern Gateway crude oil pipeline project, Enbridge is proposing a 20-inch diameter, 175,000 b/d diluent import pipeline that would extend from Kitimat, British Columbia to Edmonton, Alberta. It would supply diluent to western Canadian heavy crude oil producers. An application to the National Energy Board is expected in the second quarter of 2009.
TransCanada diluent Pipeline 25
TransCanada is proposing a diluent line from Fort Saskatchewan, Alberta to Fort McMurray, Alberta with an initial capacity of 120,000 b/d and multiple delivery points. The possible in-service date is between 2012 and 2014.
4.4 Pipeline SummaryThe major pipeline proposals that are currently under construction will add over one million b/d in pipeline capacity exiting western Canada by the end of 2010. A corresponding growth in supply of one million b/d is not forecasted until 2016. Pipeline projects that are currently underway or in the regulatory process will provide excess capacity for a number of years and sufficient pipeline capacity available exiting Western Canada throughout the forecast period.
There are still many pipeline proposals being presented. However, many proposals were developed in response to earlier expectations that additional capacity was required to meet more rapid growth in oil sands production than is currently being forecast. Given the current supply outlook and market conditions, the timing of many of these pipeline proposals has been delayed.
(A47595)
Crude Oil Forecast, Markets & Pipeline Expansions 30
gLOSSARYaPI Gravity A specific gravity scale developed by the American Petroleum Institute (API) for measuring the
relative density or viscosity of various petroleum liquids.
Barrel A standard oil barrel is approximately equal to 35 Imperial gallons (42 U.S. gallons) or approximately 159 litres.
Bitumen A heavy, viscous oil that must be processed extensively to convert it into a crude oil before it can be used by refineries to produce gasoline and other petroleum products.
Bitumen Blend In this report, bitumen blend includes upgraded heavy sour crude oil, and bitumen to which light oil fractions (ie diluent or upgraded crude oil) have been added in order to reduce its viscosity and density to meet pipeline specifications.
Coker The processing unit in which bitumen is cracked into lighter fractions and withdrawn to start the conversion of bitumen into upgraded crude oil.
Condensate A mixture of mainly pentanes and heavier hydrocarbons. It may be gaseous in its reservoir state but is liquid at the conditions under which its volumes is measured or estimated.
Crude oil (Conventional) A mixture of pentanes and heavier hydrocarbons that is recovered or is recoverable at a well from an underground reservoir. It is liquid at the conditions under which its volumes is measured or estimated and includes all other hydrocarbon mixtures so recovered or recoverable except raw gas, condensate, or bitumen.
Crude oil (heavy) Crude oil is deemed, in this report, to be heavy crude oil if it has an API of 27º or less. No differentiation is made between sweet and sour crude oil that falls in the heavy category because heavy crude oil is generally sour.
Crude oil (medium) Crude oil is deemed, in this report, to be medium crude oil if it has an API greater than 27º but less than 30º. No differentiation is made between sweet and sour crude oil that falls in the medium category because medium crude oil is generally sour.
Crude oil (synthetic) A mixture of hydrocarbons, similar to crude oil, derived by upgrading bitumen from the oil sands.
Density The mass of matter per unit volume.
Dilbit Bitumen that has been reduced in viscosity through addition of a diluent (or solvent) such as condensate or naphtha.
Diluent Lighter viscosity petroleum products that are used to dilute bitumen for transportation in pipelines.
Extraction A process unique to the oil sands industry, in which bitumen is separated from their source (oil sands).
Feedstock In this report, feedstock refers to the raw material supplied to a refinery or oil sands upgrader.
Integrated mining A combined mining and upgrading operation where oil sands are mined from open pits. project The bitumen is then separated from the sand and upgraded by a refining process.
In Situ recovery The process of recovering crude bitumen from oil sands other than by surface mining.
Merchant upgrader Processing facilities that are not linked to any specific extraction project but is designed to accept raw bitumen on a contract basis from producers.
(A47595)

31 Canadian assOCiatiOn OF PEtrOlEuM PrOduCErs
oil Condensate, crude oil, or a constituent of raw gas, condensate, or crude oil that is recovered in processing and is liquid at the conditions under which its volume is measured or estimated.
oil sands Refers to a mixture of sand and other rock materials containing crude bitumen or the crude bitumen contained in those sands.
oil sands Deposit A natural reservoir containing or appearing to contain an accumulation of oil sands separated or appearing to be separated from any other such accumulation. The ERCB has designated three areas in Alberta as oil sands areas.
Pentanes Plus A mixture mainly of pentanes and heavier hydrocarbons that ordinarily may contain some butanes and is obtained from the processing of raw gas, condensate or crude oil.
PaDD Petroleum Administration for Defense District that defines a market area for crude oil in the U.S.
refined Petroleum End products in the refining process (e.g. gasoline). Products
specification Defined properties of a crude oil or refined petroleum product.
synBit A blend of bitumen and synthetic crude oil that has similar properties to medium sour crude oil.
Upgrading The process that converts bitumen or heavy crude oil into a product with a lower density and viscosity.
West Texas Intermediate WTI is a light sweet crude oil, produced in the United States, which is the benchmark grade of crude oil for North American price quotations.
(A47595)
Crude Oil Forecast, Markets & Pipeline Expansions 32
Acronyms API American Petroleum Institute
CAPP Canadian Association of Petroleum Producers
CSS Cyclic Steam Stimulation
DRA Drag Reducing Agent
EIA Energy Information Administration
ERCB (Alberta) Energy & Resources Conservation Board
IEA International Energy Agency
PADD Petroleum Administration for Defense District
S sulphur
SAGD Steam Assisted Gravity Drainage
U.S. United States
WCSB Western Canada Sedimentary Basin
WTI West Texas Intermediate
Canadian Provincial AbbreviationsAB Alberta
BC British Columbia
MB Manitoba
NWT Northwest Territories
ON Ontario
QC Québec
Unitsb/d barrels per day
Conversion Factor1 cubic metre = 6.293 barrels (oil)
APPENdIX A ACRONYMS, ABBREVIATIONS, UNITS ANd CONVERSION FACTORS
U.S. State AbbreviationsAL Alabama
AK Alaska
AZ Arizona
AR Arkansas
CA California
CO Colorado
CT Connecticut
DE Delaware
GA Georgia
ID Idaho
IL Illinois
IN Indiana
IA Iowa
KS Kansas
KY Kentucky
LA Louisiana
ME Maine
MD Maryland
MA Massachusetts
MI Michigan
MN Minnesota
MS Mississippi
MO Missouri
MT Montana
NE Nebraska
NV Nevada
NH New Hampshire
NJ New Jersey
NM New Mexico
NY New York
ND North Dakota
OH Ohio
OK Oklahoma
OR Oregon
PA Pennsylvania
SD South Dakota
TN Tennessee
TX Texas
UT Utah
VT Vermont
VA Virginia
WA Washington
WV West Virginia
WI Wisconsin
(A47595)
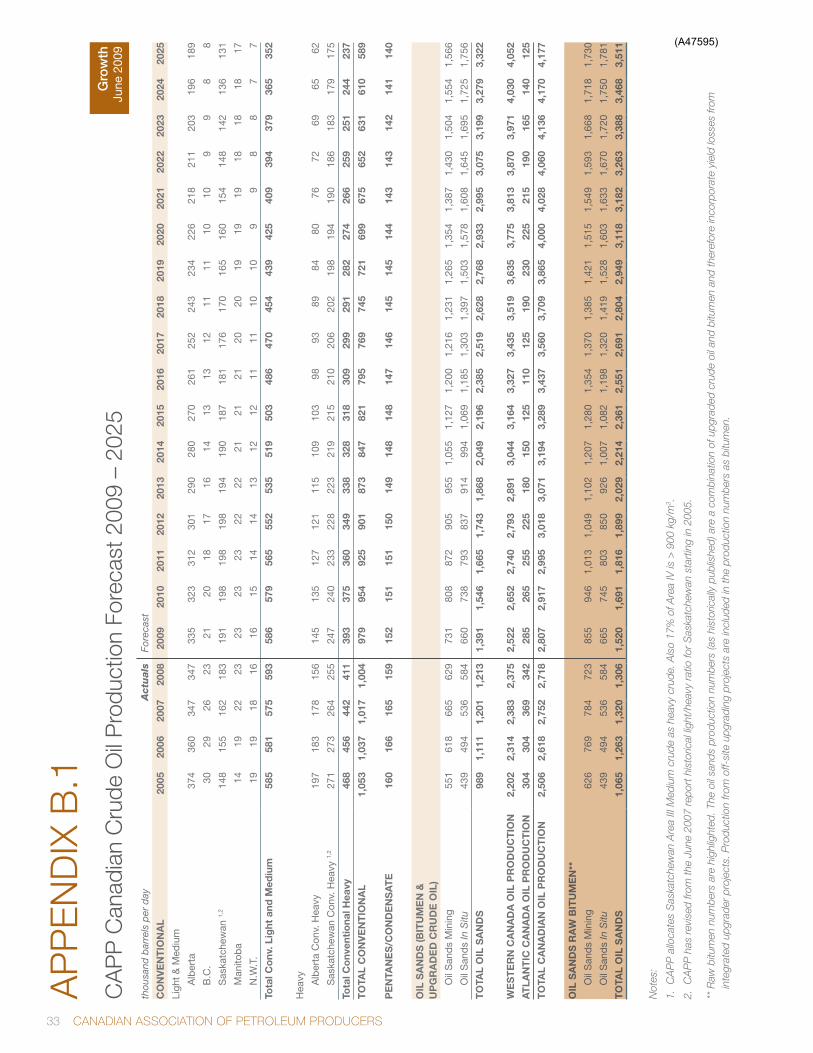
33 Canadian assOCiatiOn OF PEtrOlEuM PrOduCErs
AP
PE
Nd
IX B
.1
CA
PP
Can
adia
n C
rude
Oil
Pro
duct
ion
Fore
cast
200
9 –
2025
thou
sand
bar
rels
per
day
Act
uals
F
orec
ast
Co
NV
EN
TIo
Na
l20
0520
0620
0720
0820
0920
1020
1120
1220
1320
1420
1520
1620
1720
1820
1920
2020
2120
2220
2320
2420
25
Ligh
t &
Med
ium
A
lber
ta37
436
034
734
733
532
331
230
129
028
027
026
125
224
323
422
621
821
120
319
618
9
B
.C.
3029
2623
2120
1817
1614
1313
1211
1110
109
98
8
S
aska
tche
wan
1,2
148
155
162
183
191
198
198
198
194
190
187
181
176
170
165
160
154
148
142
136
131
M
anito
ba
1419
2223
2323
2322
2221
2121
2020
1919
1918
1818
17
N
.W.T
.19
1918
1616
1514
1413
1212
1111
1010
99
88
77
Tota
l Co
nv. l
ight
and
Med
ium
585
581
575
593
586
579
565
552
535
519
503
486
470
454
439
425
409
394
379
365
352
Hea
vy
A
lber
ta C
onv.
Hea
vy19
718
317
815
614
513
512
712
111
510
910
398
9389
8480
7672
6965
62
S
aska
tche
wan
Con
v. H
eavy
1,2
271
273
264
255
247
240
233
228
223
219
215
210
206
202
198
194
190
186
183
179
175
Tota
l Co
nven
tio
nal H
eavy
468
456
442
411
393
375
360
349
338
328
318
309
299
291
282
274
266
259
251
244
237
To
Tal
Co
NV
EN
TIo
Na
l1,
053
1,03
71,
017
1,00
497
995
492
590
187
384
782
179
576
974
572
169
967
565
263
161
058
9
PE
NTa
NE
s/C
oN
DE
Ns
aT
E16
016
616
515
915
215
115
115
014
914
814
814
714
614
514
514
414
314
314
214
114
0
oIl
sa
ND
s (B
ITU
ME
N &
U
PG
ra
DE
D C
rU
DE
oIl
)
O
il S
and
s M
inin
g 55
161
866
562
973
180
887
290
595
51,
055
1,12
71,
200
1,21
61,
231
1,26
51,
354
1,38
71,
430
1,50
41,
554
1,56
6
O
il S
and
s In
Situ
439
494
536
584
660
738
793
837
914
994
1,06
91,
185
1,30
31,
397
1,50
31,
578
1,60
81,
645
1,69
51,
725
1,75
6
To
Tal
oIl
sa
ND
s98
91,
111
1,20
11,
213
1,39
11,
546
1,66
51,
743
1,86
82,
049
2,19
62,
385
2,51
92,
628
2,76
82,
933
2,99
53,
075
3,19
93,
279
3,32
2
WE
sT
Er
N C
aN
aD
a o
Il P
ro
DU
CT
IoN
2,20
22,
314
2,38
32,
375
2,52
22,
652
2,74
02,
793
2,89
13,
044
3,16
43,
327
3,43
53,
519
3,63
53,
775
3,81
33,
870
3,97
14,
030
4,05
2
aT
laN
TIC
Ca
Na
Da
oIl
Pr
oD
UC
TIo
N30
430
436
934
228
526
525
522
518
015
012
511
012
519
023
022
521
519
016
514
012
5
To
Tal
Ca
Na
DIa
N o
Il P
ro
DU
CT
IoN
2,50
62,
618
2,75
22,
718
2,80
72,
917
2,99
53,
018
3,07
13,
194
3,28
93,
437
3,56
03,
709
3,86
54,
000
4,02
84,
060
4,13
64,
170
4,17
7
oIl
sa
ND
s r
aW
BIT
UM
EN
**
O
il S
and
s M
inin
g 62
676
978
472
385
594
61,
013
1,04
91,
102
1,20
71,
280
1,35
41,
370
1,38
51,
421
1,51
51,
549
1,59
31,
668
1,71
81,
730
O
il S
and
s In
Situ
439
494
536
584
665
745
803
850
926
1,00
71,
082
1,19
81,
320
1,41
91,
528
1,60
31,
633
1,67
01,
720
1,75
01,
781
To
Tal
oIl
sa
ND
s1,
065
1,26
31,
320
1,30
61,
520
1,69
11,
816
1,89
92,
029
2,21
42,
361
2,55
12,
691
2,80
42,
949
3,11
83,
182
3,26
33,
388
3,46
83,
511
Not
es:
1. C
AP
P a
lloca
tes
Sas
katc
hew
an A
rea
III M
ediu
m c
rude
as
heav
y cr
ude.
Als
o 17
% o
f Are
a IV
is >
900
kg/
m3 .
2. C
AP
P h
as r
evis
ed fr
om th
e Ju
ne 2
007
repo
rt h
isto
rical
ligh
t/he
avy
ratio
for
Sas
katc
hew
an s
tart
ing
in 2
005.
** R
aw b
itum
en n
umbe
rs a
re h
ighl
ight
ed. T
he o
il sa
nds
prod
uctio
n nu
mbe
rs (a
s hi
stor
ical
ly p
ublis
hed)
are
a c
ombi
natio
n of
upg
rade
d cr
ude
oil a
nd b
itum
en a
nd th
eref
ore
inco
rpor
ate
yiel
d lo
sses
from
in
tegr
ated
upg
rade
r pr
ojec
ts. P
rodu
ctio
n fro
m o
ff-si
te u
pgra
ding
pro
ject
s ar
e in
clud
ed in
the
prod
uctio
n nu
mbe
rs a
s bi
tum
en.
gro
wth
Ju
ne 2
009
(A47595)

Crude Oil Forecast, Markets & Pipeline Expansions 34
AP
PE
Nd
IX B
.2
CA
PP
Can
adia
n C
rude
Oil
Pro
duct
ion
Fore
cast
200
9 –
2025
thou
sand
bar
rels
per
day
Act
uals
Fore
cast
Co
NV
EN
TIo
Na
l20
0520
0620
0720
0820
0920
1020
1120
1220
1320
1420
1520
1620
1720
1820
1920
2020
2120
2220
2320
2420
25
Ligh
t &
Med
ium
A
lber
ta37
436
034
734
733
532
331
230
129
028
027
026
125
224
323
422
621
821
120
319
618
9
B
.C.
3029
2623
2120
1817
1614
1313
1211
1110
109
98
8
S
aska
tche
wan
1,2
148
155
162
183
191
198
198
198
194
190
187
181
176
170
165
160
154
148
142
136
131
M
anito
ba
1419
2223
2323
2322
2221
2121
2020
1919
1918
1818
17
N
.W.T
.19
1918
1616
1514
1413
1212
1111
1010
99
88
77
Tota
l Co
nv. l
ight
and
Med
ium
585
581
575
593
586
579
565
552
535
519
503
486
470
454
439
425
409
394
379
365
352
Hea
vy
A
lber
ta C
onv.
Hea
vy19
718
317
815
614
513
512
712
111
510
910
398
9389
8480
7672
6965
62
S
aska
tche
wan
Con
v. H
eavy
1,2
271
273
264
255
247
240
233
228
223
219
215
210
206
202
198
194
190
186
183
179
175
Tota
l Co
nven
tio
nal H
eavy
468
456
442
411
393
375
360
349
338
328
318
309
299
291
282
274
266
259
251
244
237
To
Tal
Co
NV
EN
TIo
Na
l1,
053
1,03
71,
017
1,00
497
995
492
590
187
384
782
179
576
974
572
169
967
565
263
161
058
9
PE
NTa
NE
s/C
oN
DE
Ns
aT
E16
016
616
515
915
215
115
115
014
914
814
814
714
614
514
514
414
314
314
214
114
0
oIl
sa
ND
s (B
ITU
ME
N &
U
PG
ra
DE
D C
rU
DE
oIl
)
O
il S
and
s M
inin
g 55
161
866
562
973
180
887
290
494
11,
012
1,02
21,
028
1,03
41,
038
1,03
81,
038
1,03
81,
038
1,03
81,
038
1,03
8
O
il S
and
s In
Situ
439
494
536
584
660
736
788
822
863
881
900
911
915
919
923
928
935
940
943
947
949
To
Tal
oIl
sa
ND
s98
91,
111
1,20
11,
213
1,39
11,
545
1,65
91,
727
1,80
41,
892
1,92
21,
939
1,94
91,
957
1,96
11,
966
1,97
31,
978
1,98
11,
985
1,98
7
WE
sTE
rN
Ca
Na
Da
oIl
Pr
oD
UC
TIo
N2,
202
2,31
42,
383
2,37
52,
522
2,65
02,
735
2,77
72,
826
2,88
72,
890
2,88
12,
864
2,84
82,
827
2,80
92,
791
2,77
32,
754
2,73
62,
716
aTla
NTI
C C
aN
aD
a o
Il P
ro
DU
CTI
oN
304
304
369
342
285
265
255
225
180
150
125
110
125
190
230
225
215
190
165
140
125
ToTa
l C
aN
aD
IaN
oIl
Pr
oD
UC
TIo
N2,
506
2,61
82,
752
2,71
82,
807
2,91
52,
990
3,00
23,
006
3,03
73,
015
2,99
12,
989
3,03
83,
057
3,03
43,
006
2,96
32,
919
2,87
62,
841
oIl
sa
ND
s r
aW
BIT
UM
EN
**
O
il S
and
s M
inin
g 62
676
978
472
385
594
61,
013
1,04
71,
086
1,15
81,
168
1,17
51,
180
1,18
41,
184
1,18
41,
184
1,18
41,
184
1,18
41,
184
O
il S
and
s In
Situ
439
494
536
584
665
743
798
835
876
893
912
924
928
932
936
941
947
953
956
959
961
To
Tal
oIl
sa
ND
s1,
065
1,26
31,
320
1,30
61,
520
1,68
91,
810
1,88
21,
962
2,05
12,
080
2,09
82,
108
2,11
62,
120
2,12
52,
132
2,13
72,
140
2,14
42,
145
Not
es:
1. C
AP
P a
lloca
tes
Sas
katc
hew
an A
rea
III M
ediu
m c
rude
as
heav
y cr
ude.
Als
o 17
% o
f Are
a IV
is >
900
kg/
m3 .
2. C
AP
P h
as r
evis
ed fr
omth
e Ju
ne 2
007
repo
rt h
isto
rical
ligh
t/he
avy
ratio
for
Sas
katc
hew
an s
tart
ing
in 2
005.
** R
aw b
itum
en n
umbe
rs a
re h
ighl
ight
ed. T
he o
il sa
nds
prod
uctio
n nu
mbe
rs (a
s hi
stor
ical
ly p
ublis
hed)
are
a c
ombi
natio
n of
upg
rade
d cr
ude
oil a
nd b
itum
en a
nd th
eref
ore
inco
rpor
ate
yiel
d lo
sses
from
inte
grat
ed u
pgra
der
proj
ects
. Pro
duct
ion
from
off-
site
upg
radi
ng p
roje
cts
are
incl
uded
in th
e pr
oduc
tion
num
bers
as
bitu
men
.
Op
erat
ing
& in
Co
nstr
uctio
n Ju
ne 2
009
(A47595)
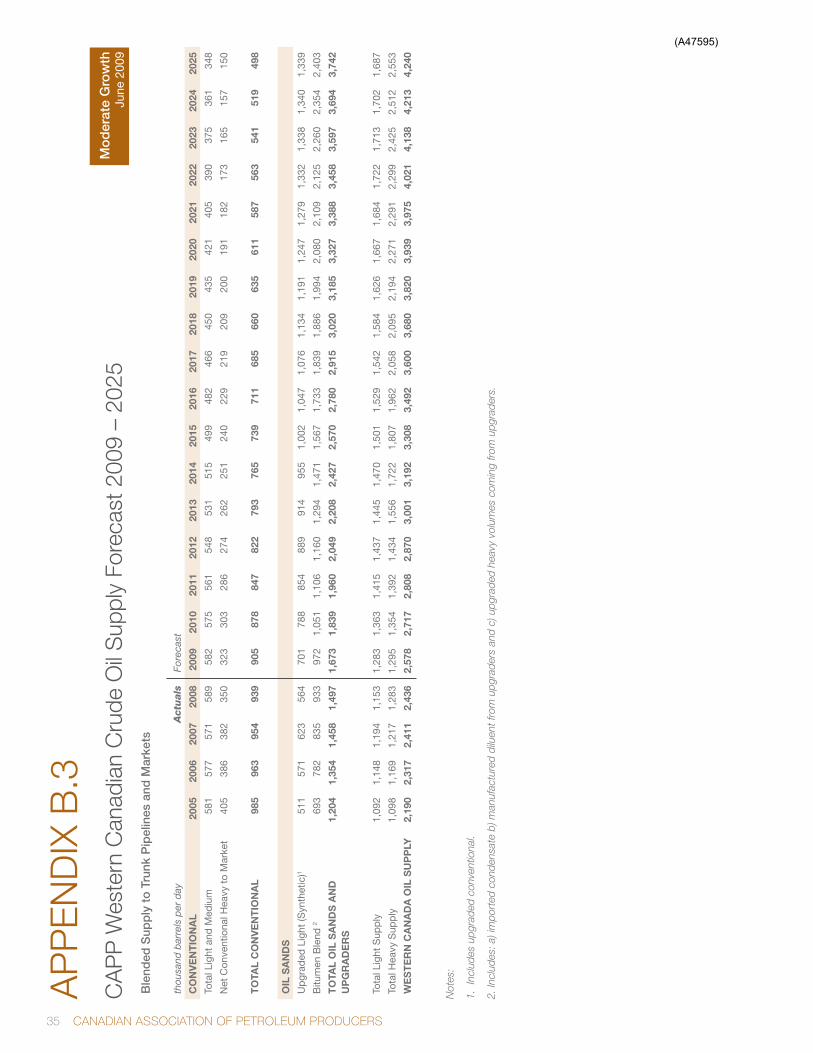
35 Canadian assOCiatiOn OF PEtrOlEuM PrOduCErs
AP
PE
Nd
IX B
.3
CA
PP
Wes
tern
Can
adia
n C
rude
Oil
Sup
ply
Fore
cast
200
9 –
2025
ble
nded
Sup
ply
to
tru
nk P
ipel
ines
and
Mar
kets
thou
sand
bar
rels
per
day
Act
uals
For
ecas
t
Co
NV
EN
TIo
Na
l20
0520
0620
0720
0820
0920
1020
1120
1220
1320
1420
1520
1620
1720
1820
1920
2020
2120
2220
2320
2420
25
Tota
l Lig
ht a
nd M
ediu
m58
157
757
158
958
257
556
154
853
151
549
948
246
645
043
542
140
539
037
536
134
8
Net
Con
vent
iona
l Hea
vy t
o M
arke
t40
538
638
235
032
330
328
627
426
225
124
022
921
920
920
019
118
217
316
515
715
0
To
Tal
Co
NV
EN
TIo
Na
l98
596
395
493
990
587
884
782
279
376
573
971
168
566
063
561
158
756
354
151
949
8
oIl
sa
ND
s
Up
grad
ed L
ight
(Syn
thet
ic)1
511
571
623
564
701
788
854
889
914
955
1,00
21,
047
1,07
61,
134
1,19
11,
247
1,27
91,
332
1,33
81,
340
1,33
9
Bitu
men
Ble
nd 2
693
782
835
933
972
1,05
11,
106
1,16
01,
294
1,47
11,
567
1,73
31,
839
1,88
61,
994
2,08
02,
109
2,12
52,
260
2,35
42,
403
To
Tal
oIl
sa
ND
s a
ND
U
PG
ra
DE
rs
1,20
41,
354
1,45
81,
497
1,67
31,
839
1,96
02,
049
2,20
82,
427
2,57
02,
780
2,91
53,
020
3,18
53,
327
3,38
83,
458
3,59
73,
694
3,74
2
Tota
l Lig
ht S
upp
ly1,
092
1,14
81,
194
1,15
31,
283
1,36
31,
415
1,43
71,
445
1,47
01,
501
1,52
91,
542
1,58
41,
626
1,66
71,
684
1,72
21,
713
1,70
21,
687
Tota
l Hea
vy S
upp
ly1,
098
1,16
91,
217
1,28
31,
295
1,35
41,
392
1,43
41,
556
1,72
21,
807
1,96
22,
058
2,09
52,
194
2,27
12,
291
2,29
92,
425
2,51
22,
553
WE
sT
Er
N C
aN
aD
a o
Il s
UP
Ply
2,19
02,
317
2,41
12,
436
2,57
82,
717
2,80
82,
870
3,00
13,
192
3,30
83,
492
3,60
03,
680
3,82
03,
939
3,97
54,
021
4,13
84,
213
4,24
0
Not
es:
1. I
nclu
des
upgr
aded
con
vent
iona
l.
2. In
clud
es: a
) im
port
ed c
onde
nsat
e b)
man
ufac
ture
d di
luen
t fro
m u
pgra
ders
and
c) u
pgra
ded
heav
y vo
lum
es c
omin
g fro
m u
pgra
ders
.
Mo
der
ate
gro
wth
Ju
ne 2
009
(A47595)
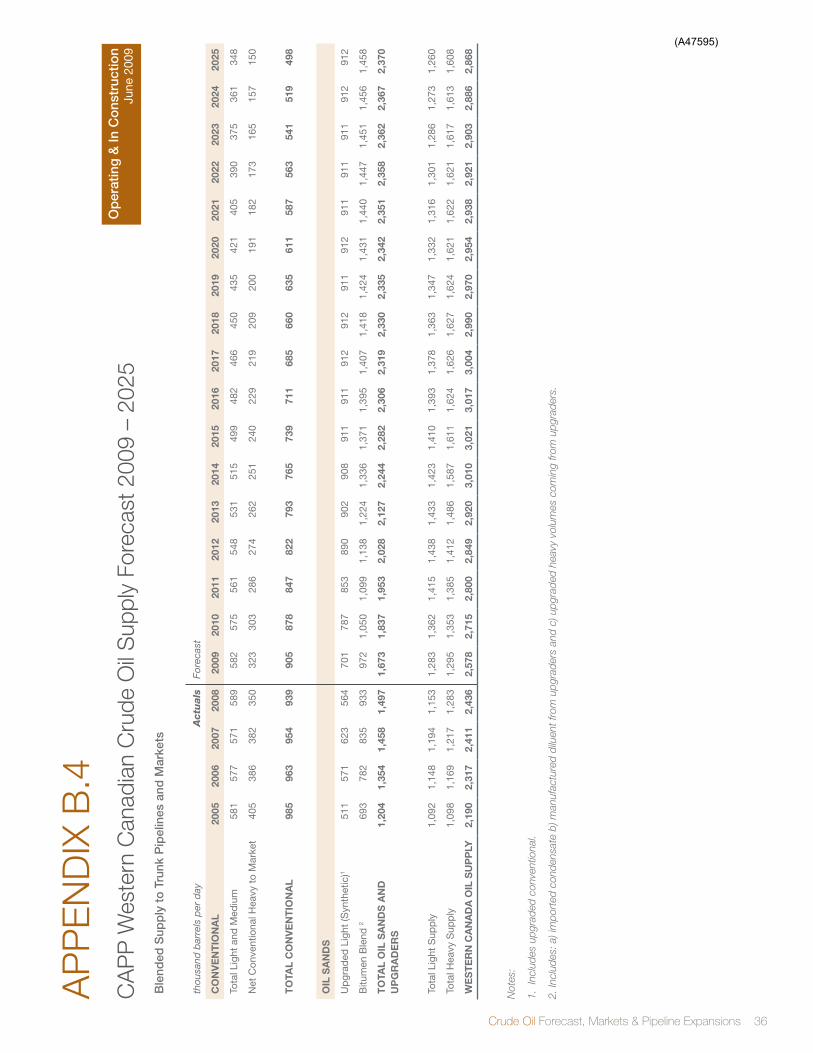
Crude Oil Forecast, Markets & Pipeline Expansions 36
AP
PE
Nd
IX B
.4
CA
PP
Wes
tern
Can
adia
n C
rude
Oil
Sup
ply
Fore
cast
200
9 –
2025
ble
nded
Sup
ply
to
tru
nk P
ipel
ines
and
Mar
kets
thou
sand
bar
rels
per
day
Act
uals
Fore
cast
Co
NV
EN
TIo
Na
l20
0520
0620
0720
0820
0920
1020
1120
1220
1320
1420
1520
1620
1720
1820
1920
2020
2120
2220
2320
2420
25
Tota
l Lig
ht a
nd M
ediu
m58
157
757
158
958
257
556
154
853
151
549
948
246
645
043
542
140
539
037
536
134
8
Net
Con
vent
iona
l Hea
vy t
o M
arke
t40
538
638
235
032
330
328
627
426
225
124
022
921
920
920
019
118
217
316
515
715
0
To
Tal
Co
NV
EN
TIo
Na
l98
596
395
493
990
587
884
782
279
376
573
971
168
566
063
561
158
756
354
151
949
8
oIl
sa
ND
s
Up
grad
ed L
ight
(Syn
thet
ic)1
511
571
623
564
701
787
853
890
902
908
911
911
912
912
911
912
911
911
911
912
912
Bitu
men
Ble
nd 2
693
782
835
933
972
1,05
01,
099
1,13
81,
224
1,33
61,
371
1,39
51,
407
1,41
81,
424
1,43
11,
440
1,44
71,
451
1,45
61,
458
To
Tal
oIl
sa
ND
s a
ND
U
PG
ra
DE
rs
1,20
41,
354
1,45
81,
497
1,67
31,
837
1,95
32,
028
2,12
72,
244
2,28
22,
306
2,31
92,
330
2,33
52,
342
2,35
12,
358
2,36
22,
367
2,37
0
Tota
l Lig
ht S
upp
ly1,
092
1,14
81,
194
1,15
31,
283
1,36
21,
415
1,43
81,
433
1,42
31,
410
1,39
31,
378
1,36
31,
347
1,33
21,
316
1,30
11,
286
1,27
31,
260
Tota
l Hea
vy S
upp
ly1,
098
1,16
91,
217
1,28
31,
295
1,35
31,
385
1,41
21,
486
1,58
71,
611
1,62
41,
626
1,62
71,
624
1,62
11,
622
1,62
11,
617
1,61
31,
608
WE
sT
Er
N C
aN
aD
a o
Il s
UP
Ply
2,19
02,
317
2,41
12,
436
2,57
82,
715
2,80
02,
849
2,92
03,
010
3,02
13,
017
3,00
42,
990
2,97
02,
954
2,93
82,
921
2,90
32,
886
2,86
8
Not
es:
1. I
nclu
des
upgr
aded
con
vent
iona
l.
2. In
clud
es: a
) im
port
ed c
onde
nsat
e b)
man
ufac
ture
d di
luen
t fro
m u
pgra
ders
and
c) u
pgra
ded
heav
y vo
lum
es c
omin
g fro
m u
pgra
ders
.
Op
erat
ing
& in
Co
nstr
uctio
n Ju
ne 2
009
(A47595)

37 Canadian assOCiatiOn OF PEtrOlEuM PrOduCErs
APPENdIX C.1Crude Oil Pipeline Expansions and Proposals to U.S. Midwest, Ontario, Québec and the U.S. East Coast
Pipeline originating Point End PointProposed
In-service DateCapacity
(thousand b/d)
Enbridge Spearhead - North Flanagan, IL Cushing, OK 3Q 2009 130
TransCanada Keystone Hardisty, AB Patoka, IL December 2009 435
Enbridge North Dakota North Dakota Clearbrook, MN January 2010 52
Enbridge Alberta Clipper Hardisty, AB Superior, WI July 2010 450
TransCanada Keystone Cushing Extension KS/NE border Cushing, OK 4Q 2010 155
Enbridge Chicago Connectivity Flanagan, IL Hartsdale 2012/2013 400
Enbridge Line 6B Expansion Chicago, IL Sarnia, ON 2012/2013 65 to 135
Enbridge Line 6C Griffith, Hartsdale, IN Stockbridge, MI 2012/2013 200
TransCanada Heartland Extension Fort Saskatchewan, AB Hardisty, AB 2012/2013 600
Enbridge Southern Access Extension (also referred to as part of BP/Enbridge Gulf Access)
Flanagan, IL Patoka, IL 2012+ 400 to 800
Enbridge Line 5 Expansion Superior, WI Sarnia, ON TBD 50
Enbridge Ohio Access Phase 1 Stockbridge, MI Toledo, OH TBD 20
Enbridge Ohio Access Phase 2 Stockbridge, MI Toledo, OH TBD 180
Enbridge Southern Access Expansion Superior, WI Flanagan, IL TBD 800
ExxonMobil Mustang Expansion Lockport, IL Patoka, IL TBD 38
Sunoco Pipeline - to Toledo Marysville, MI Toledo, OH TBD 190 to 288 (light crude)
Sunoco Pipeline - to Philadelphia Buffalo, NY Philadelphia, PA TBD 400
redeployment of Existing Infrastructure
Enbridge Trailbreaker (Line 9 re-reversal) Sarnia, ON Montréal, QC 2012/2013 215
Portland reversal Montréal, QC Portland, ME 2012/2013 200
(A47595)
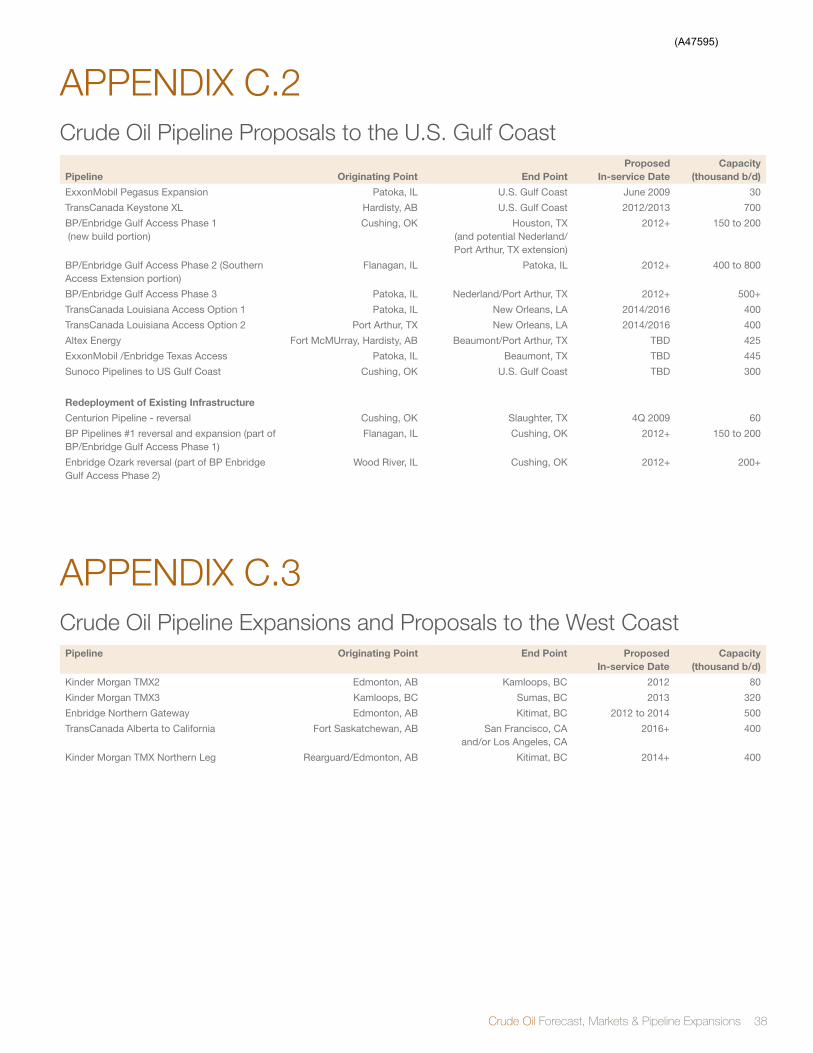
Crude Oil Forecast, Markets & Pipeline Expansions 38
APPENdIX C.2 Crude Oil Pipeline Proposals to the U.S. gulf Coast
Pipeline originating Point End PointProposed
In-service DateCapacity
(thousand b/d)
ExxonMobil Pegasus Expansion Patoka, IL U.S. Gulf Coast June 2009 30
TransCanada Keystone XL Hardisty, AB U.S. Gulf Coast 2012/2013 700
BP/Enbridge Gulf Access Phase 1 (new build portion)
Cushing, OK Houston, TX (and potential Nederland/ Port Arthur, TX extension)
2012+ 150 to 200
BP/Enbridge Gulf Access Phase 2 (Southern Access Extension portion)
Flanagan, IL Patoka, IL 2012+ 400 to 800
BP/Enbridge Gulf Access Phase 3 Patoka, IL Nederland/Port Arthur, TX 2012+ 500+
TransCanada Louisiana Access Option 1 Patoka, IL New Orleans, LA 2014/2016 400
TransCanada Louisiana Access Option 2 Port Arthur, TX New Orleans, LA 2014/2016 400
Altex Energy Fort McMUrray, Hardisty, AB Beaumont/Port Arthur, TX TBD 425
ExxonMobil /Enbridge Texas Access Patoka, IL Beaumont, TX TBD 445
Sunoco Pipelines to US Gulf Coast Cushing, OK U.S. Gulf Coast TBD 300
redeployment of Existing Infrastructure
Centurion Pipeline - reversal Cushing, OK Slaughter, TX 4Q 2009 60
BP Pipelines #1 reversal and expansion (part of BP/Enbridge Gulf Access Phase 1)
Flanagan, IL Cushing, OK 2012+ 150 to 200
Enbridge Ozark reversal (part of BP Enbridge Gulf Access Phase 2)
Wood River, IL Cushing, OK 2012+ 200+
APPENdIX C.3Crude Oil Pipeline Expansions and Proposals to the West CoastPipeline originating Point End Point Proposed
In-service DateCapacity
(thousand b/d)
Kinder Morgan TMX2 Edmonton, AB Kamloops, BC 2012 80
Kinder Morgan TMX3 Kamloops, BC Sumas, BC 2013 320
Enbridge Northern Gateway Edmonton, AB Kitimat, BC 2012 to 2014 500
TransCanada Alberta to California Fort Saskatchewan, AB San Francisco, CA and/or Los Angeles, CA
2016+ 400
Kinder Morgan TMX Northern Leg Rearguard/Edmonton, AB Kitimat, BC 2014+ 400
(A47595)
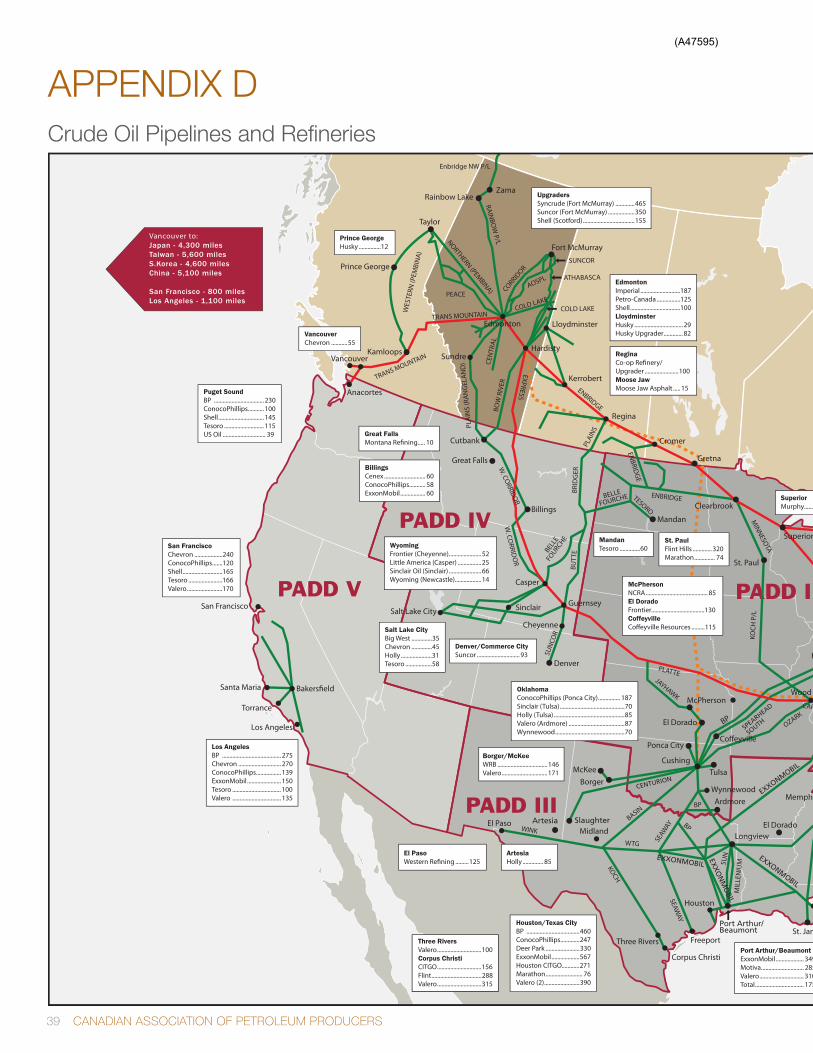
39 Canadian assOCiatiOn OF PEtrOlEuM PrOduCErs
APPENdIX dCrude Oil Pipelines and Refineries
Vancouver to:Japan - 4,300 milesTaiwan - 5,600 milesS.Korea - 4,600 milesChina - 5,100 miles
San Francisco - 800 milesLos Angeles - 1,100 miles
Prince GeorgeHusky...............12
For Information Contact: (403) 267-1141 / www.capp.ca
2008 Canadian Crude Oil Production 000 m3/d 000 b/d
British Columbia 5 34Alberta 297 1,869Saskatchewan 70 439Manitoba 4 24Northwest Territories 3 18
Western Canada 379 2,383Atlantic Canada 54 342Total Canada 433 2,725
Pipeline Tolls (US$ per barrel)Edmonton to Burnaby (Trans Mountain) 1.60 Anacortes (Trans Mountain) 1.85 Sarnia (Enbridge) 2.75 Chicago (Enbridge) 2.40 Wood River (Enbridge/Mustang/Capwood) 3.25 USGC (Enbridge/Mustang/ExxonMobil) 4.55Hardisty to Guernsey (Express/Platte) 1.45 Wood River (Express/Platte) 1.75 USGC (Express/Platte/MAP/ExxonMobil) 3.40USEC to Sarnia (Portland/Montreal/Enbridge) 2.00St. James to Wood River (Capline/Capwood) 0.65Freeport to Wood River (Seaway/Ozark) 1.50
Notes 1) Heavy crude adds 20-30% 2) Tolls rounded to nearest 5 cents 3) Tolls in effect July 1, 2009
Approved Crude Oil Pipelines
Flanagan
Port Arthur/Beaumont
Artesia Slaughter
CENTURION
SPEARHEAD
SOUTH
Come by Chance
St. Charles
EXXONMOBIL
EXXONMOBIL
EXX
ON
MO
BIL
EXXONMOBIL
VancouverChevron ...........55
Puget SoundBP ..................................230ConocoPhillips...........100Shell...............................145Tesoro ...........................115US Oil ............................. 39
San FranciscoChevron ...................240ConocoPhillips.......120Shell...........................165Tesoro .......................166Valero........................170
Great FallsMontana Refining..... 10
BillingsCenex............................ 60ConocoPhillips........... 58ExxonMobil................. 60
Los AngelesBP ........................................ 275Chevron ............................. 270ConocoPhillips.................139ExxonMobil....................... 150Tesoro ................................. 100Valero ................................. 135
EdmontonImperial ...........................187Petro-Canada ................125Shell..................................100LloydminsterHusky.................................29Husky Upgrader.............82
ReginaCo-op Refinery/Upgrader .......................100Moose JawMoose Jaw Asphalt .....15
NewfoundlandNorth Atlantic .................. 115
WyomingFrontier (Cheyenne)......................52Little America (Casper) ................25Sinclair Oil (Sinclair) ......................66Wyoming (Newcastle)..................14
Houston/Texas CityBP ....................................460ConocoPhillips.............247Deer Park .......................330ExxonMobil...................567Houston CITGO............271Marathon......................... 76Valero (2)........................390
Three RiversValero..............................100Corpus ChristiCITGO..............................156Flint..................................288Valero..............................315
Lake Charles/GaryvilleConocoPhillips...............239CITGO................................440Marathon.........................256Valero................................250
Port Arthur/BeaumontExxonMobil................... 349Motiva............................. 285Valero.............................. 310Total................................. 175
Saint JohnIrving....................250
HalifaxImperial ............... 82
DetroitMarathon...................102ToledoBP ................................155Sunoco .......................160LimaHusky..........................165CantonMarathon..................... 78CatlettsburgMarathon...................226
New JerseyConocoPhillips...............238Sunoco .............................145Valero................................185
Wood RiverWRB .....................................306RobinsonMarathon...........................204
MemphisValero...................195El DoradoLion......................... 70
El PasoWestern Refining .........125
OklahomaConocoPhillips (Ponca City)............... 187Sinclair (Tulsa)............................................70Holly (Tulsa) ................................................85Valero (Ardmore) ......................................87Wynnewood...............................................70
Borger/McKeeWRB ..................................146Valero...............................171
Denver/Commerce CitySuncor ............................. 93
Salt Lake CityBig West ..............35Chevron ..............45Holly .....................31Tesoro ..................58
MandanTesoro ..............60
St. PaulFlint Hills .............320Marathon.............. 74
McPhersonNCRA.......................................... 85El DoradoFrontier....................................130CoffeyvilleCoffeyville Resources .........115
SuperiorMurphy............ 35
ChicagoBP ............................. 400ExxonMobil............ 239PDV .......................... 167
SarniaImperial ............... 121Nova ........................80Shell.........................74Suncor ....................85NanticokeImperial ............... 120
Montreal/QuébecPetro-Canada ........130Shell..........................126Valero.......................235
PhiladelphiaConocoPhillips (Trainer)............. 185Sunoco (Marcus Hook) ............... 178Sunoco (Philadelphia)................. 335
WarrenUnited ......... 70
UpgradersSyncrude (Fort McMurray) .............465Suncor (Fort McMurray) ..................350Shell (Scotford)...................................155
ArtesiaHolly .............. 85
(A47595)
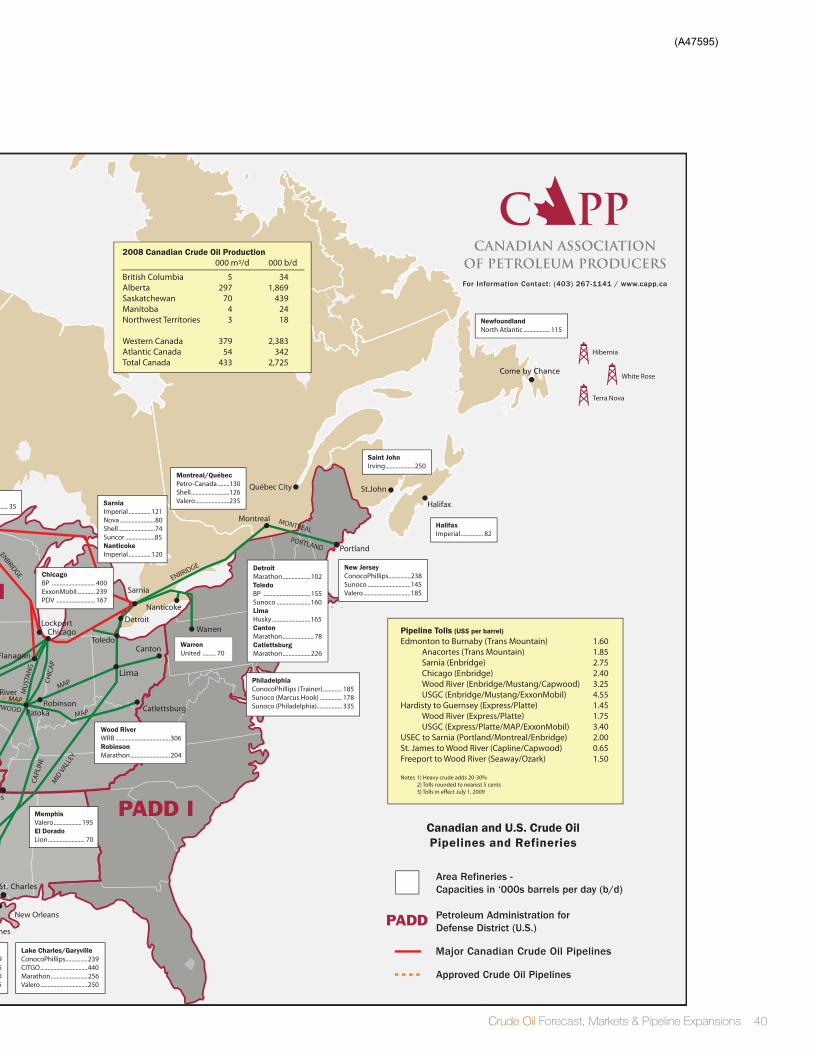
Crude Oil Forecast, Markets & Pipeline Expansions 40
Vancouver to:Japan - 4,300 milesTaiwan - 5,600 milesS.Korea - 4,600 milesChina - 5,100 miles
San Francisco - 800 milesLos Angeles - 1,100 miles
Prince GeorgeHusky...............12
For Information Contact: (403) 267-1141 / www.capp.ca
2008 Canadian Crude Oil Production 000 m3/d 000 b/d
British Columbia 5 34Alberta 297 1,869Saskatchewan 70 439Manitoba 4 24Northwest Territories 3 18
Western Canada 379 2,383Atlantic Canada 54 342Total Canada 433 2,725
Pipeline Tolls (US$ per barrel)Edmonton to Burnaby (Trans Mountain) 1.60 Anacortes (Trans Mountain) 1.85 Sarnia (Enbridge) 2.75 Chicago (Enbridge) 2.40 Wood River (Enbridge/Mustang/Capwood) 3.25 USGC (Enbridge/Mustang/ExxonMobil) 4.55Hardisty to Guernsey (Express/Platte) 1.45 Wood River (Express/Platte) 1.75 USGC (Express/Platte/MAP/ExxonMobil) 3.40USEC to Sarnia (Portland/Montreal/Enbridge) 2.00St. James to Wood River (Capline/Capwood) 0.65Freeport to Wood River (Seaway/Ozark) 1.50
Notes 1) Heavy crude adds 20-30% 2) Tolls rounded to nearest 5 cents 3) Tolls in effect July 1, 2009
Approved Crude Oil Pipelines
Flanagan
Port Arthur/Beaumont
Artesia Slaughter
CENTURION
SPEARHEAD
SOUTH
Come by Chance
St. Charles
EXXONMOBIL
EXXONMOBIL
EXX
ON
MO
BIL
EXXONMOBIL
VancouverChevron ...........55
Puget SoundBP ..................................230ConocoPhillips...........100Shell...............................145Tesoro ...........................115US Oil ............................. 39
San FranciscoChevron ...................240ConocoPhillips.......120Shell...........................165Tesoro .......................166Valero........................170
Great FallsMontana Refining..... 10
BillingsCenex............................ 60ConocoPhillips........... 58ExxonMobil................. 60
Los AngelesBP ........................................ 275Chevron ............................. 270ConocoPhillips.................139ExxonMobil....................... 150Tesoro ................................. 100Valero ................................. 135
EdmontonImperial ...........................187Petro-Canada ................125Shell..................................100LloydminsterHusky.................................29Husky Upgrader.............82
ReginaCo-op Refinery/Upgrader .......................100Moose JawMoose Jaw Asphalt .....15
NewfoundlandNorth Atlantic .................. 115
WyomingFrontier (Cheyenne)......................52Little America (Casper) ................25Sinclair Oil (Sinclair) ......................66Wyoming (Newcastle)..................14
Houston/Texas CityBP ....................................460ConocoPhillips.............247Deer Park .......................330ExxonMobil...................567Houston CITGO............271Marathon......................... 76Valero (2)........................390
Three RiversValero..............................100Corpus ChristiCITGO..............................156Flint..................................288Valero..............................315
Lake Charles/GaryvilleConocoPhillips...............239CITGO................................440Marathon.........................256Valero................................250
Port Arthur/BeaumontExxonMobil................... 349Motiva............................. 285Valero.............................. 310Total................................. 175
Saint JohnIrving....................250
HalifaxImperial ............... 82
DetroitMarathon...................102ToledoBP ................................155Sunoco .......................160LimaHusky..........................165CantonMarathon..................... 78CatlettsburgMarathon...................226
New JerseyConocoPhillips...............238Sunoco .............................145Valero................................185
Wood RiverWRB .....................................306RobinsonMarathon...........................204
MemphisValero...................195El DoradoLion......................... 70
El PasoWestern Refining .........125
OklahomaConocoPhillips (Ponca City)............... 187Sinclair (Tulsa)............................................70Holly (Tulsa) ................................................85Valero (Ardmore) ......................................87Wynnewood...............................................70
Borger/McKeeWRB ..................................146Valero...............................171
Denver/Commerce CitySuncor ............................. 93
Salt Lake CityBig West ..............35Chevron ..............45Holly .....................31Tesoro ..................58
MandanTesoro ..............60
St. PaulFlint Hills .............320Marathon.............. 74
McPhersonNCRA.......................................... 85El DoradoFrontier....................................130CoffeyvilleCoffeyville Resources .........115
SuperiorMurphy............ 35
ChicagoBP ............................. 400ExxonMobil............ 239PDV .......................... 167
SarniaImperial ............... 121Nova ........................80Shell.........................74Suncor ....................85NanticokeImperial ............... 120
Montreal/QuébecPetro-Canada ........130Shell..........................126Valero.......................235
PhiladelphiaConocoPhillips (Trainer)............. 185Sunoco (Marcus Hook) ............... 178Sunoco (Philadelphia)................. 335
WarrenUnited ......... 70
UpgradersSyncrude (Fort McMurray) .............465Suncor (Fort McMurray) ..................350Shell (Scotford)...................................155
ArtesiaHolly .............. 85
(A47595)
41 Canadian assOCiatiOn OF PEtrOlEuM PrOduCErs
Disclaimer: This publication was prepared by the Canadian Association of Petroleum Producers (CAPP). While it is believed that the information contained herein is reliable under the conditions and subject to the limitations set out, CAPP does not guarantee the accuracy or completeness of the information. The use of this report or any information contained will be at the user’s sole risk, regardless of any fault or negligence of CAPP.
The Canadian Association of
Petroleum Producers (CAPP)
represents 130 companies that
explore for, develop and produce
natural gas, natural gas liquids, crude
oil, oil sands, and elemental sulphur
throughout Canada. CAPP member
companies produce more than 90
per cent of Canada’s natural gas
and crude oil. CAPP also has 150
associate members that provide a
wide range of services that support
the upstream crude oil and natural
gas industry. Together, these
members and associate members
are an important part of a
$120-billion-a-year national industry
that affects the livelihoods of more
than half a million Canadians.
Calgary Office:
2100, 350 - 7 Avenue SW
Calgary, Alberta, Canada
T2P 3N9
Phone: 403-267-1100
Fax: 403-261-4622
St. John’s Office:
403, 235 Water Street
St. John’s, Newfoundland
and Labrador
Canada A1C 1B6
Phone: 709-724-4200
Fax: 709-724-4225
www.capp.ca
June 2009
2009 - 0017
(A47595)


