Ministry of Higher Education And Scientific Research University of Baghdad College of Science Crude Oil Characterization and Source Affinities of Missan Oil Fields, Southeastern Iraq. A Thesis Submitted to the College of Science University of Baghdad in Partial Fulfillment of the Requirements for the Degree of Doctor of philosophy in Geology / (Petroleum Geology) By FURAT ATA SALEH AL-MUSAWI M. Sc. University of Baghdad, 1997 Mars 2010 1431
Transcript
Ministry of Higher Education And Scientific Research University of Baghdad College of Science
Crude Oil Characterization and Source Affinities of Missan Oil
Fields, Southeastern Iraq.
A Thesis Submitted to the College of Science University of Baghdad in Partial Fulfillment of the
Requirements for the Degree of Doctor of philosophy in Geology / (Petroleum Geology)
By
FURAT ATA SALEH AL-MUSAWI M. Sc. University of Baghdad, 1997
Mars 2010 1431
The Supervisor Certification I certify that this thesis (Crude Oil Characterization and Source Affinities of Missan Oil Fields, Southeastern Iraq) was prepared under my supervision at the Department of Geology, College of Science in the University of Baghdad, in partial fulfillment of requirements for the Degree of Doctor of philosophy in Geology (Petroleum Geology).
Signature: Signature: Name: Dr. Thamer K. Al-Amiri Name: Dr. Ameen I. Al-Yasi Scientific Degree: Professor Scientific Degree: Assistant Professor Address: University of Baghdad-College of Science- Dep. of Geology.
Address: University of Baghdad-College of Science- Dep. of Geology.
Date: / /2010 Date: / /2010
Recommendation of the Head of Committee of Postgraduate Studies in Geology Department
In view of the available recommendations, I forward this thesis for debate by the examining committee.
Signature:
Name: Dr. Ahmad Shehab Al - Banna Title: Professor Address: Head Geology Department, College of Science, University of Baghdad. Date: / /2010
Committee Certification
We, the members of the Examining Committee, certify that after reading this thesis and examining the student in its contents, we think it is adequate for the award of the Degree of Doctor of Philosophy in Geology (Petroleum).
Signature: Signature: Name: Dr. Ali D. Gayara Name: Dr. Fawzi M. Al-Beyati Title: Professor Title: Assistant Professor Address: University of Baghdad-College of Science- Dep. of Geology
Address: Technical Collage. Kirkuk
Date: Date: (Chairman) (Member) Signature: Signature: Name: Dr. Muafak F. Al-Shahwan Name: Dr. Madhat E. Nasser Title: Assistant Professor Title: Assistant Professor Address: University of Basra-College of Science- Dep. of Geology
Address: University of Baghdad-College of Science- Dep. of Geology
Date: Date: (Member) (Member) Signature: Signature: Name: Dr. Thamer K. Al-Amiri Name: Dr. Hayfa A. Najem Title: Professor Title: Assistant Professor Address: University of Baghdad-College of Science- Dep. of Geology
Address: University of Baghdad-College of Science- Dep. of Geology
Date: Date: (Supervisor Member) (Member) Signature: Name: Dr. Ameen I. Al-Yasi Title: Assistant Professor Address: University of Baghdad-College of Science- Dep. of Geology
Date: (Supervisor Member)
Approved by the Deanery of the College of Science. Signature: Name: Dr. Khalid S. Al-Mukhtar Title: Professor Address: Dean of the College of Science, University of Baghdad Date:
ACKNOWLEDGEMENT
Appreciation is given to all colleagues who did their best to assist me
to accomplish my thesis. I would like to thank the Ministry of Higher
Education and Scientific Research, University of Baghdad, college of
Science, for helping me to get the joint scholarship to Stanford University,
USA.
Also so many thanks to the Department of Earth Sciences for every
thing (Teaching, Training, Guiding and encouraging).
I am delighted to acknowledge with my debts to my advisor Prof.Dr.
Thamer. k. Al-Ameri, and to my co-adviser Assistant.Prof.Dr Ameen
Ibrahim, for advising me and supplying requirements to perform this work.
I am terribly grateful to Missan Oil Company, and south oil
company, for helping me with my project, and for collecting my crude oils
and rock samples.
I appreciate the role of the oil expert Mr. Mohamad .A. jabbar in
Missan oil company for his coordination and following through out the
project.
Admiration and respect to Prof.Dr. J.K.Moldowan, Stanford
University, School of Earth Science, USA, for helping me to conduct all
my Biomarker analysis at his molecular labs.
In addition, I wish to thank Dr.K.Peters, oil expert at Schlemperge
oil company, USA for his help to interpret my result data.
Thanks to Dr.J.Dahil, oil expert at Chevron oil company, USA, for
his helps at the labs.
Special thanks to the Iraq Geosurv , Geology expert Mr.V.Sissakian,
for helping me in the project.
Great thanks to all post graduate student, Baghdad University,
Geology Department for their cooperation.
TABLE OF CONTENTS Subject Page NoTable of contents List of figures List of tables Abstract CHAPTER ONE - Introduction 1.1. Introduction 1 1.2. Previous Studies 1 1.3. Aim of Study 2 1.4. Location of Study Area 2 1.5. Materials and Methodology 4 1.5.1. Geological investigation 5 1.5.2 Geochemical investigation 5 1.5.2.1. Pyrolysis analysis 5 1.5.2.2. Vitrinite reflectance (Ro %) 7 1.5.2.3. Bitumen extraction 9 1.5.2.4. Crude oil analysis 10 1.5.2.5. Gas chromatographic analyses 11 1.5.3. Organic facies and Palynofacies investigation 17 1.6. Geological Setting 18 CHAPTER TWO - PALYNOFACIES ANALYSIS 2.1. Palynofacies And Kerogen Types 22 2.1.1. Noor-1 Well 31 2.2. Paleoenvironmenta Interpretation 34 2.3. Organic Thermal Maturation 35 2.3.1. NO-1 Well 38
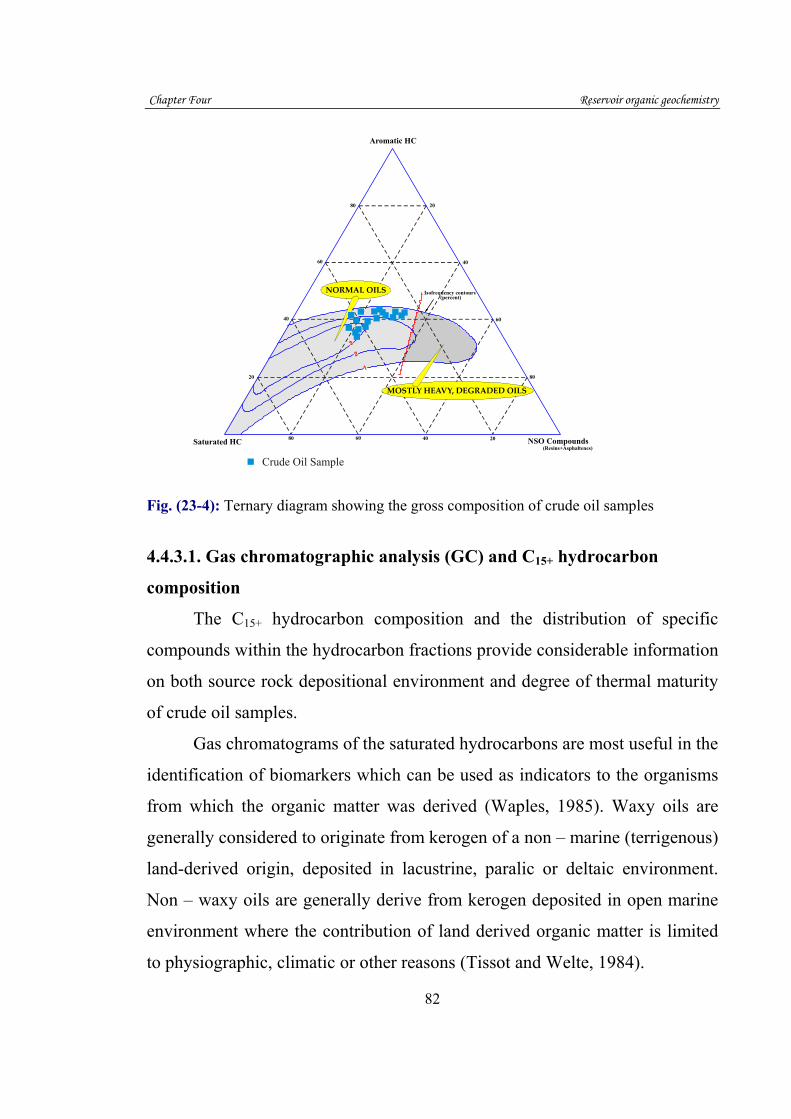
CHAPTER THREE - SOURCE ROCKS EVALUATION 47 3.1. Principles of evaluation 48 3.1.1. Organic richness 48 3.1.2. Genetic type of organic matter 50 3.1.3. Thermal maturation 54 3.2. Source Rock Characterization Using Rock-Eval Pyrolysis 56 3.2.1. Sulaiy Formation 56 3.3. Source Rock Characterization Using Biomarkers 61 3.3.1. Source and Age Related Biomarker Parameters 61 3.4. Nordiacholestane and 24-Norcholestane Ratios 68 3.5. Maturity-Related Biomarker/ Non-Biomarker Parameters 72 CHAPTER FOUR- Reservoir organic geochemistry 74 4.1. Crude oil geochemistry 78 4.1.1. API gravity 78 4.1.2. Sulfur content 79 4.1.3. Crude oil compositions 80 4.1.3.1. Gas chromatographic analysis (GC) and C15 +
hydrocarbon composition 82
4.1.4. Stable carbon isotope composition (δ13 C %o) 95 4.1.5. Alkanes and Acyclic Isoprenoids 98 4.1.5.1. Pristane/Phytane 98 4.1.5.2. Terpanes and Similar Compounds 99 4.2. Maturity-Related Biomarker/ Non-Biomarker Parameters 1 4 1 CHAPTER FIVE- ORGANIC GEOCHEMICAL CORRELATION 150
5.1. Oil - Oil correlation 150 5.2. Oil - Source rock correlation 150 5.2.1. Age and Oil-Source Correlation Relevant Parameters 153
154 5.2.2. Parameters related to maturity, lithology and depositional environment
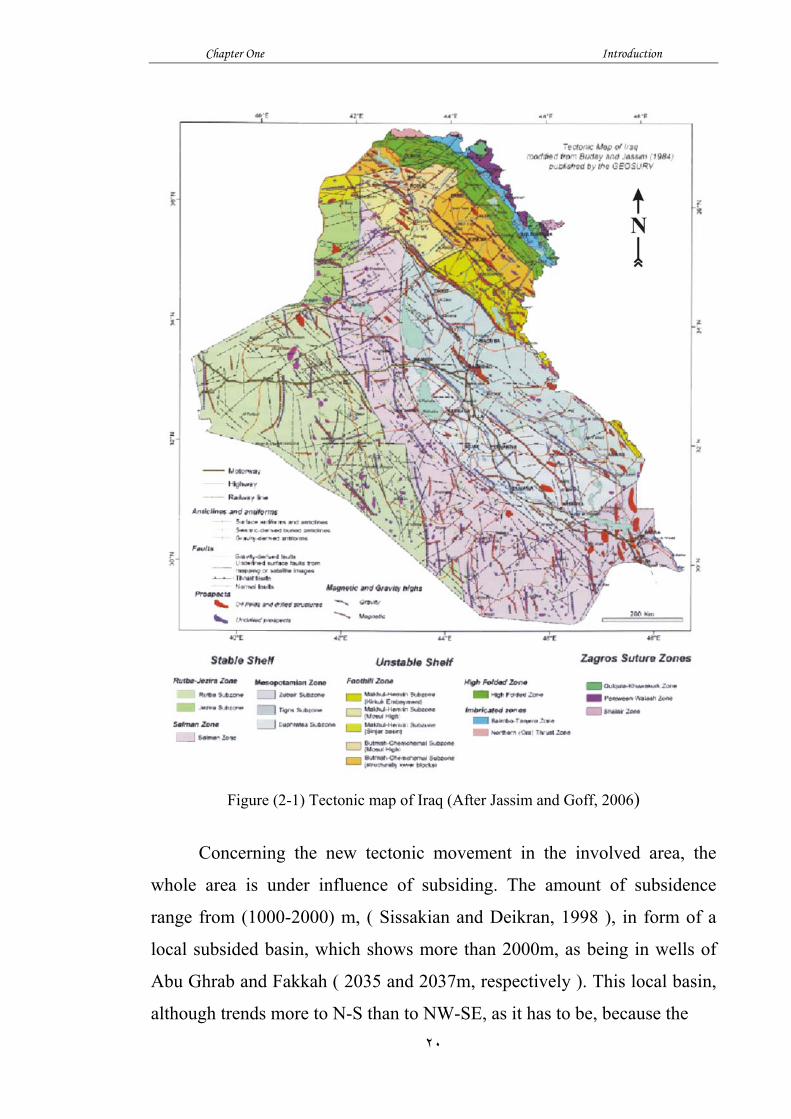
FIGURES Page No.1.1. Location map of study area 3 2.1. Tectonic map of Iraq (After Jassim and Goff, 2006) 20 3.2. Schematic key to assist identification of dispersed
palynological organic matter in thermally immature to marginally mature sediments (Tyson, 1995)
30
4.2. Percentage distribution of particulate organic matter groups within the defined Palynofacies of the (NO-1) well 33
5.2. AOM-Phytoclast-Palynomorph ternary plot of NO-1 well (Tyson, 1995) 35
6.2. Oil and gas generation as a function of increasing sediment burial (Modified after Oehler, 1983) 37
7.2. Pearson’s (1984) color chart compared with other organic thermal maturity, TAI and Vitrinite reflectance (Modified from Traverse, 1988)
37
8.3. Geochemical characteristics TOC, S2, Tmax and Ro versus depth of Sulaiy Formation 58
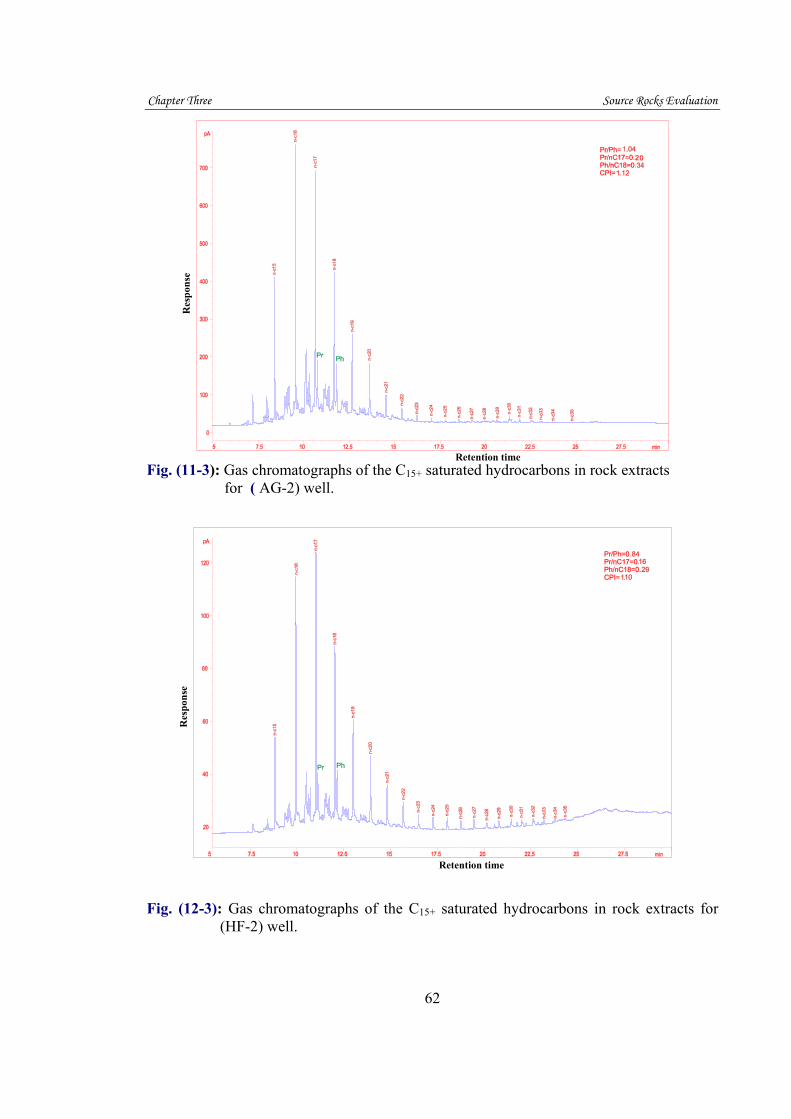
9.3. HI versus OI of Sulaiy Formation (Espitalie et al., 1977) 58 10.3. Geochemical log of the NO-1 well 60 11.3. Gas chromatographs of the C15+ saturated hydrocarbons in
rock extracts for AG-2 well 63
12.3. Gas chromatographs of the C15+ saturated hydrocarbons in rock extracts for HF-2 well 63
13.3. Gas chromatographs of the C15+ saturated hydrocarbons in rock extracts for R-167 well 64
14.3. Gas chromatographs of the C15+ saturated hydrocarbons in rock extracts for AM-3 well 64
15.3. Gas chromatographs of the C15+ saturated hydrocarbons in rock extracts for NO-1 well 65
16.3. Gas chromatographs of the C15+ saturated hydrocarbons in rock extracts for R-172 well 65
17.3. Pristane /nC17 versus phytane/nC18 for source rock extracts in the study area, can be used to infer oxicity and organic matter type in the source-rock depositional environment (Peters et al., 1999; Shanmugam, 1985)
67
18.3. Cross-plot of pristane/nC17 versus phytane/nC18, showing the genetic type of organic matter for crude oil samples (Obermajer et al., 1999)
68
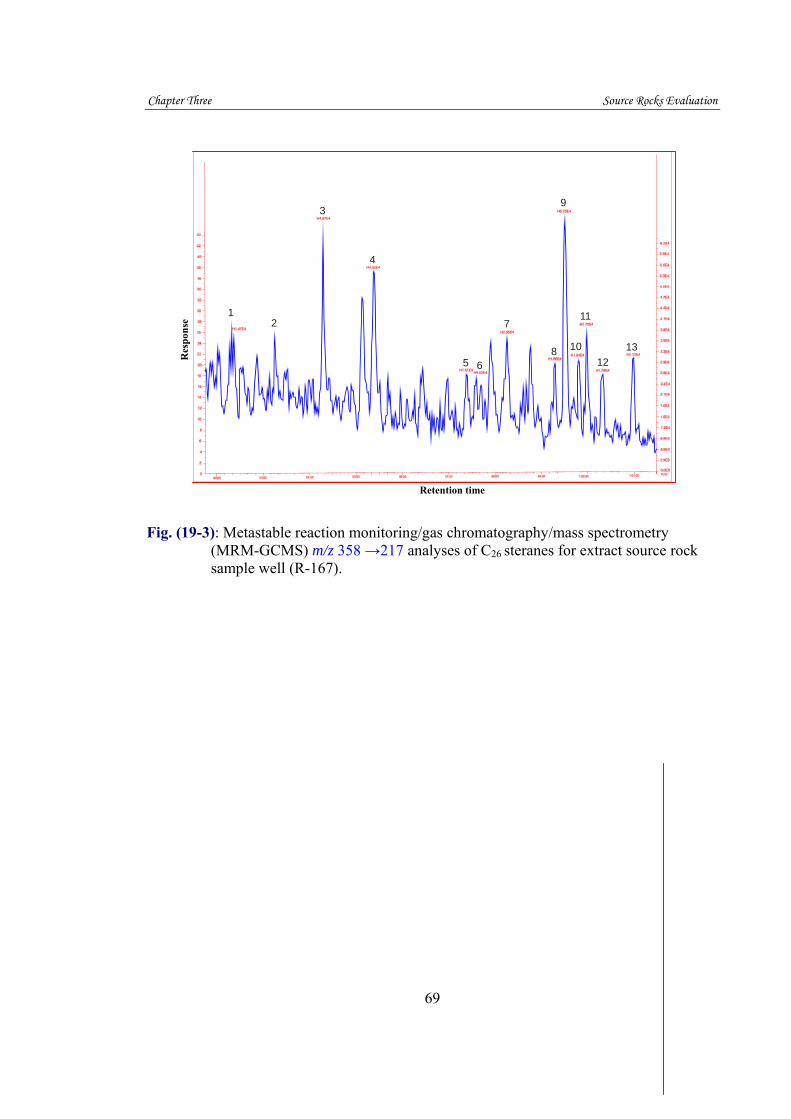
19.3. Metastable reaction monitoring/gas chromatography/mass spectrometry (MRM-GCMS) m/z 358 →217 analyses of C26 steranes for extract source rock sample well (R-167)
70
20.3. Metastable reaction monitoring/gas chromatography/mass spectrometry (MRM-GCMS) m/z 358 →217 analyses of C26 steranes for extract source rock sample well (AM-3)
71
2 1 . 3 . Metastable reaction monitoring/gas chromatography/mass spectrometry (MRM-GCMS) m/z 358 →217 analyses of C26 steranes for extract source rock sample well (NO-1)
7 1
22.3. Metastable reaction monitoring/gas chromatography/mass spectrometry (MRM-GCMS) m/z 358 →217 analyses of C26 steranes for extract source rock sample well (R-172)
72
23.4. Ternary diagram showing the gross composition of crude oil samples 82
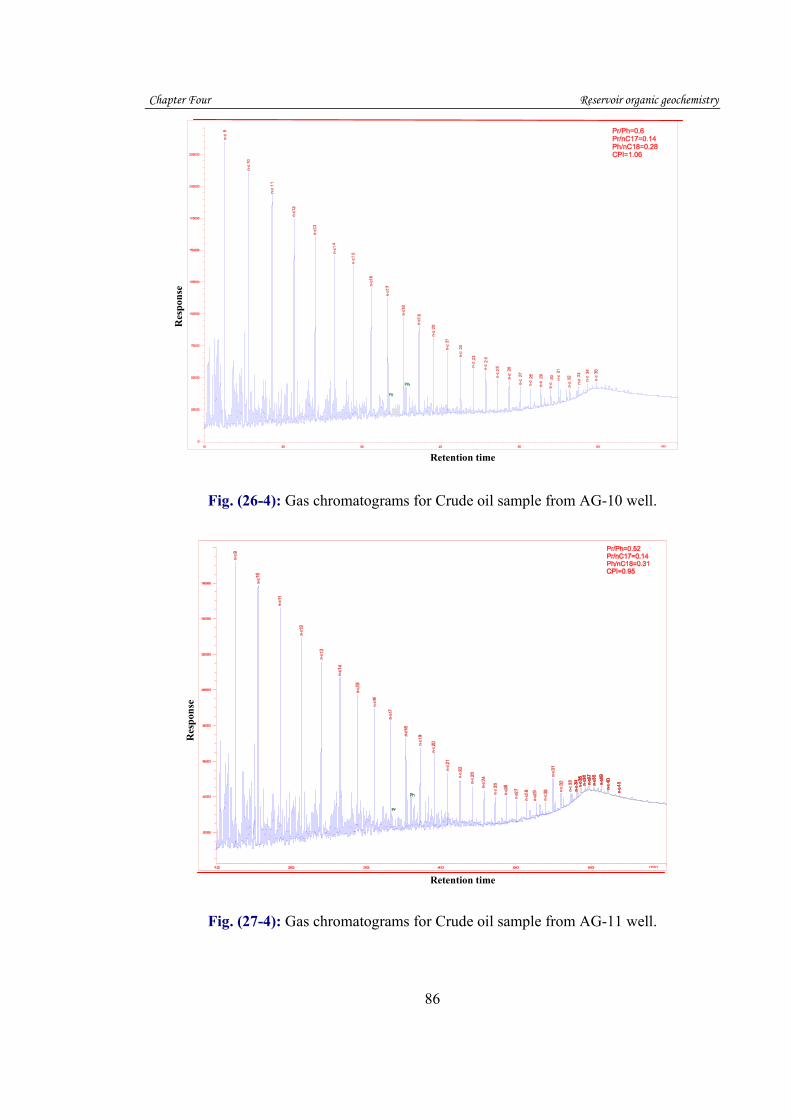
24.4. Gas chromatograms for Crude oil sample from HF-2 well 85 25.4. Gas chromatograms for Crude oil sample from AG-1 well 85 26.4. Gas chromatograms for Crude oil sample from AG-10 well 86 27.4. Gas chromatograms for Crude oil sample from AG-11 well 86 28.4. Gas chromatograms for Crude oil sample from AG-7well 87 29.4. Gas chromatograms for Crude oil sample from FQ-8well 87 30.4. Gas chromatograms for Crude oil sample from FQ-11well 88 31.4. Gas chromatograms for Crude oil sample from FQ-2well 88 32.4. Gas chromatograms for Crude oil sample from NO-2well 89 33.4. Gas chromatograms for Crude oil sample from HF-1 well 89 34.4. Gas chromatograms for Crude oil sample from AM-30well 90 35.4. Gas chromatograms for Crude oil sample from BU-13well 90 36.4. Gas chromatograms for Crude oil sample from BU-20 well 91 37.4. Gas chromatograms for Crude oil sample from BU-11 well 91 38.4. Gas chromatograms for Crude oil sample from BU-17 well 92 39.4. Gas chromatograms for Crude oil sample from FQ-3 well 92 40.4. Gas chromatograms for Crude oil sample from FQ-4 well 93 41.4. Gas chromatograms for Crude oil sample from FQ-5 well 93 42.4. Plot of pristane/nC17 versus phytane/nC18, showing organic
matter type, source rock depositional and thermal maturity of crude oil samples (Shanmugam, 1985; Peters et al., 1999)
94
43.4. Relation between the stable isotope compositions of saturates and aromatics for crude oil samples for the study area. (After Sofer, 1984)
97
44.4. Example M/Z 191 GCMS mass chromatograms for crude oil in wells (HF-2,AG-1) 101
45.4. Example M/Z 191 GCMS mass chromatograms for crude oil in wells (AG-10,AG-11) 102
46.4. Example M/Z 191 GCMS mass chromatograms for crude oil in wells (AG-7,FQ-8) 103
47.4. Example M/Z 191 GCMS mass chromatograms for crude oil in wells (FQ-11,FQ-2) 104
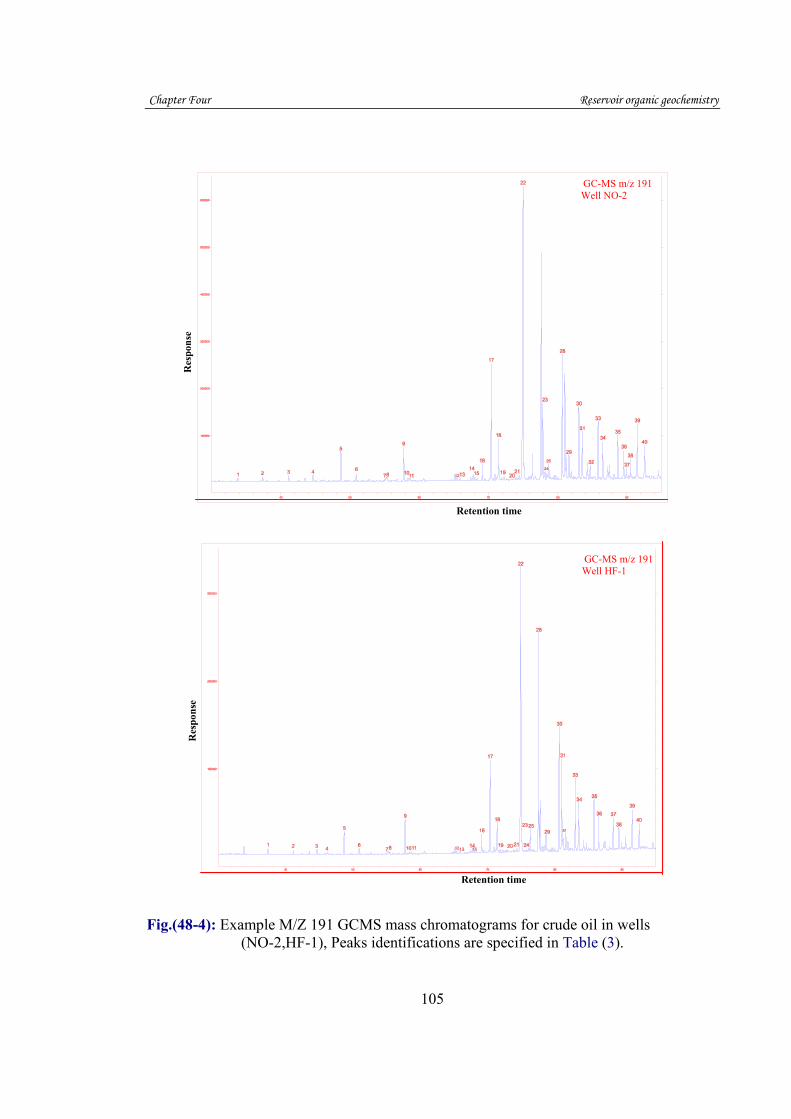
48.4. Example M/Z 191 GCMS mass chromatograms for crude oil in wells (NO-2,HF-1) 105
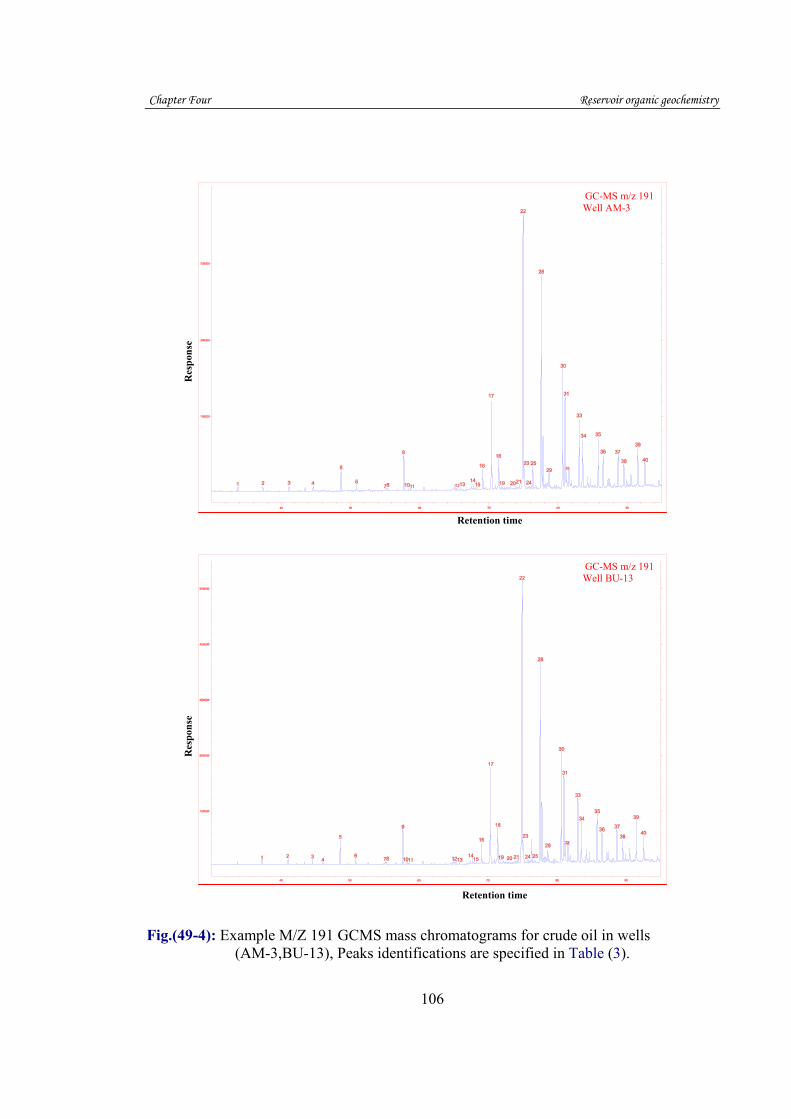
49.4. Example M/Z 191 GCMS mass chromatograms for crude oil in wells (AM-3,BU-13) 106
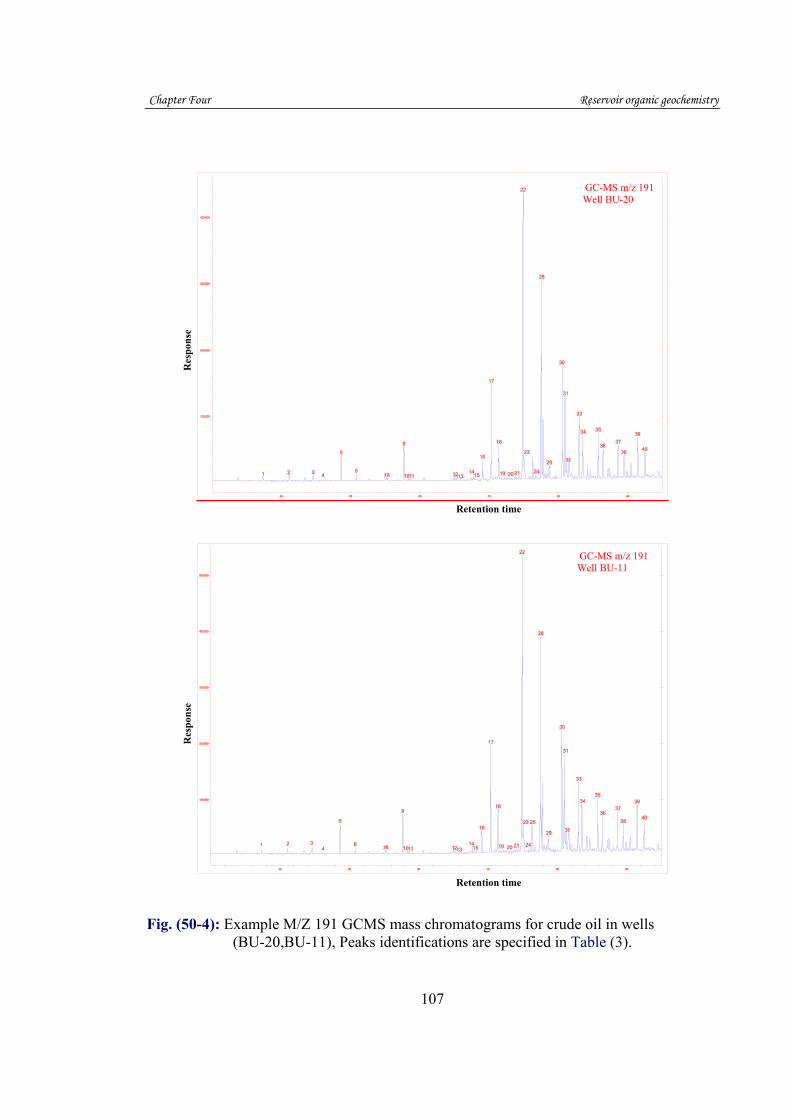
50.4. Example M/Z 191 GCMS mass chromatograms for crude oil in wells (BU-20,BU-11) 107
51.4. Example M/Z 191 GCMS mass chromatograms for crude oil in wells (BU-17,FQ-3) 108
52.4. Example M/Z 191 GCMS mass chromatograms for crude oil in wells (FQ-4,FQ-5) 109
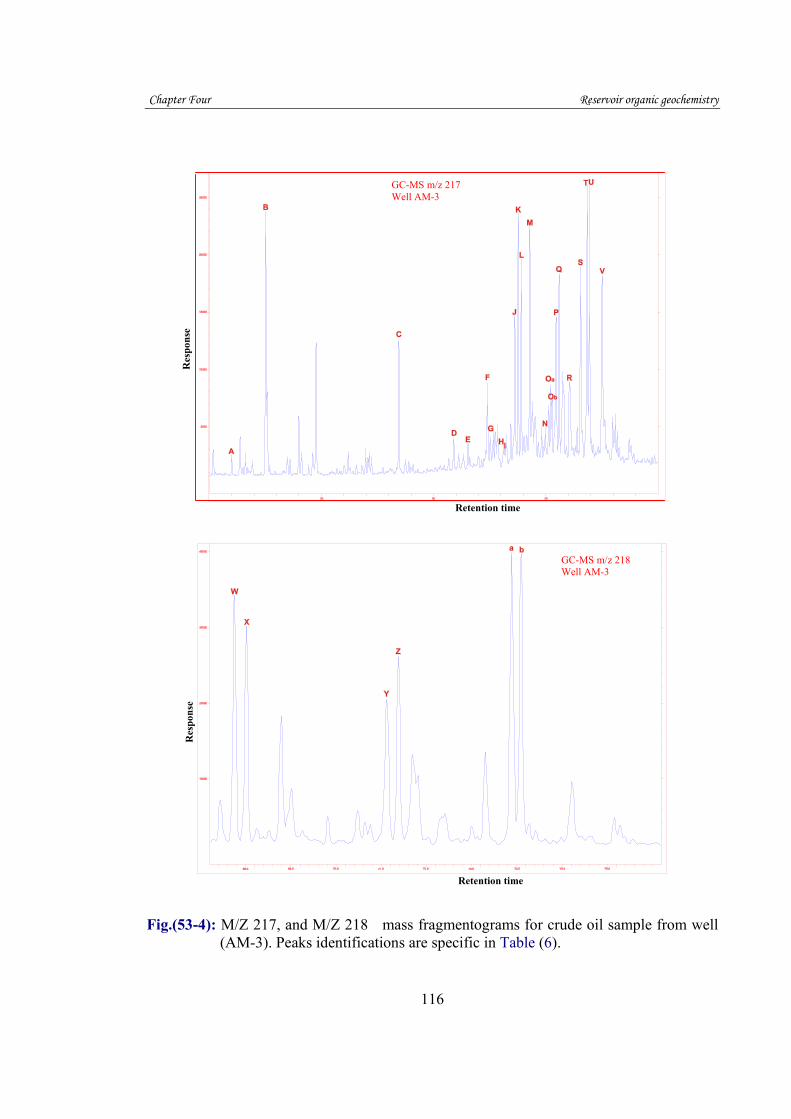
53.4. M/Z 217, and M/Z 218 mass fragmentograms for crude oil sample from well (AM-3) 118
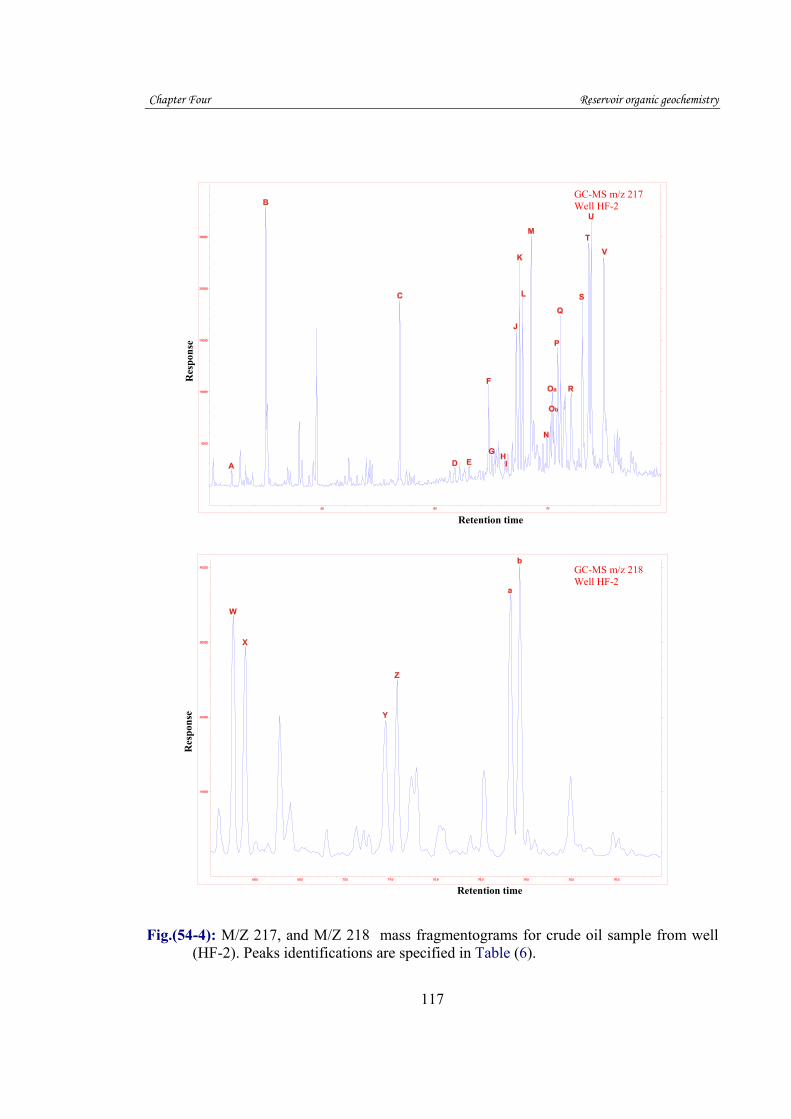
54.4. M/Z 217, and M/Z 218 mass fragmentograms for crude oil sample from well (HF-2) 119
55.4. M/Z 217, and M/Z 218 mass fragmentograms for crude oil sample from well (FQ-5) 120
56.4. M/Z 217, and M/Z 218 mass fragmentograms for crude oil sample from well (BU-11) 121
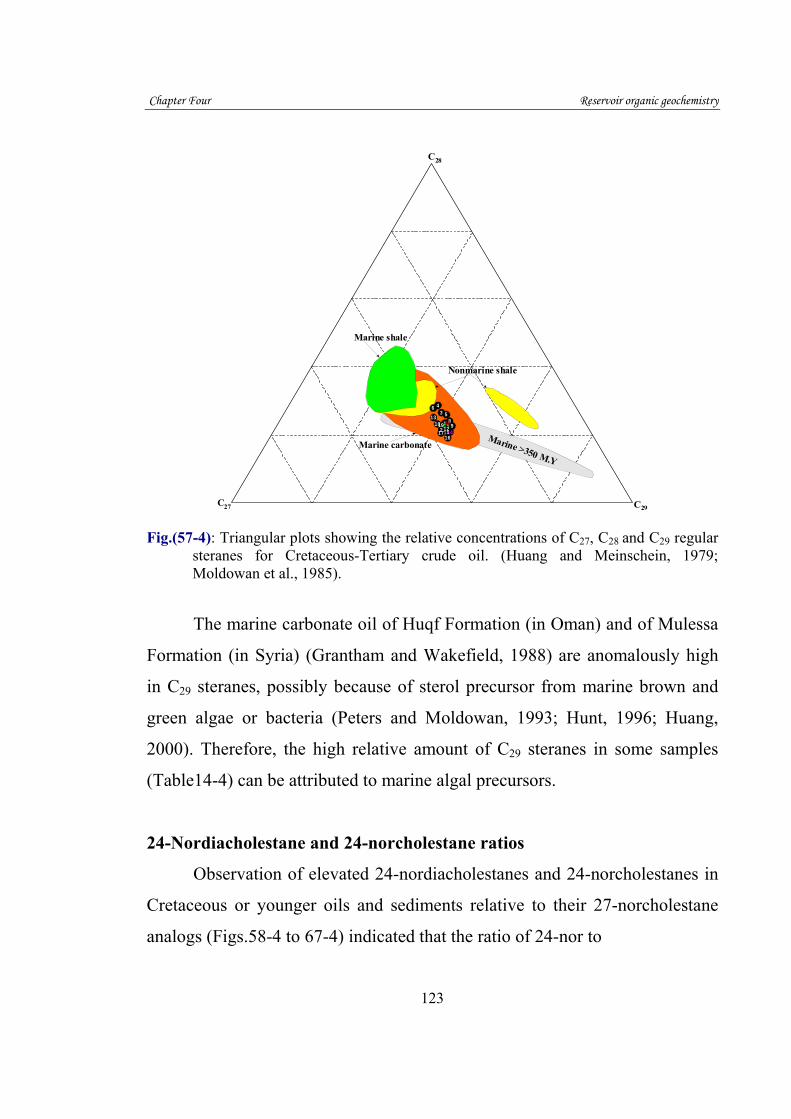
57.4. Triangular plots showing the relative concentrations of C27, C28 and C29 regular steranes for Cretaceous-Tertiary crude oil. (Huang and Meinschein, 1979; Moldowan et al., 1985)
126
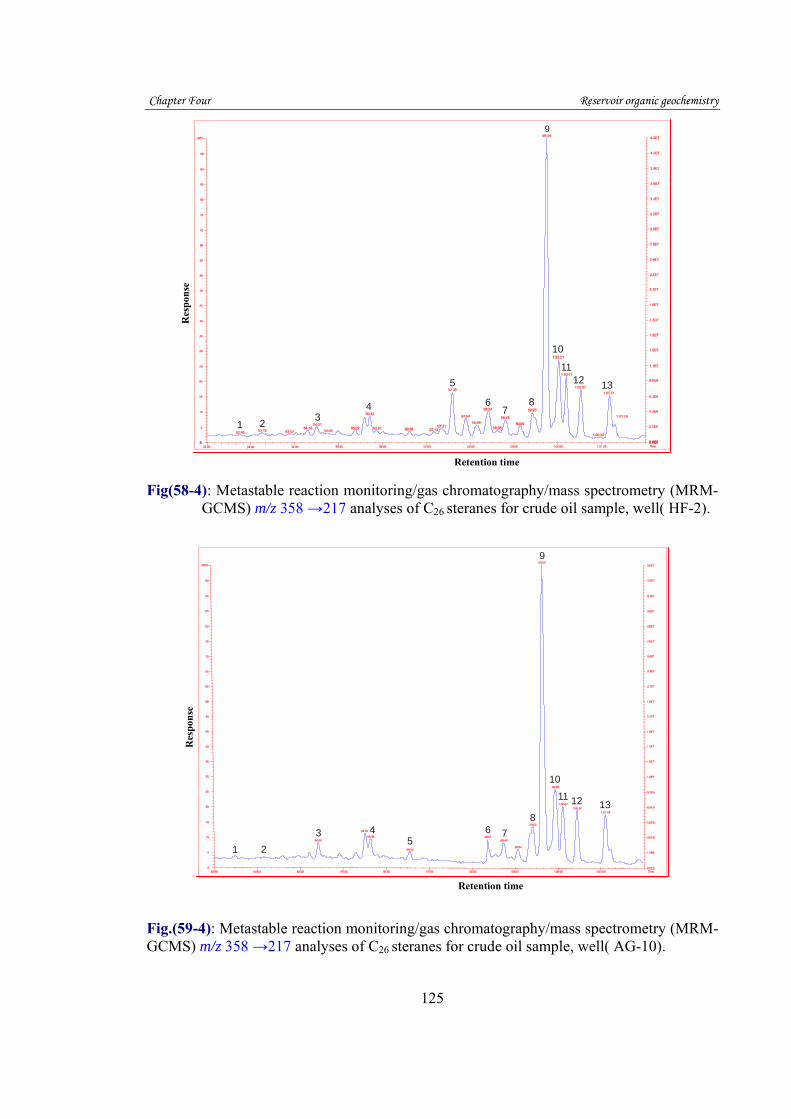
58.4. Metastable reaction monitoring/gas chromatography/mass spectrometry (MRM-GCMS) m/z 358 →217 analyses of C26 steranes for crude oil sample, well( HF-2)
128
59.4. Metastable reaction monitoring/gas chromatography/mass spectrometry (MRM-GCMS) m/z 358 →217 analyses of C26 steranes for crude oil sample, well( AG-10)
128
60.4. Metastable reaction monitoring/gas chromatography/mass spectrometry (MRM-GCMS) m/z 358 →217 analyses of C26 steranes for crude oil sample, well( AG-11)
129
61.4. Metastable reaction monitoring/gas chromatography/mass spectrometry (MRM-GCMS) m/z 358 →217 analyses of C26 steranes for crude oil sample, well( FQ-8)
129
62.4. Metastable reaction monitoring/gas chromatography/mass spectrometry (MRM-GCMS) m/z 358 →217 analyses of C26 steranes for crude oil sample, well( FQ-2)
130
63.4. Metastable reaction monitoring/gas chromatography/mass spectrometry (MRM-GCMS) m/z 358 →217 analyses of C26 steranes for crude oil sample, well( HF-1)
130
64.4. Metastable reaction monitoring/gas chromatography/mass spectrometry (MRM-GCMS) m/z 358 →217 analyses of C26 steranes for crude oil sample, well( BU-13)
131
65.4. Metastable reaction monitoring/gas chromatography/mass spectrometry (MRM-GCMS) m/z 358 →217 analyses of C26 steranes for crude oil sample, well( BU-20)
spectrometry (MRM-GCMS) m/z 358 →217 analyses of C26 steranes for crude oil sample, well( FQ-4)
132
68.4. Example GCMS mass chromatograms for crude oil sample, well (AG-7) showing m/z 253 and m/z 231 134
69.4. Example GCMS mass chromatograms for crude oil sample, well (HF-1) showing m/z 253 and m/z 231 135
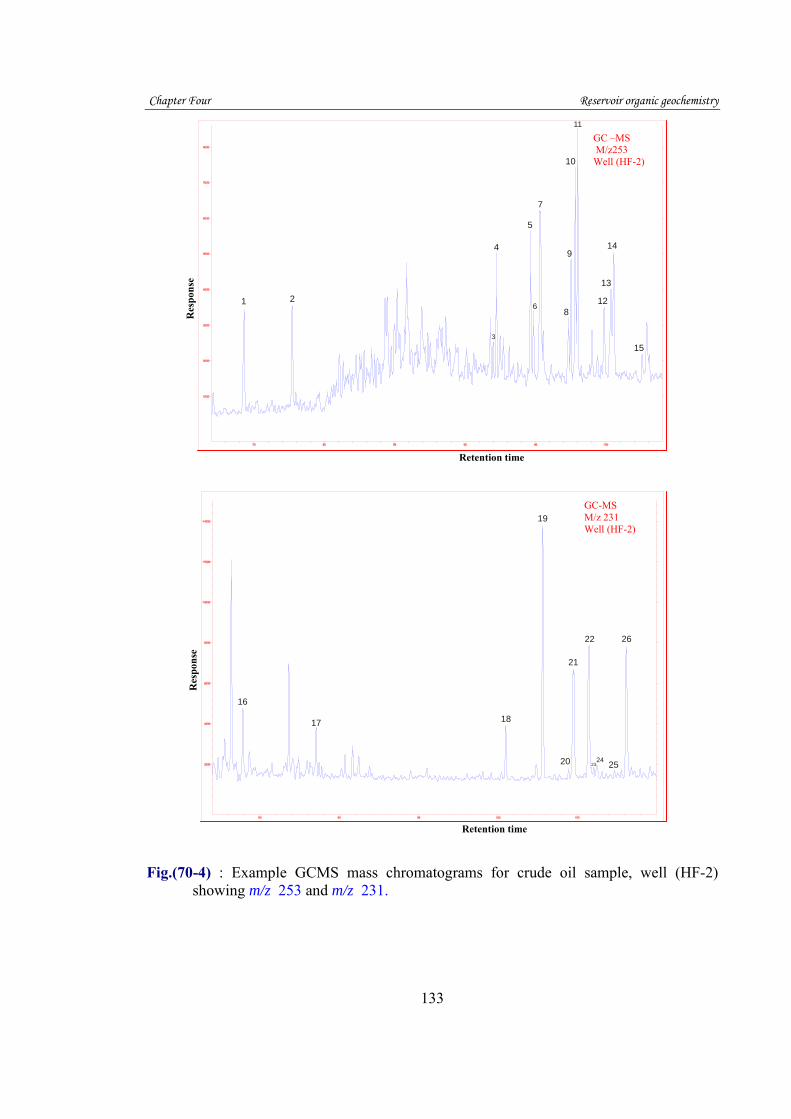
70.4. Example GCMS mass chromatograms for crude oil sample, well (HF-2) showing m/z 253 and m/z 231 136
71.4. Example GCMS mass chromatograms for crude oil sample, well (FQ-5) showing m/z 253 and m/z 231 137
72.4. Ternary diagram showing the relative abundance of C27-, C28-, and C29-monoaromatic (MA) steroids in the aromatic fractions of source rock extracts determined by gas chromatography/mass spectrometery (GCMS) (m/z 253)
140
73.4. Thermal maturity of the analyzed crude oil samples based on sterane isomerizaion. Vitrinite reflectance estimates after correlations in Waples and Machihara (1990); Peters and Moldowan (1993)
147
74.5. Selected MRM for rock extracts and crude oils 155 75.5. Selected MRM for rock extracts and crude oils 156 76.5. Selected gas chromatography for rock extracts and crude
oils 157
77.5. Selected gas chromatography for rock extracts and crude oils 158
78.5. Plot of pristane/nC17 versus phytane/nC18, showing organic matter type, source rock depositional and thermal maturity of crude oil and rock extract samples (Shanmugam, 1985; Peters et al., 1999)
159
List of tables
1-1: Representative rock sample in the study area 4 2-1: Representative crude oils in the study area 4 3a: Geochemical parameters describing the petroleum potential
(quantity) of an immature source rock 7
3b: Geochemical parameters describing kerogen type (quality) and the character of expelled products 7
3c: Geochemical parameters describing level of thermal maturation 7
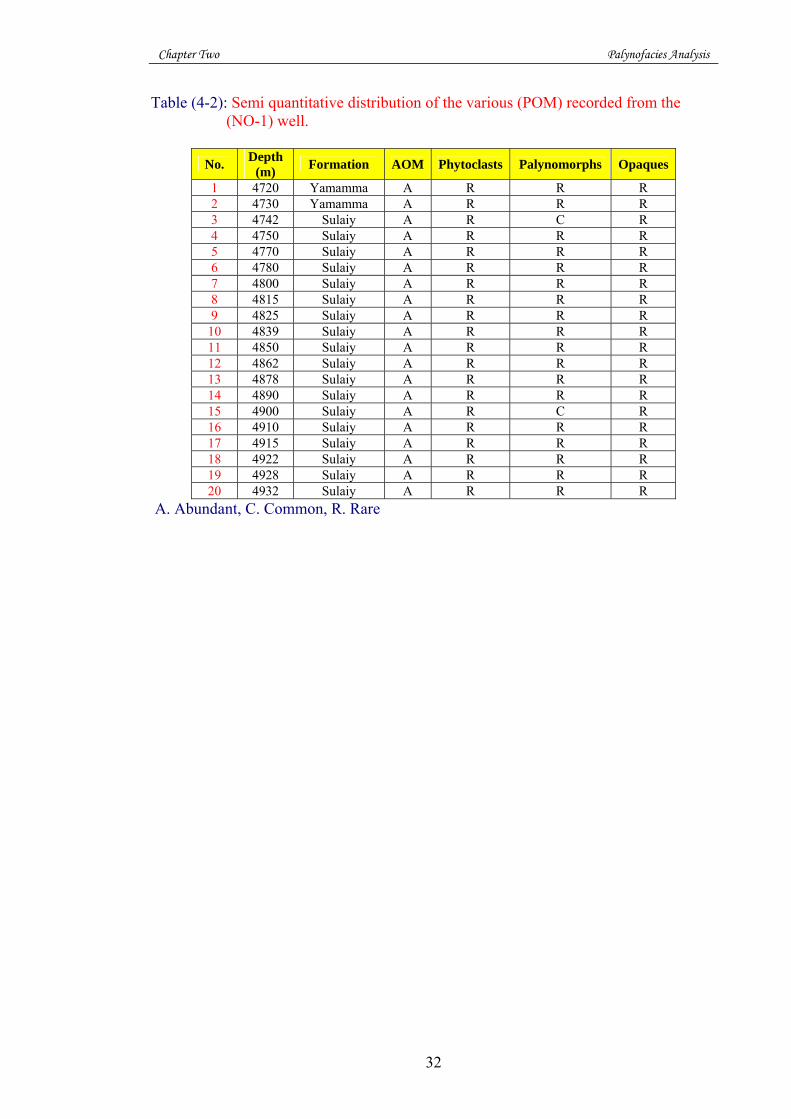
4-2: Semi quantitative distribution of the various (POM) recorded from the (NO-1) well. 32
5-2: Batten’s (1980) scale for palynomorphs colors (reproduced from Traverse, 1988) 38
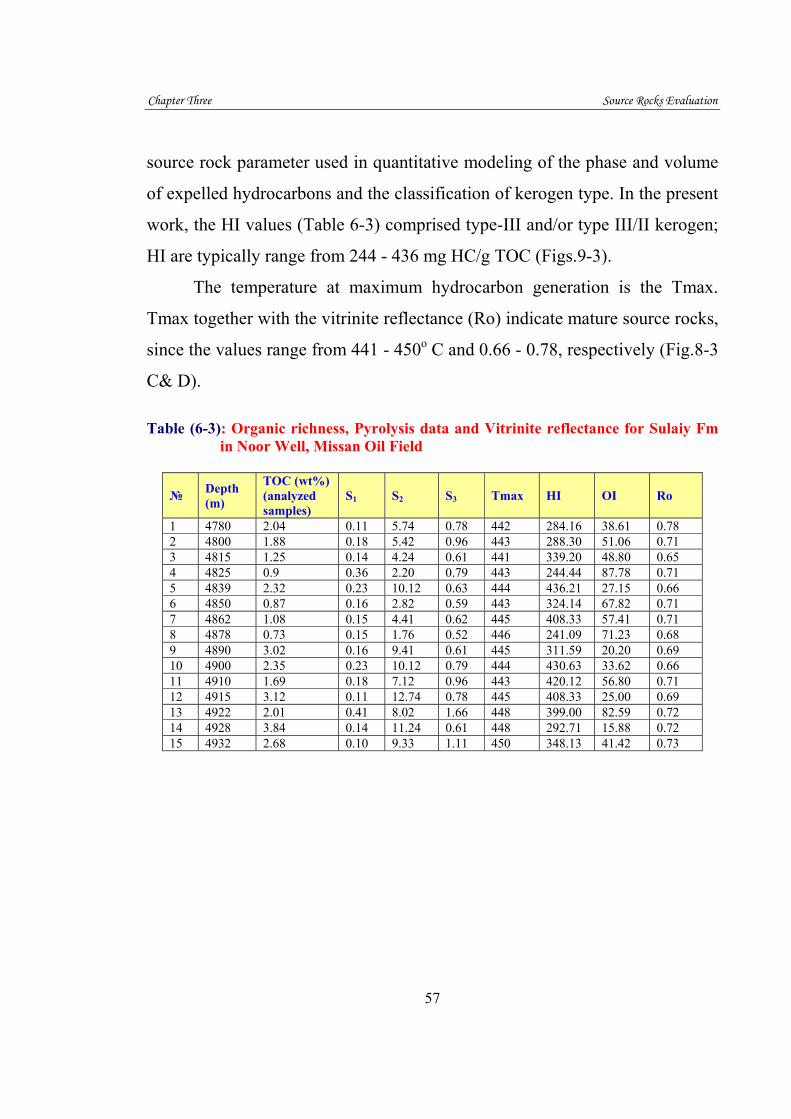
6-3: Organic richness, Pyrolysis data and Vitrinite reflectance for Sulaiy Fm in Noor Well, Missan Oil Field 57
7-3: Extracts gas chromatographic results for six wells in South Iraq 66
8-3: A summary of biomarker characteristics using MRM-GCMS technique for extract source rocks samples for the study area
70
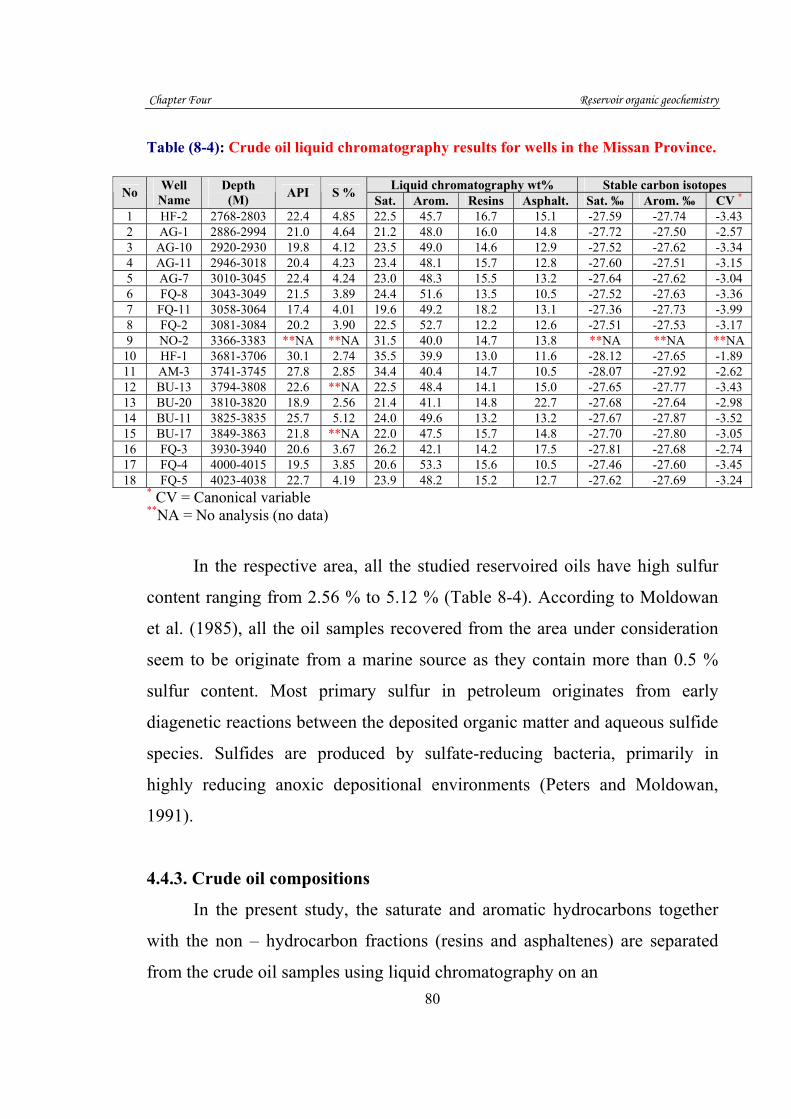
8-4: Crude oil liquid chromatography results for wells in the Missan Province 80
9-4: Crude oil gas chromatography results for wells in the study area 94
10-4: Gas chromatography – mass spectrometry, triterpane report (m/z 191) 110
11-4: GC/MS Parameter 111 12-4: A summary of biomarker characteristics (terpanes) for
crude oil samples in the study area 112
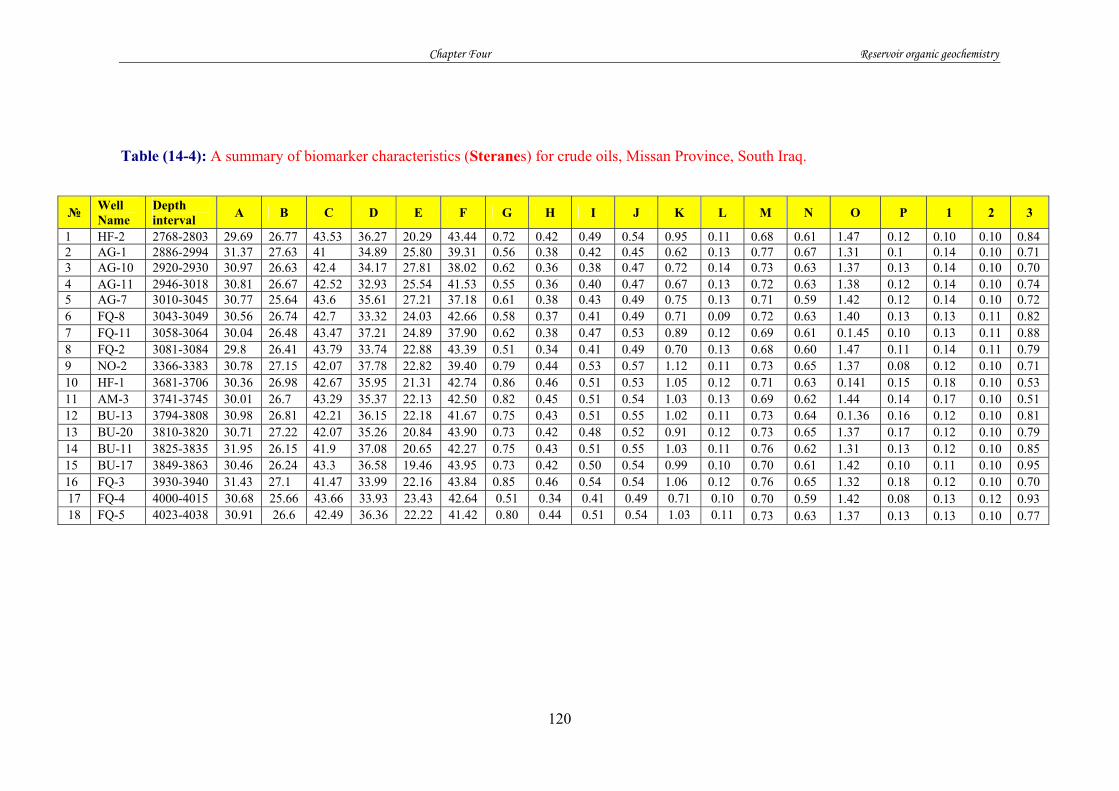
13-4: Sterane (m/z217) peak identification report 122 14-4: A summary of biomarker characteristics (Steranes) for
crude oils, Missan Province, South Iraq 123
15-4: A summary of biomarker characteristics using MRM-GCMS technique for crude oil samples for the study area 127
16-4: Monoaromatic steroid and triaromatic steroid biomarkers (m/z 253 and m/z 231) peak identification report 138
17-4: A summary of biomarker characteristics (Monoaromatic and Triaromatic) for crude oil samples from Missan oil fields, South Iraq
139
18-4: A summary of maturity related none/biomarker for crude oil samples for Missan oil fields 143
ABSTRACT
Twenty five (25) rock samples collected from six (6) wells, (4) of them in Missan Province [ Noor (NO-1), Amara (AM-3), Abu Gharab(AG-2),Halfaya (HF-2)] for Sulaiy Formation and the other two (2) wells from Basra Province well [ North Rumalia (R-167)] for Sulaiy Formation and well [ North Rumalia (R-172) ] for Sargelu Formation, also eighteen (18) crude oils have been collected from Cretaceous – Tertiary reservoir in Missan oil fields. Sedimentary organic matters for the Sulaiy Formation are performed in well (NO-1) for twenty rock samples optical studies for these samples have conformed the kerogen type II that generate liquid hydrocarbons, with abundance of (AOM) and offshore marine environment for Sulaiy Formation. For source rock evaluation, Pyrolysis analysis, Percentages of (TOC %), (RO %), indicate their hydrocarbon generation from Kerogen type II of marine environment. Confirmations for marine environment are performed by the ratios of Pristine to Phytane (Pr/Ph) and carbon preference index (CPI). Crude oils characterizations are prepared on eighteen (18) samples of Cretaceous- Tertiary reservoirs in Missan Province. Gas Chromatography (GC) results indicate (Pr/Ph) ratio is less than one (1), and (CPI) is also one (1) , which indicate carbonate marine environment. Source maturation could be indicating by ratios of (Ts/Tm) of low to moderate maturation. Metastable Reaction (MRM) analyses have indicated oil source age of Jurassic period. Oil – oil correlation for all Cretaceous- Tertiary reservoirs indicate one source rock that could correlate to one source rock of the Jurassic Sargelu Formation.
المستخلص
نمـوذجـا صخريـا من سـتة آبـار مختلفة، اربعة آبار منهـا في محافظة ) 25(تم جمع . [No-1, Am-3, Ag-2, Hf-2]ميسان، بئر نور وبئر عماره وبئر ابو غراب وبئر حلفايه
-R(من تكوين السلي واثنان منها استخدمت للمقارنة في محافظة البصرة، بئر رميلة الشـمالي .لتكوين الساركلو )R-172(تكوين السلي، وبئر رميلة الشمالي ل ) 167
الثلاثي في محافظة ميسان –نموذجا من النفط الخام من مكامن الكريتاسي) 18(كذلك تم جمع [No-2, Am3, Hf-1, Hf-2, Fq-2, Fq-3, Fq-5, Fq-8, Fq-11, Bz-11, Bz-13, Bz-
17, Bz-20, Ag-1, Ag-7, Ag-10, Ag-11] نموذجا صخريا لدراسة المواد العضوية الرسوبية لتكوين السلي في بئر ) 20(خدم وقد است
)NO-1( حيث دلت النتائج المجهرية على سيادة المواد العضوية عديمة الشكل التركيبي ،)AON(ذات القابلية على انتاج النفوط السائلة ،
قييم الصخور المصدرية لت) NO-1(نموذجا صخريا من تكوين السلى من بئر ) 15(تم اختيار ونسب كمية الكاربون ) Pyrolysis(المولدة للنفط، حيث اشارت نتائج التكسر الحراري
، )CPI(و) Pr/Ph(وكذلك نسب ) %RO(ونسب انعكاسية الفيترينايت ) %TOC(العضوي على نشوء النفوط السائلة مكونة الكيروجين من النوع الثاني الذي يعود الى البيئة البحرية
.الكاربونيةبئرا نفطيا ) 18(عينة من النفط الخام من ) 18(تم اجراء تحليلات مواصفات النفط الخام على
الدلائل الحياتية وذلك باستخدام تحليلات) الثلاثي–الكريتاسي (في محافظة ميسان ذات الاعمار )Biomarker( حيث اشارت تحليلات الغاز الكروماتغرافي ،)GC ( لنسب)Pr/Ph ( الى اقل
مما يؤكد البيئة الكاربوناتية البحرية للصخور المصدرية، وقد اشارت تحليلات ) 1(من الواحد )GC/MS ( الى نفس البيئة الكاربوناتية البحرية، كما أكدت نسبة)Ts/Tm (ئ الى نضوج واط
.معتدلفقد اشارت الى ان عائدية عمر الصخور المصدرية يعود للعصر ) MRM(اما تحليلات
.الجوراسي نفط لنماذج مكامن الكريتاسي والثلاثي اشارت الى عائديتها الى صخور –ان مضاهاة نفط
.مصدرية واحدة من تكوين الساركلو ذي العمر الجوراسي
العاليم وزارة التعلي
والبحث العلمي جامعة بغداد العراق ـبغداد
مواصفات النفوط الخام وعائدياتها المصدرية في حقول نفط ميسان، جنوب شرق العراق
إلىرسالة مقدمة جامعة بغدادـكلية العلوم
في علم الأرضدكتوراه فلسفة وهي جزء من متطلبات نيل درجة )جيولوجيا النفط(
فرات عطاء صالح الموسوي
١٩٩٧ جامعة بغداد –ماجستير
آذار 2010
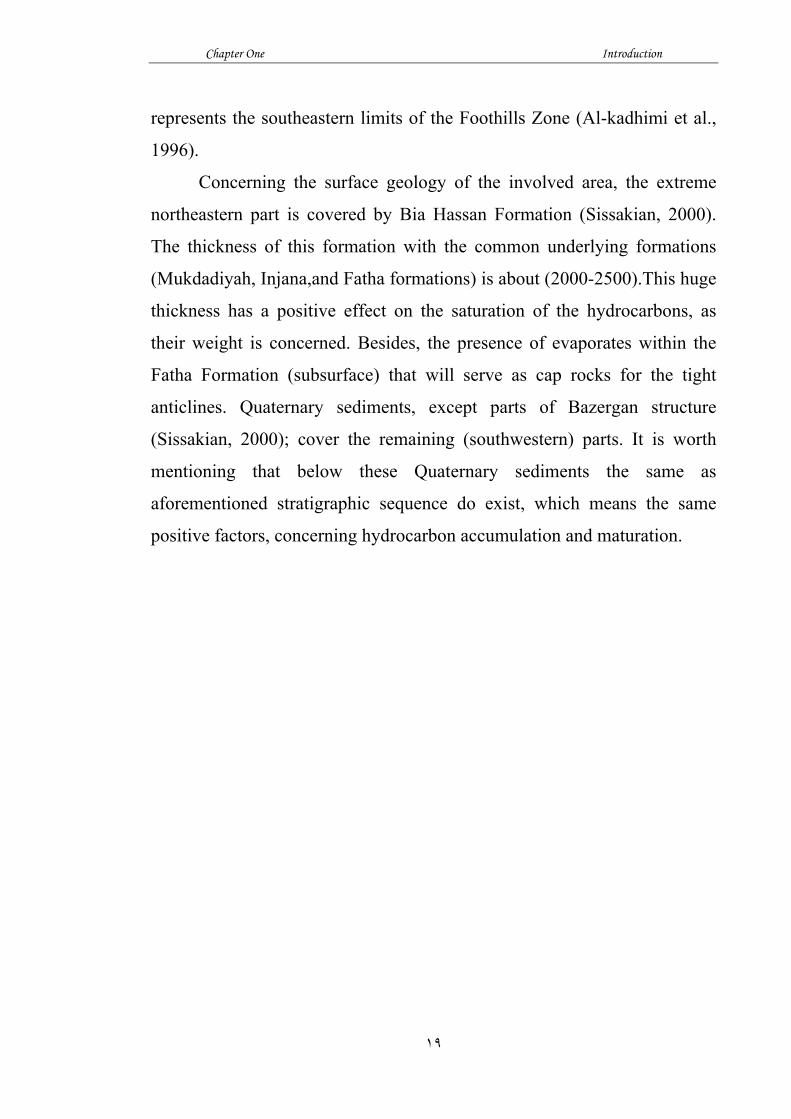
Chapter One Introduction
١
1.1. Introduction
The importance of this study is coming from no documented
biomarker indicated of the crude oils from south east of Iraq, their source
rocks, depositional environment, and hydrocarbon potentiality, age and
maturity. This study is an effort intended to answer some of these
questions. Moreover, knowing source rock as a part of the petroleum
system may enhance the process of oil exploration in the promising part of
southern Iraq.
1.2. Previous Studies
Studies have been publish on stratigraphy, paleontology and sediment
logy of the study area; however, there is no information on their burial and
temperature histories, biomarker study on the crude oils, so the following is
some out standing studies concerning this project.
1. (Buday, 1980) studies the stratigraphy and palegeography of south Iraq.
2. (Beydoun, 1992) studying briefly the regional geology and petroleum
resources of south Iraq.
3. (Al-sharhan, 1997) studies the sedimentary basin and petroleum geology
of Iraq as one of the important petroleum country in the Middle East.
4. (Sadooni, 1997) studies the petroleum prospects of upper Jurassic in
South Iraq, Sulaiy Formation.
5. (Al-Ameri,Al-Musawi,and Batten.1999) they use palynofacies as an
indications to depositional environment ,source potential for
hydrocarbon and age determination of Sulaiy formation ,southern Iraq.
6. (Al-Shahwan, 2002) studies the thermal maturity, and Basin analysis of
Lower Cretaceous- Upper Jurassic, Southern Iraq.
7. (Pitman, 2004) study the petroleum generation and migration in the
Mesopotamian basin and zagros fold belt of Iraq.
Chapter One Introduction
٢
1.3. Aim of Study
The main objectives of this study are the following:
1. An assessment and characterization of the extent, nature, and source rock
quality in the southeastern of Iraq basin.
2. An identification of the Palynofacies and outlining the depositional
environmental conditions.
3. A determination of crude oil characterization.
4. An apply of the oil – oil and oil – source rock correlation using certain
biomarkers to figure out the origin of these oils.
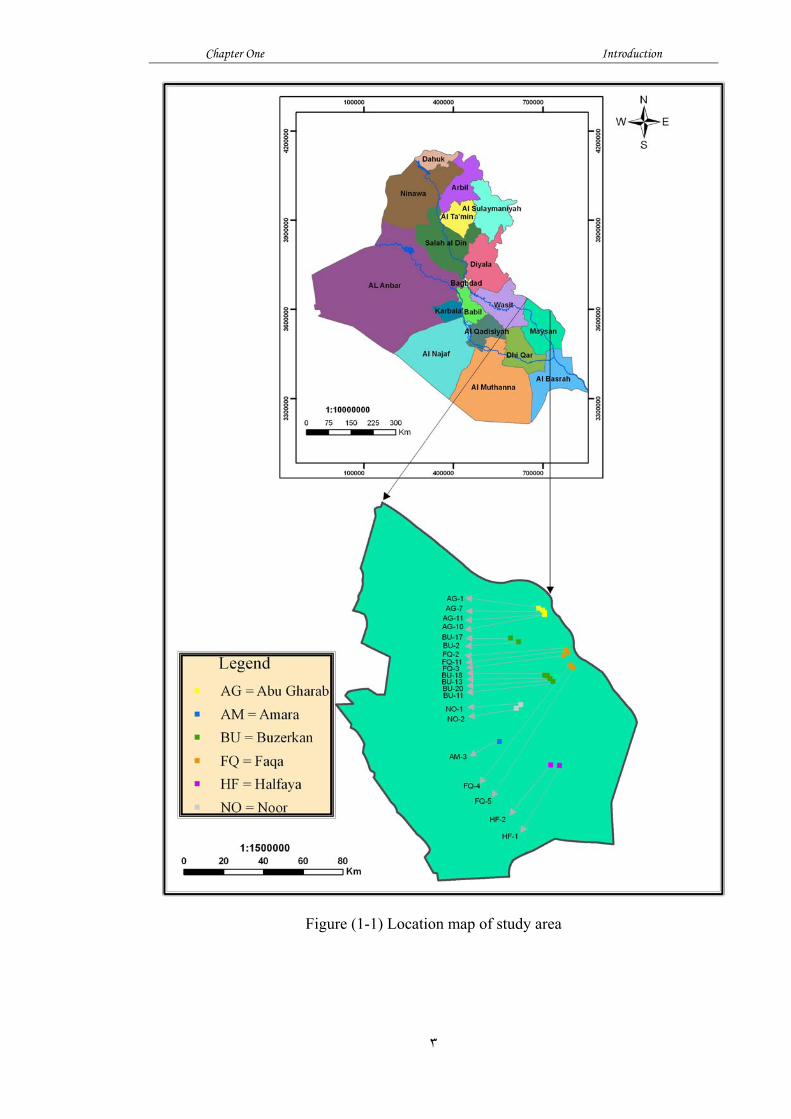
1.4. Location of Study Area
The selected study area is located in south east of Iraq as depicted in
figure (1-1)
Chapter One Introduction
٣
Figure (1-1) Location map of study area
Chapter One Introduction
٤
1.5. MATERIALS AND METHODOLOGY
The underlying principle for the research is derived from the realization
that there is a heterogeneous distribution of the productive wells,
hydrocarbon phases (that include crude oils with different API and sulfur
contents, depths and rates of production) in the Missan Province,
Southeastern of Iraq.
The fundamental materials used in this work include composite logs
for “representative cutting &core samples (Table 1-1), eighteen (18) crude
oil samples recovered from the main producing fields dispersed in the
studied area (Table 2-1). The Missan Oil Company and South Oil
Company (Iraq) kindly provided the required materials of this study. The
detailed methodologies of the present work were described in the following
paragraphs: Table 1-1: Representative rock sample in the study area
Rock Sample No. Field Well Core Cutting
1 North Rumaila R – 172 - 1 2 North Rumaila R – 167 1 - 3 Amara AM-3 - 1 4 Abu Gharab AG – 2 1 - 5 Halfaya HF– 2 1 - 6 Noor NO – 1 - 20
TOTAL 25 Table 2-1: Representative crude oils in the study area
Table 3b: Geochemical parameters describing kerogen type (quality) and the character
of expelled products Kerogen type HI
(mg HC / g TOC) S2 / S3 Atomic H/C Main expelled at peak maturity
I II
II/III III IV
> 600 300 – 600 200 – 300 50 – 200 < 50
> 15 10 – 15 5 – 10 1 – 5 < 1
> 1.5 1.2 – 1.5 1.0 – 1.2 0.7 – 1.0 < 0.7
Oil Oil Mixed oil + gas Gas None
Table 3c: Geochemical parameters describing level of thermal maturation
Maturation Generation Stage of thermal maturation
Ro (%)
Tmax (oC)
TAI a
Bitumen / TOC b
Bitumen (mg/g rock)
PI c [S1/(S1+S2)]
Immature Mature Early Peak Late Postmature
0.2 – 0.6
0.60 – 0.65 0.65 – 0.90 0.90 – 1.35
> 1.35
< 435
435 – 445 445 – 450 450 – 470
> 470
1.5 – 2.6
2.6 – 2.7 2.7 – 2.9 2.9 – 3.3
> 3.3
< 0.05
0.05 – 0.10 0.15 – 0.25
___
___
< 50
50 – 100 100 – 250
___
___
< 0.10
0.10 – 0.15 0.25 – 40
___
___
a TAI thermal alteration index. b Mature oil-prone source rocks with type I or II kerogen commonly show bitumen/TOC ratios in the range 0.05 – 0.25. Caution should be applied when interpreting extract yields from coals. c PI Production index.
1.5.2.2. Vitrinite reflectance (Ro %)
Vitrinite Reflectance (VR) is the most commonly used organic
maturation indicator used in the petroleum industry. Vitrinite, because it is
not strongly prone to oil and gas formation, is common as a residue in
source rocks. As coal rank increases and the chemical composition of the
Vitrinite correspondingly changes, the Vitrinite macerals (elementary
microscopic constituents of coal) can recognized by their shape,
morphology, reflectance and fluorescence. The term, which is broadly
Chapter One Introduction
٨
equivalent to minerals in rocks, becomes increasingly reflective. Therefore,
the percentage reflection of a beam of normal incident white light from the
surface of polished Vitrinite is a function of the rank (maturity) of the
macerals. The reflectivity (R) may be recorded as either Rv max% or Ro%.
Both are measurements of the percentage of light reflected from the
sample, calibrated against a material which shows ~100% reflectance (i.e. a
mirror). Because Vitrinite is 'anisotropic', reflectance will be greatest on the
bedding parallel surfaces and least on surfaces cut orthogonal to the
bedding. Surfaces cut at angles between these two extremes will have
intermediate reflectance. Consequently, under (cross) polarized light, the
reflectance of the Vitrinite macerals observed will depend upon its position
relative to the plane of polarization of the light. In cross polar, the Vitrinite
will, in a 360° rotation of the stage, have two reflectance maxima and two
reflection minima. It is the average % reflection of the two-reflectance
maxima which provides analysts with the value Rv max%. This
methodology is that of choice in Australia. In the USA and Europe, Ro% is
measured. This is simply the reflection off macerals from a normal incident
beam of non-polarized light.
Samples are separated and washed, and then mounted in resin. These
resin blocks are then ground and polished to a high standard. Poor
polishing will lead to spurious reflection measurements. Sample
preparation takes 24 hours. The blocks will obviously contain particles of
vitrinite plus other macerals (i.e. liptinites and inertinites) which will need
to be recognized and discarded {NB reflectance of these macerals may be
recorded as RL% or RI %}.The number of individual reflection
measurements is dependent on the abundance of vitrinite in the sample, but
should be on the order of 30-100 vitrinite measurements. A skilled analyst
can make these measurements in, say, 30 minutes.
The data of vitrinite reflectance (Ro%) were provided by the Baseline
DGSI analytical laboratories, Houston-US.
Chapter One Introduction
٩
1.5.2.3. Bitumen extraction
Minor amounts of substances soluble in organic solvents are associated
with kerogen; these substances are collectively called "bitumen" by some
geochemists. The followed method of bitumen extraction and analysis as
described in Peters and Moldowan (1993) was completed in the Molecular
1 4720 Yamamma A R R R 2 4730 Yamamma A R R R 3 4742 Sulaiy A R C R 4 4750 Sulaiy A R R R 5 4770 Sulaiy A R R R 6 4780 Sulaiy A R R R 7 4800 Sulaiy A R R R 8 4815 Sulaiy A R R R 9 4825 Sulaiy A R R R
10 4839 Sulaiy A R R R 11 4850 Sulaiy A R R R 12 4862 Sulaiy A R R R 13 4878 Sulaiy A R R R 14 4890 Sulaiy A R R R 15 4900 Sulaiy A R C R 16 4910 Sulaiy A R R R 17 4915 Sulaiy A R R R 18 4922 Sulaiy A R R R 19 4928 Sulaiy A R R R 20 4932 Sulaiy A R R R
A. Abundant, C. Common, R. Rare
Chapter Two Palynofacies Analysis
33
KEROGEN COMPOSITION %DEPTH (m)
FMLITHOLOGY20 40 60 80
4700
4720
4740
4760
4780
4800
4820
4840
4860
4880
4900
4920
4940
Yam
amm
aSu
laiy
LIMESTOME AOM
PALYNOMORPHSSHALE
PHYTOCLASTS
OPAQUSE
Fig. (4-2): Percentage distribution of particulate organic matter groups within the defined Palynofacies of the (NO-1) well.
OPAQUES
Chapter Two Palynofacies Analysis
34
2.2. PALEOENVIRONMENTAL INTERPRETATION
The use of palynology in geological studies has hitherto been
focused on determining the age of rocks (palynostratigraphy) and on giving
vegetational and climatic interpretations based on comparison of fossil
palynofloras with those of extant vegetation (paleoecology and
paleoclimatology). During the past two decades there has been increasing
attention paid to analyzing the total kerogen (acid-resistant organic matter)
component of sediments. The subdiscipline of palynofacies analysis has
enabled palynologists to provide detailed environmental interpretations that
have proven useful in coal and petroleum geology. Specifically, the pollen,
spores, dinoflagellates and other particulate organic matter, which can be
recognized and identified from a sequence of rocks, can be use effectively
to define precisely the different palaeoenvironmental parameters that
prevailed during the deposition of the rocks. These parameters include,
temperature, sea level changes, water depth, salinity and terrigenous influx.
In general, changes in palynofacies types and composition of
palynomorphs assemblage may provide information regarding the
interpretation of these parameters.
In the present study, the paleoenvironmental reconstruction is based
on the defined particulate organic matter groups and the composition of
palynofacies assemblages of the studied intervals within ( NO-1) well. The
paleoenvironmental deductions were derived mainly from the ternary
diagrams (cf. Tyson, 1993, 1995).
The AOM-Phytoclast-Palynomorph (“APP”) ternary plot (Fig.5-2) is use to
summarize the optical character of the kerogen assemblages for (NO-1)
well. It is clear shows that most of the samples plot in AOM dominated
field (IX-field) that are usually associated with distal suboxic-anoxic facies
(Tyson, 1995).
Chapter Two Palynofacies Analysis
35
Fig. (5-2): AOM-Phytoclast-Palynomorph ternary plot of NO-1 well (Tyson, 1995).
2.3. ORGANIC THERMAL MATURATION
Maturation is the process by which plant and algal material deposited
in sediment is thermally decomposed to yield oil, natural gas and other
products (chiefly CO2 and water). It is govern by both time and
temperature, in which the same degree of maturation can attained at a low
temperature for a long period as at a high temperature for a short period of
time (Oehler, 1983). As the organic matter matures, it breaks down to
generate oil and gas, the rate of oil and gas generation is slow at first, then
increases rapidly, then diminishes again (Fig.6-2). Initially, oil is the main
product, but at higher maturities oil generation declines and gas generation
increases (Oehler, 1983). The maturity range over which most of the oil is
generate is called the “oil window” and the rocks generating that oil are
said to be “mature”. Rocks that have not yet reached that stage are call
“immature” and rocks that have passed through that stage into the gas-
generating phase are call “overmature” (Oehler, 1983).
Sporopollenin is a very tough material, it is not indestructible and
post-depositional heating can cause chemical changes. These are of the
Chapter Two Palynofacies Analysis
36
same sort that can affect organic matter generally (e.g., in coal beds where
the coal series proceeds from peat to anthracite by grades, with loss of H
and O and concomitant enrichment of C and molecular condensation). The
same occurs with dispersed sporopollenin, through apparently not as fast as
it does with other organic substances (Traverse, 1988).
The main observed change in spore/pollen exines along the
carbonization-coalification process is the change of color in transmitted
light. Fresh exines are pale yellowish to almost colorless. If these exines
are heated, (e.g., by deep burial or proximity of the enclosing sediments to
a lava flow) their color intensifies from yellow to orange to brown, dark
brown and finally black (Traverse, 1988).
In the present work, simple thin-walled psilate palynomorphs were
chosen to investigate their exines color using Pearson’s (1984) color chart
(Fig.7-2) and Batten’s (1980) scale of palynomorph colors (Table 5-2) to
estimate approximately the numerical thermal alteration index (TAI),
Vitrinite reflectance (Ro %) and organic thermal maturity of the studied
intervals in the ( NO-1) well.
Chapter Two Palynofacies Analysis
37
Depth (m) Relative amount of petroelum formed
Temperature ( C)o
1000
2000
3000
4000
5000
50
100
150
200
Biogenic gas
OilThermal gas
Oil peak
Gas peak
Immature
Mature
Overm
ature
Fig. (6-2): Oil and gas generation as a function of increasing sediment burial
(Modified after Oehler, 1983).
Organicthermalmaturity
Spore / pollencolour
Correlation toother scales
TAI = 1 - 5 VitriniteReflectance
IMMATURE
MATUREMAIN PHASE OF LIQUID PETROLEUMGENERATION
DRY GAS ORBARREN
1
1+
2-
2
2+
3-
3
3+
4-
4
(5)
0.5 %
1.3 %
0.2 %
0.3 %
0.9 %
2.0 %
2.5 %
BLACK & DEFORMED Fig. (7-2): Pearson’s (1984) color chart compared with other organic thermal maturity,
TAI and Vitrinite reflectance (Modified from Traverse, 1988).
Chapter Two Palynofacies Analysis
38
Table (5-2): Batten’s (1980) scale for palynomorphs colors (reproduced from Traverse,
1988). Observed color of Palynomorphs Significance
1. colorless, pale yellow, yellowish orange Chemical change negligible; organic matter immature, having no source potential for hydrocarbon.
2. Yellow Some chemical change, but organic matter still immature.
3. Light brownish yellow, yellowish orange Some chemical change, marginally mature but not likely to have potential as a commercial source.
4. Light medium brown Mature, active volatilization, oil generation.
5. Dark brown Mature, production of wet gas and condensate, transition to dry gas phase.
6. Very dark brown-black Over mature; source potential for dry gas. 7. Black (opaque) Traces of dry gas only.
2.3.1 NO-1 well
The studied succession (4720 - 4932 m) in the (NO-1) well generally
shows marked increase in the color intensity with increasing depth. It is
characterized by generally mature palynomorphs with. Light brownish
yellow, yellowish orange to light medium brown Color. This corresponds
to 2+ to -3 TAI and 0.57 - 0.70 % Vitrinite reflectance.
The calculated maturity generally increases with depth and appears
to follow a maturity profile, which projects at ≈ 0.68 % Ro at 4900 m.
Chapter Three Source Rocks Evaluation
47
3. Source Rocks Evaluation
Although petroleum systems are generally composed of at least source,
a reservoir, and a trap (Dow, 1974; Magoon, 1988), the presence of a viable
source rock is perhaps the most important factor governing the nature
accumulation of hydrocarbons. As stated by Demaison and Huizinga (1991),
"if there is no petroleum generation in the subsurface, then all of the other
necessary requirements of a petroleum system (e.g., structure, reservoir, seal)
lose relevance".
It is generally, organic rich fine-grained sediment that is naturally
capable of generating and releasing hydrocarbons in amounts to form
commercial accumulations (Hunt, 1996). Waples (1985) distinguished the
petroleum source rocks into potential, possible and effective as follows:
a. Potential source rocks: are immature sedimentary rocks known to be
capable of generating and expelling hydrocarbons if their level of maturity
were higher.
b. Possible source rocks: are sedimentary rocks whose source potential has not
yet been evaluated, but which may have generated and expelled
hydrocarbons.
c. Effective source rocks: are sedimentary rocks that have already generated
and expelled hydrocarbons.
However, the present geochemical study aims to define the potential
source rocks of the subsurface Creteaous in the area of Missan Oil Field and
the definition of the main zones of oil generation. This done through a detailed
geochemical study on representative of (15) cutting samples from (Noor-1)
well, these samples and some other basic data are kindly offered from Missan
and South Oil Companies.
Chapter Three Source Rocks Evaluation
48
3.1. Principles of evaluation
The identification and categorization of rocks, active or potential
petroleum source beds, are as important in an exploration well as
identification of potential reservoirs (Waples, 1985).
The hydrocarbon source evaluation is generally based on the organic
quantity (organic richness), quality (kerogen type), generation capability and
the thermal maturation of the organic matter disseminated in the rock (Hunt,
1979; Tissot and Welte, 1984; Waples, 1985). The hand available
programmed analyses applied in the present study, the organic richness based
on total organic carbon determination using Leco Carbon Analyzer, the
organic quality and generation capability were determined utilizing Rock-Eval
II and IV Pyroanalyzer. Furthermore, the methods used for determining the
stages of maturation are the common Vitrinite reflectance measurements (Ro)
and the maximum temperature of Pyrolytic hydrocarbons (Tmax).
3.1.1. Organic richness
Total organic carbon (TOC), also called organic carbon (Corg), measures
the quantity but not the quality of organic carbon in the rock or sediment
samples. Total organic matter (TOM) can be calculated by multiplying TOC
by 1.2, assuming that the organic matter is 83 wt% carbon (Peters et al.,
2005).TOC can be measured by various methods, each with limitations and
potentially different results, as discussed below.
Direct combustion is the most common method, which requires
acidification of the ground rock sample with 6 N HCL in a filtering crucible to
remove carbonate, removal of the filtrate by washing /aspiration, and drying at
~ 55o C. Using a typical Leco Carbon Analyzer, the dried sample is combusted
with metallic oxide accelerator at ~ 1000o C. The CO2 generated during
Chapter Three Source Rocks Evaluation
49
combustion is analyzed using either infrared (IR) or thermal conductivity
detectors (TCDs). IR detectors are specified for CO2, while TCDs respond to
other compounds, such as sulfur dioxide and water, if they are not removed.
The indirect TOC method is usually applied to organic-poor, carbonate-
rich rocks. Total carbon (including carbonate carbon) is determined on one
aliquot of the sample, while carbonate carbon is determined on another aliquot
by coulometric measurements of the CO2 generated by acid treatment. Organic
carbon is the difference between total carbon and carbonate carbon. This
method is more time-consuming than the direct method and requires two
separate analyses of the sample.
The Rock-Eval II plus TOC determines TOC by summing the carbon in
the pyrolyzate with that obtained by oxidizing the residual organic matter at
600o C. For small samples (100 g), this method provides more reliable TOC
data than the methods discussed above, which require ~1-2 g of ground rock.
However, mature samples, where Vitrinite reflectance is more than ~1 %,
yield poor TOC data when determined by this method because the temperature
is insufficient for complete combustion.
The Rock-Eval VI Pyrolysis and oxidation reaches 850o C, which
results in more reliable Tmax and TOC data, especially for highly mature
samples (Lafargue et al., 1998). Hunt (1962) pointed out that, the organic
matter content in "Viking shale" differs with grain size of the sediments as:
Grain size organic matter %
> 4 µ (silt) 1.79
4 – 2 µ 2.08
< 2 µ 6.50
Vassaeovich et al., (1967) reported that, the weight percent of organic
carbon in particular source rocks could correlate with the enrichment of
Chapter Three Source Rocks Evaluation
50
terrigenous materials in the rock. Therefore, the terrigenous sediments, which
are rich in carbonates or coarser materials, have low concentration of organic
matter, but when shale content increases, the organic matter content increases.
Mcauliffe (1977) considered the range 0.5 – 1.0 % by weight organic carbon
is the lower limit for shale to be source rock. Dow (1978) mentioned that,
most acknowledged source rock must contain (0.2 – 0.8 %) organic carbon.
Hedberg et al., (1979) pointed out that, the organic carbon content of 0.5 %
represents the minimum limit for potential source rock. Thomas (1979)
classified the potentiality of source rocks based on their weight percentage of
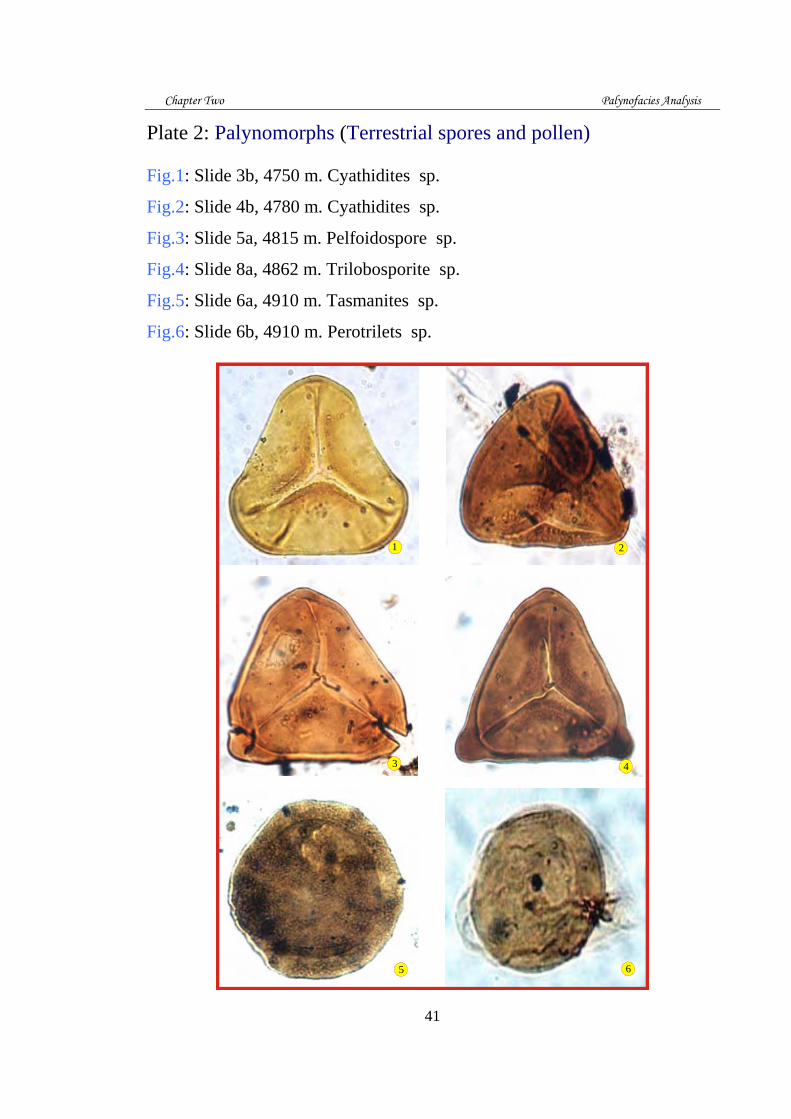
Fig.3: Slide 13b, 4780 m, Dinoflagellate cyst. Oligosphaeridium sp.
Fig.4: Slide 15b, 4815 m, Dinoflagellate cyst. Dingodinium jurassi
Fig.5: Slide 18b, 4839 m, Dinoflagellate cyst. Ellispoidinum cinctum.
Fig.6: Slide 17b, 1961 m, Dinoflagellate cyst. Gonyaulacysta sp.
Fig.7: Slide 20a, 4862 m, Dinoflagellate cyst. Spiniferites sp.
Fig.8: Slide 20b, 4862 m, Dinoflagellate cyst. Cyclonephelium sp.
Fig.9: Slide 12a, 4900 m, Tectinous foraminiferal test linings.
Fig.10: Slide 14a, 4915m, Uniserial tectinous foraminiferal test linings.
Fig.11: Slide 11b, 4922 m, Tectinous foraminiferal test linings.
Fig.12: Slide 16a, 4928 m, Tectinous foraminiferal test linings.
Fig.13: Slide 24b, 4932 m, Tectinous foraminiferal test linings.
Chapter Two Palynofacies Analysis
43
1 2
11
3 4
5 6 7 8
9 10
12 13
Chapter Two Palynofacies Analysis
44
Plate 1: Amorphous organic matter (AOM)
Fig.1: Slide 3b, 4742 m.
Fig.2: Slide 6a, 4750 m.
Fig.3: Slide 8b, 4770 m.
Fig.4: Slide 11b, 4780 m.
Fig.5: Slide 13a, 4800 m.
Fig.6: Slide 13a, 4825 m.
Fig.7: Slide 15b, 4850 m.
Fig.8: Slide 19b, 4862m.
Fig.9: Slide 34b, 4890 m.
Fig.10: Slide 37a, 4910 m.
Fig.11: Slide 37a, 4922 m.
Fig.12: Slide 37b, 4932 m.
Chapter Two Palynofacies Analysis
45
1
4 56
7 8 9
10 11 12
2 3
Chapter Two Palynofacies Analysis
46
Plate 5: Opaques
Fig.1: Slide 25a, 4770 m.
Fig. 2: Slide 25b, 4825 m.
1 2
References
164
Al-Ameri, T. K., Al-Musawi, F. S., and Batten, D. J., 1999; Palynofacies indications of depositional environments and source potential for hydrocarbons: Uppermost Jurassic – Basal Cretaceous Sulaiy Formation, Southern Iraq. Cretaceous Research (1999), 20, p. 359-363. Albrecht, P. and Ourisson, G. (1969): Diagenese des hydrocarbures satures dans une serive sedimentair empaisse (Douala, Cameron) Geochim. Cosmochim, Acta, V. 33, pp. 138 – 142. Alexander, R., Kagl, R. I., and Woodhouse, G.W. (1981): Geochemical correlation of Windalia oil and extracts of Winning group (Cretaceous) potential source rock Barrow sub-basin, Western Australia. AAPG Bull., V. 65, pp. 235 – 249. Al-Kadhimi, J.M.A., Sissakian, V.K.,Sattar,A.F.and Deikran, D.B., 1996. Tectonic Map of Iraq, 3 rd edit., scale 1:1 000 000. GEOSURV, Baghdad, Iraq. Al-Shahwan, M.F., 2002; Thermal maturity patterns of the lower Cretaceous succession, southern Iraq: Implication of hydrocarbon potential; Unp. Ph. D. Thesis, college of Science, Baghdad University, 196 p. Al-sharhan, A.S. and A.E.M.Narin, 1997. Sedimentary basin and petroleum geology of the middle east. Elsevier, the Netherlands, 843P. Aquino Neto, F. R., J. Triguis, D. A. Azevedo, R. Rodrigues, and B. R. T. Simoneit, 1992. Organic geochemistry of geographically unrelated tasmanites: Organic Geochemistry, v. 18, p. 791–803. Aquino Neto, F.R., Restle, A., Connan, J., Albrecht, P., Ourisson, G.,1982. Novel tricyclic terpane (C19, C20) in sediments and petroleums.Tetrahedran Letters 23, pp. 2027-2030. Aquino Neto, F.R., Trendel, J.M., Restle, A., Connan, J., Albrecht, P.A.,1983. Occurrence and formation of tricyclicand tetracyclic terpanes in sediments and petroleums. In: Bjorøy, M. (Ed.), Advances in Organic Geochemistry. pp. 659-667. Beydoun, Z.R, M.W.Hughes Clark, and R.stoneley, 1992. Petroleum in the Mesopotamian basin. Alate Tertiary foreland basin overprinted on to the outer edge of a vast hydrocarbon-rich Paleozoic-Mesozoic passive-margin shelf. In R.W.Mac queen and D.A.leckie(Eds.), foreland basin and fold belts. AAPG Memoir 55, p.309-339.
References
165
Bishop, R. S., Gehman, H. M., and Young, A. (1983): Concepts for estimating hydrocarbon accumulation and dispersion AAPG. Bull., V. 67, pp. 337 – 348. Bray, E. E. and Evans, E. D. (1961): Distribution of n – paraffins as a clue to recognition of source beds, Geochim. Cosmochim. Acta, V. 22, p. 2. Brooks, G. G., (1966): Generalized stratigraphy geologic history and petroleum prospects of the Western Desert. Pan American, U. A. R. Oil Company (Int. Rep. No.39). Buday, T., 1980; The regional geology of Iraq: V.1, Stratigraphy and Paleogeography; state Organization for Minerals, Baghdad, 445p. Burwood, R., P. Leplat, B. Mycke, and J. Paulet, 1992. Rifted margin source rock deposition: a carbon isotope and biomarker study of a west African Lower Cretaceous “lacustrine” section: Organic Geochemistry, v. 19, pp. 41-52. Burwood, S. M., Witte, De., Mycke, B. and Paulet, J. (1995): In petroleum source rock, ed. Katz, B., Springer Verlag, pp. 235 – 263. Calvin, M. (1971): Geochemical evaluation, Moscow, Mir, p. 23. Cerchez, V. and Anton, S. (1972): Cercetar asupra catracterelor distinctive ale rocilor Cu continut dehidrocarburi. Rev. Petro. Si. Gaze, V. 23, nr. 3 Bucuresti. Chung, H. M., Claypool, and Squires, R. M. (1994): Source characteristics of marine oils as indicated by carbon isotope ratios of volatile hydrocarbons. AAPG Bull., V. 78 No. 30, pp. 396 – 408. Chung. H. M., Rooney, M. A., Toon, M. B., and Claypool, G. E. (1992): Carbon isotope composition of marine crude oils. AAPG Bull., V. 76, No. 7, pp. 1000 – 1007. Clark, R. C. Jr. and Blumer, M. (1967): Distribution of n – paraffins in marine organisms and sediments, Liminol., and Oceanager, V. 12, No. 1, p. 79. Claypool, G. E., and Mancini, M. (1989): Geochemical relationships of petroleum in Mesozoic reservoirs to carbonate source rocks of Jurassic Smackover Formation, southwestern Alabama. AAPG Bull., V. 73, pp. 904 – 924.
References
166
Connan, J., Bouroullec, J., Dessort, D., Albrecht, P., 1986. The microbial input in carbonate-anhydrite facies of a Sabkha paleoenvironment from Guatemala: a molecular approach. Organic Geochemistry 10, pp. 29-50. Degens, E. T. (1969): Biogeochemistry of stable carbon isotopes, in G. Eglinton and M.T.J. Murphy, eds., Organic Geochemistry, Berlin, Springer – Verlag, pp. 304 – 329. Demaison, G. J., 1984. The generative basin concept, in G. J. Demaison and R. J. Murris, eds., Petroleum geochemistry and basin evaluation: AAPG Memoir 35, pp. 1-14. Demaison, G. J., and G. T. Moore, 1980. Anoxic environments and oil source bed genesis: AAPG Bulletin, v. 64, pp. 1179-1209. Demaison, G., and B. J. Huizinga 1991. Genetic classification of petroleum systems. AAPG Bulletin, v. 75, pp. 1626-1643. Denison, R.E., Kirkland, D. W., and Gormly, R. J. (1990): Criner Hills-Arbuckle Mountains field trip guidebook. Mobil Dallas Research Laboratory. Dow, W. G. (1978): Petroleum source beds on continental slopes and rises, AAPG. Bull. V. 62, pp. 1584 – 1606. Dow, W. G., 1974. Application of oil correlation and source rock data to exploration in the Williston basin. AAPG Bulletin, v. 58, pp. 1253-1262. Durand, B., and Espitalie, J. (1970): Analyse geochimique de la amtiere organisque extradite des roches sedimententaires, II-Extraction et analyse quantitative des hydrocarbures de la fraction C1 - C15 et des gaz permanents. Rev. Inst. Fr. Pet. 25, pp. 741 – 751. Ekweozor, C. M. and Okays, N. V. (1980): Petroleum source bed evaluation of Tertiary Niger delta, AAPG. Bull, V. 64, pp. 1251 – 1259. Ekweozor, C. M., and O. T. Udo, 1988. The oleananes: origin, maturation, and limits of occurrence in southern Nigeria sedimentary basins, in L. Mattavelli and L. Novelli, eds., Advances in organic geochemistry 1987: New York, Pergamon Press, pp. 131–140. Espitalie, J. Deroo, G., and Marquis, F. (1985): Rock – Eval pyrolysis and its application. Inst. Fr. Preprint 33578, 72p.
References
167
Espitalie, J., Laporte, L., Madec, M., Marquis, F., Leplat, P., Paulet, J., and Boutefeu, A. (1977): Methode rapid de caracterisation des rocks meres, de leur potential petrolier et leur degree devolution. Rev. Inst. Fr. Petrol., V. 32, pp. 23 – 42. Faber, E., Stahl, W., 1984. Geochemical surface exploration for hydrocarbons in the North Sea. AAPG Bulletin v. 68, pp. 363-386. Fouad, S.F., 2010. Tectonic Map of Iraq, 3 rd edit., scale 1:1 000 000. GEOSURV, Baghdad, Iraq. Fuex, A. N. (1977): The use of stable carbon isotopes in hydrocarbon exploration. Journal of Geochemical Exploration. V. 7, pp. 155 – 188. Grantham, P. J., 1986. The occurrence of unusual C27 and C29 sterane predominances in two types of Oman crude oil: Organic Geochemistry, v. 9, pp. 1-10. Grantham, P. J., Lijmbach, G. W. M., and Posthuma, J., 1990. Geochemistry of crude oils in Oman, in J. Brooks, ed., Classic petroleum provinces: Geological Society Special Publication 50, pp. 317-328. Grantham, P. J., Lijmbach, G. W. M., Posthuma, J., Hughes Clarke, M. W., and Willink, R. J., 1987. Origin of crude oils in Oman: Journal of Petroleum Geology, v. 11, pp. 61-80. Hanson, A. D., Ritts, B. D., Zinniker, D., Moldowan, J. M., and Biffi, U. (2001): Upper Oligocene lacustrine source rocks and petroleum systems of the northern Qaidam basin, northwest China. AAPG Bull., V. 85, No. 4, pp. 601 – 619. Hedberg, H. D., Moody, J. D. and Hedberg, R. M. (1979): Petroleum prospects of deep offshore: AAPG. Bull., V. 63, pp. 286 – 300. Holba, A. G., Tegelaar, E. W., Huizinga, B. J., Moldowan, J. M., Singletary, M. S., McCaffrey, M. A. and Dzou, L. I. P., 1998. 24-Norcholestanes as age-sensitive molecular fossils. Geology. 26,pp 783-786. Hood, A., Gutjahar, C. M., and Heacock, R. L. (1975): Organic metamorphism and the generation of petroleum. AAPG Bull., V. 59, pp. 986 – 996.
References
168
Hostettler, F.D., Pereira, W.E., Kvenolden, K.A., van Geen, A., Luoma, S.N., Fuller, C.C., Anima, R., 1999. A record of hydrocarbon input to San Francisco Bay as traced by biomarker profiles in surface sediment and sediment cores. Marine Chemistry 64, pp. 115-127. Huang, W. Y., and W. G. Meinschein, 1979. Sterols as ecological indicators: Geochimica et Cosmochimica Acta, v. 43, pp. 739-745. Hunt, J. M. (1962): Geochemical data on organic matter in sediments (abs.) Inter. Sci. oil. Conf., Budapest, Hungary, Bd. 2, pp. 394 – 409. Hunt, J. M. (1968): How gas and oil form and migrate: World oil, V. 167, No. 4, p. 140, 145, 148 – 150. Hunt, J. M. (1970): The significance of carbon isotope variations in marine sediments, In G.D. Hobson and G.C. Speers, eds., Advances in organic geochemistry, 1966. New York, Pergamon Press, pp. 27 – 35. Hunt, J. M. (1979): Petroleum geochemistry and geology. San Francisco, W. H. freeman, 617p. Hunt, J. M. (1996): Petroleum geochemistry and geology. 2nd ed. Freeman and company, New York, 743p. Illich, H. A. (1983): Pristane, phytane and lower molecular weight isoprenoid distributions in oils. AAPG Bull., V. 67, pp. 385 – 393. Jackson, k. S., Hawkins, P. J., and Bennett, A. J. R. 1985. Regional facies and geochemical evolution of southern Denison Trough. APEA J. 20, pp. 143-158. Jenden, P. D., D. J. Drazan, and I. R. Kaplan, 1993. Mixing of thermogenic natural gases in northern Appalachian basin: AAPG Bulletin, v. 77, pp. 980-998. Kernkel, E. (1925): Geologic Africa V. 1, Borntrae. Ger, Berlin, 461 p. Korchagina, Y. I. (1983): Methods of evaluation of hydrocarbon generated from a source rock (In Russian) Moscow, Nedra. p. 222. Korchagina, Y. I. and Chetverekova, O. P. (1976): Methods of analysis of sedimentary organic matter (In Russian) Moscow, Nedra, p. 228.
References
169
Korchagina, Y. I. and Chetverekova, O. P. (1980): Methods of interpretation and analytical data of sedimentary organic matter (In Russian) Moscow, Nedra, p. 228. Lafargue, E., Marquis, F. and Pillot, D., 1998. Rock-Eval-6 applications in hydrocarbon exploration, production, and soil contamination studies. Revue de l’Insitut Francis du petrole, v. 53, pp. 421-437. Larskeya, Y. S., and Zhabrev, D. V. (1964): Effect temperature and pressures on the composition of dispersed organic matter. Dokl. Akad. Nauk SSSR. 157(4), pp. 135 – 139. Laughrey, C. D., and F. J. Baldassare, 1998. Geochemistry and origin of some natural gases in the Plateau province of the central Appalachian basin, Pennsylvania and Ohio: AAPG Bulletin, v. 82, pp. 317-335. Lipps, J. H. 1993. Fossil Prokaryotes and Protists. Blackwell Scientific Publications, Boston, pp. 155-167. Lopatin, N. V. (1971): Time and Temperature as factors in coalification: Izvestiya Aakademiya Nauk USSR. Seriya Geologicheskaya, No. 3, pp. 95 – 106 (In Ruessian). Louis, M. C. (1964): Etudes geochimiques sur les "Schistes Cartons" du Toarcian du Bassin de Paris; In G.D Hobson and M.C Louis (eds.) Advances in organic geochemistry: pp. 85 – 94. Magoon, L. B., 1988. The petroleum system - a classification scheme for research, exploration and resource assessment, in Magoon, ed., Petroleum systems of the United States: U.S. Geological Survey Bulletin 1870, pp. 2-15. Magoon, L. B., and W. G. Dow, 1994. The petroleum system, in L. B. Magoon and W. G. Dow, eds., The petroleum system - from source to trap: AAPG Memoir 60, pp. 3-24. Mann, A. L., Goodwin, N. S., and Lowe, S. (1987): Geochemical characteristics of lacustrine source rocks: a combined palynological / molecular study of a Tertiary sequence from offshore China, in Proceeding of the Indonesian Petroleum Association. 60th Annula Convention, V. 1: Jakarta, Indonesian Petroleum Association, pp. 241 – 258. Mcauliffe C. D. (1977): Evaporation and solution of C2 to C10 hydrocarbons from crude oil on the sea surface In. D. A. Wolfe (ed) Fte
References
170
and effects of petroleum hydrocarbons in marine ecosystems and organisms: New York Pergamon press, pp. 362 – 372. Mello, M. R., Gaglianone, P. C., Brassell, S. C. and Maxwell, J. R., 1988. Geochemical and biological marker assessment of depositional environment using Brazilian offshore oils. Marine and Petroleum Geology, v. 5, pp. 205-223. Mello, M. R., N. Telnaes, P. C. Gaglianone, M. I. Chicarelli, S. C. Brassell, and J. R. Maxwell, 1988. Organic geochemical characterization of depositional paleoenvironments in Brazilian marginal basins: Organic Geochemistry, v. 13, pp. 31-46. Mello, R. M., Gaglianone, P. C., Brassel, S. C., and Maxwell, J. R. (1988a): Geochemical and biological marker assessment of depositional environments using Brazilian offshore oils. Mar. Pet. Geol., V. 5, pp. 205 – 223. Moldowan, J. M., Dahl, J., Huizinga, B. J., Fago, F. G., Hickey, L. J., Peakman, T. M. and Taylor, D. W. 1994. The molecular fossil record of oleanane and its relation to angiosperms. Science 265, pp.768-771. Moldowan, J. M., Dahl, J., Jacobson, S. R., Huizinga, B. J., Fago, F. G., Shetty, R., Watt, D. S. and Peters, K. E. 1996a. Chemostratigraphic reconstruction of biofa- cies: Molecular evidence linking cyst-forming dinoagellates with pre-Triassic ancestors. Geology 24, pp.159-162. Moldowan, J. M., Ekuan, A., Dahl, J., Kvenvolden, K. A. and Hostettler, F. D. 1996b. Bioremediation effects on steranes: examples from the Exxon Valdez oil spill. 211th American Chemical Society National Meeting, New Orleans, LA, March 24-28. Moldowan, J. M., Lee, C. Y., Watt, D. S., Jeganathan, A., Slougui, N. E. and Gallegos, E. J. 1991. Analysis and occurrence of C26-steranes in petroleum and source rocks. Geochimica et Cosmochimica Acta 55, pp.1065-1081. Moldowan, J. M., P. Sundararaman, and M. Schoell, 1986. Sensitivity of biomarker properties to depositional environment and/or source input in the lower Toarcian of S.W. Germany: Organic Geochemistry, v. 10, p. 915-926.
References
171
Moldowan, J. M., Seifert, W. K., and Gallegos, E. J. (1985): Relationship between petroleum composition and depositional environment of petroleum source rock. AAPG Bull., V. 69, pp. 1255 – 1268. Murray, A. P., Summons, R. E., Boreham, C. J., and Dowwling, L. M., 1994. Biomarker and n-alkane isotope profile for Tertiary oils: Relationship to source rocks depositional setting. In: Telnaes, N., Van Grass, G., and Oygard, K. (Eds.). Advances in Organic Geochemistry, v. 22, pp. 521-542. Ourisson, G., Albrecht, P., Rohmer, M., 1982. Predictive microbial biochemistry from molecular fossils to procaryotic membranes. Trends in Biochemical Science 7, pp. 236-239. Palacas, eds., Petroleum geochemistry and source rock potential of carbonate rocks. AAPG studies in geology, V.18, pp. 71 – 96. Palacas, J. G., Anders, D. E., and King, D. J. (1984): South Florida basin – prime example of carbonate source rocks of petroleum, in J.G. Peters, K. E. (1986): Guidelines for evaluating petroleum source rock using programmed pyrolysis. AAPG Bull., V. 70, pp. 318 – 329. Peters, K. E., and Cassa, M. R., 1994. Applied source rock geochemistry. In: the petroleum system-from source to trap (L. B. Magoon and W. G. Dows, eds.), AAPG, Tulsa, OK, pp. 93-117. Peters, K. E., and Moldowan, J. M. (1991): Effects of source, thermal maturity and biodegradation on the distribution and isomerization of homohopanes in petroleum. Organic Geochemistry, V. 17, pp. 47 – 61. Peters, K. E., and Moldowan, J. M., 1991. Effects of source, thermal maturity, and biodegradation on the distribution and isomerization of homohopanes in petroleum: Organic Geochemistry, v. 17, pp. 47-61. Peters, K. E., and Moldowan, J. M., 1993. The Biomarker Guide: Interpreting Molecular Fossils in Petroleum and Ancient Sediments. New Jersey: Prentice-Hall, 363 p.
References
172
Peters, K. E., Fraser, T., H., Amris, W., Rustanto, B., and Hermanto, E., 1999. Geochemistry of crude oils from eastern Indonesia. AAPG Bulletin, v. 83, pp. 1927-1942. Peters, K. E., Kontorovich, A. Eh., Huizinga, B. J., Moldowan, J. M., and Lee, C. Y. (1994): Multiple oil families in the west Siberian basin. AAPG Bull., V. 78, No. 6, pp. 893 – 909. Peters, K. E., Kontorovich, A. Eh., Moldowan, J. M., Andrusevich, V. E., Huizinga, B. J., Demaison, G. J., and Stasova, O. F. (1993): Geochemistry of selected oils and rocks from the central portion of the Western Siberian basin, Russia. AAPG Bull., V. 77, No. 5, pp. 863 – 887. Peters, K. E., Moldowan, J. M., Schoell, M. and Hempkins, W. B., 1986. Petroleum isotopic and biomarker composition related to source rock organic matter and depositional environment: Organic Geochemistry, v. 10, pp. 17-27. Peters, K. E., Walters, C. C. and Moldowan, J. M., 2005. The Biomarker Guide, 2nd Edition, Part I, "Biomarkers and Isotopes in the Environmental and Human History", and Part II "Biomarkers and Isotopes in Petroleum Exploration and Earth History", Cambridge University Press, 1155p. Peters, K.E., Moldowan, J.M. (Eds.), 1993. The Biomarker Guide. Interpreting Molecular Fossils in Petroleum and Ancient Sediments. Pretice-Hall, Englewood Cliffs, NJ, 363p. Philip, R. P. (1985): Fossil fuel biomarkers. Amsterdam, Elsevier, p. 294. Philippi, G. T. (1965): On the depth, time and mechanism of petroleum generation. Geochim. Cosmochim, Acta, V. 20, pp. 1012 – 1050. Philippi, G. T. (1974): The influence of marine and terrestrial source material on the composition of petroleum. Geochim. Cosmochim, Acta, V. 58, pp. 149 – 150. Philp, R.P., Fan, Z., 1987. Geochemical investigation of oils and source rocks from Qianjing Depression of Jianhan Basin, a terrigenous saline basin, China. Organic Geochemistry 11, pp. 549-562. Pitman, J.K., Steinshouer, D. and Lewan, M.D., 2004. Petroleum generation and migration in the Meso potamian Basin and Zagros Fold Belt of Iraq result from a basin-modeling study, V.9, No.4, Gulf petrolink Bahrain, P.41- 72.
References
173
Powell, T. G., and McKirdy, D. M. (1973): Relationship between ratio of pristane to phytane, crude oil composition and geological environment in Australia. Nature, Physical Science, V. 243, pp. 37 – 39. Price, L. G., Daws, T., and Pawlewicz, M. (1986): Organic metamorphism in the Lower Mississippian – Upper Devonian Bakken shales. Part I Rock – Eval pyrolysis and vitrinite reflectance. Journal of Petroleum Geology, V. 9, No. 2, pp. 125 – 162. Riediger, C. L., Fowler, M. G., Brooks, P. W., and Snowdon, L. R. (1990): Triassic oils and potential Mesozoic source rocks, Peace River Arch area, Western Canada basin. Organic Geochemistry, V. 16, pp. 295 – 305. Roger, M. A. (1980): Application of organic facies concepts hydrocarbon source rock evaluation, in proceedings of the 10th World Petrol. Congr. V. 2. London, Heyden and Son Ltd., pp. 22 – 30. Ronov, D. A. (1958): Organic carbon in sedimentary rocks, Geochemistry, V. 5, pp. 510 – 536. Rubinstein, Y., O. Sieskind, and P. Albrecht, 1975. Rearranged steranes in a shale: occurrence and simulated formation: Journal of the Chemical Society, Perkin Transactions I, pp. 1833–1836. Rullkotter, J., Marzi, R., 1988. Natural and artificial maturation of biological markers in a Toarcian shale from northern Germany. Organic Geochemistry 13, pp. 639-645. Sadooni, F.N., 1997. Stratigraphy and petroleum prospects of upper Jurassic carbonate in Iraq. Petroleum Geosciences:V.3, P 233- 243. Schoell, M., 1980. The hydrogen and carbon isotopic composition of methane from natural gases of various origins. Geochimica et Cosmochimica Acta v. 44, pp. 649-662. Schoell, M., 1983. Genetic characterization of natural gases. AAPG Bulletin v. 67, pp. 2225- 2238. Schoell, M., 1984. Stable isotopes in petroleum research. In: Brooks, J.B., Welte, D. (Eds.), Advances in Petroleum Geochemistry, Academic Press, London, v. 1, pp. 215-245.
References
174
Seifert, W. K. and Moldowan, j. M., 1979. The effect of biodegradation on steranes and terpanes in crude oils. Geochimica et Cosmochimica Acta, 43, pp. 111-126. Seifert, W. K., and Moldowan, J. M. (1986): Methods in geochemistry and geophysics, V. 24, pp. 261 – 290. Shanmugam, G. (1985): Significance of coniferous rain forest and related organic matter in generating commercial quantities of oil, Gippsland basin, Australia. AAPG Bull., V. 69, No. 8, pp. 1241 – 1254. Silverman, S. R. (1963): Investigations of petroleum origin and evolution mechanisms by carbon isotope studies, in Craig, S. L., Miller, and G. J. Wasserburg, eds., Isotopic and Cosmic chemistry. North Holland, Amsterdam, pp. 92 – 102. Sissakian, V.K., 2000. Geological Map of Iraq, 3 rd edit., scale 1:1 000 000. GEOSURV, Baghdad, Iraq. Sissakian, V.K.,and Deikran, D.B., 1998. Neotectonic Map of Iraq, scale 1:1 000 000. GEOSURV, Baghdad, Iraq. Sofer, Z. (1984): Stable carbon isotope compositions of crude oils, application to source depositional environment petroleum alteration. AAPG Bull., V. 68, pp. 31 - 49. Sofer, Z. (1988): Biomarkers and carbon isotopes of oils in the Jurassic Smackover trend of the Gulf Coast States, U.S.A., Organic Geochemistry, V. 12, pp. 421 – 432. Summons, R. E., Thomas, J., Maxwell, J. R., and Boreham, C. J., 1992. Secular and environmental constraints on the occurrence of dinosterane in sediments: Geochimica et Cosmochimica Acta, v. 56, pp. 2437-2444. Summons, R. E., Volkman, J. K., and Boreham, C. J., 1987. Dinosterane and other steroidal hydrocarbons of dinoflagellate origin in sediments and petroleum: Geochimica et Cosmochimica Acta, v. 51, pp. 3075-3082. Tappan, H. 1980. The Paleobiology of Plant Protists. W. H. Freeman and Company, San Francisco, CA, pp. 567-677. Ten Haven, H. L., De Leeum, J. W., and Schenk, P. A. (1985): Organic geochemical studies of Amessinian Evaporite Basin. Northern Apennines (Italy) l. Hydrocarbon Biological markers for a hypersaline environment. Geochemica et Cosmochimica Acta, V. 49, pp. 2181 – 2191.
References
175
Ten Haven, H. L., De Leeuw, J. W., Rullkötter, J. and Sinninghe Damste, J. S., 1987. Restricted utility of the pristane/phytane ratio as a palaeoenvironmental indicator. Nature, 330, pp. 641-643. Thomas, B. M. (1979): Geochemical analysis of hydrocarbon occurrence, Northern Perth basin Australia. AAPG Bull., V. 63, pp. 1092 – 1107. Tissot, B. P. and Pelet, R. (1971): New data on the mechanism of formation and migration of petroleum. Mathematical simulation of the Eight World Petroleum Congress. Moscow, V. 2, pp. 35 – 46. Tissot, B. P., and Welte, D. H. (1978): Petroleum formation and occurrence. Springer, Verlag Berlin, Heidelberg, New York, 538p. Tissot, B. P., and Welte, D. H. (1984): Petroleum formation and occurrence, 2nd ed., New York, Springer, Verlag, 699p. Tissot, B., Durand, B., and Espitalie, J., and Compaz, A. (1974): Influence of nature and diagenesis of organic matter in formation of petroleum AAPG. Bull. V. 58, No. 3. pp. 499 – 506. Tyson, R. V., 1995. Sedimentary organic matter: London, Chapman and Hall, 615 p. Ungerer, P. (1990): State of the art of research in Rinetic modeling of oil formation and expulsion. Org. Geochem. V. 16, pp. 1 – 25. Van Graas, G. W., 1990. Biomarker maturity parameters for high maturities: Calibration of the working range up to the oil/condensates threshold. Organic Geochemistry, v.16, pp. 1025-1032. Vassaeovich, N. B., Gusexa, A. and Leefman, I.N. (1976): Some aspects of petroleum geochemistry in study of organic matter in recent and ancient sediments: Moscow. Nedra, pp. 367 – 380. Vassaeovich, N. B., Korchagina, Y. I., Lopatin, N. V. and Chernichen, V.V. (1969): The main phase of oil generation: Moscow Univ. Ser. Geol. No. 6, pp. 66 – 69. Vassaeovich, N. B., Visotskiy, I. V., Guseva, A. N. and Olenin, V.B. (1967): Hydrocarbon in the sedimentary mantle of the earth. In 7th World Petrol. Conf., V. 2 Landon: Elsevier, pp. 37 – 45.
References
176
Volkman, J. K., Alexander, R., Kagi, R. I., Noble, R. A., Woodhouse, G. W., 1983. A geochemical reconstruction of oil generation in the Barrow sub-basin of Western Australia. Geochimica et Cosmochimica Acta 47, pp. 2091-2106. Wang, Z., Fingas, M., Sergy, G., 1994. Study of 22-year-old arrow oil samples using biomarker compounds by GC/MS. Environmental Science and Technology 28, pp. 1733-1746. Waples, D. W. (1979): Simple method for oil source bed evaluation. AAPG Bull., V. 63, pp. 239 – 245. Waples, D. W. (1980): Time and temperature petroleum formation; application of Lopatin's method to petroleum exploration. AAPG Bull., V. 64, pp. 916 – 926. Waples, D. W. (1985): Geochemistry in petroleum exploration. International Human Resources Development Corporation, Boston, 232p. Waples, D. W., and Machihara, T., 1991. Biomarkers for geologists. A practical guide to the application of steranes and triterpanes in petroleum geology. AAPG methods in exploration, AAPG 9, 91p. Waples, D. W., Machihara, T. (1992): Biomarkers for geologist. AAPG methods in exploration series, No. 9, 91p. Waples, D.W. (Ed.), 1985. Geochemistry in Petroleum Exploration. Reidel Publushing Company, Boston, 232p. Welte, D. H. and Waples, D., 1973. Uber die Bevorzugung geradzahliger n-alkane in sedimentgesteinen. Naturwissenschaften, 60p. Whiticar, M.J., 1994. Correlation of natural gases with their sources. In: Magoon, L.B., Dow, W.G. (Eds.), The Petroleum System – From Source to Trap, AAPG Memoir, v. 60, pp. 261-283. Yeh, H. W., and Epstein, E. M. (1981): Hydrogen and carbon isotopes of petroleum and related organic matter. Geochem et Cosmochim Acta, V. 45, pp. 753 – 762. Zumberge, J. E. (1987 a): Prediction of source rock characteristics based on terpane biomarkers in crude oils. A multivariate statistical approach, Geochim et Cosmochim. Acta 51, pp. 1625 – 1637.
References
177
Zumberge, J. E. (1993): Organic geochemistry of estancia Vieja oils, Rio Negro Norte Block, in (Engel, M. H., and Macko, A. S. (eds.), Organic Geochemistry principles and applications, New York and London, pp. 461 – 470.