8
Crude Oil Futures Markets: Are the Benefits of “Roll Yield” Real? December 2014 Hilary Till Research Associate, EDHEC-Risk Institute Principal, Premia Research LLC
Crude Oil Futures Markets: Are the Benefits of “Roll Yield” Real?
December 2014
Hilary TillResearch Associate, EDHEC-Risk InstitutePrincipal, Premia Research LLC

2
Research assistance from Katherine Farren of Premia Risk Consultancy, Inc. is gratefully acknowledged.
EDHEC is one of the top five business schools in France. Its reputation is built on the high quality of its faculty and the privileged relationship with professionals that the school has cultivated since its establishment in 1906. EDHEC Business School has decided to draw on its extensive knowledge of the professional environment and has therefore focused its research on themes that satisfy the needs of professionals.
EDHEC pursues an active research policy in the field of finance. EDHEC-Risk Institute carries out numerous research programmes in the areas of asset allocation and risk management in both the traditional and alternative investment universes.
Copyright © 2016 EDHEC
3
Is roll yield still a useful concept in evaluating crude oil futures markets? This is a timely question because of (a) scepticism on the benefits of roll yield; and (b) the dramatic drop in oil prices had led investors to question whether crude-oil-futures positions deserve a role in a diversified investment portfolio.
Are the Benefits of Roll Yield Illusory?An article in the October 2014 issue of Futures Magazine concluded that the benefits of roll yield are indeed illusory, and that there is no observable correlation between roll yields and returns. The author defined roll yield as follows: it is “the price difference between delivery months in a roll.” And this price difference results from the “shape of the futures price curve for a commodity futures contract”. The roll yield is positive when the near-month futures contract trades at a premium to deferred-delivery contracts, a curve shape referred to as “backwardation”.Conversely, the roll yield is negative when the near-month futures curve contract trades at a discount to deferred-delivery contracts, a curve shape referred to as “contango”.
Roll Yields Not Useful Over Brief Holding PeriodsThe author examined both the corn and crude oil futures markets to find out whether monthly returns in each market had been correlated to their respective monthly roll returns from May 2009 through August 2014. In each case, when graphing the commodity futures contract’s returns versus its roll yield, there was no apparent relationship.
Given how the author has defined the issue, his conclusion on the lack of usefulness of roll yield is clearly correct. But then how can there be so many articles that point out the utility of roll yield in trading and investing? The answer is that roll yield becomes useful only under very well-defined circumstances. But then what are those circumstances? There are at least three circumstances, where historically, an examination of roll yield does appear useful:[1] Over sufficiently long time horizons, a clear relationship between a futures market’s returns and its roll yield is clearly observable. [2] And further, in the crude oil futures markets, over sufficiently long time horizons, curve shape is a useful toggle for determining whether one should continue with structural positions in crude oil futures contracts. [3] Lastly, in choosing amongst commodity futures contracts for long-term investing, roll yield has been a key differentiator amongst commodity markets.
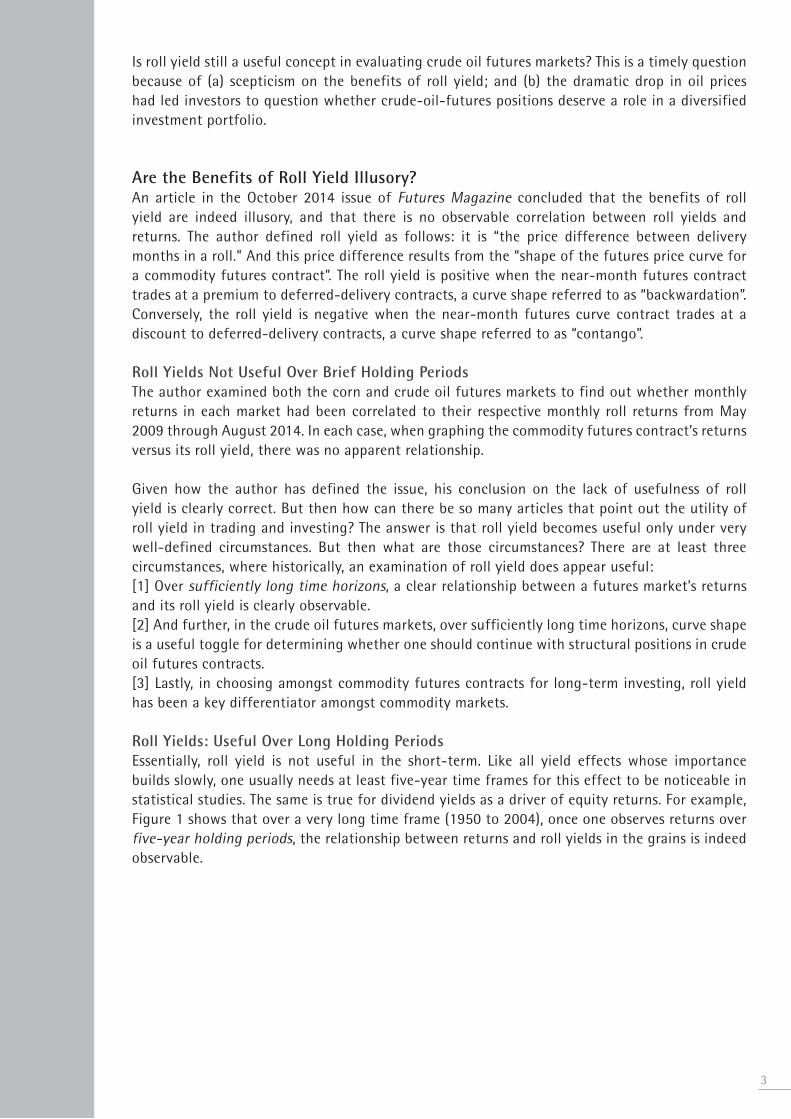
Roll Yields: Useful Over Long Holding PeriodsEssentially, roll yield is not useful in the short-term. Like all yield effects whose importance builds slowly, one usually needs at least five-year time frames for this effect to be noticeable in statistical studies. The same is true for dividend yields as a driver of equity returns. For example, Figure 1 shows that over a very long time frame (1950 to 2004), once one observes returns over five-year holding periods, the relationship between returns and roll yields in the grains is indeed observable.
4
Figure 1
Sources of Data: Prices for contracts up to the year 1960 were obtained from Commodity Systems Incorporated. Commodity Research Board (CRB) data is used for subsequent prices.Source of Graph: This graph is based on research undertaken during the work that led to the article, “Backwardation and Commodity Futures Performance: Evidence from Evolving Agricultural Futures Markets,” by Barry Feldman and Hilary Till, Journal of Alternative Investments, Winter 2006.“Excess return” refers to the futures-only returns from buying and rolling futures contracts. This return calculation excludes returns from the collateral that would be held in fully collateralising such a program. Therefore, they are the returns in “excess” of the collateral return. For further detail on these calculations, please refer to the journal article.
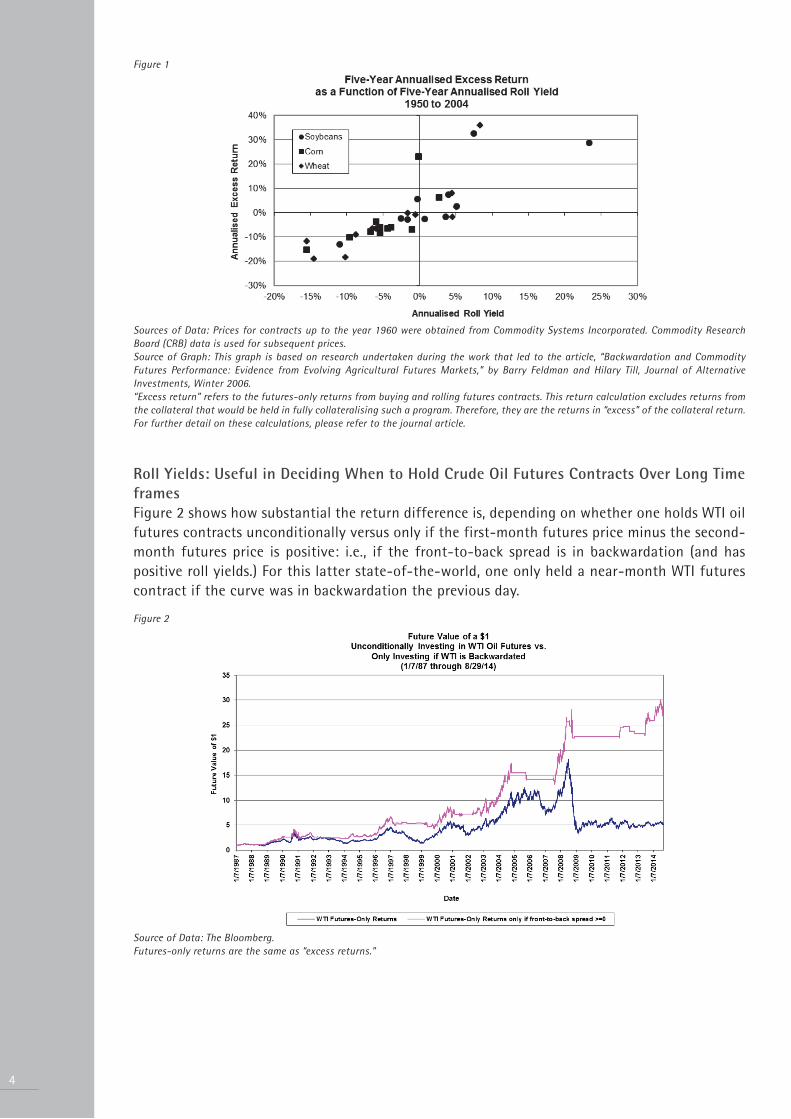
Roll Yields: Useful in Deciding When to Hold Crude Oil Futures Contracts Over Long Time framesFigure 2 shows how substantial the return difference is, depending on whether one holds WTI oil futures contracts unconditionally versus only if the first-month futures price minus the second-month futures price is positive: i.e., if the front-to-back spread is in backwardation (and has positive roll yields.) For this latter state-of-the-world, one only held a near-month WTI futures contract if the curve was in backwardation the previous day.
Figure 2
Source of Data: The Bloomberg.Futures-only returns are the same as “excess returns.”
The annualised returns from 1987 through the end-of-August 2014 for holding and rolling WTI futures contracts were 6.2% per year over T-bills. Correspondingly, the returns over the same period for only holding a WTI futures contract when the contract’s front-to-back spread was in backwardation the previous day were 12.8% per year over T-bills.
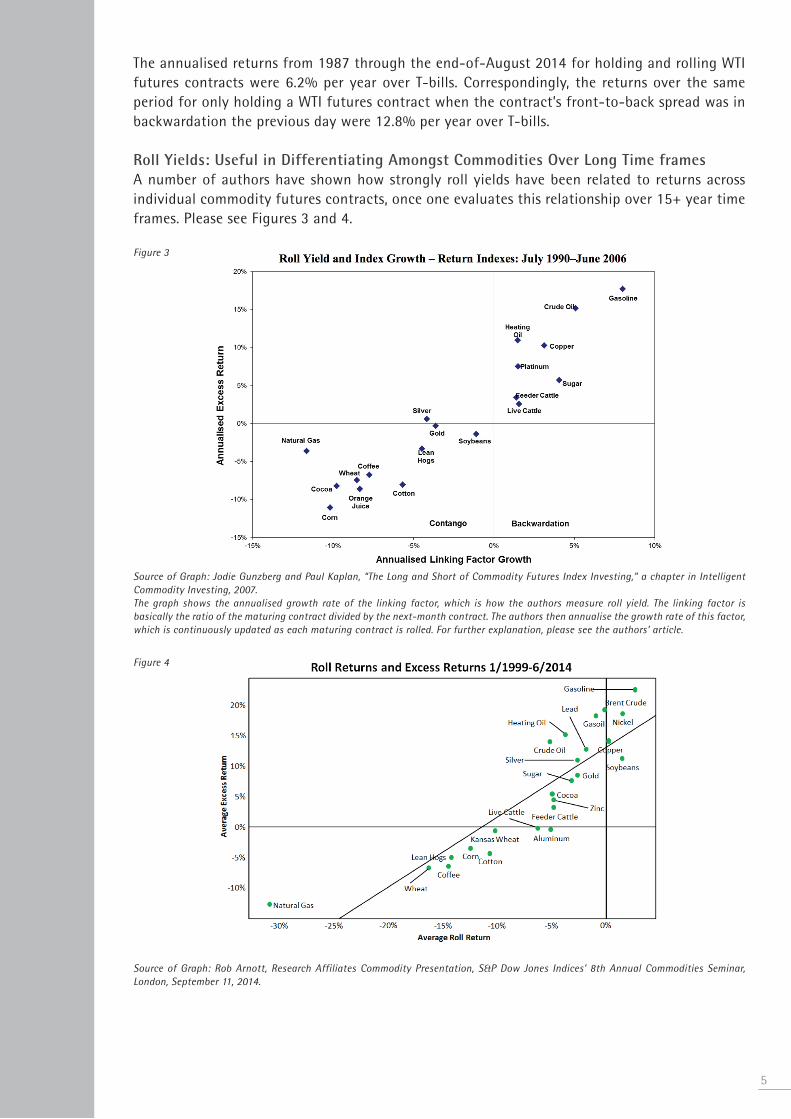
Roll Yields: Useful in Differentiating Amongst Commodities Over Long Time framesA number of authors have shown how strongly roll yields have been related to returns across individual commodity futures contracts, once one evaluates this relationship over 15+ year time frames. Please see Figures 3 and 4.
Figure 3
Source of Graph: Jodie Gunzberg and Paul Kaplan, “The Long and Short of Commodity Futures Index Investing,” a chapter in Intelligent Commodity Investing, 2007. The graph shows the annualised growth rate of the linking factor, which is how the authors measure roll yield. The linking factor is basically the ratio of the maturing contract divided by the next-month contract. The authors then annualise the growth rate of this factor, which is continuously updated as each maturing contract is rolled. For further explanation, please see the authors’ article.
Figure 4
Source of Graph: Rob Arnott, Research Affiliates Commodity Presentation, S&P Dow Jones Indices’ 8th Annual Commodities Seminar, London, September 11, 2014.
5

6
Can Roll Yield be a Useful Indicator During an Oil Market-Share Price-War?
Now, at this point, readers may be willing to concede the point that roll yield (or curve shape) is helpful over long holding periods for predicting returns. But is this information useful now when it appears that for the time being, OPEC Gulf producers have shaken off their traditional role of balancing the oil market? As described recently by Merrill Lynch researchers, Saudi Arabia and other Gulf oil producers had until recently acted as the central banker of the oil market and had essentially provided a free put to the marketplace in preventing a free fall in oil prices, even in the face of new oil production, particularly from the United States.
We can examine the question of the current relevance of roll yield in two ways. First, we can check if curve shape was a useful toggle during 1986 when Saudi Arabia and other Gulf producers apparently decided upon prioritising market share, whatever the cost. And secondly, we can examine whether using a curve toggle would have been helpful in 2014 for timing an oil investment.
1986 ScenarioAccording to calculations by Joseph Eagleeye of Premia Capital Management, by passively holding and rolling WTI futures contracts, one would have lost -25.5% in 1986. Correspondingly, during that time, if one only held WTI futures contracts and if the contract was backwardated at the close of the previous day, then the losses were significantly lower at -8.8%, again demonstrating the importance of curve shape as a signal. Each of these returns are “excess returns”; that is, they exclude the returns from collateral if one had chosen to fully collateralise a trading program in oil futures contracts.
Interestingly, from a portfolio construction standpoint, U.S. equity returns did fine in 1986 since declines in the price of crude oil can arguably be like a tax cut for the economy. The S&P returned +13.2% over T-bills during 1986. This provides evidence that to truly hedge a decline in oil prices, a curve toggle may not be sufficient: superior portfolio construction may also be necessary; that is, one may need to include in one’s portfolio, assets that have a tendency to do well when the oil markets are performing poorly. The source of data for the 1986 analyses was from CRB.
2014 Thus FarStarting in July 2014, the Brent futures market went into contango pretty much continuously through the middle-of-December 2014, as shown in Figure 5. If a trader had elected to only buy and roll Brent futures contracts when the contract was backwardated at the close of the previous day, then that trader’s returns would have been quite different from the returns of a passive investor in Brent contracts, as illustrated in Figure 6. Perhaps a structural holding in crude oil can only be justified if the contract is backwardated.
Figure 5
Source of Data: The Bloomberg.
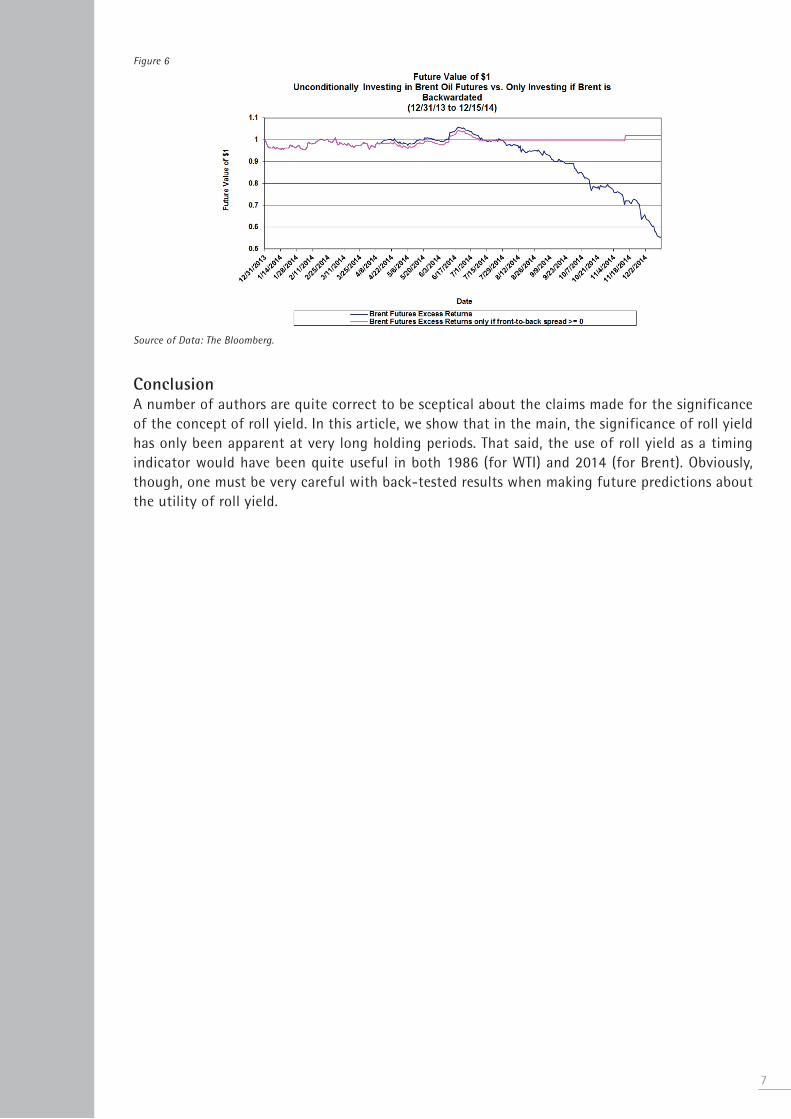
Figure 6
Source of Data: The Bloomberg.
ConclusionA number of authors are quite correct to be sceptical about the claims made for the significance of the concept of roll yield. In this article, we show that in the main, the significance of roll yield has only been apparent at very long holding periods. That said, the use of roll yield as a timing indicator would have been quite useful in both 1986 (for WTI) and 2014 (for Brent). Obviously, though, one must be very careful with back-tested results when making future predictions about the utility of roll yield.
7
EDHEC-Risk Institute393 promenade des AnglaisBP 3116 - 06202 Nice Cedex 3FranceTel: +33 (0)4 93 18 78 24
EDHEC Risk Institute—Europe 10 Fleet Place, LudgateLondon EC4M 7RBUnited KingdomTel: +44 207 871 6740
www.edhec-risk.com
EDHEC Risk Institute—Asia1 George Street#07-02Singapore 049145Tel: +65 6438 0030
EDHEC Risk Institute—France 16-18 rue du 4 septembre75002 Paris FranceTel: +33 (0)1 53 32 76 30
For more information, please contact: Carolyn Essid on +33 493 187 824 or by e-mail to: [email protected]
Founded in 1906, EDHEC Business School offers management education at undergraduate, graduate, post-graduate and executive levels. Holding the AACSB, AMBA and EQUIS accreditations and regularly ranked among Europe’s leading institutions, EDHEC Business School delivers degree courses to over 6,000 students from the world over and trains 5,500 professionals yearly through executive courses and research events. The School’s ‘Research for Business’ policy focuses on issues that correspond to genuine industry and community expectations.
Established in 2001, EDHEC-Risk Institute has become the premier academic centre for industry-relevant financial research. In partnership with large financial institutions, its team of ninety permanent professors, engineers, and support staff, and forty-eight research associates and affiliate professors, implements six research programmes and sixteen research chairs and strategic research
projects focusing on asset allocation and risk management. EDHEC-Risk Institute also has highly significant executive education activities for professionals.
In 2012, EDHEC-Risk Institute signed two strategic partnership agreements with the Operations Research and Financial Engineering department of Princeton University to set up a joint research programme in the area of risk and investment management, and with Yale School of Management to set up joint certified executive training courses in North America and Europe in the area of investment management.
In 2012, EDHEC-Risk Institute set up ERI Scientific Beta, which is an initiative that is aimed at transferring the results of its equity research to professionals in the form of smart beta indices.
Copyright © 2016 EDHEC-Risk Institute


