1 CRUDE, PALM OIL PRICES AND STOCK Presentation to POINTERs Malaysian Palm Oil Council, 13-19 February 2012, www.pointers.org.my Fatimah Mohamed Arshad and Amna Awad Abdeel Hameed Director and Research Fellow respectively at the Institute of Agricultural and Food Policy Studies, Universiti Putra Malaysia The Links and Implications
Transcript
1
CRUDE, PALM OIL PRICES AND STOCK
Presentation to POINTERsMalaysian Palm Oil Council, 13-19 February 2012, www.pointers.org.my
Fatimah Mohamed Arshad and Amna Awad Abdeel HameedDirector and Research Fellow respectively at the
Institute of Agricultural and Food Policy Studies, Universiti Putra Malaysia
The Links and Implications
2
The Issues & Questions
Methodology(Auto Regressive Distributed Lag or ADRL)
Findings & Implications for 2012
Contents
3
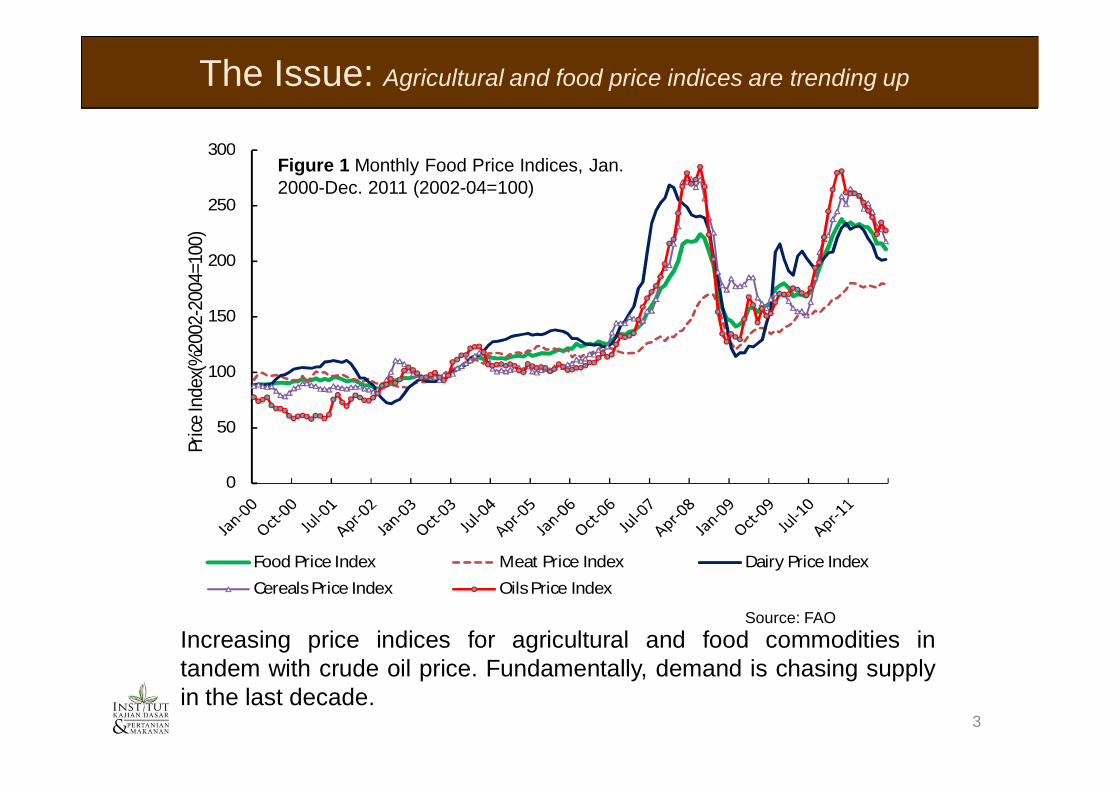
The Issue: Agricultural and food price indices are trending up
Increasing price indices for agricultural and food commodities intandem with crude oil price. Fundamentally, demand is chasing supplyin the last decade.
0
50
100
150
200
250
300
Price
Inde
x(%
2002
-200
4=10
0)
Food Price Index Meat Price Index Dairy Price Index
The Issue: Stock is a crucial indicator of market sentiment
Palm oil stock is a mirror of the supply demand imbalance. It isnegatively related to price.
Source: MPOB
0
1000
2000
3000
4000
5000
6000
7000
8000
0
200
400
600
800
1000
1200
1980
1981
1982
1983
1984
1985
1986
1987
1988
1989
1990
1991
1992
1993
1994
1995
1996
1997
1998
1999
2000
2001
2002
2003
2004
2005
2006
2007
2008
2009
2010
2011
Palm
Oil
Ope
ning
Sto
cks (
'000
Tonn
es)
Palm
Oil
Pric
es (U
SD/T
onne
)
Palm Oil Prices Palm Oil Stocks
Figure 2. Annual Movements in the Prices and Opening Stocks of Crude Palm Oil (1980-2011)
5
The Issue: Crude oil prices enter the market equations
High price of crude oil pushes the demand for biofuels and hence thefeedstocks e.g. rapeseed, palm oils and corn. Crude oil prices aremuch more correlated to these feedstocks compared to before.
“Increase in crude oil price and lowlevel of stocks appear instrumental inpushing up crude palm oil price”.
What is the nature of the links orrelationship between palm oil pricewith stock and crude oil price?
Based on this relationship, what arethe implications to the prospect in2012?
7
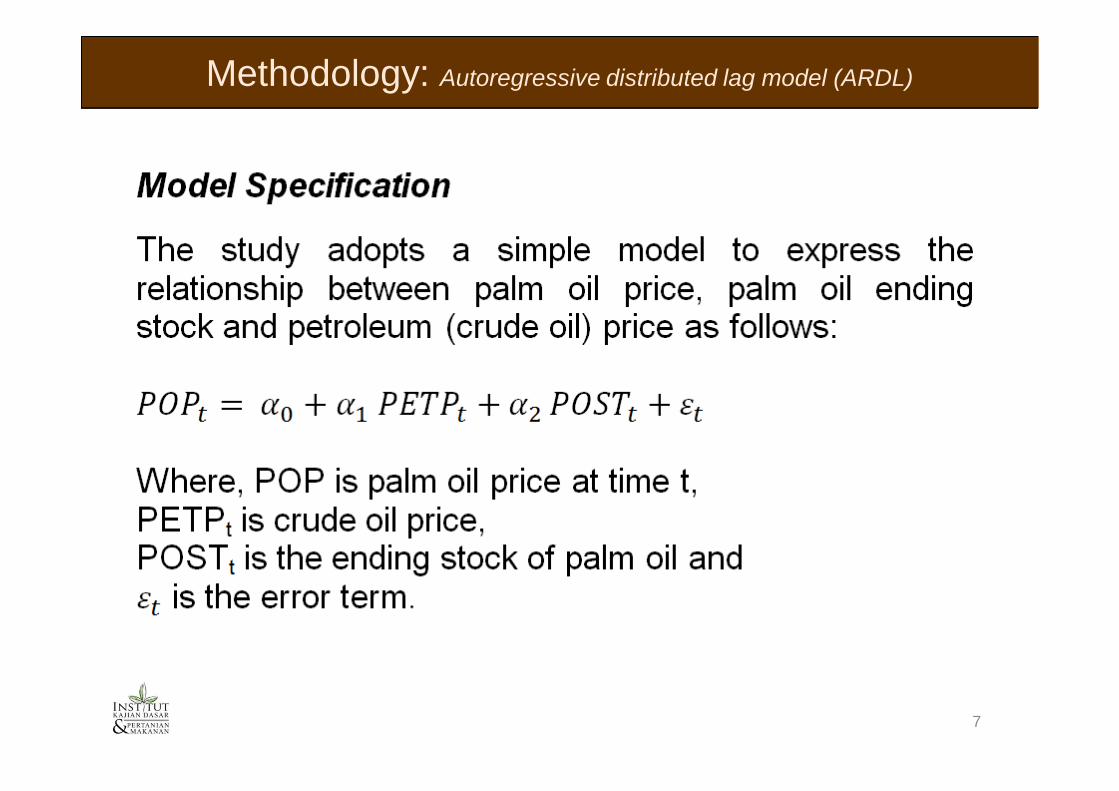
Methodology: Autoregressive distributed lag model (ARDL)
8
Methodology: ARDL developed by Pasaran et al. (2001)
Method of Model Estimation: Autoregressive Distributed Lag (ARDL) developed by Pesaran et al. (2001).
Forecasting Method•To project the changes in palm oil price we use the estimated elasticities of palm oil price with respect to crude oil price and palm oil stock level. • Assumed different growth rates ; low, moderate and high crude oil and stock level growth rates to the base month ( December 2011). •Projections have been made based on different scenarios with different sets of different growth rate combinations.
9
Data
Data Sources and Description The sample period chosen for this study extends
from January 2002 to December 2011.
The price of palm oil refers to FOB price in North West European ports (USD/T).
The world average crude petroleum prices represent petroleum prices (USD/T).
All price variables are nominal (in USD per ton) and they have been obtained from the International Financial Statistics (IFS) online service.
Palm Oil stock level obtained from the Malaysian Oil Palm Statistics.
10
Findings
• dlnPOST and dlnPETPare the short runelasticities of palm oilprice with respect topalm oil stock level andcrude oil price,respectively.
• Ect(-1) is the laggederror correction term
11
Findings
12
Simulations on 2012 Price: Assumptions on rate of growth
13
Simulations on 2012 Price Trends: Under nine scenarios
14
Conclusion
Thank you
All forecasts are invariably wrong but some give good cluesand hints.
The findings suggest that crude palm oil price both in the shortand long terms, is causally related to changes in stock andcrude oil price.
The crude palm oil price elasticities with respect of the twovariables are highly elastic in the long run which reflects highsensitivity of the price to these two determinants over time.
Hence, the movements of these two provide some indicationson the expected price level of the crude palm oil.
Important implication for palm oil market analysis is the needto consider crude oil (petroleum) price as an important variablein both the supply and demand equations in the years to come.