29
1 CRUISE SHIP TOURISM - A LCA ANALYSIS Morten Simonsen Western Norway Research Institution, January 2014

1
CRUISE SHIP TOURISM -
A LCA ANALYSIS
Morten Simonsen
Western Norway Research Institution,
January 2014

2
Content Introduction ................................................................................................................................. 4
Energy chain analysis..................................................................................................................... 4
Propulsion - direct energy chain .................................................................................................... 5
Energy use and emissions in port ............................................................................................... 6
Production of cruise ships - indirect energy chain.......................................................................... 11
Lightweight estimation ............................................................................................................ 11
Material distribution................................................................................................................ 15
Embedded energy and emissions ............................................................................................. 17
Fuel production........................................................................................................................... 22
Summary .................................................................................................................................... 24
Alternative fuels.......................................................................................................................... 24
Reducing ship's lightweight with composite materials ............................................................... 25
Alternative fuel: Biodiesel ........................................................................................................ 26
Appendix .................................................................................................................................... 27
References.................................................................................................................................. 29
Figure 1 Gallons per hour in port.................................................................................................... 7
Figure 2 Fuel consumption in litre pr passenger pr hour in port ....................................................... 8
Figure 3 Gross tonnes vs passenger pr gross tonnes ........................................................................ 9
Figure 4 Gross tonnes vs hotel load in kW pr passenger................................................................... 9
Figure 5 Gross tonnes vs energy use in litre pr passenger pr hour .................................................. 10
Figure 6 Emissions of NOx pr hour in port ..................................................................................... 11
Figure 7 Lightweight as proportion of gross tonnes by gross tonnes ............................................... 13
Figure 8 Gross tonnes pr passenger vs passenger capacity ............................................................. 14
Table 1 Energy consumption while in port .................................................................................... 10
Table 2 Energy consumption in port for total ship functions .......................................................... 10
Table 3 NOx emissions pr hour for different cruise ships................................................................ 11
Table 4 Lightweight calculations................................................................................................... 14
Table 5 Gross tonnes vs passenger capacity .................................................................................. 14
Table 6 Material distribution for superstructure Norwegian Gem................................................... 16
Table 7 Energy use factors for materials MJ pr kg .......................................................................... 19
Table 8 Emissions factors, emission of CO2-equivalents kg pr kg .................................................... 20
Table 9 Total energy embedded in materials................................................................................. 20
Table 10 Total emissions of CO2 embedded in materials ................................................................ 20
Table 11 Total energy used for building Norwegian Gem ............................................................... 21
Table 12 Total emissions of tonnes of CO2-equivalents .................................................................. 21
3
Table 13 Energy use and emissions of CO2-equivalents pr passenger-km for building Norwegian Gem
.................................................................................................................................................. 22
Table 14 Energy use in MJ pr passenger-km for propulsion and from building the ship .................... 24
Table 15 Emissions of CO2-equivalents for propulsion and from building the ship........................... 24
Table 16 Environmental impact for Norwegian Gem with added passenger capacity ....................... 26
Table 17 List of cruise ships used in lightweight calculations .......................................................... 27
Table 18 List of cruise ships in Skagway 2008 ................................................................................ 28
Equation 1 Fuel consumption pr km ............................................................................................... 6
Equation 2 Calculation of displacement weight ............................................................................. 12
Equation 3 Calculation of lightweight ........................................................................................... 12
Equation 4 Estimating block coefficient ........................................................................................ 13

4
Introduction In this paper we have used an analytical approach called triangulation 1. It can be separated into two
parts, method triangulation and data triangulation. The overall idea is to produce several estimates
for the same phenomenon or observandum, i.e. cruise ships' fuel consumption at sea or in port. If
several estimates for the same observandum agree to a reasonable degree we have more confidence
in all of them. If they disagree substantially we have reason to question the underlying assumptions
or calculations. This should lead to a more thorough inspection of each of them.
We can distinguish between method triangulation and data triangulation. In method triangulation we
employ different methods to arrive at different estimates of the same phenomenon. Two examples
from LCA analysis may be a top-down approach and a bottom-up approach. The first one tries to
arrive at estimates on a more detailed level from macro-data at aggregated levels. The second one
starts at a detailed level and try to aggregate estimates to higher levels. If different methods arrive at
estimates that are reasonable consistent, coherent and continuous the estimates will be considered
strengthened. By consistent we mean that estimates do not change when small variations in
assumptions or preconditions occur. When i.e. analyzing transport systems we must re quire that the
different systems have the same borders, that they are defined consistently. By coherent me mean
that phenomena that are related theoretically also fit together empirically and by continuous we
mean that estimates for the same phenomenon at different times do not differ substantially.
The two forms of triangulation are complementary. Method triangulation concerns the validity of the
analysis. Do our empirical definitions fit in with the theoretical ones and how generalizable are our
estimates to a larger context? Data triangulation concerns the measurement practice or reliability of
the estimates. Is there reason to believe that some calculation errors are present, i.e. when
converting from British Thermal Units to joule or from miles pr gallon to litre per km?
Triangulation also concerns verifiability of estimates. If several estimates are well documented it is
easier for other researchers to do the same calculations and check the results. Documentation
should include what method is used to arrive at the estimates as well as underlying assumptions for
calculations, i.e. specification of what fuel is assumed when analyzing fuel consumption as well as
what emission factor is applied for that specific fuel.
Energy chain analysis We will analyze the environmental impact of cruise ship tourism by estimating a cruise ship's energy
consumption and emissions of climate gases during its different life stages. Each of these stages can
be considered to be a energy chain. This implies that energy is consumed in different amounts for
different purposes at different life stages. The crucial point is that this energy must be produced
before it is consumed, and the production of energy also requires energy. Energy then is the basic
input at all stages and all emissions are related to the amount and type of energy consumed for a
specific purpose at a specific life stage.
We call the energy consumed for a specific purpose, i.e. propulsion of a cruise ship, for end energy.
The energy required for the production of this end energy, with their related emissions, should be an
integral part of the end energy estimate itself. This means that all end energy consumption should be
1 Triangulation (social science), http://en.wikipedia.org/wiki/Triangulation_(social_science)

5
considered to be the last part of a chain of intertwining energy consumption and production. At the
beginning of the chain is the energy source that is converted into some useful end energy carrier. The
extraction of the energy source, its conversion into useful energy, all these steps also requires energy
consumption and emissions. The energy applied in each of these steps is also a energy chain with its
specific conversion from energy source to energy carrier. Therefore, an estimate of a specific energy
consumption should mirror these web of energy chains leading up to it.
We will mainly use estimates obtained from a German LCA database called ProBas. The database
presents estimate for a specific energy carrier, i.e. diesel in Germany 2005, as an energy chain. Each
estimate consists of the direct energy available as well as the indirect energy consumed further down
the chain or upstream in order to produce the final end energy. The same is true for embedded
energy in i.e. materials like steel or aluminium. Energy estimates for production of these materials
includes indirect estimates of energy consumption further down the chain, i.e. to extract and
fabricate raw materials, as well as direct energy consumption in the final production of the material
in question.
Propulsion - direct energy chain According to Carnival Corporation, their cruise ships in 2008 used 0,1148 kg fuel pr ALB-km or
available lower berth km 2. An ALB-km is equivalent to two passengers pr km. We will consider ALB-
km and passenger-km to be identical terms.
Walnum 3 quotes an emission factor from Carnival publications of 3,117 kg CO2 pr kg fuel for heavy
fuel oil (HFO). Environment Canada uses an emission factor of 3,124 kg pr litre for heavy fuel oil 4.
Since its density is 0,98 kg/litre 5 this corresponds to 3,188 kg CO2 pr kg fuel. Cruise ships also use
marine diesel oil (MDO) and marine gasoline oil (MGO). According to Walnum, referring to
documentation from Carnival cruise company, use of MDO and MGO amounts to 4% of total fuel use.
We therefore discard these fuels in these calculations and concentrate on heavy fuel oil. Using
Walnum's emission factor pr kg fuel heavy fuel oil we get 357,8 gram CO2 per passenger-km.
In order to estimate the fuel consumption pr km for the cruise ship at sea we have to make
assumptions about number of passengers onboard the ship pr km. According to Walnum (2011), a
total of 78 cruise ships arrived in Bergen, Norway, from March to September 2010. They carried a
total of 291 887 passengers. On average, each ship therefore carried 3742 passengers. Using this
number, we can use Equation 1 to estimate fuel consumption in kg pr km. With the numbers above,
we get 429,6 kg or 438,4 litre pr km.
2 Walnum, H.J. (2011): Energy use and CO2 emissions from cruise ships - A discussion of methodological issues,
Western Norway Research Institution, Note 2/2011, page 5,http://www.vestforsk.no/filearchive/vf-notat-2-2011-cruise.pdf 3 ibid., Page 5
4 Table 4, http://www.ec.gc.ca/ges-ghg/default.asp?lang=En&n=AC2B7641-1
5 Toutain, J.E.W, Taarneby, G., Selvig, E.,Energiforbruk og utslipp til luft fra innenlandsk transport, Statistisk
Sentralbyrå, Rapport 2998/49, Table 2.1
http://www.ssb.no/a/publikasjoner/pdf/rapp_200849/rapp_200849.pdf
6
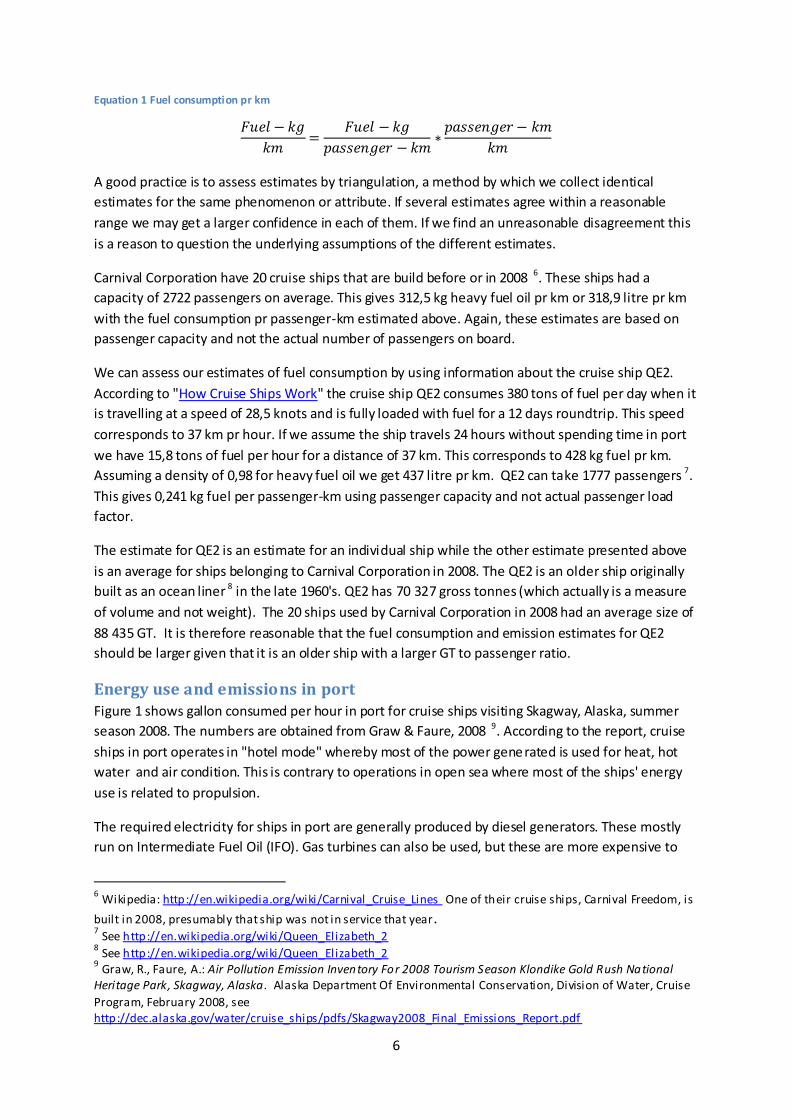
Equation 1 Fuel consumption pr km
A good practice is to assess estimates by triangulation, a method by which we collect identical
estimates for the same phenomenon or attribute. If several estimates agree within a reasonable
range we may get a larger confidence in each of them. If we find an unreasonable disagreement this
is a reason to question the underlying assumptions of the different estimates.
Carnival Corporation have 20 cruise ships that are build before or in 2008 6. These ships had a
capacity of 2722 passengers on average. This gives 312,5 kg heavy fuel oil pr km or 318,9 litre pr km
with the fuel consumption pr passenger-km estimated above. Again, these estimates are based on
passenger capacity and not the actual number of passengers on board.
We can assess our estimates of fuel consumption by using information about the cruise ship QE2.
According to "How Cruise Ships Work" the cruise ship QE2 consumes 380 tons of fuel per day when it
is travelling at a speed of 28,5 knots and is fully loaded with fuel for a 12 days roundtrip. This speed
corresponds to 37 km pr hour. If we assume the ship travels 24 hours without spending time in port
we have 15,8 tons of fuel per hour for a distance of 37 km. This corresponds to 428 kg fuel pr km.
Assuming a density of 0,98 for heavy fuel oil we get 437 litre pr km. QE2 can take 1777 passengers 7.
This gives 0,241 kg fuel per passenger-km using passenger capacity and not actual passenger load
factor.
The estimate for QE2 is an estimate for an individual ship while the other estimate presented above
is an average for ships belonging to Carnival Corporation in 2008. The QE2 is an older ship originally
built as an ocean liner 8 in the late 1960's. QE2 has 70 327 gross tonnes (which actually is a measure
of volume and not weight). The 20 ships used by Carnival Corporation in 2008 had an average size of
88 435 GT. It is therefore reasonable that the fuel consumption and emission estimates for QE2
should be larger given that it is an older ship with a larger GT to passenger ratio.
Energy use and emissions in port Figure 1 shows gallon consumed per hour in port for cruise ships visiting Skagway, Alaska, summer
season 2008. The numbers are obtained from Graw & Faure, 2008 9. According to the report, cruise
ships in port operates in "hotel mode" whereby most of the power generated is used for heat, hot
water and air condition. This is contrary to operations in open sea where most of the ships' energy
use is related to propulsion.
The required electricity for ships in port are generally produced by diesel generators. These mostly
run on Intermediate Fuel Oil (IFO). Gas turbines can also be used, but these are more expensive to
6 Wikipedia: http://en.wikipedia.org/wiki/Carnival_Cruise_Lines One of their cruise ships, Carnival Freedom, is
built in 2008, presumably that ship was not in service that year. 7 See http://en.wikipedia.org/wiki/Queen_Elizabeth_2
8 See http://en.wikipedia.org/wiki/Queen_Elizabeth_2
9 Graw, R., Faure, A.: Air Pollution Emission Inventory For 2008 Tourism Season Klondike Gold Rush National
Heritage Park, Skagway, Alaska. Alaska Department Of Environmental Conservation, Division of Water, Cruise
Program, February 2008, see http://dec.alaska.gov/water/cruise_ships/pdfs/Skagway2008_Final_Emissions_Report.pdf

7
operate. Auxilliary boilers are also used while ships are in port in order to generate steam and hot
water. The report registered the electricity needed to operate cruise ships in hotel mode while in
port. It also registered the amount of fuel in gallons consumed per hour while in port 10. The
electricity needed for hotel mode in one hour is not identical to number of gallons consumed during
the same time span. This is probably due to the fact that the ship needs electricity for more than the
hotel functions. Emergency systems must be avaliable, pumps, lifts, restaurants, shops and leisure
facilities need lightning in addition to hotel rooms and cooling must be available for the ships' food
storage.
Figure 1 Gallons per hour in port
Figure 1 shows that gallons consumed in port is. The figure indicates that fuel consumption is a
function of the ships' size measured in passenger capacity. All data are obtained from Graw & Faure,
except from some passenger capacities that are obtained from Wikipedia. The fitted regression line
suggests that an increase in capacity of 100 passengers would result in 32,3 more gallons per hour.
Still, there are marked differences between ships of about the same size. This indicates that
passanger capacity alone is not sufficient to explain the differences in fuel consumption.
Figure 2 shows litre pr passenger pr hour consumed while in port in Skagway, Alaska 11 as a function
of passenger capacity. The figure shows increasing deviations from the fitted regression line as
passenger capacity increases. This indicates again that number of passengers is a poor indicator of
fuel consumption in port. We also note that the bigger ships do not have less energy consumption pr
passenger than smaller ships measured by passenger capacity. Consequently, there is no economies
of scale for the bigger ships.
However, the figure shows som interesting differences between ships of roughly the same passenger
capacity. This is especially true for the ships "Radiance of the Seas" and "Diamond Princess", marked
with yellow in the figure. The first ship is powered by a gas turbine 12 while the last one is powered by
10
ibid., Figure 4. 11
Graw & Faure 12
http://en.wikipedia.org/wiki/MS_Radiance_of_the_Seas

8
conventional diesel generators. The proulsion system may be a detemining factor for fuel
consumption while in port.
Figure 2 Fuel consumption in litre pr passenger pr hour in port
There are also som striking differences between the ships "Diamond Princess" and "Golden Princess"
from the same company. According to the Skagway report, the first ship uses 2 diesel engines in port
while the second one uses one engine. Also, the hotel load for the first ship is 1 MW larger than the
second one even if the first ship's passenger capacity is only 80 passenger more than the second one.
If the two ships stay 12 hours in port, this means the first one is using 12 000 kWh more electricty for
the hotel load than the second one.
This discussion indicates two conclusions: Firstly, the ships' propulsion systems do matter for fuel
consumption while in port. Secondly, hotel design for individual ships should matter for the required
hotel electricity load while residing in port.
Passenger capacity may be a bad indicator of ships' size. It may be that bigger ships can fit more
passengers pr weight unit or pr volume unit. Then weight or volume should be a better indicator of
the ships' size than passenger capacity.
Cruise ships are often measured in gross tonnes. This measure is not a weight measurement contrary
to its name. It is rather a volume measurement since grosse tonnes are an indicator of the ships'
available storage capacity or "overall internal volume" 13 . Figure 3 shows the relationship between
ships gross tonnes and passenger per gross tonne. The registrations are for the ships docked in
Skagway, 2008. The figure shows that bigger ships do not accomodate more passenger pr volume
unit or pr gross tonne. Cruise ships with a gross tonnage of 75 000 have the same number of
passenger pr gross tonne as ships with up to 120 000 gross tonnes. One explanation for may be that
bigger ships have more and bigger shops, more leisure facilities and bigger cinemeas, theatres etc. So
the tendency for bigger ships to accomodate more passengers would be counter-balanced by a
tendency towards more and bigger facilities for the extra amount of passengers.
13
Wikipedia, Gross tonnage, http://en.wikipedia.org/wiki/Gross_tonnage

9
Figure 3 Gross tonnes vs passenger pr gross tonnes
Figure 4 Gross tonnes vs hotel load in kW pr passenger
Figure 4 shows that bigger ships measured by gross tonnes have a larger hotel load pr passenger
while docked in port. So even if we only look at hotel load in port, bigger ships use more energy pr
passenger than small ships. The advantage of bigger ships then is not economies of scale, an ability to
fit more passengers pr volume unit, but rather more attractions for the accomodated passengers.
How much energy does a cruise ship use while in port? If we look only at hotel load, Table 1 shows
the energy use for three hypotethical cruise ships in port. The calculations are based on the data
from Skagway 2008 with regression lines fitted in figures above. The table shows that the biggest
cruise ships consume about 130 000 kWh for a port stay of 12 hours.
Table 1 only show energy use for the hotel load. Ships also need energy use for other functions as
mentioned above such as emergency systems, lifts, lightning, dispensing gray and black water etc.

10
Table 1 Energy consumption while in port
A B C
Gross tonnes 75000 100000 120000
Load pr passenger 2,3 3,3 4,0
Passengers 2000 2500 2700
Load kW 4 594 8 167 10 915
Hours in port 12 12 12
Energy use kWh 55 129 98 002 130 977
Figure 5 Gross tonnes vs energy use in litre pr passenger pr hour
Table 2 Energy consumption in port for total ship functions
A B C Remark
Gross tonnes A 75000 100000 120000 Litres pr passenger pr hour B 0,83 1,06 1,26 From Figure 2
Passengers C 2000 2500 2700 Litres pr hour D=B*C 1 654 2 662 3 389 Hours in port E 12 12 12 Litres in port F=E*E 19 843 31 944 40 668
MJ pr litre HFO 14
G 39,8 39,8 39,8
kWh in port H=(F*G)/3,6
219 374 353 155 449 608
1 MJ=3,6 kWh
14 Toutain, J.E.W., Taarneby, G., Selvig, E.: Energiforbruk og utslipp til luft fra innenlandsk transport, SSB-
Rapport 2008/49, Oslo 2008, Table 2.1, Page 15, http://www.ssb.no/a/publikasjoner/pdf/rapp_200849/rapp_200849.pdf

11
Figure 5 shows energy use in litres pr passenger pr hour vs cruise ships' gross tonnes. This is
equivalent to Figure 2 except we use gross tonnes instead of passenger capacity as a measurement
of ships' size. Based on Figure 5 we can construct Table 2Table 1 which shows total energy use for all
cruise ships' functions while in port, not only for hotel functions. We use the same three hypothetical
cruise ships as in Table 1. All in all, the biggest ships use slightly more than 449 000 kWh for 12 hours
in port. The increase in energy use is about 320 000 kWh for 12 hours when we include all functions
for the biggest ships.
Figure 6 shows emissions of NOx in kg pr hour for cruise ships in Skagway, 2008, while in port. The
emissions are a function of the hotel load in MW. The figure shows the emissions relative to the
ships' size measured in gross tonnes.
Figure 6 Emissions of NOx pr hour in port
Table 3 shows emissions of NOx pr hour for our three hypothetical ships. Roughly, an increase in
gross tonnes of 10 000 yields an increase in NOx emissions of 17 kg pr hour.
Table 3 NOx emissions pr hour for different cruise ships
A B C
Gross tonnes 75 000 100 000 120 000
kg NOx pr hour 54,4 169,0 204,4
Production of cruise ships - indirect energy chain
Lightweight estimation In order to obtain an estimate of energy use and emissions related to production of cruise ships we
need to know the material composition of them. The first step towards this material analysis is to
obtain an estimate of cruise ships' own weight. In naval terminology, this is referred to as the ship's
lightweight 15. This is the weight of the ship without fuel in tanks, water in ballast tanks, passengers,
15
Foreship, Some Important Naval Architectural terms, see http://www.foreship.com/documents/fs -naterms.pdf
12
crew and their luggage load. These weight items make up the deadweight of the ship 16. Together,
the lightweight and the deadweight make up a ship's displacement weight. This section proposes a
method to estimate cruise ships' lightweight based on known attributes such as gross tonnes.
From different web sites we have obtained deadweight for some cruise ships. For the same ships we
have also obtained ship's length, breadth and draft. The last attribute is the height from the
waterline to the hull's keel. When the ship is fully loaded the waterline marks where the ship is
floating in the water. The ship's length is measured as length between perpendiculars. This is defined
as "the distance between rudder shaft and the point where the bow stem enters water at design
draft" 17. The breadth is measured as moulded breadth which is defined as "the vessel breadth
without the shell plating" 18.
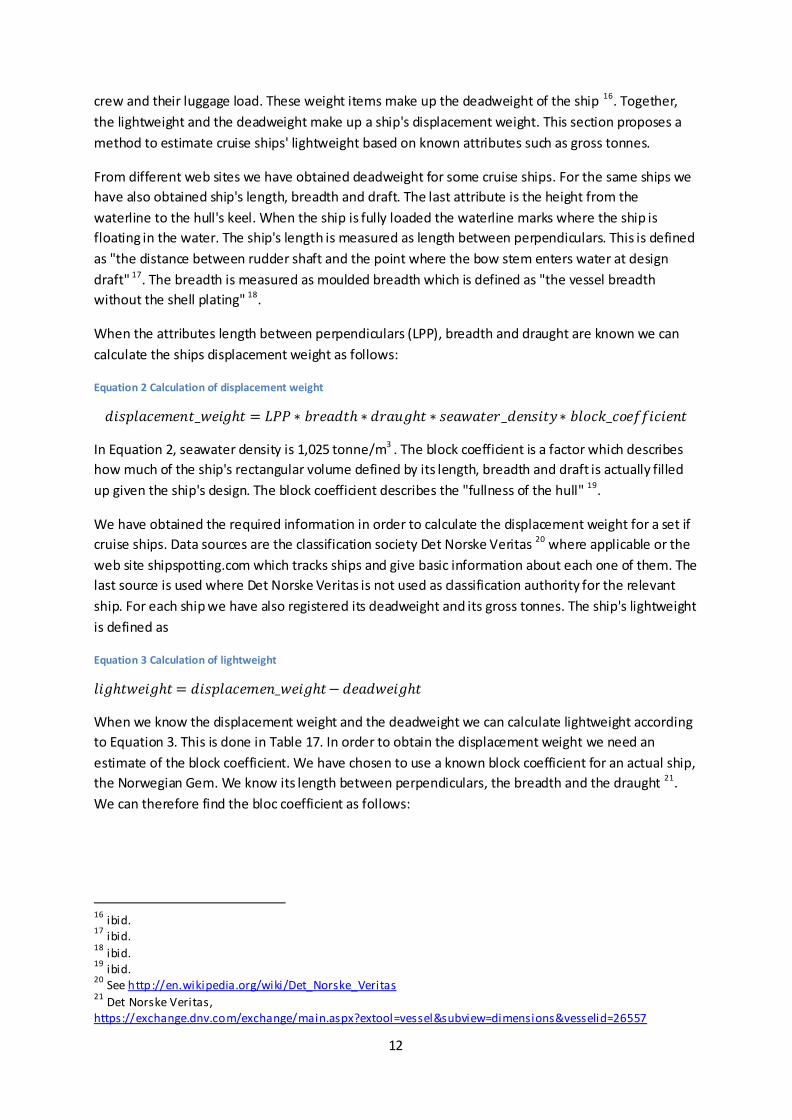
When the attributes length between perpendiculars (LPP), breadth and draught are known we can
calculate the ships displacement weight as follows:
Equation 2 Calculation of displacement weight
In Equation 2, seawater density is 1,025 tonne/m3 . The block coefficient is a factor which describes
how much of the ship's rectangular volume defined by its length, breadth and draft is actually filled
up given the ship's design. The block coefficient describes the "fullness of the hull" 19.
We have obtained the required information in order to calculate the displacement weight for a set if
cruise ships. Data sources are the classification society Det Norske Veritas 20 where applicable or the
web site shipspotting.com which tracks ships and give basic information about each one of them. The
last source is used where Det Norske Veritas is not used as classification authority for the relevant
ship. For each ship we have also registered its deadweight and its gross tonnes. The ship's lightweight
is defined as
Equation 3 Calculation of lightweight
When we know the displacement weight and the deadweight we can calculate lightweight according
to Equation 3. This is done in Table 17. In order to obtain the displacement weight we need an
estimate of the block coefficient. We have chosen to use a known block coefficient for an actual ship,
the Norwegian Gem. We know its length between perpendiculars, the breadth and the draught 21.
We can therefore find the bloc coefficient as follows:
16
ibid. 17
ibid. 18
ibid. 19
ibid. 20
See http://en.wikipedia.org/wiki/Det_Norske_Veritas 21
Det Norske Veritas, https://exchange.dnv.com/exchange/main.aspx?extool=vessel&subview=dimensions&vesselid=26557

13
Equation 4 Estimating block coefficient
We also know the deadweight 22 and the lightweight 23 for this ship. We can therefore calculate the
displacement weight and use it in the equation above to estimate the actual block coefficient used.
The estimated block coefficient for Norwegian Gem is 0,71 24 and we will use this block coefficient to
estimate the displacement weight for other cruise ships when we know their length between
perpendiculars, breadth and draught. This information is available from the classification company
Det Norske Veritas(if the ship is classified by this company) or from web sites like shipspotting.com or
vesselfinder.com. We have used average available ratio of length between perpendiculars to overall
length to find the former from the latter if the former is unknown.
It is of special interest to estimate the ratio of lightweight to gross tonnes since the last attribute is
easily obtained. From the ratio we can therefore estimate the ship's lightweight from its gross tonnes
without knowing the ship's length, breadth, draft or block coefficient. The gross tonne value is readily
available from many web sites since this is the attribute used to calculate ships' port dues 25.
Figure 7 Lightweight as proportion of gross tonnes by gross tonnes
Figure 7 shows lightweight as a proportion of gross tonnes versus gross tonnes for 51 cruise ships.
The lightweight is calculated for each ship according to Equation 3 above. We have fitted an inverse
regression line which captures the underlying trend, the proportion seems to decrease to a
threshold value as gross tonnage increases. This indicates that there is a lower absolute value for the
lightweight's proportion of total gross tonnes.
22
ibid. 23
Evegren, F., Hertzberg,T., Rahm, M.: LASS-C; Lightweight construction of a cruise vessel, SP-Report 2011:12,
Table 3-2, Page 15, http://s-lass.com/en/Documents/Rapporter/SPreport_2011_12[1]-Cruise%20vessel.pdf 24
See also Cruise Industry News, Quaterly Magazine Winter 2003-2004: “Smooth sailing is also ensured by QM2’s block coefficient which is 0.61 compared to 0.73 for most cruise ships. “
http://www.cruiseindustrynews.com/cruise-magazine/feature-magazine-articles/67-articles/15.html 25
Wikipedia, http://en.wikipedia.org/wiki/Gross_tonnage

14
Table 4 shows lightweight calculations for our three hypothetical cruise ships based on the fitted
regression line in Figure 7.
Table 4 Lightweight calculations
A B C
Gross tonnes 75 000 100 000 120 000
Factor 0,50 0,47 0,46
Lightweight 37 446 47 239 55 073
Figure 8 Gross tonnes pr passenger vs passenger capacity
Figure 8 shows passenger pr gross tonnes vs passenger capacity. Gross tonnage is really a
measurement of the ships' internal volume. The figure shows that the smallest ships have the biggest
volume pr passenger. Another way to put it is that bigger ships have better utilization of their
internal volume than smaller ships. The figure also shows that the effect of better utilization is
strongest when passenger capacity is increased from 1000 to 2000. After that the effect is
diminishing. There is a tendency for the two biggest cruise ships (Allure of the Seas and Oasis of the
Seas, two overlapping points marked with yellow) to increase their gross tonnage pr passenger
compared to the ships that comes next measured by gross tonnage. This may indicate that these
cruise ships have more volume for shops, restaurants and entertainment facilities pr passenger then
cruise ships with the second largest gross tonnes.
Table 5 Gross tonnes vs passenger capacity
A B C
Passenger capacity 1000 2000 3000
Gross pr pass 51,2 39,8 36,1
Gross tonnes 51 196 79 689 108 182
Factor 0,55 0,49 0,47
Lightweight 28 122 39 283 50 444

15
Table 5 shows three hypothetical ships with three different passenger capacities and their calculated
gross tonnes according to the regression line shown in Figure 8. The table shows that an increase
from 1000 to 2000 passenger capacity will decrease gross tonnage pr passenger with 11 gross tonnes
while a similar increase from 2000 to 3000 passengers implies a similar decrease of 4 gross tonnes.
As already mentioned, the increase in utilization of gross tonnes is greatest when the passenger
capacity is smallest. The table also shows that for every increase in passenger capacity of a thousand
passengers the gross tonnage increases with the same amount, roughly 28 500 tonnes.
We have also included an estimation of the lightweight factor and the lightweight itself for ships in
Table 5. The estimates are produced by using the regression coefficients from Figure 7.
Material distribution We have now established a method to estimate cruise ships' lightweight based on either gross
tonnes or indirectly through passenger capacity. In order to arrive at an estimate for energy use and
emissions related to production of cruise ships we need estimates of the material distribution of
cruise ships.
We will build an estimate of material distribution based on two reports related to the S-LÄSS project
which is a project initiated by the Swedish network of Lightweight constructions at sea 26. One of the
projects is an LCA analysis 27 of use of light weight composite material in a cruise ship's
superstructure. This is the part of the ship that is above the waterline. The hull is the part below the
waterline. The LCA-analysis is based on the cruise ship Norwegian Gem.
The other project is an analysis of using fibre-reinforced polymers, also a composite material, in the
superstructure of the same ship, Norwegian Gem 28. Both projects analyze the use of lightweight
composite materials in the superstructure above deck 11.
The Norwegian Gem has a gross tonnage of 93 530 and a deadweight of 10 000 tonnes 29 . Length
between perpendiculars is 263,5 meter, breadth is 32,2 meter and its draught is 8,625 meter 30.
According to Hou, the passenger capacity is 2 394 in cabins with double occupancy and the crew
amounts to 1 101 persons 31. According to Evegren et al., the ship has 15 decks 32 and the
lightweight of the ship is 43 150 tonnes 33.
The decks above deck 11 have a total weight of 5 200 tonnes. Of this, 2 050 tonnes are for steel
structures and 310 tonnes for aluminium structures. The outfitting of these decks amounts to 2 840
tonnes, of this 1 090 tonnes are for public spaces inside, such as restaurants, pools, library, fitness
26
http://s-lass.com/en/about/Sidor/default.aspx 27
Hou, Q.: Life-Cycle Assessment of Cruising Ship Superstructure, Master Thesis in Sustainable Development,
Uppsala University, Sweden, May 2011, http://uu.diva-portal.org/smash/get/diva2:451090/FULLTEXT01 28
Evegren, F., Hertzberg, T., Rahm, M.: LASS-C; Lightweight Construction Of A Cruise Vessel, SP-Report 2011:12, Technical Research Institute of Sweden, 2011, http://s-lass.com/en/Documents/Rapporter/SPreport_2011_12[1]-Cruise%20vessel.pdf 29
Det Norske Veritas, https://exchange.dnv.com/Exchange/Main.aspx?EXTool=Vessel&VesselID=26557 30
ibid. 31
Hou, page 17. 32
Evegren et al., page 4. 33
ibid., Table 3-2, page 15.

16
centre, tennis court etc. This weight is not split on materials, but presumably the materi als are wood
for doors and roofs, mineral wool for insulation, glass etc.
According to Evegren et al. the total glass weight for the front part of decks 13-15 is 23,8 kg. The
authors claim that 5,3 kg of glass can be saved by using laminated glass. This saving makes up 22,3%
of the original glass weight. Further, the authors claim that if the same weight saving procedure
would be applied to all glass on decks above deck 11 the total saving would be 19 tonnes 34.
Assuming that the weight saving amounts to the same proportion of total glass weight we arrive at
an estimate of 85,3 tonnes of glass for decks above deck 11. The total savings for all decks at the ship
if laminated glass would substitute for ordinary glass would be 41 tonnes, this gives an estimate of
184 tonnes of glass for all decks at the whole ship.
Hou 35 claims that there are 50 tonnes of mineral wool on the decks above deck 11 on Norwegian
Gem. This figure is estimated by using SimaPro database.
The ESAB Welding and Cutting Journal claims that the steel hull of the cruise ship Oasis of the Seas
weighs 45 000 tonnes 36. The cruise ship is the world's largest with a length between perpendiculars
of 329,887 meter, a breadth of 47 meter and a draught of 9,3 meter. Combined with the density of
salt water (1,025 kg for each litre of sea water) and a block coefficient of 0,71 this gives a
displacement weight of 104 726 tonnes. Its deadweight is 15 000 tonnes which yields a lightweight
(ship's own weight) of about 89 700 tonnes. The ship's steel hull weight therefore amounts to almost
exactly 50% of the ship's total weight. This again means that the superstructure also weighs 45 000
tonnes.
There are obvious problems with using the material distribution for the decks above deck 11 as
representative for the whole superstructure of Norwegian Gem. The main objection is that the lower
decks have more passenger cabins while the upper decks have more public spaces such as
restaurants, bars, tennis courts, library etc. This will obviously have an impact on the material
distribution. Still, we do not have a more representative material distribution for the lower decks.
Using this distribution, Table 6 presents an estimate for the material distribution for Norwegian Gem.
The distribution is split on hull and superstructure. As can be seen from the table, we can account for
about half of the superstructure weight and all of the hull's weight.
Table 6 Material distribution for superstructure Norwegian Gem
Lightweight tonnes, actual value 43 150
Steel hull weight in tonnes, estimate 21 641
Superstructure weight in tonnes, estimate 21 509
Superstructure steel structure weight tonnes, estimate 8 480
Superstructure aluminium structure weight tonnes, estimate 1 282
Glass weight tonnes, estimate 353
Mineral wool tonnes, estimate 207
Materials accounted for superstructure, estimate 10 322
34
ibid., page 11 35
Hou, page 32. 36
Svetsaren, ESAB Welding and Cutting Journal Vol. 65, NO. 1, 2010, page 26:"The steel plate weight of the hull is around 45,000 tons." http://www.esab.com/global/en/news/upload/svetsaren-1_2010.pdf

17
Embedded energy and emissions How much energy is embedded in the materials used to build a cruise ship? We will use energy use
factors and emissions factor for different materials to provide an estimate for total energy use and
total emissions of climate gases for building a cruise ship. We will use the cruise ship Norwegian Gem
as our reference ship.
The energy use and emission factors are discussed in Simonsen 37, 38. They are taken from the
German online LCA-database ProBas 39, but for each factor chosen several alternative estimates have
been considered. This process of triangulation, collecting several estimates for the same process and
reviewing them against each other, is the underlying method applied in the selection of the factors.
By applying a mutual examination of estimates, strength and weaknesses for each of them are more
readily uncovered.
The estimates include process energy and related emissions from raw material excavation and
fabrication, transport to production plant and processing at plant. The estimates therefore contain
all embedded energy and related emissions in the final product 40.
ProBas has estimates for 2005 and 2010. Since the building of Norwegian Gem started in 2006 we
have used factors from 2005 since these are at least as old as the ship. Since Norwegian Gem was
built at Meyer Werft in Papenburg, Germany, we use estimates for production of materials in
Germany with German electricity mix. Since Germany import materials we have used estimates for
mixed production where available 41.
For steel, we have used an estimate for hot rolled steel. This estimate is used both for hull and for
superstructure. We have assumed that cold rolled steel plates are too thin to be used in a cruise ship.
Hot rolled steel plates are in any case made from hot rolled ones 42. For glass, we have used an
estimate that does not use any recycling of glass. For steel, it is assumed that about a third of the raw
materials needed comes from the EAF 43 production method where some 97% of the input comes
37
Simonsen, M.: Metal Production, Vestlandsforsking April 2009, http://vfp1.vestforsk.no/sip/EnergiTransport/pdf/Felles/MetalProduction.pdf 38
Simonsen, M.: Energibruksfaktorer og utslippsfaktorer for ulike metaller , Vestlandsforsking June 2009, http://vfp1.vestforsk.no/sip/EnergiTransport/pdf/Felles/EnergibruksfaktorerOgUtslippsfaktorer.pdf 39
ProBas is a cooperation project between the Federal Agency for Environment and Ôko-Institut, a research institute in Freiburg, Germany, see http://www.probas.umweltbundesamt.de/php/index.php 40
From ProBas documentation: “Bei Ökobilanzen für Produkte – zum Beispiel für Getränkeverpackungen – wird der gesamte Lebensweg des Produktes betrachtet. Von der Wiege bis zur Bahre - also von der Herstellung
über die Nutzung bis zur Entsorgung des Produktes - werden die Umweltauswirkungen erfasst. Dabei werden nicht nur die Umweltauswirkungen des eigentlichen Herstellungsprozesses berücksichtigt, sondern auch die Herstellung der Vorprodukte, teilweise sogar der Hilfs - und Betriebsstoffe, der Energieerzeugung sowie die
Förderung und Bereitstellung der Rohstoffe. Einbezogen werden auch alle Transporte.” http://www.probas.umweltbundesamt.de/download/uba_bewertungsmethode.pdf 41
For i.e. aluminium: "Es geht hervor, daß im Jahr 1994 die Primäraluminiumproduktion der Bundesrepublik (ca. 0,5 Mio t) nur ein Drittel des inländischen Verbrauchs (ca. 1,5 Mio t) abdeckte. Die Statistik zeigt ferner,
daß die Direktimporte der BRD von Primäraluminium auf mehrere Dutzend Länder verteilt sind". http://www.probas.umweltbundesamt.de/php/themen.php?&prozessid={4D141B2B-80FB-4324-BCC8-EFA0D3F8F406}&id=9915334656&step=4&search=&show_comment=1 42
http://www.cargohandbook.com/index.php/Steel_sheet_in_coils 43
Electric arc furnace

18
from smelting of scrap iron. This means that for any kg produced steel in Germany in 2005, about
195 g came from recycled steel 44.
For aluminium, we have produced a weighted estimate composed from two ProBas estimates. The
first estimate is from production of primary aluminium 45 in Germany 2005 which is given a weight of
0,68. The second estimate 46 is for aluminium produced from old scrap aluminium which is given a
weight of 0,32. The weights represent world average percentages of production of primary and
recycled aluminium in 2007 47. Norsk Hydro assumes that the 20-25% of the demand for aluminium
can be supplied by recycled aluminium 48.
The energy consumption and emissions related to glass production is obtained from ProBas 49. The
glass production is based on the float production process. No recycling of glass is included in the
estimate 50. The estimate for rock wool is also obtained from ProBas 51. This estimate includes use of
material waste from the production and recycled material 52. The estimate fits well with another
LCA-study of production of rock wool 53.
PVC is used both in cabin doors 54 and in toilets 55. According to product details, we cannot say exact
how much of the materials for doors and toilets are PVC. In doors the material is used as door leaf
with a rock wool core and steel frames. In toilets PVC is used in pipes and covers. We have assumed
that 50% of the weight for doors and toilets are made up of PVC. We acknowledge that this is a
guess, but it's the best we can do given that we know PVC is widely used as a material but we do not
know exact how much of it is used where. Rockwool accounts for much of the volume in i.e. doors,
though this material does not weigh much. We therefore consider 50% weight proportion for PVC to
be a conservative estimate.
44
Simonsen, M.: Metal production, http://vfp1.vestforsk.no/sip/EnergiTransport/pdf/Felles/MetalProduction.pdf , page 7 45
MetallAluminium-Import-mix-DE-2005 46
MetallAluminium-DE-sekundär-2005 47
International luminium Institue, Global Aluminium Recycling, London 2009, page 8-9: "Refiners and remelters play vital roles for the downstream industry; in 2007 they produced close to 18 million tonnes of
recycled aluminium from old and traded new scrap including ingots for casting, rolling and extrusion and pellets for the deoxidation of s teel. This compares with in excess of 38 million tonnes of primary aluminium produced in the same year." http://www.world-aluminium.org/media/filer_public/2013/01/15/fl0000181.pdf 48
http://www.hydro.com/en/About-aluminium/Aluminium-life-cycle/Recycling/ 49
ProBas - Details: Steine-ErdenGlas-flach-DE-2005 50
"Die Rohstoffzusammensetzung beim Flachglas muß sehr genau und konstant sein, da das Verfahren gegen Abweichungen sehr empfindlich ist. Dadurch kann auch kein Recycling-Glas eingesetzt werden. Lediglich ein geringer Anteil des im Werk anfallenden Glasbruches und der Reststoffe kann wieder in den Prozeß
eingebracht werden." , ibid. 51
In German mineral wool is Steinwolle, Steine-ErdenSteinwolle-DE-200 52 "Neben den Primärrohstoffen werden auch Mineralien über Recyclingmaterial eingebracht. Dabei handelt
es sich sowohl um interne Abfälle aus der Zerfaserung als auch um div. Wollabfälle von Baustellen und produktionsinterne Stäube. Diese werden zusammen mi t Zusatzsteinen (Felsbrocken/Kies) in Zement eingebunden als Briketts in den Prozeß eingebracht", ibid. 53
Flury, K., Frischknecht, R.: Life Cycle Assessment of Rock Wool Insulation, ESU-Services, June 2012,
http://www.esu-services.ch/fileadmin/download/Rockwool_v2.2_2012.pdf 54
Navaliber, http://www.navaliber.com/dl/FichaNavaliberPT.pdf 55
Technical data, http://www.evac.com/sites/default/files/attachments/00_Inshine_910_toilets.pdf .
According to CruiseCritic.co.uk the toilet Evac 900 is used on Royal Caribbeans' Independenc e of The Seas. We have used the product description for Evac 910, see http://www.cruisecritic.co.uk/articles.cfm?ID=405
19
We have used the product description for the door Navaliber 2NB-15 hinged door 56 . It is 1900 mm
high and 750 mm wide. It weighs 40 kg pr m2. With 1,425 m2 we get a total weight of 57 kg.
According to the Meyer Werft, there are 4500 doors on a typical cruise ship 57 . If each door weighs
57 kg we get a total of 256,5 tonnes of material for doors. Assuming 50% of this is PVC we get 128
tonnes of PVC for doors.
EVAC-toilets are used in the Royal Caribbean's cruise ship Independence of the Seas 58. The toilet
weight for an EVAC 9210 toilet is given as roughly 24 kg (net weight) 59. Norwegian Gem has 1197
cabins. With one toilet in each cabin we get 28,7 tonnes for all toilets. Again assuming 50% of this is
PVC we get 14,4 tonnes of PVC for toilets. Adding PVC in doors and toilets together we get a total of
142,4 tonnes of PVC. We have used the PVC estimate based on the suspension
polymerisation process.
With these assumptions, we can account for 10 464 tonnes of Norwegian Gem's superstructure
weight. This is almost 49% of the total superstructure weight.
None of the materials analysed here have relevant co-products that should be considered in the
production process. Some iron is produced as a by-product during production of mineral wool, but
the amount of it is so insignificant that it is not further considered in this analysis 60.
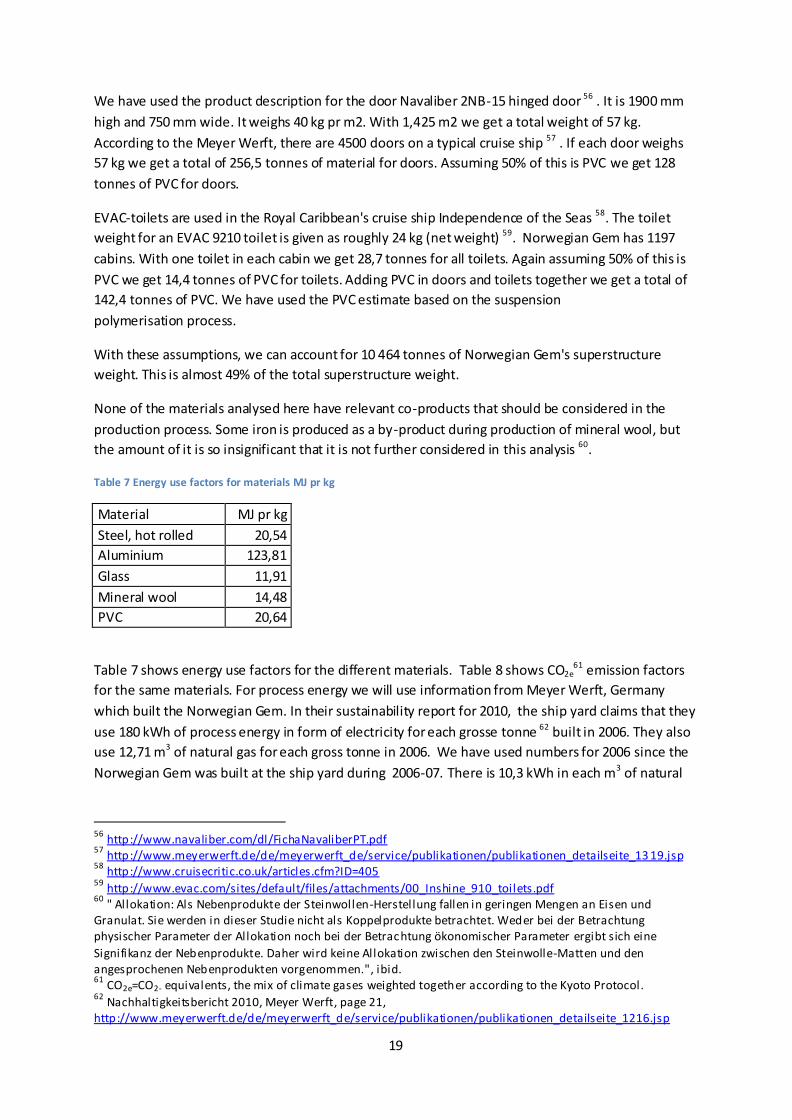
Table 7 Energy use factors for materials MJ pr kg
Material MJ pr kg
Steel, hot rolled 20,54
Aluminium 123,81
Glass 11,91
Mineral wool 14,48
PVC 20,64
Table 7 shows energy use factors for the different materials. Table 8 shows CO2e61 emission factors
for the same materials. For process energy we will use information from Meyer Werft, Germany
which built the Norwegian Gem. In their sustainability report for 2010, the ship yard claims that they
use 180 kWh of process energy in form of electricity for each grosse tonne 62 built in 2006. They also
use 12,71 m3 of natural gas for each gross tonne in 2006. We have used numbers for 2006 since the
Norwegian Gem was built at the ship yard during 2006-07. There is 10,3 kWh in each m3 of natural
56
http://www.navaliber.com/dl/FichaNavaliberPT.pdf 57
http://www.meyerwerft.de/de/meyerwerft_de/service/publikationen/publikationen_detailseite_13 19.jsp 58
http://www.cruisecritic.co.uk/articles.cfm?ID=405 59
http://www.evac.com/sites/default/files/attachments/00_Inshine_910_toilets.pdf 60
" Allokation: Als Nebenprodukte der Steinwollen-Herstellung fallen in geringen Mengen an Eisen und Granulat. Sie werden in dieser Studie nicht als Koppelprodukte betrachtet. Weder bei der Betrachtung physischer Parameter der Allokation noch bei der Betrachtung ökonomischer Parameter ergibt sich eine
Signifikanz der Nebenprodukte. Daher wird keine Allokation zwischen den Steinwolle-Matten und den angesprochenen Nebenprodukten vorgenommen.", ibid. 61
CO2e=CO2- equivalents, the mix of climate gases weighted together according to the Kyoto Protocol. 62
Nachhaltigkeitsbericht 2010, Meyer Werft, page 21, http://www.meyerwerft.de/de/meyerwerft_de/service/publikationen/publikationen_detailseite_1216.jsp

20
gas 63. Consequently, the ship yard used 130,9 kWh of natural gas for each gross tonnes built. This
gives a total of 311 kWh pr gross tonnes in process energy. With 93 500 gross tonnes it requires 104
653,3 GWh of process energy to build Norwegian Gem.
Table 8 Emissions factors, emission of CO2-equivalents kg pr kg
Material kg pr kg
Steel 1,54
Aluminium 13,27
Glass 1,12
Mineral wool 1,05
PVC 2,17
Table 9 Total energy embedded in materials
GWh Steel 171,87
Aluminium 44,10 Glass 1,17
Mineral wool 0,83 PVC 0,818
Sum 218,79
There are different CO2 emission factors for electricity and natural gas. We have used an estimate
from Probas for German electricity mix in 2005 with an emission factor of 0,167 kg CO2 for each MJ
(0,05 kg CO2/kWh) consumed 64. For natural gas, we have used an estimate for a small gas-driven
thermal power station. We therefore assume that most of the gas is used for heating buildings at the
ship yard. The emission factor for natural gas used in a thermal power plant is 0,13 kg CO2 pr MJ
(0,04 kg CO2/kWh). Since Norwegian Gem has 93 500 gross tonnes, total emissions of CO2 from use
of process energy are 780,4 tonnes for electricity and 445 tonnes for natural gas or 1225,4 tonnes
together.
Table 10 Total emissions of CO2 embedded in materials
Steel 46 385,5
Aluminium 17 013,0
Glass 395,5
Mineral wool 217,2
PVC 309,5
Sum 64 320,6
63
http://www.guenstiger-tarif.de/gas_umrechnung.html 64
ProBas - Details: El-KW-Park-DE-2005

21
Table 9 shows total energy embedded in materials. Table 10 shows total emissions of tonnes CO2
embedded in materials. Both tables are produced by using the energy use factor and the emissions
factors for each material and then multiply with the total amount of that material used in building
the Norwegian Gem. All in all, about 219 GWh is embedded in materials with a total emission of a
little over 64 000 tonnes of CO2-equivalents.
Table 11 Total energy used for building Norwegian Gem
Source GWh
Embedded energy 218,79
Process Energy 29,07
Sum 247,9
Energy pr tonne lightweight # 0,0057 # Based on Norwegian Gem
Table 12 Total emissions of tonnes of CO2-equivalents
Source tonnes of CO2-
equivalents
Embedded in materials 64320,6
Process energy 1225,4
Sum 65546,0
Emissions pr tonne lightweight # 1,5 # Based on Norwegian Gem
Table 11 shows total energy used for building Norwegian Gem. All in all, 247 GWh is required both
for extracting, producing and transporting materials as well as energy used to process the materials
at the ship yard. Energy embedded in materials accounts for 88% of total energy use. Table 12 shows
the total emissions of tonnes of CO2-equivalents for building the ship. The biggest contribution
comes from extracting and producing materials which accounts for over 98% of total emissions.
In order to arrive at an estimate for energy and emissions from building the ship Norwegian Gem per
passenger-km we need an assumption about the ship's load factor. According to Walnum, ships from
Carnival had an occupancy rate of 105,7% in 2008 65. Since a cabin can accommodate more than 2
passengers an occupancy rate of more than 100% is possible. The same occupancy rate for ships
from Royal Caribbean Cruise Lines was 104,5% that same year. We do not know the exact occupancy
rate for Norwegian ships, we therefore take the average of the two occupancy rates quoted. This
gives an occupancy rate of 105,1%.
Further, we need an estimate of daily sailing distance. According to Hou, the Norwegian Gem has a
cruising peed of 66 25 knots or 46,3 km per hour. According to the same study, the ship spends 77%
of its total trip time cruising in open sea. The rest is spent in port. This translates to a total of 270
65
Walnum, H.J.: Energy use and CO2-emissions from cruise ships . Vestlandsforsking-note, 2/2011, page 4-5 http://www.vestforsk.no/filearchive/vf-notat-2-2011-cruise.pdf 66
Hou, Q.: Life Cycle Assessment of Cruising Ship Superstructure, page 16, http://uu.diva-portal.org/smash/get/diva2:451090/FULLTEXT01

22
days per year cruising, excluding time in port 67. The assumed lifetime of the ship is 25 years 68. This
gives a total of 754 888 586 passenger kilometres per year and a total of 18 872 214 656 passenger
kilometres over the the assumed lifetime.
Table 13 Energy use and emissions of CO2-equivalents pr passenger-km for building Norwegian Gem
Passenger capacity, number of A 2 394
ALB Occupancy rate,% B 105,1
Average cruising speed, km/hour C 46,3
Days of year in operation, excluding time in port D 270
Hours pr day cruising at sea, excluding time in port E 24
Passenger-km pr year F=A*B*C*D*E 754 888 586
Lifetime, years G 25
Passenger-km lifetime H=F*G 18 872 214 656
Total energy use for building the ship, GWh I 248
Total emissions of CO2-equiv. for building the ship, tonnes J 65546,0
kWh pr passenger-km, energy for production of ship K=(I*106)/H 0,0131
MJ pr passenger -km L=K*3,6 0,047
kg CO2-equivalents pr passenger-km for production of ship M=(J*103)/H 0,0035
Table 13 shows energy use in kWh and emissions of kg CO2-equivalents pr passenger kilometre
related to building Norwegian Gem. In total, the energy use is 0,047 MJ pr passenger kilometre while
the emissions are 0,0035 kg CO2-equivalents pr passenger kilometre.
Based on energy use and emissions of CO2-equivalents pr tonne lightweight for Norwegian Gem we
can produce an estimate both for energy required for production and their related emissions of CO2-
equivalents for each ship used in the regression analysis above. These calculations are shown in the
appendix.
Fuel production This section will address the following questions: How much energy does it require to produce diesel
for cruise ships' electricity generators? And how large are the emissions from this added energy
consumption required for propulsion?
So far we have analyzed the energy requirements and the implied emissions from building the ship.
This section will analyse the corresponding energy use and emissions related to produce the cruise
ship's fuel. The ship in question is the Norwegian Gem.
ProBas has an estimate for production of 1 TJ of electricity from a thermal power plant fuelled with
heavy fuel oil 69. The power plant has a NOx catalyst and there is no allocation for heat produced in
the same process. The estimate is therefore a gross estimate for the power produced.
67
ibid., page 34. 68
ibid., page21. 69
Details: Öl-schwer-BHKW-gross-SCR-DE-2005/brutto (Endenergie)

23
This estimate includes the energy consumed all along the production chain for this electricity. In
other words, it includes the indirect energy required to produce the heavy fuel oil fuel as well as the
direct energy used to generate electricity.
All in all, it takes 1,14 TJ of energy to produce 1 TJ of electricity with a generator fuelled by heavy fuel
oil. This means that the energy efficiency is 88%, the rest of the energy content in the fuel is lost as
heat during electricity production. The loss multiplier of 1,13 covers energy used for extraction of oil,
transport to refineries, processing oil to heavy fuel oil at refinery and distributing the final product.
In comparison, it takes 3,5 TJ of energy to produce 1 TJ of energy with a generator running on diesel.
Diesel has a higher energy content pr kg than heavy fuel oil but the energy required to produce the
fuel is much higher compared pr produced energy unit.
According to Walnum (2011) 70 the fuel consumption for Carnival ships in 2008 was 0,1148 kg pr ALB-
km 71. We will use ALB-km as equivalent with passenger-km. It must be emphasized that this is based
on passenger capacity and not actual load factor. This load factor may be lower or higher than 100%
since some cabins can accommodate more than two passengers. We don't know the actual load
factor and use passenger-capacity as a proxy for number of passengers pr km. We also consider the
energy use pr passenger-km for Carnival ships to be valid for the cruise ship Norwegian Gem.
According to the Central Bureau of Statistics, Norway, heavy fuel oil has an energy content of 40,6 MJ
pr kg 72 with a density of 0,98 kg/litre. This gives 4,7 MJ pr passenger-km. We will call this net direct
propulsion energy. Using a car analogy we can call this energy Tank-to-Wheel.
With a loss multiplier of 1,14, we find that the total energy use for propulsion is 5,3 MJ pr passenger-
km when we take energy required to produce heavy fuel oil into consideration. We will call this gross
direct propulsion energy. Using the same car analogy we can call this Well-to-Tank energy. The
energy required to produce net direct propulsion energy is then 0,6 MJ pr passenger-km for
Norwegian Gem.
The ProBas estimate uses an emission factor of 3,197 gram CO2-equivalents pr litre heavy fuel oil 73.
For comparison, according to Environment Canada, a website run by the Government of Canada 74,
heavy fuel oil has an emission factor of 3,124 gram CO2 pr litre when used to generate electricity.
This factor only comprises emissions of CO2, not CO2-equivalents. Most of the emissions from
combusting heavy fuel oil comes from CO2, according to Environment Canada the emissions of
methane (CH4) from burning one litre of heavy fuel oil is 0,034 gram which is 0,001% of the emissions
70
Walnum, H.J. (2011): Energy use and CO2 emissions from cruise ships — A discussion of methodological issues, Western Norway Research Institution, Note 2/2011, page 5, http://www.vestforsk.no/notater/energy-
use-and-co2-emissions-from-cruise-ships-a-discussion-of-methodological-issues 71
ALB=Available lower berth. 72 Toutain, J.E.W., Taarneby, G., Selvig, E.: Energiforbruk og utslipp til luft fra innenlandsk transport, SSB-
Rapport 2008/49, Oslo 2008, Table 2.1, Page 15, http://www.ssb.no/a/publikasjoner/pdf/rapp_200849/rapp_200849.pdf 73
The emissions are 80 355 kg for 1 TJ of electricity production with heavy fuel oil. These are only direct emissions, not including emissions upstream (or "Vorkette" in German). This is equivalent to 0,0804 kg pr MJ. Since there are 40,6 MJ in a kg of heavy fuel oil with a density of 0,98 this means 3,197 kg CO 2 from one litre of
heavy fuel oil. 74
http://www.ec.gc.ca/ges-ghg/default.asp?lang=En&n=AC2B7641-1

24
of CO2 (3124 gram). The corresponding figure for N2O is 0,002%. The estimates from ProBas and the
Canadian Environment Agency therefore fit well together.
The emissions of CO2 from direct propulsion energy is then estimated to 374,5 gram pr passenger-
km. Previously, we have estimated 357,8 gram pr passenger-km using data from the Walnum (2011).
In the following, we will use the ProBas estimate.
This is without the added energy required to produce the fuel that emits the CO2. According to the
ProBas estimate, producing i TJ of electricity from heavy fuel oil emits 11442 kg of CO2-equivalents.
These are emissions up to but not including production of electricity in the generator. This is equal to
11,4 gram pr MJ of heavy fuel oil. We have already estimated that we need 0,6 MJ pr passenger-km
in added energy consumption to accommodate the production of the fuel. This means an additional
7,3 gram CO2-equivalents or passenger-km. Adding this to the 374,5 gram of CO2- equivalents for
propulsion we estimated above we get 381,8 gram CO2- equivalents pr passenger-km.
Summary
Table 14 shows the gross energy required for propulsion and for building the ship Norwegian Gem in
MJ pr passenger-km. Gross energy for propulsion is the energy required for propulsion plus energy
required to produce the fuel that is burnt for that propulsion. Table 15 shows emissions of gram CO2-
equivalents for the same processes.
Table 14 Energy use in MJ pr passenger-km for propulsion and from building the ship
Source MJ pr passenger-km
Propulsion 4,7
Producing fuel for propulsion 0,6 Gross energy for propulsion 5,3
Building the ship 0,047
Table 15 Emissions of CO2-equivalents for propulsion and from building the ship
Source gram CO2-equivalents pr
passenger-km Propulsion 374,5
Producing fuel for propulsion 7,3 Gross energy for propulsion 381,8
Building the ship 3,5
Alternative fuels We will look at two alternative strategies for mitigating the environmental impact from cruise
tourism. One is making use of lighter materials for cruise ships' superstructure, thereby reducing the

25
ships' own weight. The other is using renewable fuels instead of fossil fuel. We will look at biodiesel
as an alternative fuel to heavy fuel oil for cruise ships' power generators.
Reducing ship's lightweight with composite materials Hou 75 has analyzed the application of fibre-reinforced plastic as structural material in Norwegian
Gem's superstructure above deck 11. Fibre-reinforced plastic is also called composite sandwich
materials. This composition consists of a core which often is a polymer, a large molecule with
repeating subunits which are called monomers. Polymers can be natural or synthetic. Plastic is a
synthetic polymer 76. According to Hou, potential core materials sandwich composites are PVC foam,
balsa wood cores or cellular material cores 77. The core material is attached to a skin material which
can be glass or carbon fibre reinforced laminates 78. Composite materials can substitute structural
materials in a cruise ships' superstructure. The core material absorbs shear forces generated by loads
carried by the ship and distribute these forces over a larger area 79. Composite sandwich materials
have high strength and stiffness while being much lighter than alternative structural materials.
According to Umair (2006), structures made of composite materials are 30-40% lighter than
aluminium 80.
According to Hou, replacing traditional structural materials in the upper five decks at Norwegian Gem
will save 1160 tonnes. However, the steel hull needs to be strengthened accordingly which is a
weight increase of 400 tonnes. The net saving from applying composite materials is then close to 800
tonnes. This means the ship can carry the same amount of passengers with a lower weight, thereby
saving fuel. Alternatively, the ship can be fitted with extra cabins to compensate for the weight loss.
This means that the cruise ship will have approximately the same own weight after using composite
sandwich materials but with a larger passenger carrying capacity.
A Swedish study concluded the saved weight can accommodate 86 extra passenger cabins plus an
extra 350 m2 of public spaces 81. Thus, the new designed Norwegian Gem will have a lightweight of
43 130 tonnes which is 20 tonnes less than the ship's actual lightweight but with increased passenger
capacity and higher income potential for the ship's owners. This also means that the same assumed
fuel consumption (since the lightweight is roughly the same) can be distributed on more passengers
pr km thereby reducing the environmental impact pr passenger-km.
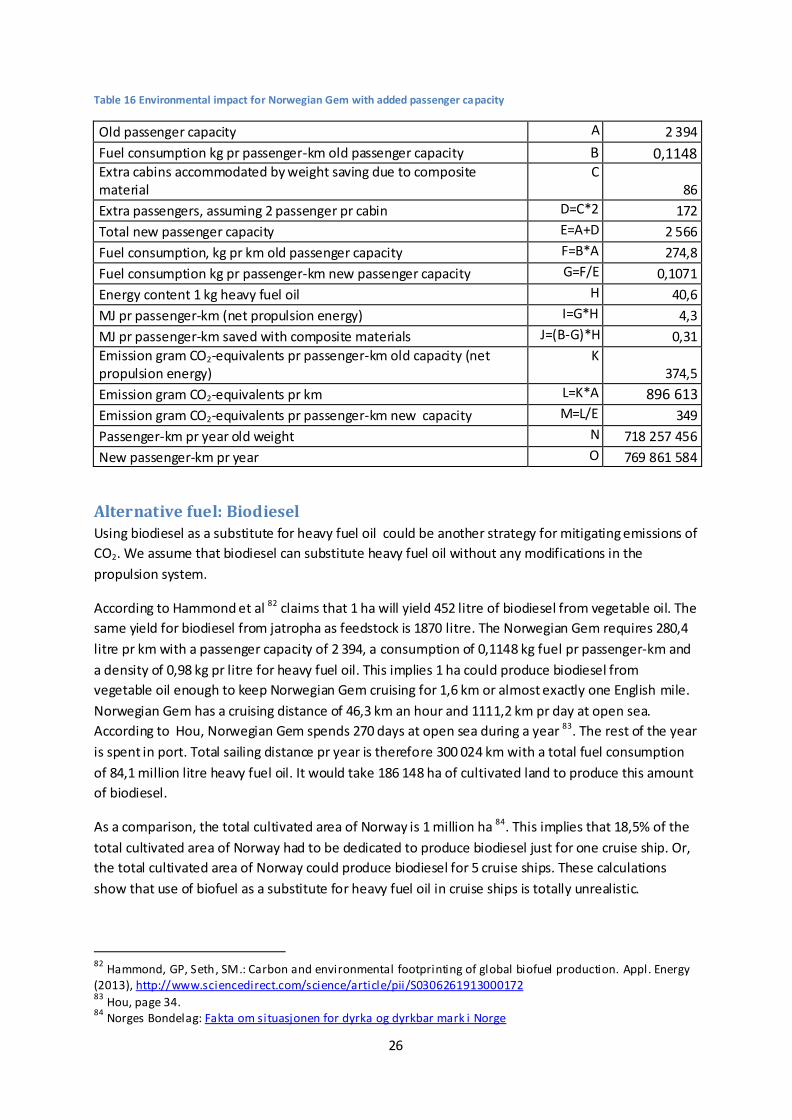
Table 16 shows the environmental impact of adding new passenger capacity to Norwegian Gem and distributing fuel consumption and emissions of CO2 from propulsion on the increased production of
passenger-km.
75
Hou, Q.: Life-Cycle Assessment of Cruising Ship Superstructure, Master Thesis in Sustainable Development, Uppsala University, Sweden, May 2011, http://uu.diva-portal.org/smash/get/diva2:451090/FULLTEXT01 76
Wikipedia: Polymer, http://en.wikipedia.org/wiki/Polymer 77
Hou, page 8, paragraph 2.5. 78
Umair, S.: Environmental Impacts of Fiber Composite Materials , Swedish Royal Institue Of Technology, Stockholm 2006, page 21,
http://www.infra.kth.se/fms/pdf/Life_Cycle_Assessment_of_Fiber_Composite_Materials2.pdf 79 composite-superstructure.com: LÄSS offers more benefits for passenger ship designers, http://composite-superstructure.com/pst_csc_article.pdf 80
Umair (2006), page 13. 81
Evegren, F., Hertzberg, T., Rahm, M.: LASS-C; Lightweight Construction Of A Cruise Vessel, SP-Report
2011:12, Technical Research Institute of Sweden, 2011, page 15, http://s-lass.com/en/Documents/Rapporter/SPreport_2011_12[1]-Cruise%20vessel.pdf
26
Table 16 Environmental impact for Norwegian Gem with added passenger capacity
Old passenger capacity A 2 394
Fuel consumption kg pr passenger-km old passenger capacity B 0,1148 Extra cabins accommodated by weight saving due to composite material
C 86
Extra passengers, assuming 2 passenger pr cabin D=C*2 172
Total new passenger capacity E=A+D 2 566
Fuel consumption, kg pr km old passenger capacity F=B*A 274,8
Fuel consumption kg pr passenger-km new passenger capacity G=F/E 0,1071
Energy content 1 kg heavy fuel oil H 40,6
MJ pr passenger-km (net propulsion energy) I=G*H 4,3
MJ pr passenger-km saved with composite materials J=(B-G)*H 0,31
Emission gram CO2-equivalents pr passenger-km old capacity (net propulsion energy)
K 374,5
Emission gram CO2-equivalents pr km L=K*A 896 613
Emission gram CO2-equivalents pr passenger-km new capacity M=L/E 349
Passenger-km pr year old weight N 718 257 456
New passenger-km pr year O 769 861 584
Alternative fuel: Biodiesel Using biodiesel as a substitute for heavy fuel oil could be another strategy for mitigating emissions of
CO2. We assume that biodiesel can substitute heavy fuel oil without any modifications in the
propulsion system.
According to Hammond et al 82 claims that 1 ha will yield 452 litre of biodiesel from vegetable oil. The
same yield for biodiesel from jatropha as feedstock is 1870 litre. The Norwegian Gem requires 280,4
litre pr km with a passenger capacity of 2 394, a consumption of 0,1148 kg fuel pr passenger-km and
a density of 0,98 kg pr litre for heavy fuel oil. This implies 1 ha could produce biodiesel from
vegetable oil enough to keep Norwegian Gem cruising for 1,6 km or almost exactly one English mile.
Norwegian Gem has a cruising distance of 46,3 km an hour and 1111,2 km pr day at open sea.
According to Hou, Norwegian Gem spends 270 days at open sea during a year 83. The rest of the year
is spent in port. Total sailing distance pr year is therefore 300 024 km with a total fuel consumption
of 84,1 million litre heavy fuel oil. It would take 186 148 ha of cultivated land to produce this amount
of biodiesel.
As a comparison, the total cultivated area of Norway is 1 million ha 84. This implies that 18,5% of the
total cultivated area of Norway had to be dedicated to produce biodiesel just for one cruise ship. Or,
the total cultivated area of Norway could produce biodiesel for 5 cruise ships. These calculations
show that use of biofuel as a substitute for heavy fuel oil in cruise ships is totally unrealistic.
82
Hammond, GP, Seth, SM.: Carbon and environmental footprinting of global biofuel production. Appl. Energy (2013), http://www.sciencedirect.com/science/article/pii/S0306261913000172 83
Hou, page 34. 84
Norges Bondelag: Fakta om situasjonen for dyrka og dyrkbar mark i Norge
27
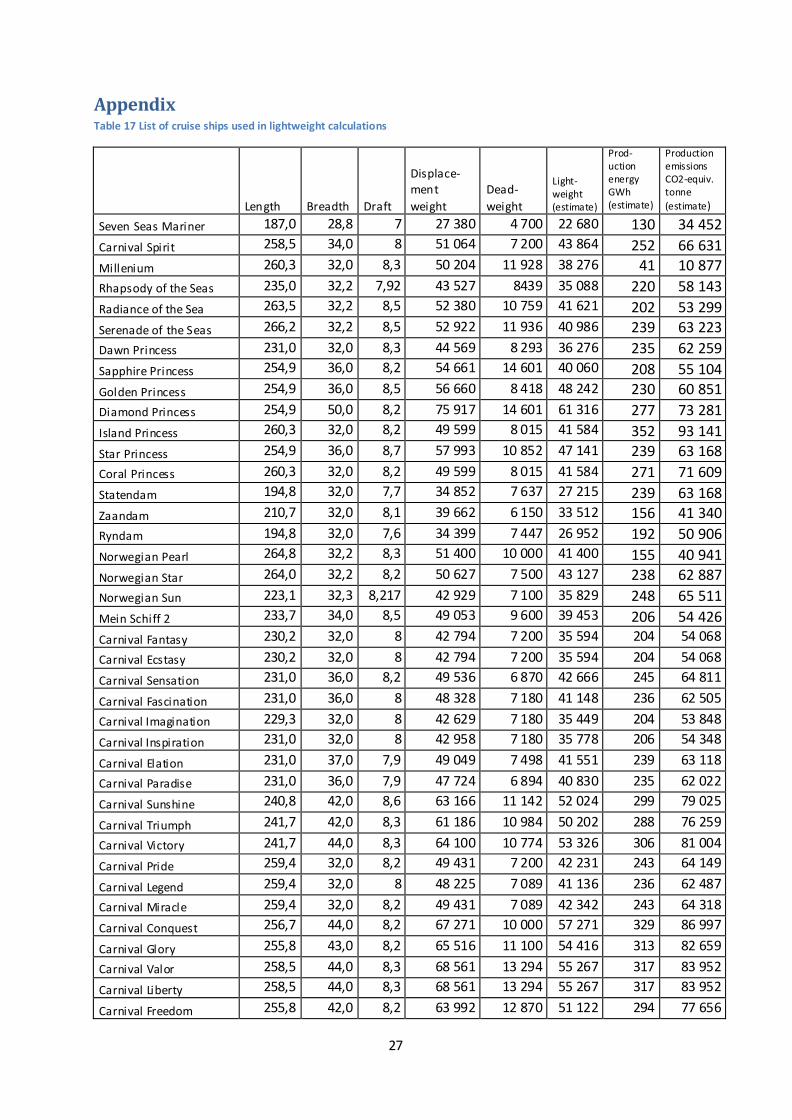
Appendix Table 17 List of cruise ships used in lightweight calculations
Length Breadth Draft
Displace-ment
weight
Dead-
weight
Light- weight (estimate)
Prod-uction energy GWh (estimate)
Production emissions CO2-equiv. tonne
(estimate)
Seven Seas Mariner 187,0 28,8 7 27 380 4 700 22 680 130 34 452
Carnival Spirit 258,5 34,0 8 51 064 7 200 43 864 252 66 631
Millenium 260,3 32,0 8,3 50 204 11 928 38 276 41 10 877
Rhapsody of the Seas 235,0 32,2 7,92 43 527 8439 35 088 220 58 143
Radiance of the Sea 263,5 32,2 8,5 52 380 10 759 41 621 202 53 299
Serenade of the Seas 266,2 32,2 8,5 52 922 11 936 40 986 239 63 223
Dawn Princess 231,0 32,0 8,3 44 569 8 293 36 276 235 62 259
Sapphire Princess 254,9 36,0 8,2 54 661 14 601 40 060 208 55 104
Golden Princess 254,9 36,0 8,5 56 660 8 418 48 242 230 60 851
Diamond Princess 254,9 50,0 8,2 75 917 14 601 61 316 277 73 281
Island Princess 260,3 32,0 8,2 49 599 8 015 41 584 352 93 141
Star Princess 254,9 36,0 8,7 57 993 10 852 47 141 239 63 168
Coral Princess 260,3 32,0 8,2 49 599 8 015 41 584 271 71 609
Statendam 194,8 32,0 7,7 34 852 7 637 27 215 239 63 168
Zaandam 210,7 32,0 8,1 39 662 6 150 33 512 156 41 340
Ryndam 194,8 32,0 7,6 34 399 7 447 26 952 192 50 906
Norwegian Pearl 264,8 32,2 8,3 51 400 10 000 41 400 155 40 941
Norwegian Star 264,0 32,2 8,2 50 627 7 500 43 127 238 62 887
Norwegian Sun 223,1 32,3 8,217 42 929 7 100 35 829 248 65 511
Mein Schiff 2 233,7 34,0 8,5 49 053 9 600 39 453 206 54 426
Carnival Fantasy 230,2 32,0 8 42 794 7 200 35 594 204 54 068
Carnival Ecstasy 230,2 32,0 8 42 794 7 200 35 594 204 54 068
Carnival Sensation 231,0 36,0 8,2 49 536 6 870 42 666 245 64 811
Carnival Fascination 231,0 36,0 8 48 328 7 180 41 148 236 62 505
Carnival Imagination 229,3 32,0 8 42 629 7 180 35 449 204 53 848
Carnival Inspiration 231,0 32,0 8 42 958 7 180 35 778 206 54 348
Carnival Elation 231,0 37,0 7,9 49 049 7 498 41 551 239 63 118
Carnival Paradise 231,0 36,0 7,9 47 724 6 894 40 830 235 62 022
Carnival Sunshine 240,8 42,0 8,6 63 166 11 142 52 024 299 79 025
Carnival Triumph 241,7 42,0 8,3 61 186 10 984 50 202 288 76 259
Carnival Victory 241,7 44,0 8,3 64 100 10 774 53 326 306 81 004
Carnival Pride 259,4 32,0 8,2 49 431 7 200 42 231 243 64 149
Carnival Legend 259,4 32,0 8 48 225 7 089 41 136 236 62 487
Carnival Miracle 259,4 32,0 8,2 49 431 7 089 42 342 243 64 318
Carnival Conquest 256,7 44,0 8,2 67 271 10 000 57 271 329 86 997
Carnival Glory 255,8 43,0 8,2 65 516 11 100 54 416 313 82 659
Carnival Valor 258,5 44,0 8,3 68 561 13 294 55 267 317 83 952
Carnival Liberty 258,5 44,0 8,3 68 561 13 294 55 267 317 83 952
Carnival Freedom 255,8 42,0 8,2 63 992 12 870 51 122 294 77 656

28
Carnival Splendor 256,7 44,0 8,2 67 271 11 843 55 428 318 84 197
Norwegian Gem 263,5 32,2 8,625 53 150 10 000 43 150 248 65 546
Norwegian Sky 223,1 32,3 8,017 41 884 8 800 33 084 190 50 256
Norwegian Spirit 235,6 32,2 8,421 46 398 8 530 37 868 218 57 523
Norwegian Star 264,0 32,2 8,2 50 627 7 500 43 127 248 65 511
Norwegian Dawn 264,8 32,2 8,5 52 638 7 500 45 138 259 68 566
Norwegian Jewel 264,8 32,2 8,6 53 257 7 500 45 757 263 69 507
Norwegian Jade 264,8 32,2 8,6 53 257 7 500 45 757 263 69 507
Norwegian Epic 288,8 40,6 8,7 74 161 10 850 63 311 364 96 172
Norwegian Breakaway 300,1 39,7 8,6 74 420 11 000 63 420 364 96 337
Oasis of the Seas 329,9 47,0 9,3 104 726 15 000 89 726 515 136 296
Allure of the Seas 330,0 47,0 9,3 104 746 19 750 84 996 488 129 111
Table 18 List of cruise ships in Skagway 2008
Fuel consumption Auxilliary boiler
Hotel load NOx
Name gallons/hour Litre/hour mt/hour Fuel type MW lbs/hour
Seven Seas Mariner 80 302,8 Carnival Spirit 600 2271,2 Empress of the North 40 151,4 Millenium 375 1419,5 Rhapsody of the Seas 410 1552,0 1,5 HFO 5,3
Radiance of the Sea 385 1457,4 2,9 MGO 5,3 Serenade of the Seas 760 2876,9 2,6 IFO 5,5 80,0
Dawn Princess 440 1665,6 Sapphire Princess 760 2876,9 2,3 IFO 9,6 271,0
Golden Princess 700 2649,8 2,5
10,5 277,5
Diamond Princess 1144 4330,5 4,1 IFO 11,5 314,0
Island Princess 610 2309,1 2,3 IFO 7,2 208,0
Star Princess 725 2744,4 2,3 IFO 10,5 277,5
Coral Princess 580 2195,5 Statendam 260 984,2 Zaandam 310 1173,5 Ryndam 275 1041,0 Norwegian Pearl 680 2574,1 2,5 IFO 7,2 176,2
Norwegian Star 775 2933,7 2,7 IFO 9,0 238,0
Norwegian Sun 590 2233,4 2,1 IFO 5,6 182,0
Mein Schiff 2
1,3 IFO 380 4,1

29
References Walnum, H.J.: Energy use and CO2 emissions from cruise ships — A discussion of methodological
issues, Western Norway Research Institution, VF-notat 2-2011,
http://www.vestforsk.no/notater/energy-use-and-co2-emissions-from-cruise-ships-a-discussion-of-
methodological-issues
How cruise ships work, http://adventure.howstuffworks.com/cruise-ship.htm
The electric cruise ship, http://www.edn.com/electronics-news/4341136/The-electric-cruise-ship
QE2: From the desk of the chief engineer, http://www.qe2.org.uk/engine.html
Graw, R. (US Forest Service), Faure, A (Alaska Department of Environmental Conservation) A Study
for Alaska Department Of Environmental Conservation, Air Pollution Inventory For 2008 Tourism
Season,
http://www.dec.alaska.gov/water/cruise_ships/pdfs/Skagway2008_Final_Emissions_Report.pdf
Toutain, J.E.W, Taarneby, G., Selvig, E.,Energiforbruk og utslipp til luft fra innenlandsk transport,
Statistisk Sentralbyrå, Rapport 2998/49.
http://www.ssb.no/emner/01/03/10/rapp_200849/rapp_200849.pdf


