Page 1
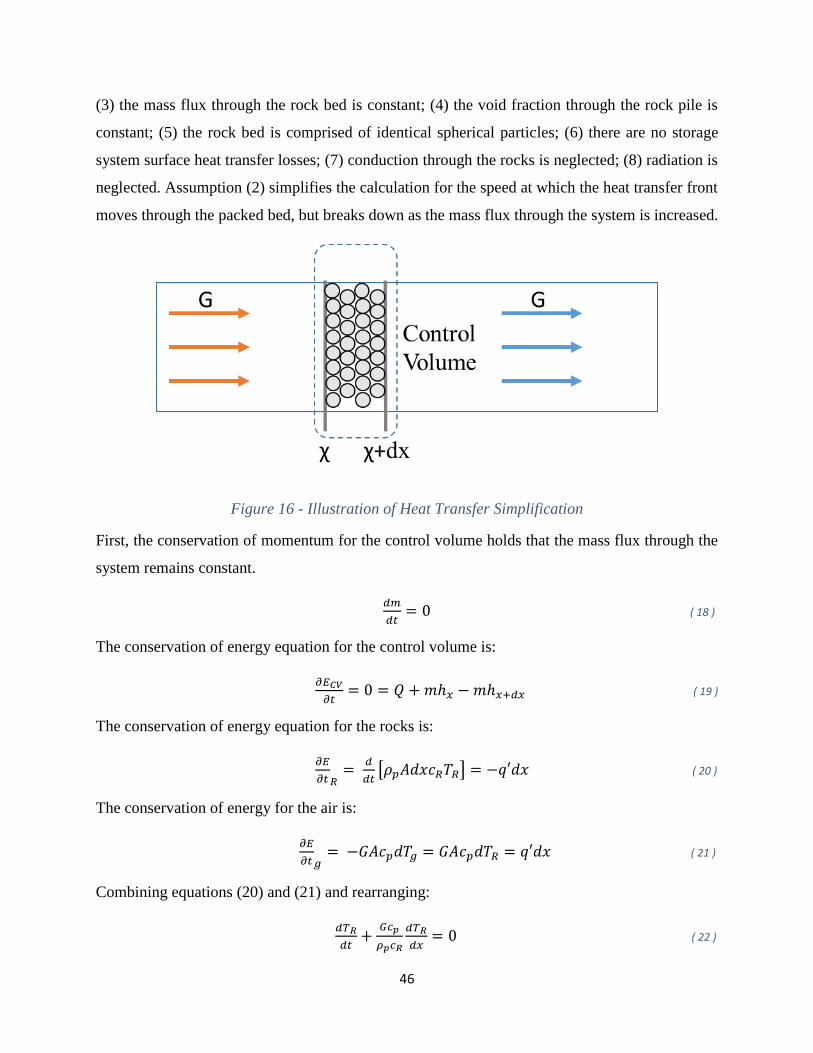
Crushed Rock Thermal Energy Storage & Nuclear Technology:
Option Space & Economic Impacts
by
Nathaniel Ross McLauchlan
B.S., Chemistry, United States Naval Academy, 2016
Submitted to the Institute for Data, Systems, and Society &
the Department of Nuclear Science and Engineering
in partial fulfillment of the requirements for the degrees
of
Master of Science in Technology and Policy and
Master of Science in Nuclear Science and Engineering
at the
MASSACHUSETTS INSTITUTE OF TECHNOLOGY
June 2018
© Massachusetts Institute of Technology 2018. All rights reserved.
Author . . . . . . . . . . . . . . . . . . . . . . . . . . . . . . . . . . . . . . . . . . . . . . . . . . . . . . . . . . . . .
Institute for Data, Systems, and Society
Department of Nuclear Science and Engineering
May 11, 2018
Certified by . . . . . . . . . . . . . . . . . . . . . . . . . . . . . . . . . . . . . . . . . . . . . . . . . . . . . . . . .
Charles W. Forsberg
Principal Research Scientist of Nuclear Science and Engineering
Thesis Supervisor
Certified by . . . . . . . . . . . . . . . . . . . . . . . . . . . . . . . . . . . . . . . . . . . . . . . . . . . . . . . .
Michael J. Driscoll
Professor Emeritus of Nuclear Science and Engineering
Thesis Reader
Accepted by . . . . . . . . . . . . . . . . . . . . . . . . . . . . . . . . . . . . . . . . . . . . . . . . . . . . . . . .
Munther Dahleh
William A. Coolidge Professor of Electrical Engineering & Computer Science
Director, Institute for Data, Systems, and Society
Accepted by . . . . . . . . . . . . . . . . . . . . . . . . . . . . . . . . . . . . . . . . . . . . . . . . . . . . . . . .
Ju Li
Battelle Energy Alliance Professor of Nuclear Science and Engineering
Chairman, Department Committee on Graduate Theses
Page 3
3
Crushed Rock Thermal Energy Storage & Nuclear Technology:
Option Space & Economic Impacts
by
Nathaniel Ross McLauchlan
Submitted to the Institute for Data, Systems, and Society &
the Department of Nuclear Science and Engineering
in partial fulfillment of the requirements for the degrees
of
Master of Science in Technology and Policy and
Master of Science in Nuclear Science and Engineering
Abstract
Increasing amounts of intermittent renewables have led to zero and negative priced electricity at
times of peak wind and solar production. The volatility added to the grid by renewables and low prices at
peak production create a demand for flexible energy supply and present an opportunity for energy arbitrage.
Nuclear reactors in the United States are inflexible when compared to fossil generators, and batteries may
store energy at peak renewable production, albeit at a high capital cost. Thermal energy storage coupled to
nuclear reactors may both increase nuclear flexibility and capitalize on price volatility, benefitting the
economics for the struggling nuclear industry. This research maps the option space for constructing a
crushed rock thermal energy storage (TES) system coupled to a light water reactor and employs a
modification of the GenX capacity expansion model to evaluate the economic. Historic demand and
renewable resource availability from ERCOT were used to illustrate the benefit of crushed rock TES with
an increasingly restrictive CO2 emission constraint. Parametric variations were used to address uncertainty
in performance estimates. Crushed rock TES was found to be beneficial under favorable conditions,
reducing the average price of electricity from $81/kWh (without TES) to $73/kWh (with TES) at a system
marginal cost of $5/kWh-heat and emissions constraint of 100 g CO2/kWh-electric, a nearly 10X reduction
of current emissions. Unfavorable conditions resulted in a price reduction from $81/kWh to $78/kWh with
the same cost estimates and carbon constraint. The investment cost of enabling the ability for nuclear
generation to couple to crushed rock TES was also found to significantly affect the system’s favorability
and effect on electricity prices.
Thesis Supervisor: Charles W. Forsberg
Title: Principal Research Scientist of Nuclear Science and Engineering
Thesis Reader: Michael J. Driscoll
Title: Professor Emeritus of Nuclear Science and Engineering
Page 4
4
Acknowledgements
First, I would like to thank everyone whose teaching and mentorship contributed directly
to this work. This thesis would not have been possible without the insight and feedback of my
thesis supervisor, Dr. Charles Forsberg, and reader, Professor Michael Driscoll. Thank you for
broadening my horizons and your expert advice throughout this process. To other members of
the NSE faculty, particularly Professor Jacopo Buongiorno, thank you for cultivating my interest
and enriching my knowledge in nuclear science and engineering. I am also indebted to Nestor
Sepulveda, for the hours of mentorship, wisdom, support, and most of all, patience.
To the TPP administration, particularly Dr. Frank Field, Ed Ballo, and Barbara
DeLaBarre. You three are at the heart of TPP, and have always provided support, kindness, and
candy when needed. TPP is a family because of you, and I am leaving MIT a better person for
having known you all. To my TPP friends and classmates, I have learned so much from you all,
and am excited to see how you will change the world.
Of course, I could not have completed this work without those who supported my path to
MIT and funded my studies throughout. To the Navy for allowing me to pursue my graduate
studies, to the staff at Lincoln Labs who took a bet on me and awarded me the Lincoln
Laboratory Military Fellowship, namely John Kuconis and Dr. Jonathan Pitts, and to my mentors
at Lincoln Laboratory, especially Dr. Brian Lee, thank you. I would also like to thank all of my
mentors throughout the years who taught me the value of hard work and set me on this path,
specifically John Sperry and Paul Schreiner. You both set the standard for the leader and officer I
hope to be.
Lastly, I would like to thank my parents, Theresa Walters and Robert McLauchlan, and my
siblings, Connor, Amelia, and Kate. You all inspire me more than you know.
Disclaimer: Nathaniel McLauchlan is an active duty Officer in the U.S. Navy. Any views,
opinions, assumptions, or conclusions expressed in this work are those of the author and do not
reflect the official policy or position of any agency of the U.S. government. As well, the author is
responsible for any errors or deficiencies contained in this work.
Page 5
5
Table of Contents
Abstract ......................................................................................................................................................... 3
Acknowledgements ....................................................................................................................................... 4
Table of Contents .......................................................................................................................................... 5
List of Figures ............................................................................................................................................... 7
List of Tables ................................................................................................................................................ 9
1. Introduction ............................................................................................................................................. 11
1.1 Changing Energy Markets ................................................................................................................ 11
1.2 Energy Storage and Crushed Rock ................................................................................................... 12
1.3 Structure of the Thesis ...................................................................................................................... 14
2. Literature Review .................................................................................................................................... 15
2. 1 Evolving Electricity Markets ........................................................................................................... 15
2.1.1 Electricity, Capacity, and Auxiliary Services Markets .............................................................. 15
2.2 Drivers towards a low-carbon energy grid ........................................................................................ 17
2.2.1 Changing supply and demand side technologies ....................................................................... 17
2.2.2 Policies Promoting a Low Carbon Energy Grid ........................................................................ 19
2.3 Economic Prospects for Nuclear Energy Today ............................................................................... 20
2. 4 Energy Storage ................................................................................................................................. 22
2.4.1 Utility of Storage Technologies ................................................................................................. 22
2.4.2 Examples of Storage Technologies ............................................................................................ 24
2.5 Crushed Rock Thermal Energy Storage ............................................................................................ 27
2.5.1 Related Work ............................................................................................................................. 29
2.5.2 Considerations for Coupling Crushed Rock TES to Nuclear Reactors ...................................... 33
3. Engineering Modeling and Option Space Estimations ........................................................................... 36
3. 1 Nomenclature ................................................................................................................................... 37
3.2.1 Pressure Drops ........................................................................................................................... 38
3.2.2 Heat Transfer ............................................................................................................................. 39
3.3 Correlations for Modeling Flow in Irregular Rock Beds .................................................................. 40
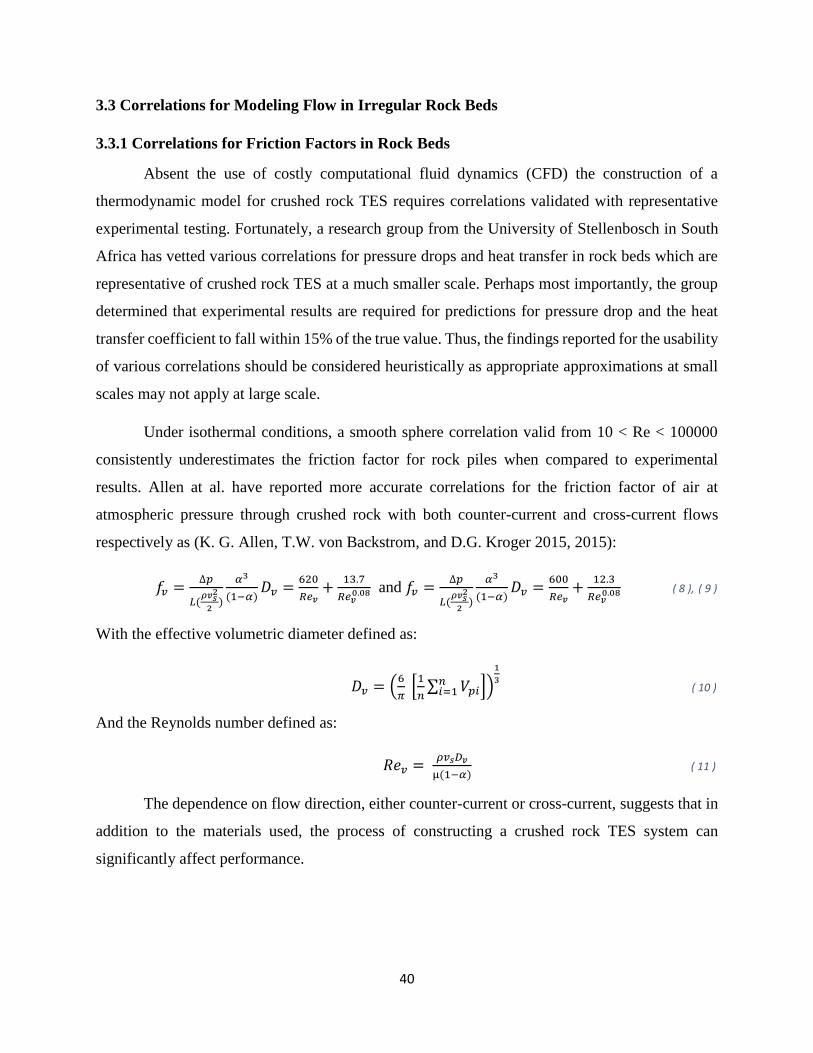
3.3.1 Correlations for Friction Factors in Rock Beds ......................................................................... 40
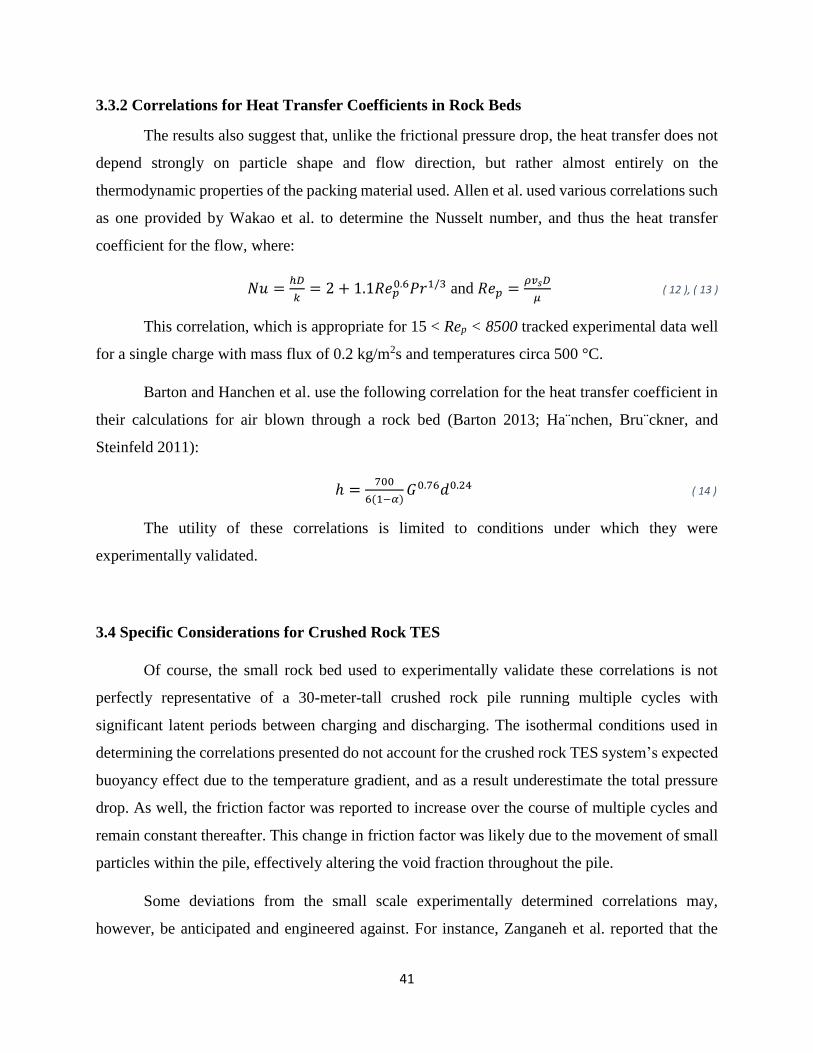
3.3.2 Correlations for Heat Transfer Coefficients in Rock Beds ........................................................ 41
3.4 Specific Considerations for Crushed Rock TES ............................................................................... 41
3.5.1 Thermal Losses at the Walls ...................................................................................................... 42
3.5.2 Pressure Drop ............................................................................................................................. 44
3.5.3 Temperature Distribution and Charging Time ........................................................................... 45
Page 6
6
3.5.4 Sizing Energy Storage ................................................................................................................ 49
3.5.5 Estimating the Temperature Front ............................................................................................. 53
3.6 Future Work for Engineering Analysis ............................................................................................. 54
4. Economic Modeling ................................................................................................................................ 56
4.1 Common Electricity Market Models ................................................................................................. 56
4.2 GenX Formulation ............................................................................................................................ 56
4.3 Modeling Crushed Rock Heat Storage with GenX ........................................................................... 58
4.3.1 System-Level Model .................................................................................................................. 58
4.3.2 LWR Base Case Formulation .................................................................................................... 60
4.3.3 LWR with Crushed Rock Thermal Storage Formulation........................................................... 62
4.4 Model Input Estimates ...................................................................................................................... 65
4.4.1 Parameter Estimates for Existing Technologies ............................................................................ 65
4.4.2 Parameter Estimates for Crushed Rock Thermal Energy Storage ................................................. 67
4.5 Experimental Design ......................................................................................................................... 68
5. Results and Discussion ........................................................................................................................... 70
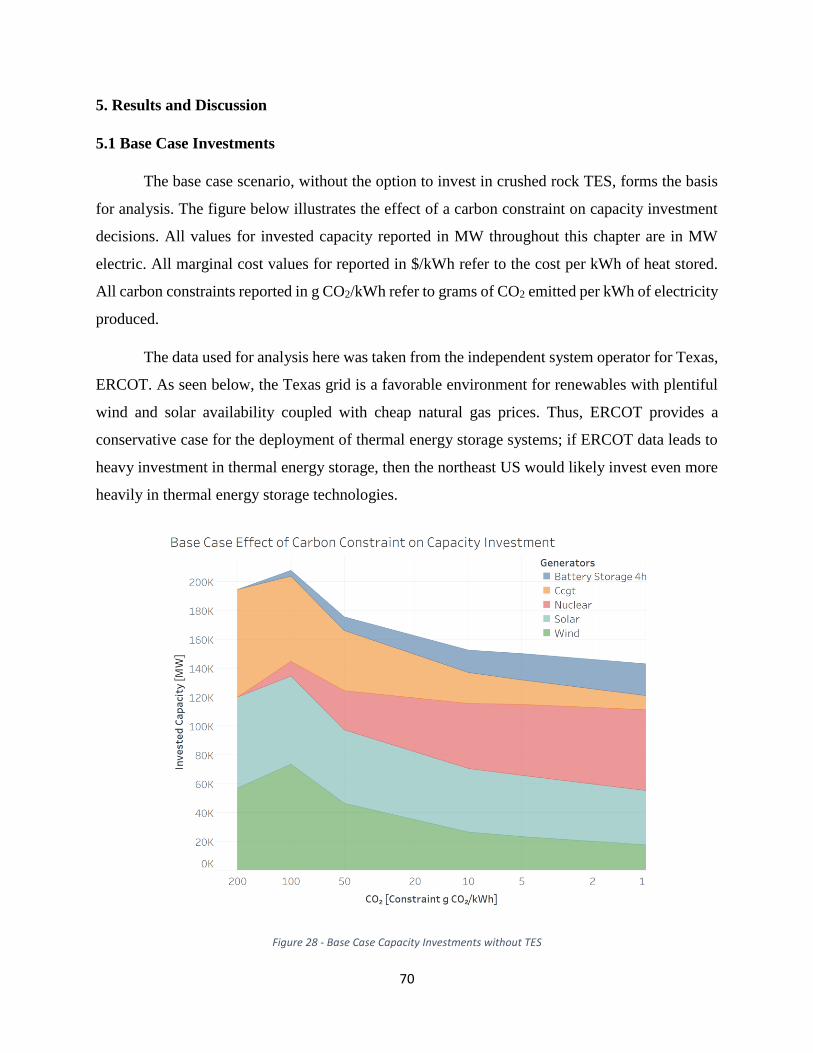
5.1 Base Case Investments ...................................................................................................................... 70
5.2 Favorable TES Results ...................................................................................................................... 71
5.3 Unfavorable TES Scenario Investments ........................................................................................... 79
5.4 Charging and Storage Level Samples ............................................................................................... 82
5.5 Average Prices .................................................................................................................................. 84
5.6 Results with $500/kW Cost for Crushed Rock Capability ................................................................ 86
6. Conclusion .............................................................................................................................................. 90
6.1 Policy Matters ................................................................................................................................... 90
6.2 Future Work ...................................................................................................................................... 90
Appendix A – Engineering Analysis MATLAB Code ............................................................................... 92
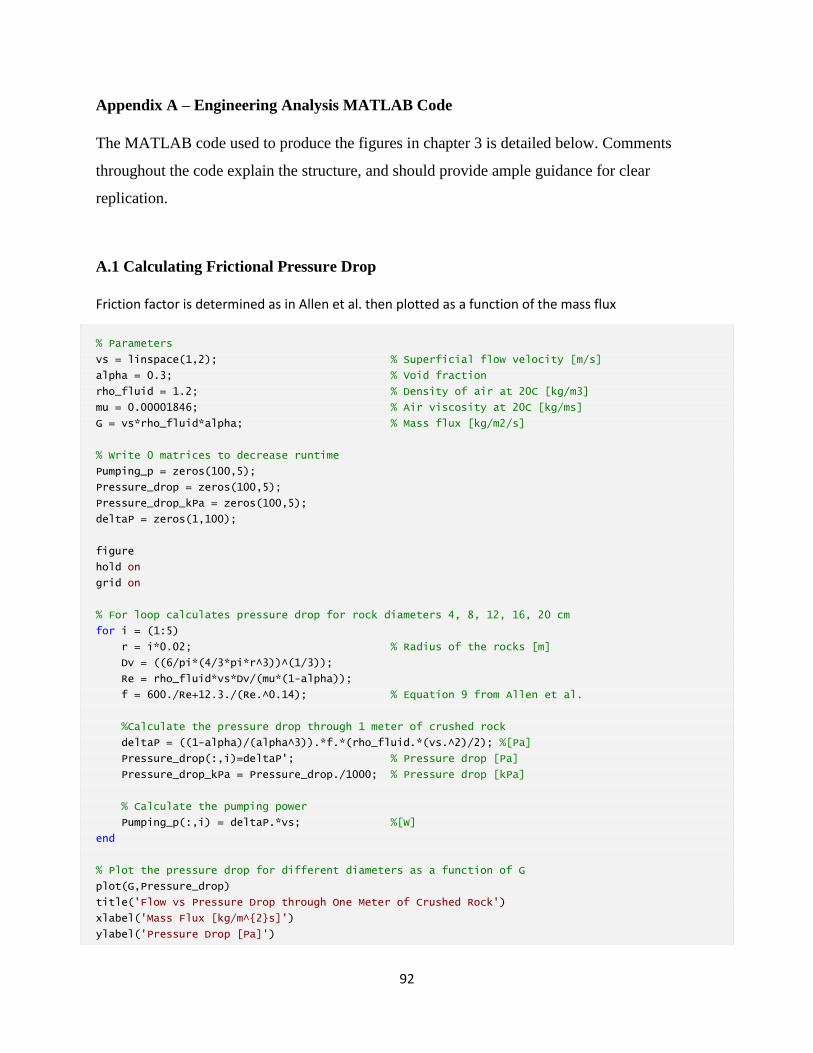
A.1 Calculating Frictional Pressure Drop ............................................................................................... 92
A.2 Time to charge ................................................................................................................................. 94
A.3 Heat Deposited from Air as a Function of mass flux ....................................................................... 95
A.4 Energy Stored at Varying Temperatures .......................................................................................... 97
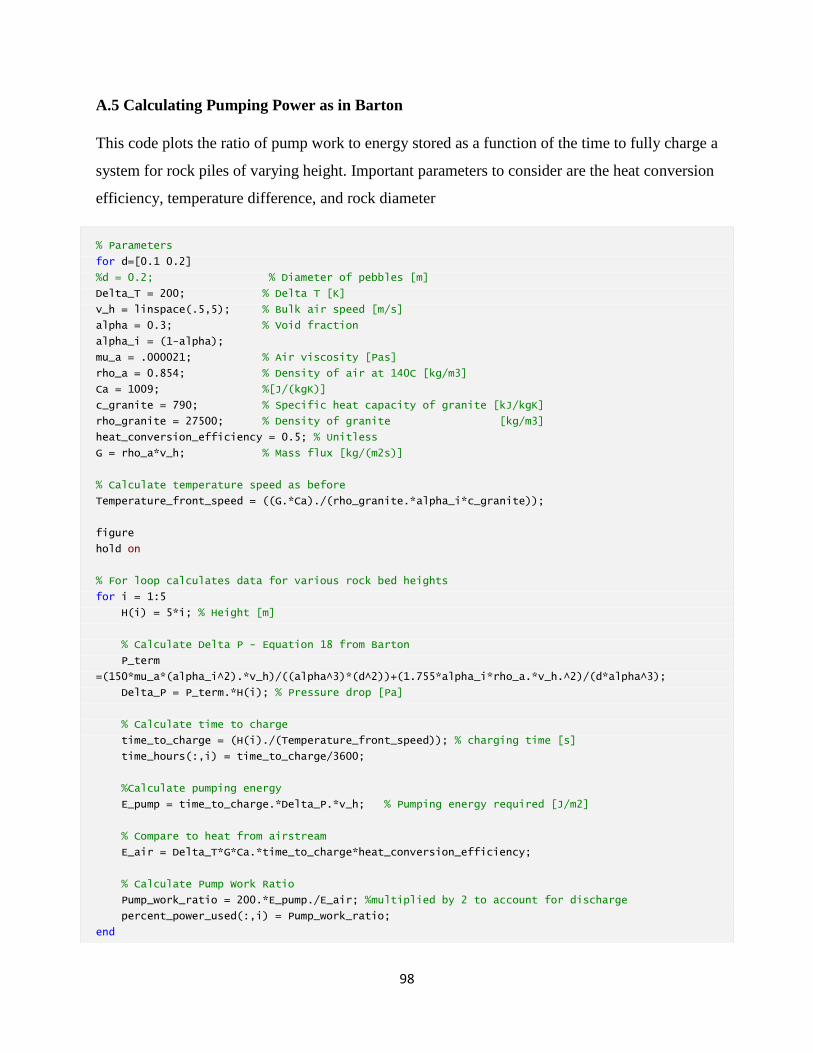
A.5 Calculating Pumping Power as in Barton ........................................................................................ 98
References ................................................................................................................................................. 101
Page 7
7
List of Figures
Figure 1 - Price Collapse at Times of High Solar Production in California (“California Solar Spike Leads
to Negative CAISO Real-Time Prices in March” 2017) ............................................................................. 12
Figure 2 - Illustration of Technological Gap in Energy Storage ................................................................. 13
Figure 3 – Crushed Rock Thermal Energy Storage in Heating Mode ........................................................ 14
Figure 4 - Price Swings Due to Solar and Wind Energy............................................................................. 16
Figure 5 - Cost Declines in Key Technologies, 2008-2014; MIT Utility of the Future .............................. 18
Figure 6 - Weekday Demand Load for EVs in CA ..................................................................................... 18
Figure 7: LCOE between Various Energy Technologies at Varying Discount Rates ................................ 21
Figure 8 - Chart of Energy Technology Attributes (U.S. Department of Energy 2017) ............................. 24
Figure 9 - LCOS for Various Technologies in Commercial and Industrial Application in $/MWhe ......... 25
Figure 10 - Illustration of Technological Gap in Energy Storage .............................................................. 27
Figure 11 - Crushed Rock Thermal Energy Storage in Heating Mode ....................................................... 28
Figure 12 – Siemens Gamesa System (“Siemens Gamesa Starts Construction Of Heat Rock-Fill Storage
For Wind Energy” 2017) ............................................................................................................................ 30
Figure 13 – STERG Group Experimental Rock Bed (Laubscher SolarPACES) ........................................ 31
Figure 14 - Effect of Insulation Thickness on Ambient Energy Losses over 24 Hours for Crushed Rock
TES System ................................................................................................................................................. 43
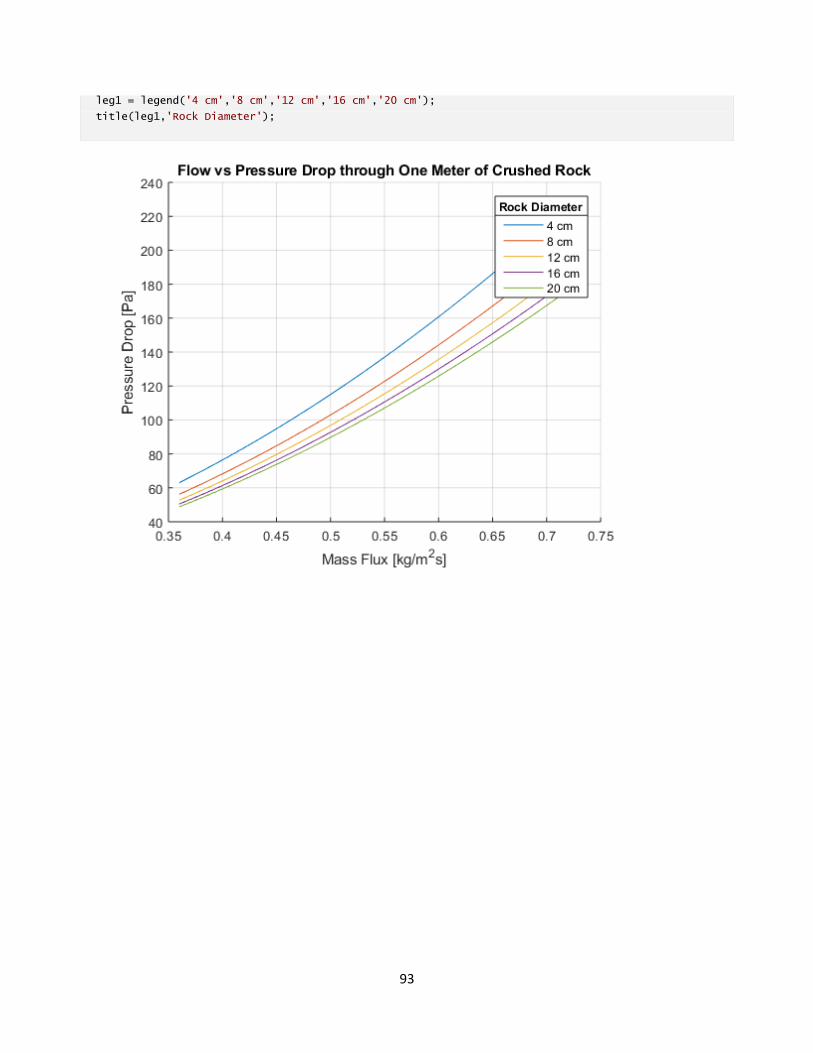
Figure 15 - Pressure Drops as a Function of Mass Flux and Rock Diameter ............................................. 45
Figure 16 - Illustration of Heat Transfer Simplification ............................................................................. 46
Figure 17 - Time to Fully Charge as a Function of Mass Flux, Air Velocity, and Rock Bed Height ......... 48
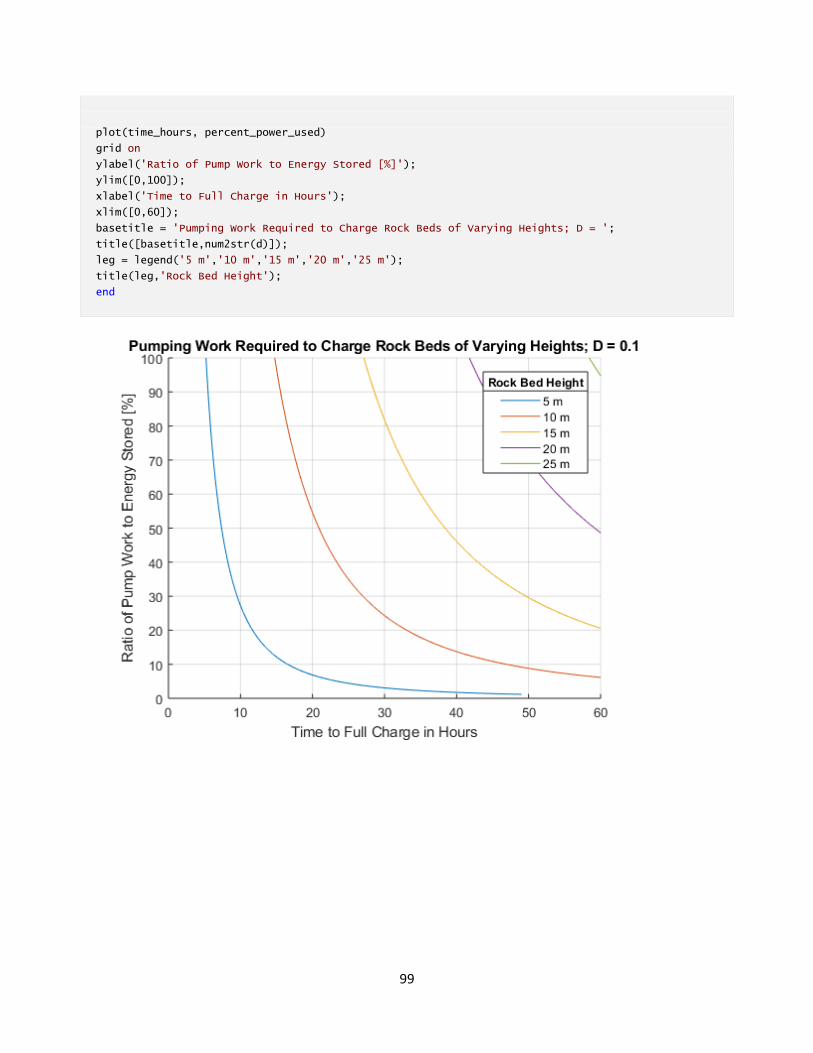
Figure 18 - Pump Work Ratio for Varying Rock Bed Heights and Charging Times D = 0.1 m ................ 50
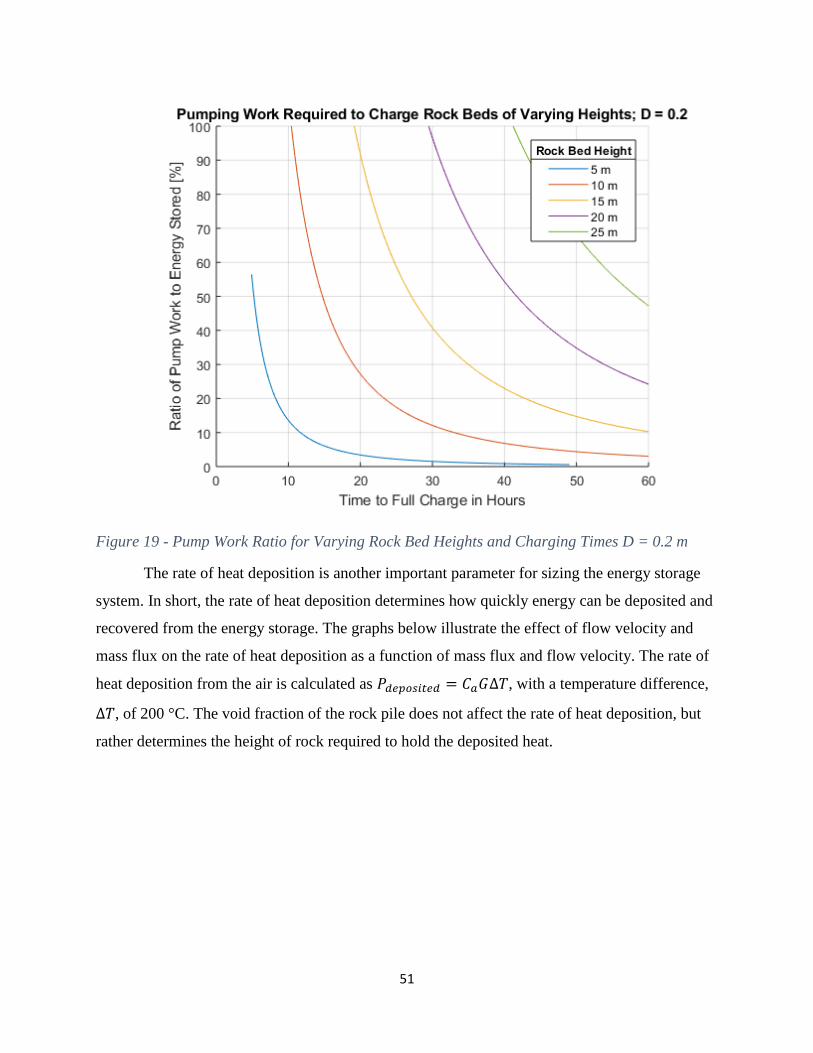
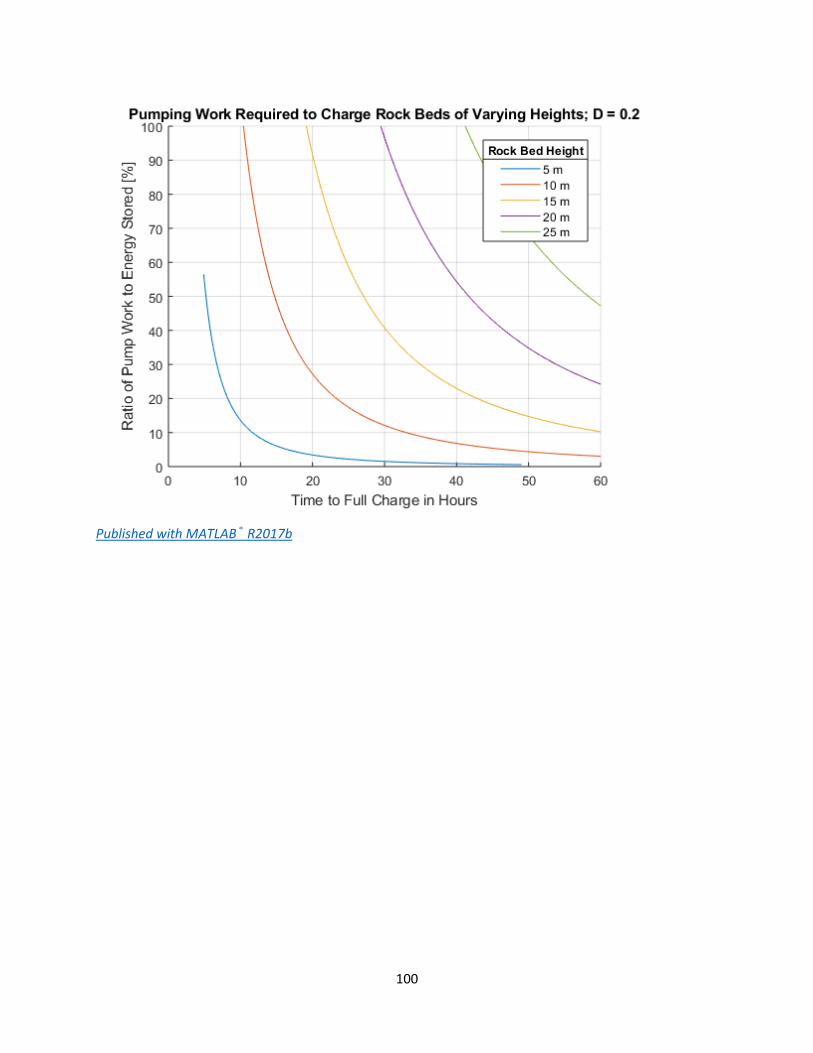
Figure 19 - Pump Work Ratio for Varying Rock Bed Heights and Charging Times D = 0.2 m ................ 51
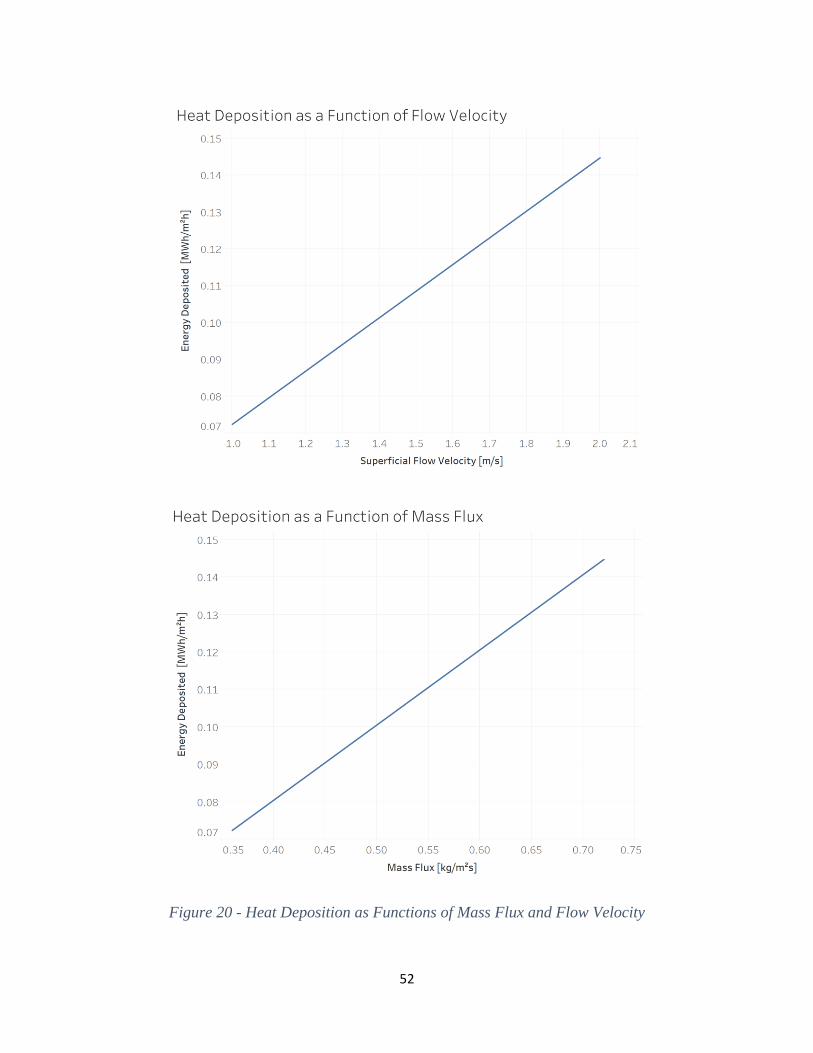
Figure 20 - Heat Deposition as Functions of Mass Flux and Flow Velocity .............................................. 52
Figure 21 - Effect of Temperature Differential on Energy Stored .............................................................. 53
Figure 22 - System Level Illustration of Electricity Market without TES .................................................. 57
Figure 23 - System Level Illustration of Electricity Market With FIRES .................................................. 58
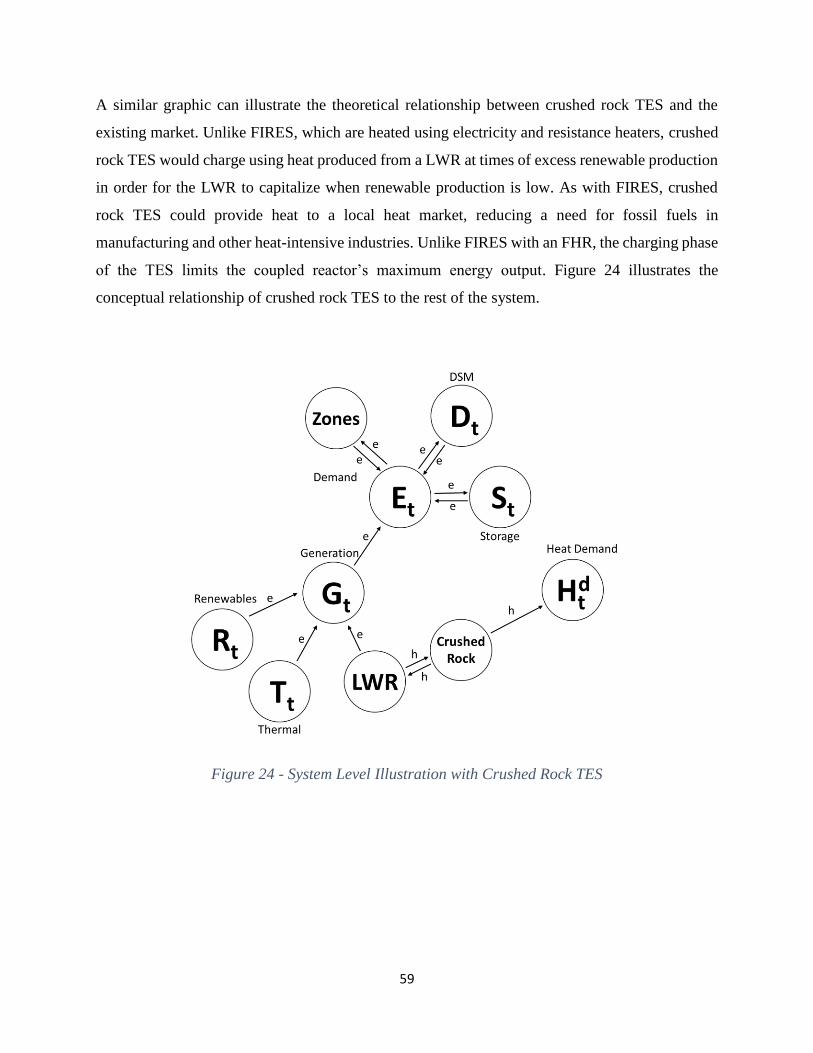
Figure 24 - System Level Illustration with Crushed Rock TES .................................................................. 59
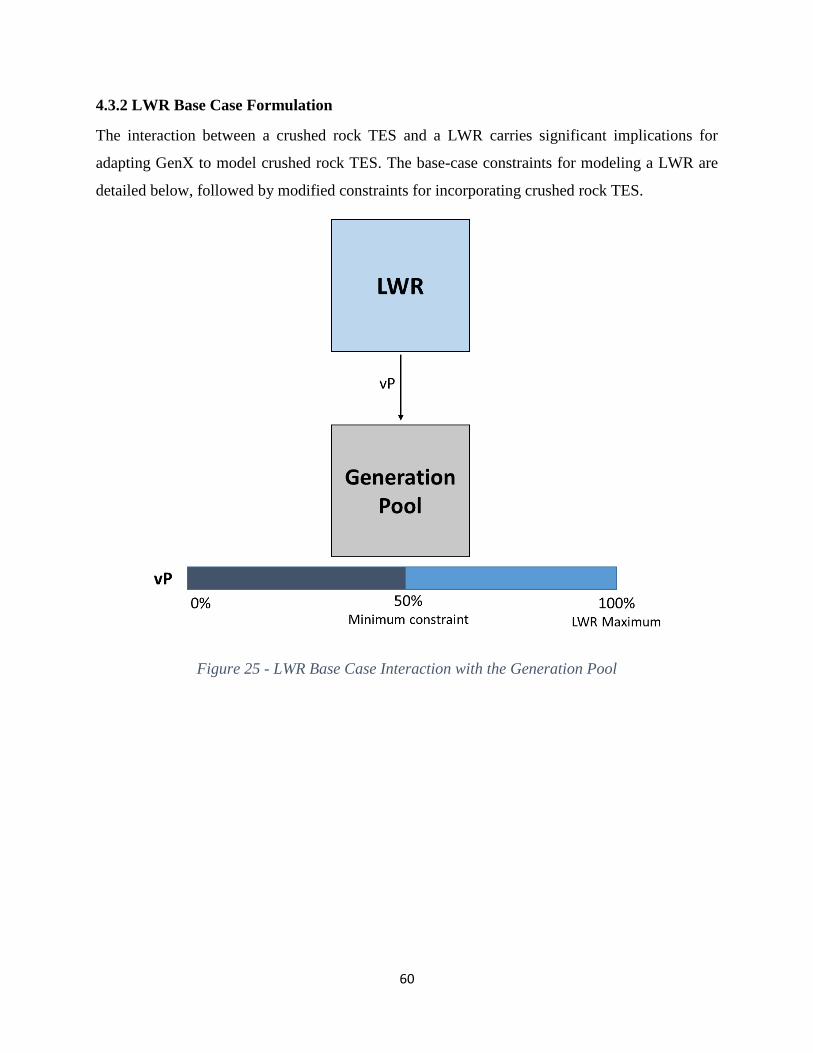
Figure 25 - LWR Base Case Interaction with the Generation Pool ............................................................ 60
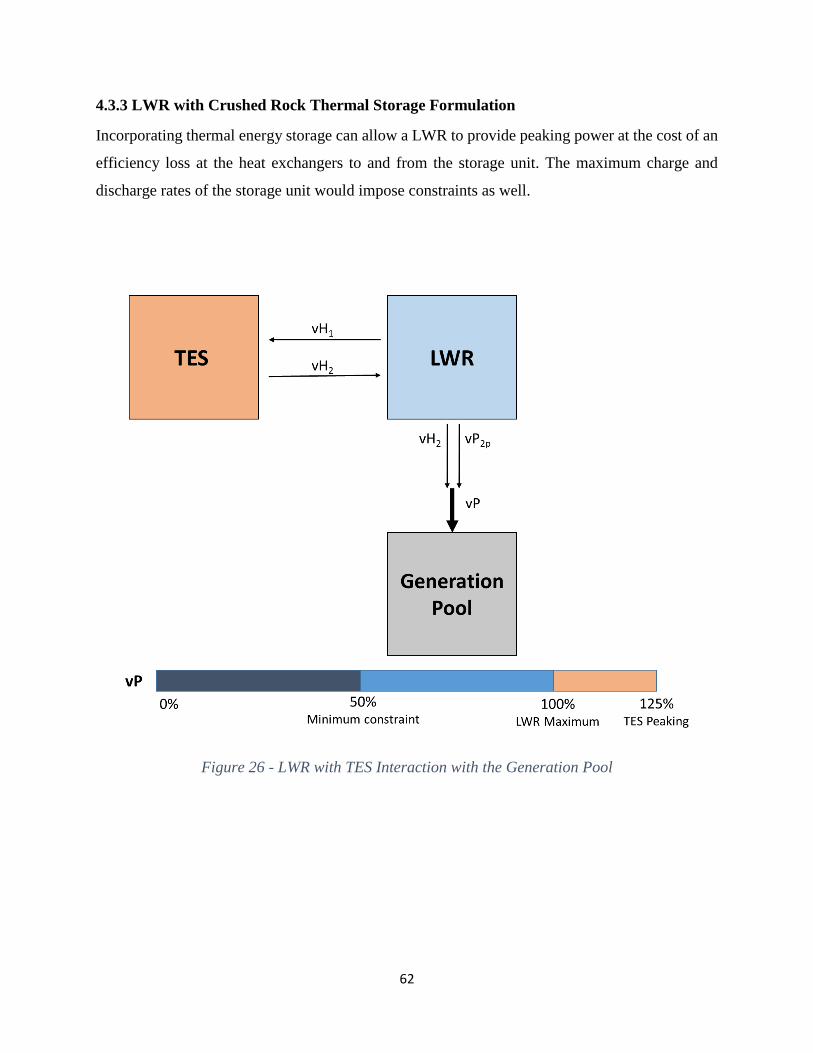
Figure 26 - LWR with TES Interaction with the Generation Pool ............................................................. 62
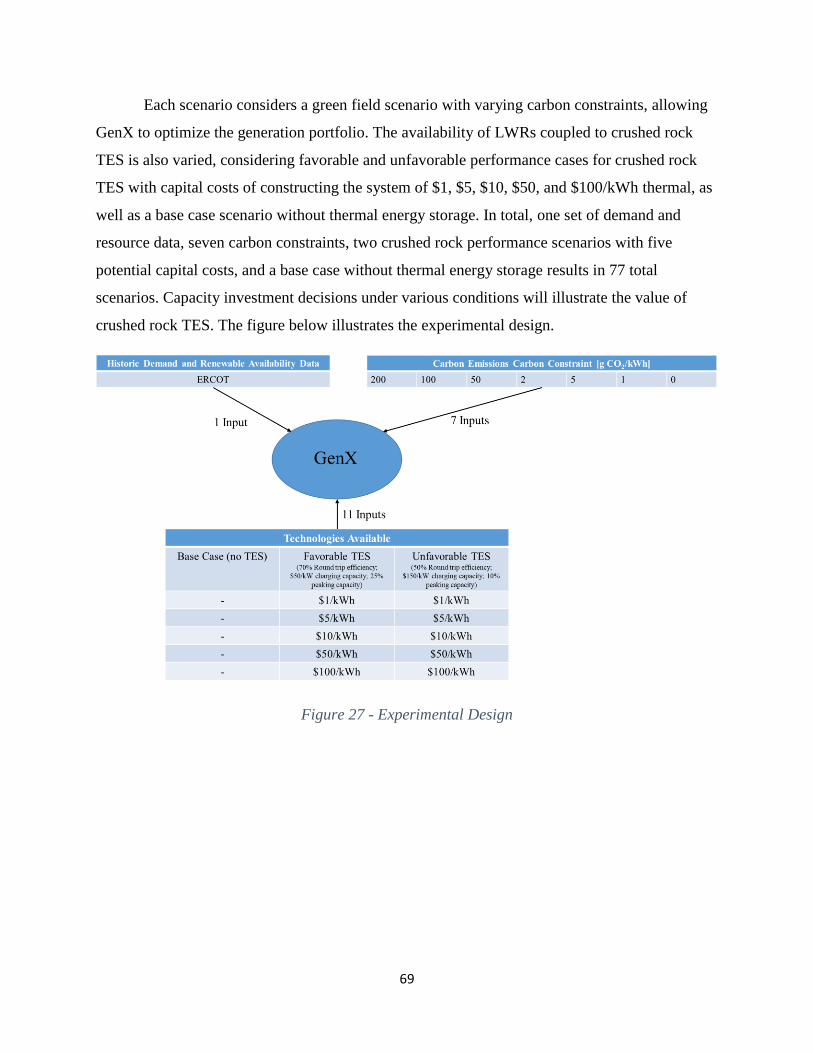
Figure 27 - Experimental Design ................................................................................................................ 69
Figure 28 - Base Case Capacity Investments without TES........................................................................... 70
Page 8
8
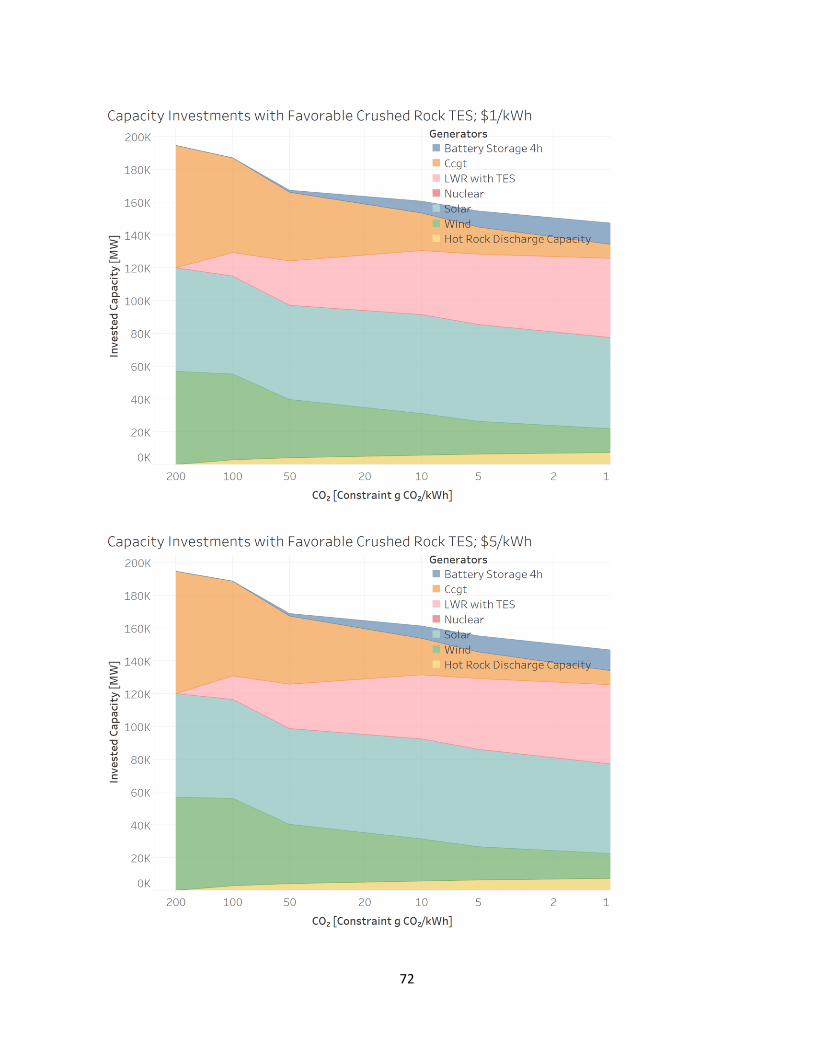
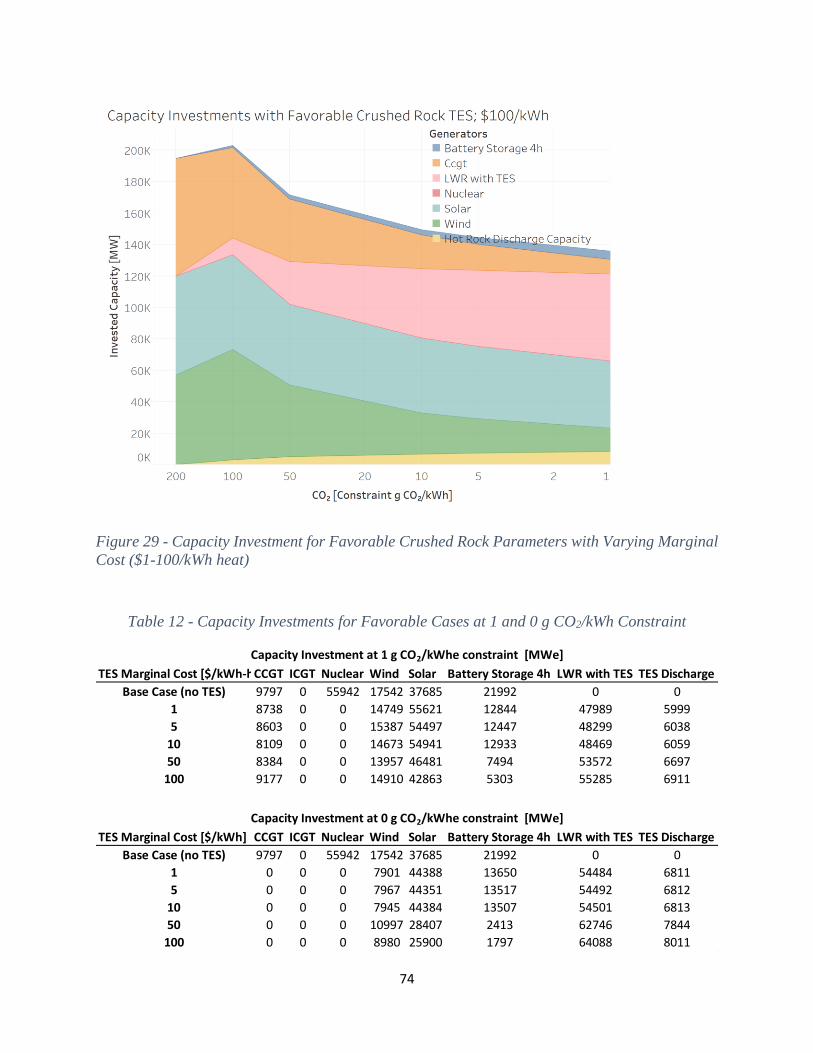
Figure 29 - Capacity Investment for Favorable Crushed Rock Parameters with Varying Marginal Cost
($1-100/kWh heat) ...................................................................................................................................... 74
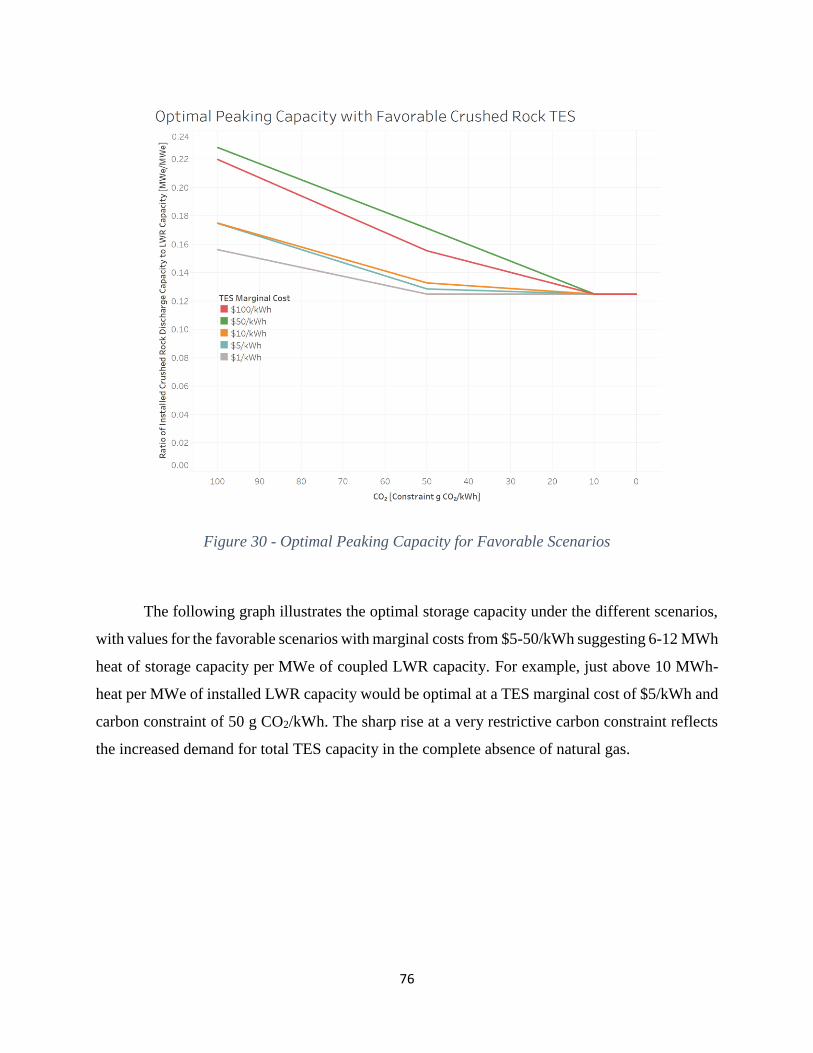
Figure 30 - Optimal Peaking Capacity for Favorable Scenarios ................................................................. 76
Figure 31 - Sizing TES Capacity [MWh] for Favorable Scenarios Relative to Installed LWR Capacity
[MWh-heat/MWe] ...................................................................................................................................... 77
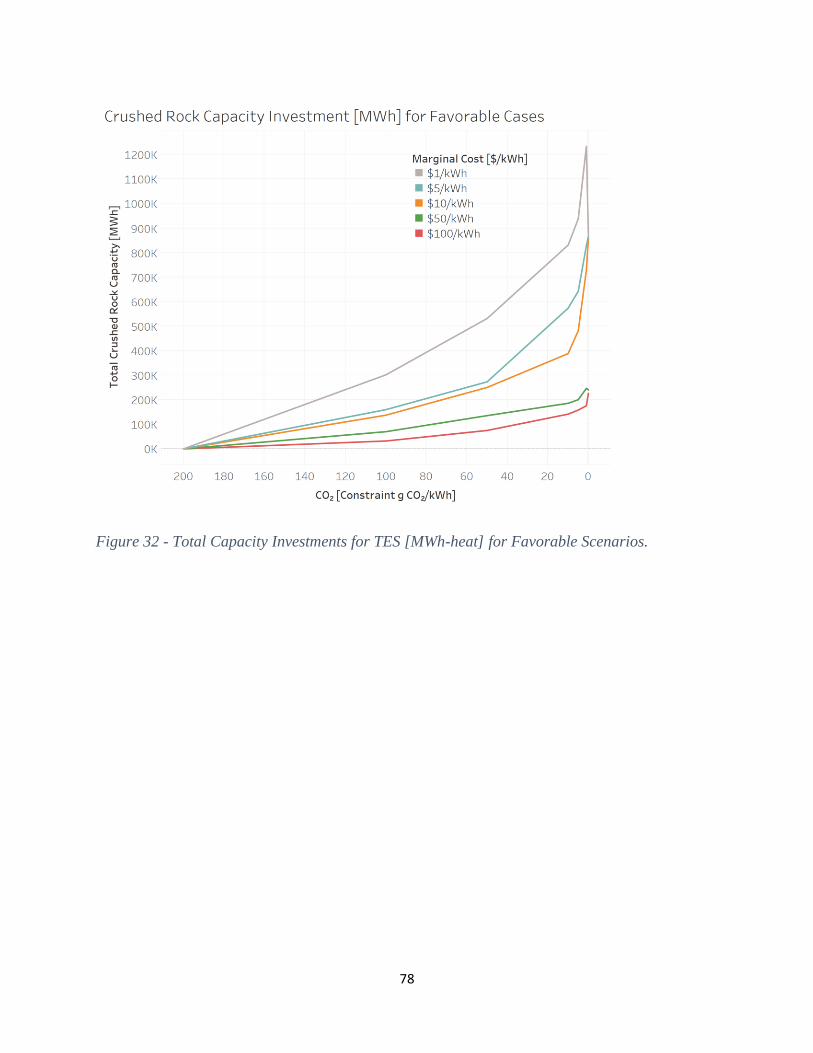
Figure 32 - Total Capacity Investments for TES [MWh-heat] for Favorable Scenarios. ........................... 78
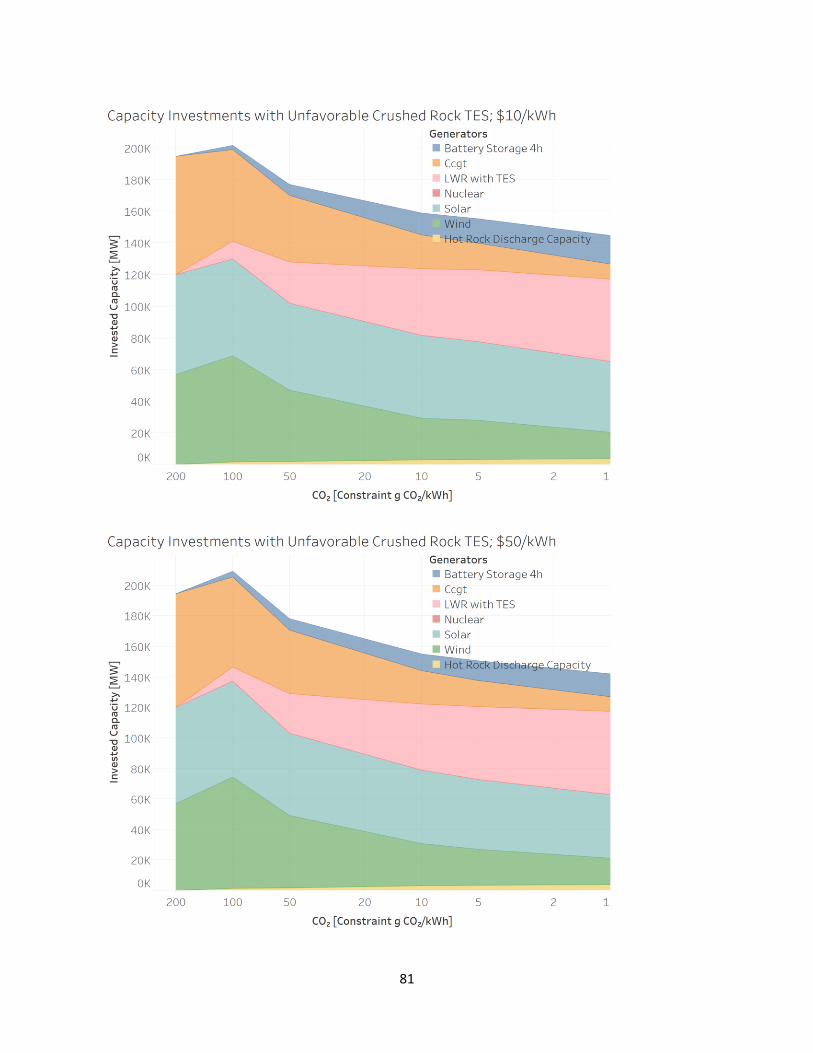
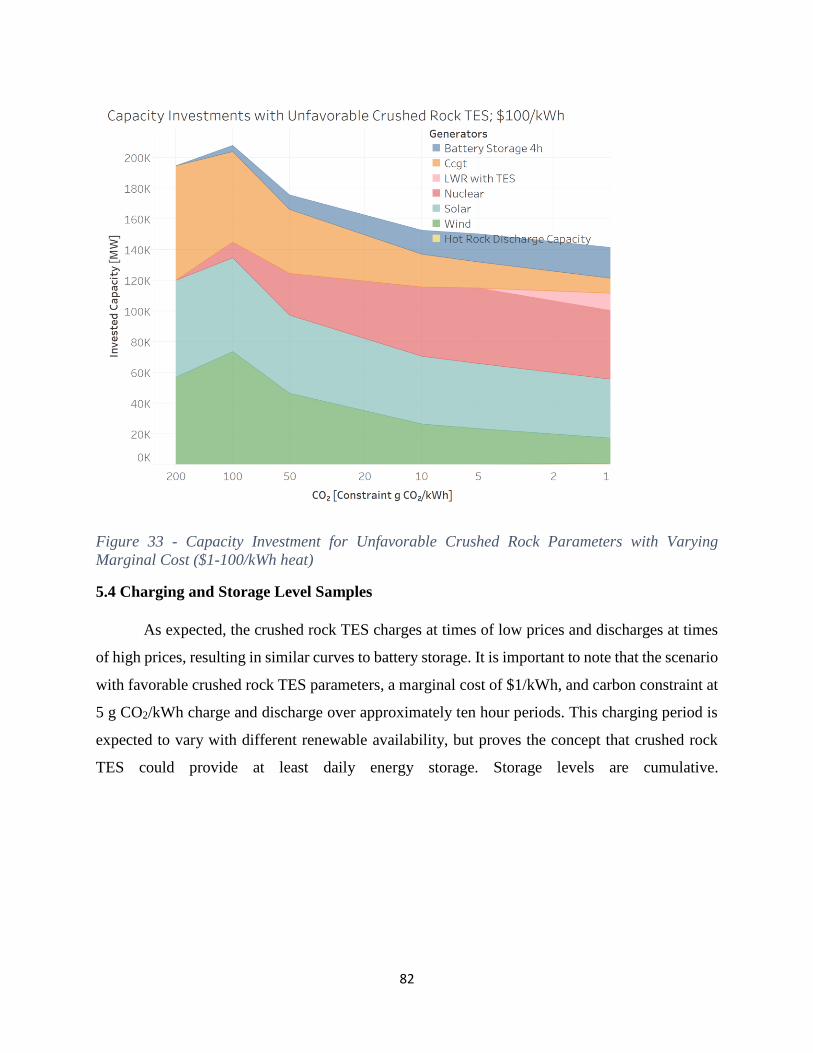
Figure 33 - Capacity Investment for Unfavorable Crushed Rock Parameters with Varying Marginal Cost
($1-100/kWh heat) ...................................................................................................................................... 82
Figure 34 - Crushed Rock Charging and Discharging Profiles and Battery Comparison Over 75 Hour
Window ....................................................................................................................................................... 83
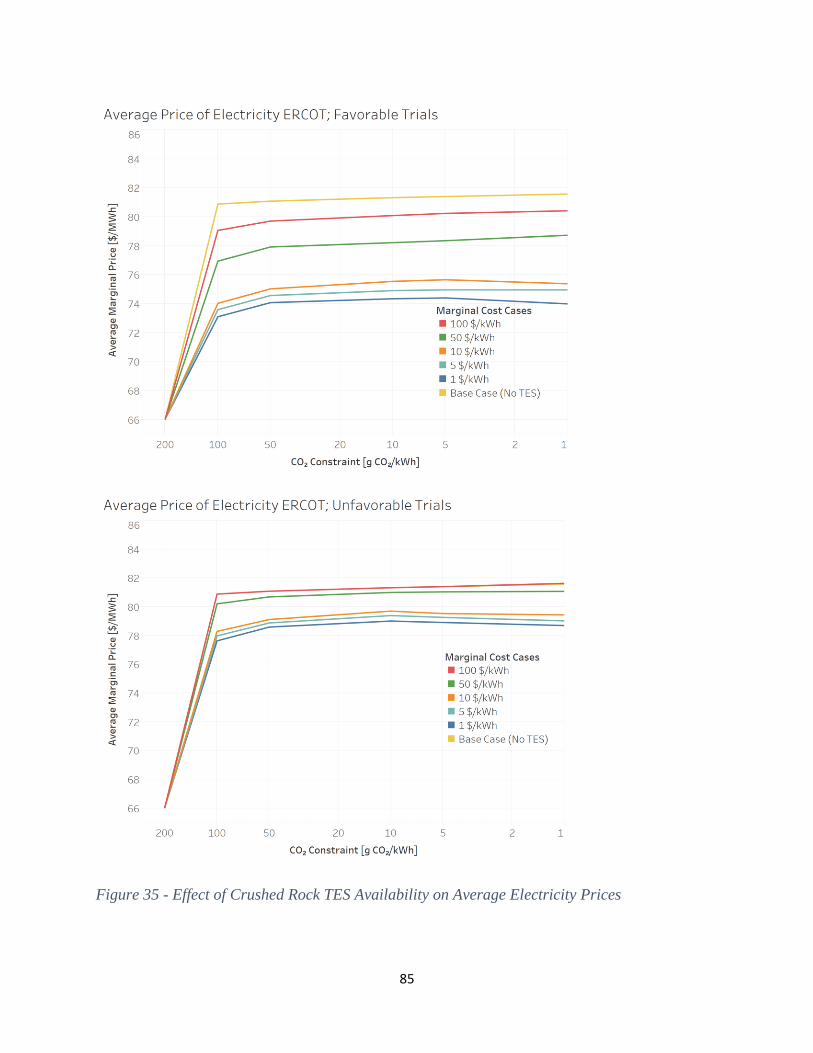
Figure 35 - Effect of Crushed Rock TES Availability on Average Electricity Prices ................................ 85
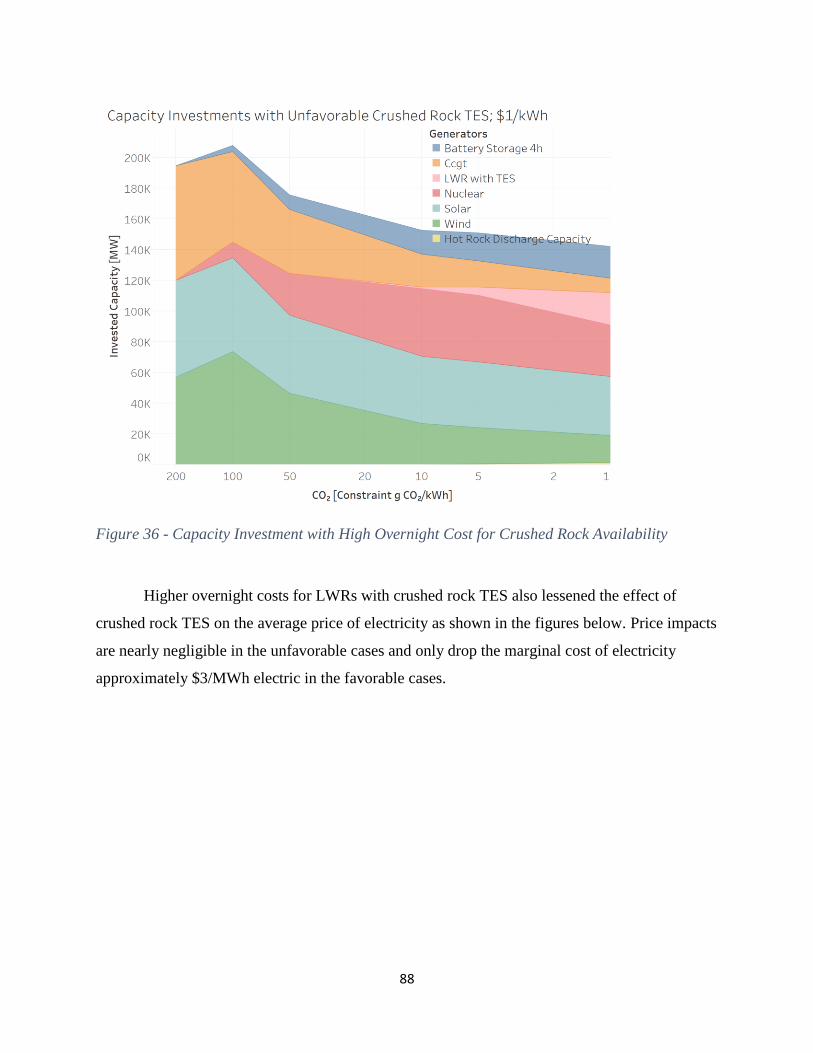
Figure 36 - Capacity Investment with High Overnight Cost for Crushed Rock Availability ..................... 88
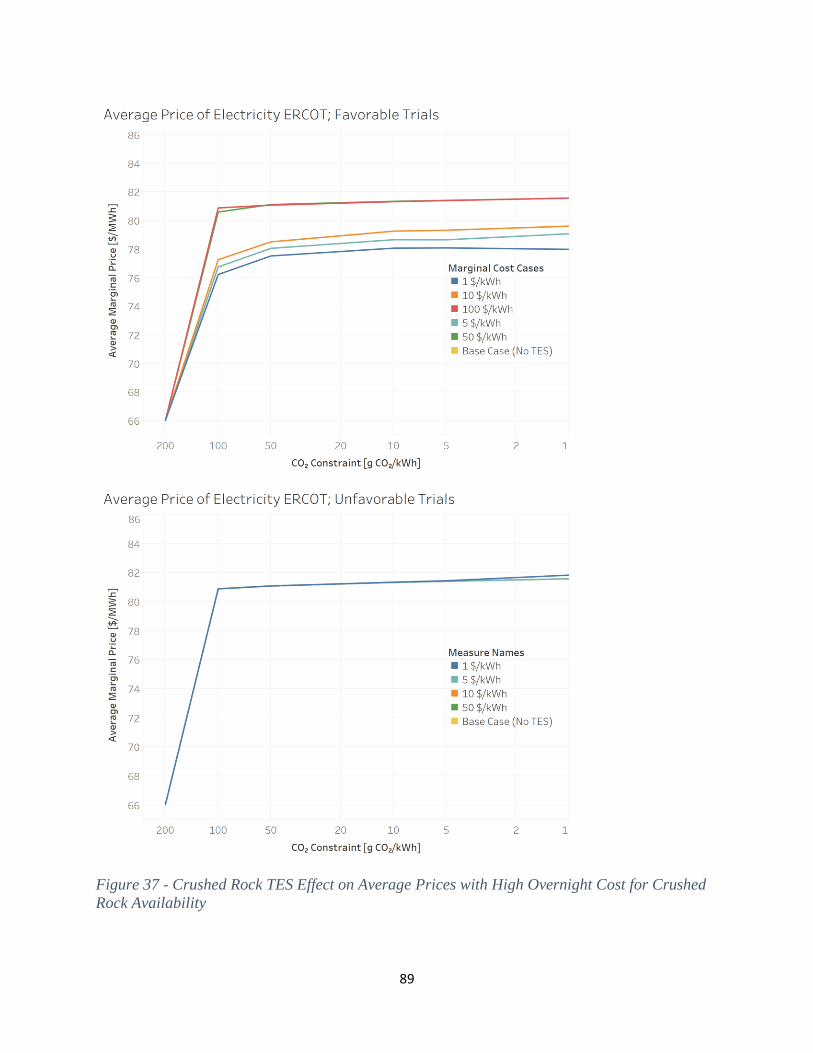
Figure 37 - Crushed Rock TES Effect on Average Prices with High Overnight Cost for Crushed Rock
Availability ................................................................................................................................................. 89
Page 9
9
List of Tables
Table 1 – Nomenclature for Engineering Estimates ................................................................................... 37
Table 2 - Parameters for LWR Base Case Formulation .............................................................................. 61
Table 3 - Variables for LWR Base Case Scenario ...................................................................................... 61
Table 4 - Constraints for LWR Base Case Scenario .................................................................................. 61
Table 5 - Parameters for LWR with Crushed Rock TES ........................................................................... 63
Table 6 - Variables for LWR with Crushed Rock TES .............................................................................. 63
Table 7 - Variables for LWR with Crushed Rock TES .............................................................................. 64
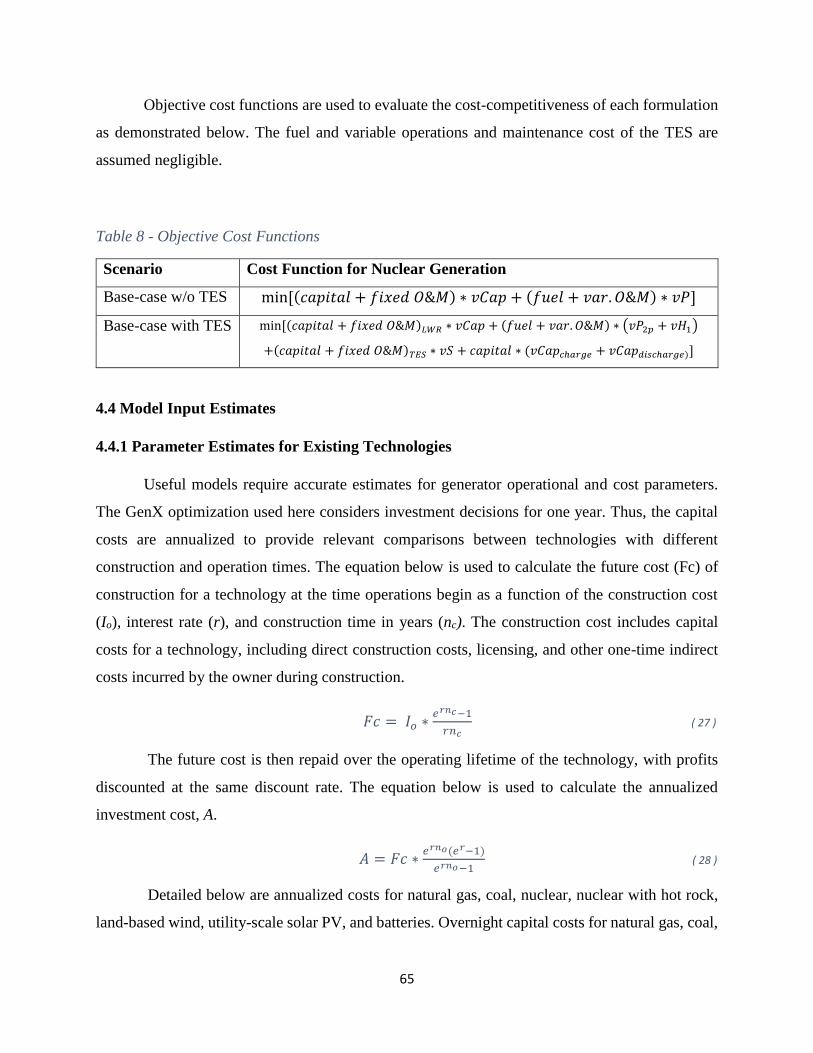
Table 8 - Objective Cost Functions............................................................................................................. 65
Table 9 – Annualized Cost Parameters for Generation Technologies ....................................................... 66
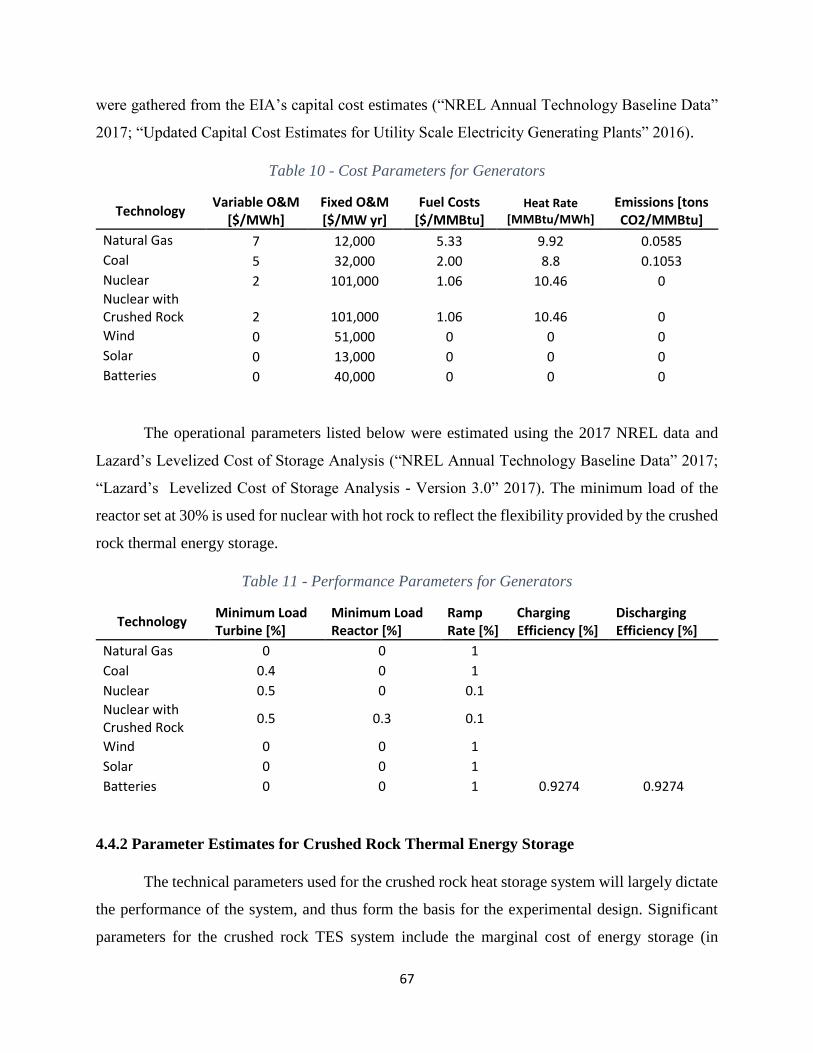
Table 10 - Cost Parameters for Generators ................................................................................................. 67
Table 11 - Performance Parameters for Generators .................................................................................... 67
Table 12 - Capacity Investments for Favorable Cases at 1 and 0 g CO2/kWh Constraint .......................... 74
Page 11
11
1. Introduction
1.1 Changing Energy Markets
Electricity markets have experienced significant changes in recent years due to both
technological developments and a growing emphasis on mitigating anthropogenic climate change.
These changes include an increasing shift towards renewable energy production in the forms of
wind and solar generation, increased digitization of the energy grid, and a lessening reliance on
fossil fuels. While such advancements are projected to limit future CO2 emissions, they may also
give rise to a fundamental change in the electricity grid that may require changes in energy policy.
Historically, energy production has centered on low-capital, high-fuel cost technologies;
producing more energy simply required burning more carbon based fuels. In contrast, low carbon
forms of energy production, wind, solar, and nuclear power, are high-capital, low-fuel cost
technologies. In order for these technologies to remain as economically favorable over their
lifetimes, they must operate at high capacity factors; operating nuclear reactors or wind farms at
half capacity effectively doubles their lifetime cost. In addition to this phenomenon, renewables
are intermittent, limiting their capability to match demand in real time. As a result, meeting energy
demand with renewables absent energy storage technology, if possible, could require massive
amounts of distributed renewable energy production.
The economic consequences of extensive renewable energy production without adequate
storage technology are severe. The price of electricity is set through a bidding system, whereby
the price reflects the lowest bid offered to meet energy demand at a certain time. Currently,
renewable generation plants offer bids at or near zero cost reflecting their marginal costs of
production, while fossil fuel burning plants effectively set the cost of electricity. Absent the
burning of fossil fuels, the market is dominated by high capital, low fuel cost energy, and the price
of electricity approaches zero or even negative costs in the presence of subsidies for renewables.
This revenue collapse described extensively in MIT’s Future of Solar Energy study eliminates the
incentive for investment in renewable energy sources (“The Future of Solar Energy” 2015). Figure
1 below illustrates the effect that extensive investment in solar energy has had specifically on the
price of energy in California, dropping to negative pricing during peak solar production. These
negative prices reflect how much gas turbine operators are willing to pay the grid in order to remain
Page 12
12
operating during peak solar production, enabling them to capitalize on high prices following the
solar peak.
Figure 1 - Price Collapse at Times of High Solar Production in California (“California Solar
Spike Leads to Negative CAISO Real-Time Prices in March” 2017)
In short, as fossil fuels are phased out in an effort to produce a greener energy grid, the
price of energy will drop, removing incentives to invest in renewable energy. Implementing energy
storage technology to stockpile energy at times of peak renewable production may provide a
market for the excess energy, allowing the energy to be sold later at a non-zero price.
1.2 Energy Storage and Crushed Rock
Generally, energy storage technologies either store energy as work or heat. Work storage
is favorable for technologies such as wind and solar photovoltaic (PV) generators whose primary
output is electricity, while thermal storage is favorable for technologies such as nuclear reactors
and concentrated solar thermal power systems which produce heat. The marginal cost of storing
thermal energy is lower than the marginal cost of storing electric energy as work, due in large part
to the complexity of the technology involved in storing energy as work, of which flywheels,
pumped-hydro, and batteries are examples. In addition to avoiding revenue collapse, thermal
energy storage when coupled to light water reactors (LWRs) has the added benefit of allowing
nuclear reactors to provide essential reliability services (ESR) and run at maximum capacity,
maintaining a low levelized cost of electricity (LCOE) for the high-capital-investment technology.
Page 13
13
Various thermal storage technologies exist today, all with varying costs, energy capacities,
and rate of energy charge and discharge. For instance, steam accumulators, are tanks of pressurized
water that are heated by steam to their boiling point. When valves are opened, the water flashes to
steam. Steam accumulators are used in some solar thermal plants for heat storage. This technology
functions ideally as a buffer in steam plants, allowing for rapid charge and discharge cycles on the
order of about a day’s worth of energy, but would not be suitable for larger storage capacities given
a high marginal cost of energy storage.(Charles Forsberg 2017) Geothermal heat storage systems,
on the other hand, may provide seasonal energy storage dependent on its location. Thus, while
daily and potentially seasonal variations in energy demand may be met through these technologies,
a significant technology gap exists on the scale of multi-day to weekly storage.
Figure 2 - Illustration of Technological Gap in Energy Storage
Crushed rock thermal energy storage (TES) may fill this technology gap, providing energy
storage capacities of gigawatt-hours with faster response than geothermal heat storage systems and
very limited geographic constraints.(C. W. . Forsberg, Curtis, and Stack 2017) The reasoning for
the low marginal cost of energy storage with crushed rock thermal storage is intuitive: the primary
material for the system is crushed rock, which is cheap, and the atmospheric operating conditions
impose few expensive technological constraints. Figure 3 below illustrates the conceptual model
of the crushed rock technology in the heating mode, whereby air is heated in a steam-air heat
exchanger before being circulated through a large bed of crushed rock from top to bottom. Heat is
recovered by reversing the flow.
Page 14
14
Figure 3 – Crushed Rock Thermal Energy Storage in Heating Mode
1.3 Structure of the Thesis
This thesis aims to answer the principal question of to what extent may crushed rock
thermal energy storage provide flexibility in energy supply and mitigate revenue loss in a low-
carbon energy grid primarily through the use of both engineering analysis and economic modeling.
Chapter 2 consists of a literature review on drivers towards a lower carbon energy grid and existing
energy storage technologies. Chapters 3 and 4 present the engineering analysis and economic
models used to evaluate the potential option space for crushed rock TES, respectively. Chapter 5
summarizes the results, and Chapter 6 presents the conclusions.
Page 15
15
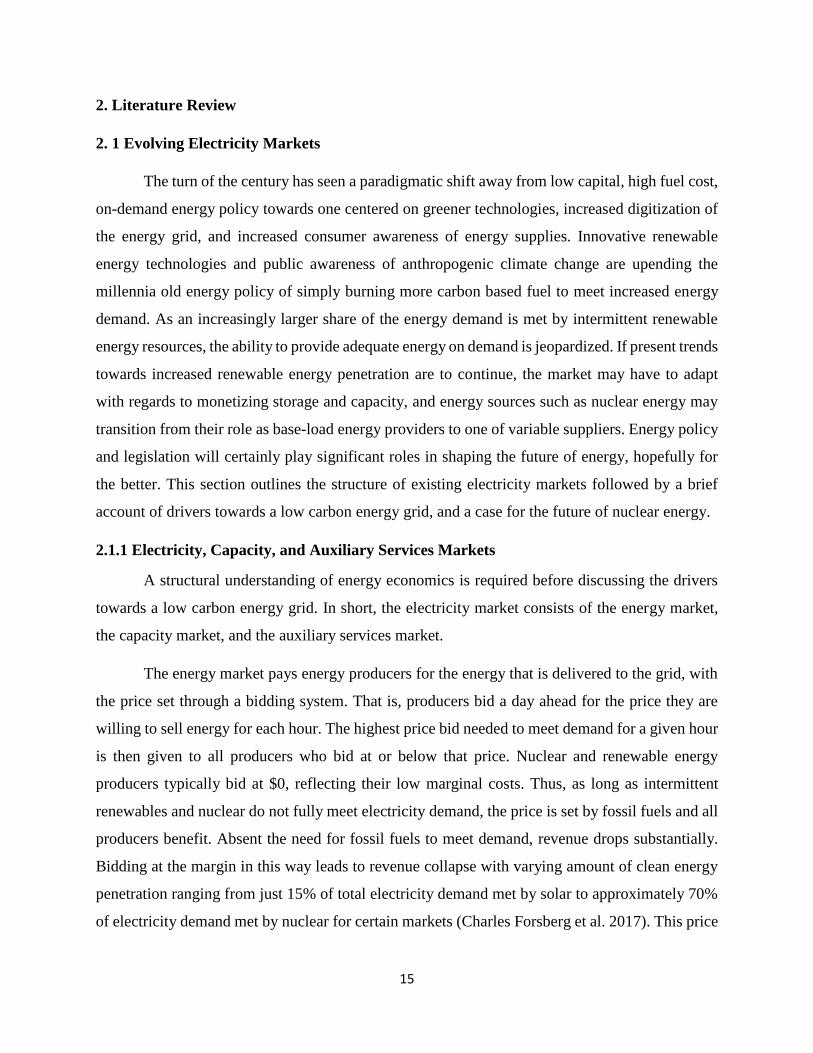
2. Literature Review
2. 1 Evolving Electricity Markets
The turn of the century has seen a paradigmatic shift away from low capital, high fuel cost,
on-demand energy policy towards one centered on greener technologies, increased digitization of
the energy grid, and increased consumer awareness of energy supplies. Innovative renewable
energy technologies and public awareness of anthropogenic climate change are upending the
millennia old energy policy of simply burning more carbon based fuel to meet increased energy
demand. As an increasingly larger share of the energy demand is met by intermittent renewable
energy resources, the ability to provide adequate energy on demand is jeopardized. If present trends
towards increased renewable energy penetration are to continue, the market may have to adapt
with regards to monetizing storage and capacity, and energy sources such as nuclear energy may
transition from their role as base-load energy providers to one of variable suppliers. Energy policy
and legislation will certainly play significant roles in shaping the future of energy, hopefully for
the better. This section outlines the structure of existing electricity markets followed by a brief
account of drivers towards a low carbon energy grid, and a case for the future of nuclear energy.
2.1.1 Electricity, Capacity, and Auxiliary Services Markets
A structural understanding of energy economics is required before discussing the drivers
towards a low carbon energy grid. In short, the electricity market consists of the energy market,
the capacity market, and the auxiliary services market.
The energy market pays energy producers for the energy that is delivered to the grid, with
the price set through a bidding system. That is, producers bid a day ahead for the price they are
willing to sell energy for each hour. The highest price bid needed to meet demand for a given hour
is then given to all producers who bid at or below that price. Nuclear and renewable energy
producers typically bid at $0, reflecting their low marginal costs. Thus, as long as intermittent
renewables and nuclear do not fully meet electricity demand, the price is set by fossil fuels and all
producers benefit. Absent the need for fossil fuels to meet demand, revenue drops substantially.
Bidding at the margin in this way leads to revenue collapse with varying amount of clean energy
penetration ranging from just 15% of total electricity demand met by solar to approximately 70%
of electricity demand met by nuclear for certain markets (Charles Forsberg et al. 2017). This price
Page 16
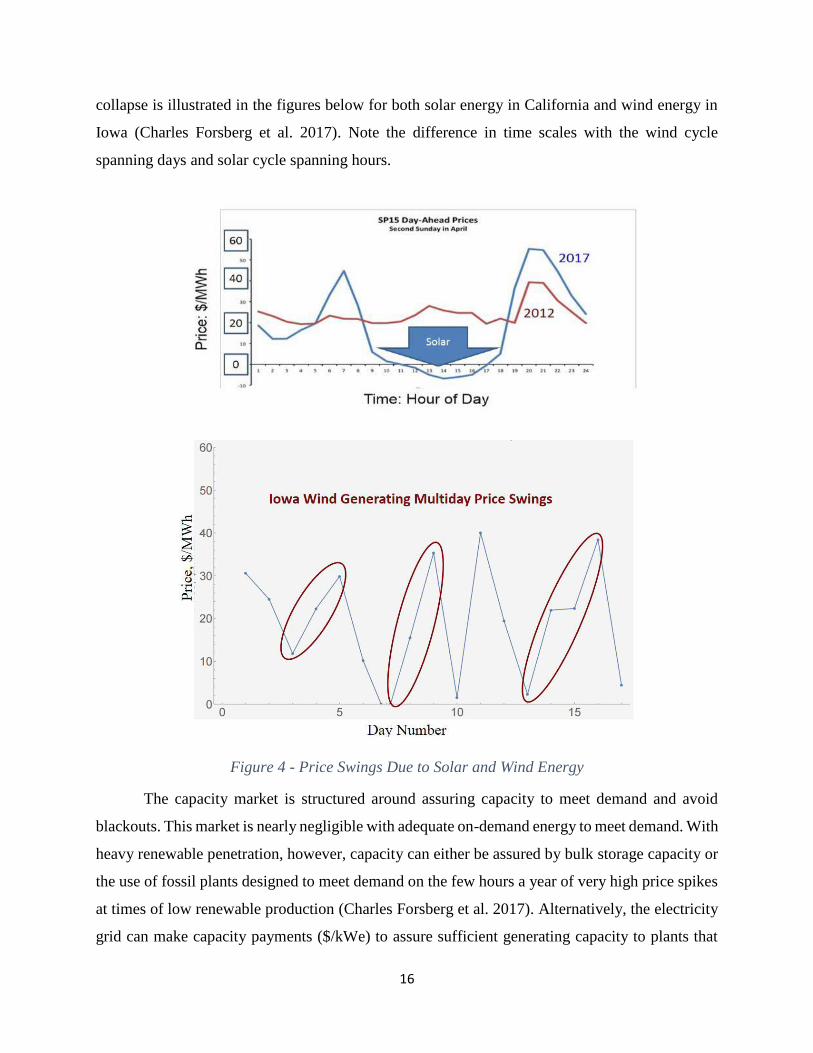
16
collapse is illustrated in the figures below for both solar energy in California and wind energy in
Iowa (Charles Forsberg et al. 2017). Note the difference in time scales with the wind cycle
spanning days and solar cycle spanning hours.
Figure 4 - Price Swings Due to Solar and Wind Energy
The capacity market is structured around assuring capacity to meet demand and avoid
blackouts. This market is nearly negligible with adequate on-demand energy to meet demand. With
heavy renewable penetration, however, capacity can either be assured by bulk storage capacity or
the use of fossil plants designed to meet demand on the few hours a year of very high price spikes
at times of low renewable production (Charles Forsberg et al. 2017). Alternatively, the electricity
grid can make capacity payments ($/kWe) to assure sufficient generating capacity to plants that
Page 17
17
can assure supply when needed. Most electricity plants in the United States have chosen to provide
capacity payments for assured electricity generation to avoid blackouts rather than see extreme
electricity prices at times or higher risks of blackouts.
The auxiliary services market accounts for electricity grid services such as frequency
control, maintaining spinning reserve, and black start. According to the 2017 DoE Staff Report on
Electricity Markets and Reliability, essential reliability services (ERS) will become increasing
important with increasing volatility in grid operations (U.S. Department of Energy 2017).
Increasing amounts of variable renewable energy sources and distributed energy resources (DER)
would increase volatility, and grid operators would face increasingly difficult challenges with
respect to maintaining grid reliability and resilience. A few energy storage technologies may be
able to provide these essential reliability services (ERS). However, the current revenue of these
markets is only a few percent of the cost of electricity.
2.2 Drivers towards a low-carbon energy grid
2.2.1 Changing supply and demand side technologies
Both technologies producing and consuming energy have drastically progressed over the
past few decades, both enabling more low-carbon energy production and increasing electric
demand, particularly in the transportation sector. As shown in the 2016 MIT Energy Initiative’s
Utility of the Future report, the price of key technologies for the decarbonization of the energy grid
have dropped drastically since 2008, allowing in part for 213 terawatt-hours of added global
renewable energy resources in 2015 alone (Ignacio Perez-Arriaga and Christopher Knittel 2016).
Page 18
18
Figure 5 - Cost Declines in Key Technologies, 2008-2014; MIT Utility of the Future
In addition to decreasing renewable costs and increased renewable market penetration, the
past few decades have seen changing energy demands, particularly in the transportation sector in
the form of electric vehicles (EVs). EVs complicate energy market dynamics by functioning as
both energy consumers and a distributed energy resource (Ignacio Perez-Arriaga and Christopher
Knittel 2016). Increased electrification of the transport sector would complicate demand, likely
increasing demand at night when EVs are charging and solar plants are not producing energy. A
recent study by the California Energy Commission has shown that EV charging times are likely to
peak with the rest of electricity demand in the early evening (“California Plug-In Electric Vehicle
Infrastructure Projections: 2017-2025” 2018). Such a confluence presents a threat to grid stability
and an opportunity for energy storage technologies to provide value. The figure below illustrates
the projected load profile for EVs on a typical weekday in California.
Figure 6 - Weekday Demand Load for EVs in CA
Page 19
19
2.2.2 Policies Promoting a Low Carbon Energy Grid
While the prices of green technologies have decreased substantially, the auto-cannibalistic
effect of renewable energy deployment, whereby the marginal cost of energy decreases with
increasing renewable energy penetration, cheap fossil fuels, and the inertia of carbon based energy
production all oppose the transition to a low carbon energy grid. Fortunately, international,
national, and state-level policies exist which in part offset these hindrances to a low-carbon grid.
Yet, many existing policies disproportionately favor renewable resources to other low carbon
energy sources, such as nuclear energy. Legislation holistically promoting greener energy and
storage technologies could accelerate the transition to a low carbon energy grid, while mitigating
revenue collapse and intermittency concerns at the same time. A few of the existing policies
supporting the transition to a low carbon energy grid are presented below.
The Renewable Electricity Production Tax Credit (PTC), administered by the U.S. Internal
Revenue Service, is a federal policy which provides a tax credit to wind generators commencing
construction by December 31, 2019 of $0.015 per kWh in 1993 dollars. With adjustment for
inflation and the 20% step-down as required by the Consolidated Appropriations Act, 2016, the
2017 calendar year credit was equivalent to $0.019 per kWh (H.R. 2029 Consolidated
Appropriations Act 2016; “Renewable Electricity Production Tax Credit (PTC) | Department of
Energy” 2018). Policies such as the PTC certainly promote the expansion of wind energy, but do
not benefit other clean sources of energy production, such as nuclear energy.
The Renewables Portfolio Standard (RPS) is an example of a state level policy.
California’s RPS has a target of 50% of retail sales derived from eligible renewable energy
resources in 2030 and all subsequent years (“RPS Homepage” 2018). Nuclear energy is a low-
carbon energy resource, but not a renewable energy resource, thus disqualifying it for the RPS.
The Paris Agreement or Paris Climate Accord is an example of an international agreement
intent on curbing carbon emissions worldwide. The Agreement serves as a formal recognition of
anthropogenic climate change and a document of good will towards limiting climate change with
benchmark goals based on degrees of temperature elevation above pre-industrial levels (“The Paris
Agreement - Main Page” 2018). Currently 173 countries have ratified the agreement, with the U.S.
State Department having officially announced its withdrawal (Reuters 2017). According to the
Agreement, however, the earliest effective withdrawal date for any country is November 4th, 2020
Page 20
20
(“The U.S. Won’t Actually Leave the Paris Climate Deal Anytime Soon - The New York Times”
2017). Compared to the state and federal level policies in the United States, the Paris Agreement
lacks enforcement measures or economic incentives, but rather relies on political capital between
the countries. Countries that are party to the agreement are required to regularly report on their
emissions and implemented strategies to further reduce carbon emissions, but policy enforcement
and regulatory bodies are lacking.
2.3 Economic Prospects for Nuclear Energy Today
The largest barrier to nuclear energy other than fear of historic events and radiation is
simply the economics of building new nuclear power plants. Nuclear power plants require huge
capital costs that have only increased as a confluence of the intense regulatory state and increasing
construction times for nuclear technology, specifically in the United States. Today, nuclear energy
is not competitive with fossil fuels in the United States. Severe policies which monetize the
negative externalities of CO2 emissions, such as a carbon tax, may upend this paradigm. The
levelized cost of electricity (LCOE) “represents the constant and theoretical cost of every kWh
produced by an energy generation system along its useful life,” and is often used to compare the
costs of energy producing systems (Talavera et al. 2016). Through using the LCOE, energy
systems with high initial capital investments, such as nuclear reactors, can be meaningfully
compared to energy production systems with low initial capital requirements and high fuel costs,
such as coal plants. Figure 1 below was taken from a report by the International Energy Agency
(IEA), in which they demonstrated how economically competitive nuclear energy would be if the
externality of CO2 emissions was properly captured at $30/ton of CO2 (Projected Costs of
Generating Electricity, 2015).
Page 21
21
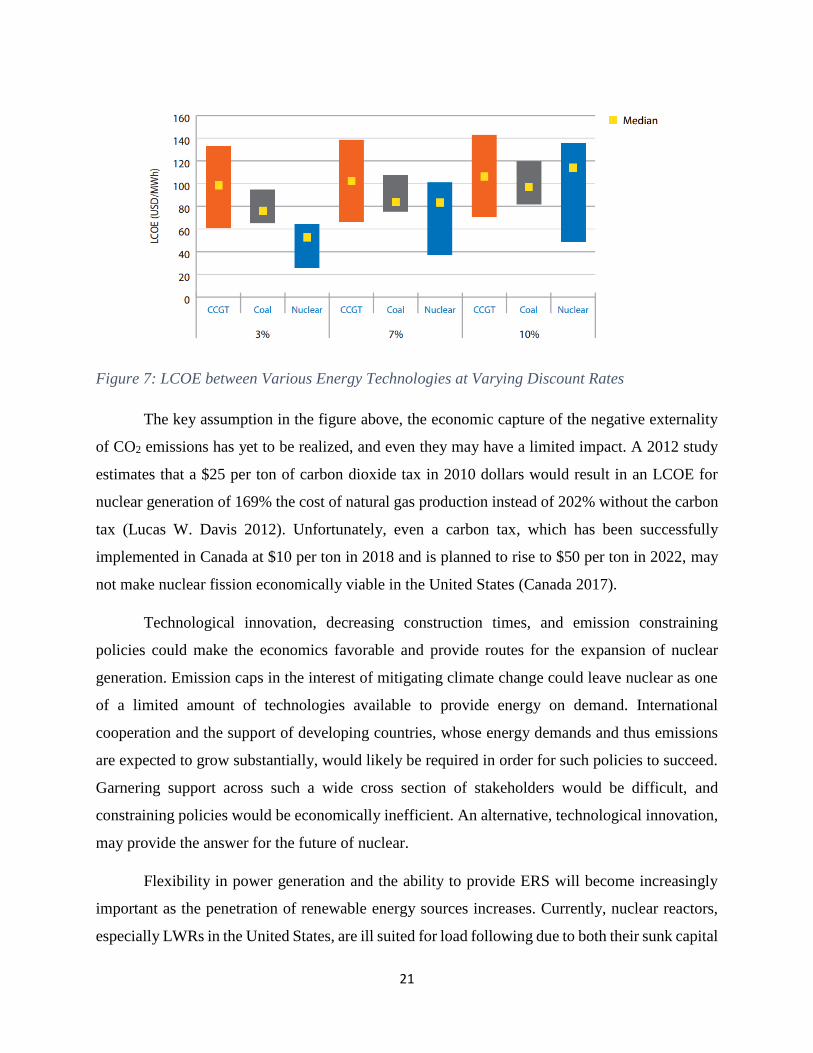
Figure 7: LCOE between Various Energy Technologies at Varying Discount Rates
The key assumption in the figure above, the economic capture of the negative externality
of CO2 emissions has yet to be realized, and even they may have a limited impact. A 2012 study
estimates that a $25 per ton of carbon dioxide tax in 2010 dollars would result in an LCOE for
nuclear generation of 169% the cost of natural gas production instead of 202% without the carbon
tax (Lucas W. Davis 2012). Unfortunately, even a carbon tax, which has been successfully
implemented in Canada at $10 per ton in 2018 and is planned to rise to $50 per ton in 2022, may
not make nuclear fission economically viable in the United States (Canada 2017).
Technological innovation, decreasing construction times, and emission constraining
policies could make the economics favorable and provide routes for the expansion of nuclear
generation. Emission caps in the interest of mitigating climate change could leave nuclear as one
of a limited amount of technologies available to provide energy on demand. International
cooperation and the support of developing countries, whose energy demands and thus emissions
are expected to grow substantially, would likely be required in order for such policies to succeed.
Garnering support across such a wide cross section of stakeholders would be difficult, and
constraining policies would be economically inefficient. An alternative, technological innovation,
may provide the answer for the future of nuclear.
Flexibility in power generation and the ability to provide ERS will become increasingly
important as the penetration of renewable energy sources increases. Currently, nuclear reactors,
especially LWRs in the United States, are ill suited for load following due to both their sunk capital
Page 22
22
costs and the stresses induced by ramping reactor powers (U.S. Department of Energy 2017). At
the same time, LWRs are the best understood nuclear technology in the United States, having
benefited from decades of learning curves and a wealth of network information (Robin Cowan
1990). Coupling high-capital cost energy generation technologies, such as LWRs, to thermal
energy storage (TES) could afford nuclear generation the flexibility in operation to provide ERS
and become economically competitive in the presence of renewables. This would maximize
electricity sales at times of highest prices (see Fig. 4).
2. 4 Energy Storage
2.4.1 Utility of Storage Technologies
Storage technologies have the ability to mitigate intermittency, match supply to demand,
provide ERS, and smooth the energy output of nuclear generation in particular, which benefits
from operating at its rated capacity. Recent advancements in both renewables and storage
technologies have led to an increase in studies concerning the value of energy storage. A report
from the Imperial College of London estimates, as expected, that value of energy storage
technologies increases with increasing renewable energy penetration, potentially saving 10 billion
pounds per year by 2050 in the United Kingdom (Goran Strbac et al. 2012). The report notes as
well that the optimal composition of energy storage technologies differs according to regional
availability of renewable energy resources, with bulk storage likely providing the most value in
Scotland and distributed storage dominating the southern regions(Goran Strbac et al. 2012). Thus,
for any given grid, determining the optimal energy storage portfolio and how to reward investors
to appropriately reflect the value of storage are two of the most challenging questions which must
be answered.
More recently, a group of researchers from the MIT Energy Initiative sought to answer the
question of how different energy storage technologies should be compared (Braff, Mueller, and
Trancik 2016). In short, the value of any energy storage system depends on their technical
properties, such as their separate energy and power costs, intended applications, and regions and
times at which they may operate. No single energy storage technology today is optimal across all
dimensions, making any standalone comparison of energy storage systems both difficult and
counterproductive. Thus, energy storage must be evaluated in concert with energy providers and
consumers. Energy generators maximize efficiency by coupling to storage technologies based on
Page 23
23
the form of energy stored, opting to store at an equal or higher energy quality. That is, photovoltaic
solar (PV solar) and wind generation typically couple to electric storage systems such as batteries,
while concentrated solar power (CSP) and nuclear generation could couple to thermal or electric
storage systems.
In the specific context of nuclear technology, energy storage could allow for a low-carbon
combination of technologies which could provide other essential reliability services. The figure
below from the 2017 DoE Staff Report on Electricity Markets and Reliability illustrates the
reliability attributes provided by each major energy producing technology as well as batteries and
storage. Clearly, no single technology provides every attribute, with hydro generation, which is
geographically constrained, coming the closest. However, a combination of nuclear generation and
energy storage would at least partially provide each attribute from frequency response to fuel
assurance and flexibility.
Page 24
24
Figure 8 - Chart of Energy Technology Attributes (U.S. Department of Energy 2017)
2.4.2 Examples of Storage Technologies
A wealth of energy storage options exists today, and the valuation of each technology is
complex. A few examples of energy storage technologies, both electric and thermal, are listed
below to elucidate the distinguishing features which determine the range of storage utility. Further
information on the thermal storage options listed below may be found in the 2017 Light Water
Reactor Heat Storage for Peak Power and Increased Revenue Workshop Proceedings (Charles
Forsberg et al. 2017).
Lead acid batteries currently dominate the distributed energy storage installations globally,
but lithium-ion batteries are emerging as the favored form of electrical energy storage for electrical
vehicles and other distributed applications coupled to renewable energy sources (Ignacio Perez-
Page 25
25
Arriaga and Christopher Knittel 2016). The cost of lithium-ion battery packs without accounting
for electronics has reportedly dropped 14 percent between 2007 and 2014, and has been projected
to possibly fall to below $100 per kilowatt-hour electric by 2022 (Ignacio Perez-Arriaga and
Christopher Knittel 2016). While these price reductions represent a progression towards more
affordable battery storage, they do not indicate that batteries storage will be cheaper than other
forms of storage. Crushed rock TES, for example, has an estimated cost less than $10 per kilowatt-
hour of thermal energy (C. W. Forsberg, Curtis, and Stack 2017). The figure below illustrates the
competitive cost of lithium-ion batteries relative to other battery technologies with a diesel
generator for comparison (Ignacio Perez-Arriaga and Christopher Knittel 2016).
Figure 9 - LCOS for Various Technologies in Commercial and Industrial Application in $/MWhe
One major advantage of lithium-ion batteries is its energy density relative to other energy
storage systems. The current U.S. Advanced Battery Consortium’s (USABC) target for electric
vehicle battery pack density is 235 Wh/kg by 2020 (Li et al. 2017). Crushed rock TES may cost
very little relative to lithium-ion batteries in regards to energy storage, but exhibits poor properties
for energy storage in transportation. Lithium-ion batteries will very likely continue to grow in
popularity, especially coupled to electric vehicles and distributed energy resources, such as roof
mounted solar panels where minimizing weight or size is important, but may not be ideal for bulk
energy storage, where these characteristics are not important.
Many TES options exist today, or are in development. Most of these technologies rely on
storing energy and recovering energy by means of a phase change or through conduction and
convection.
Page 26
26
Steam accumulators store heat as high-temperature, high-pressure water, which is then
flashed to steam to power a turbine generator. Steam accumulators are well-suited for CSP designs
where steam is generated in pipes located at the foci of parabolic or Fresnel reflectors (Charles
Forsberg et al. 2017). Due to the highly pressurized vessels, steam accumulators may exhibit
higher marginal energy storage costs relative to atmospheric systems, and are ideal for rapidly
supplying energy. Thus, steam accumulators could increase the short term flexibility of a nuclear
plant, but would not be an ideal technology for balancing weekly energy demand. This technology
is deployed at some concentrated thermal solar power plants.
Heat storage (oil, salt, etc.) in secondary low-pressure media provides a lower pressure
alternative form of energy storage. This form of sensible heat storage involves heating a secondary
fluid, and storing that fluid for later use. Many CSP plants use sensible heat storage in the form of
molten salts, which can either be thermoclines or two-tank systems (Charles Forsberg et al. 2017).
Sensible heat in solar power towers has been demonstrated up to the GWh scale. Westinghouse is
developing a modular sensible heat TES system for nuclear reactors with each unit storing 1 MWh
of electricity (Charles Forsberg et al. 2017). Westinghouse’s design utilizes oil as a heat transfer
fluid, which is used to heat concrete as a primary heat storage solid.
Cryogenic liquid air storage stores energy by liquefying air, and recovers energy through
the evaporation and expansion of the fluid. If only warm cooling water from the nuclear plant or
other low-temperature heat source is used, the estimated round-trip efficiency of a stand-alone
system is around 60%, with potentially higher efficiency if steam is used to heat the air to higher
temperatures (Charles Forsberg et al. 2017). In theory, cryogenic liquid air storage could couple
to most reactor types.
Pressurized counter-current condensing-steam solid heat storage is similar to both steam
accumulators and sensible heat storage, only heat is stored in a packed bed of solid pebbles under
pressure before transferring the energy to water as the working fluid. The system is charged
through the injection of steam, which condenses to water at high temperature, and discharged by
filling the packed bed from the bottom with liquid water. While a pressurized, packed-bed TES
Page 27
27
may face relatively high capital costs, it should theoretically exhibit a very high round-trip
efficiency (Charles Forsberg et al. 2017).
Nuclear geothermal heat storage may provide enough energy storage to balance seasonal
demand. In short, a nuclear geothermal heat storage system would consist of injecting hot water
into a reservoir, heating the rock. Water can then be recirculated to recover the stored heat. While
deep rock cannot be insulated, the storage size scales cubically, while the ambient losses to the
surroundings scale squarely. Thus, as the scale increases, the ambient losses become decreasingly
important. It is significant to note that geothermal heat storage cannot be built anywhere, but rather
depends on site geology (Charles Forsberg et al. 2017). Thus, nuclear geothermal heat storage
cannot balance energy demand everywhere.
Together these energy storage technologies present a wide option space for storing energy
when coupled to a nuclear reactor, but leave a considerable technology gap in providing multi-day
energy storage capacity. Geothermal energy storage may be able to meet seasonal and even weekly
variations in demand, but requires suitable geological conditions.
Figure 10 - Illustration of Technological Gap in Energy Storage
2.5 Crushed Rock Thermal Energy Storage
Crushed rock TES coupled to a nuclear reactor may fill this technology gap without
geological constraints, allowing balancing of multi-day renewable energy cycles as seen with wind
Page 28
28
generation in Iowa. Below is a summary of the technological concept followed by existing work
related to crushed rock TES.
A hot rock energy storage system [McLauchlan, Appendix C; Forsberg, 2017a] is similar
in concept to a packed bed energy storage system except that it operates at atmospheric pressure.
A volume of crushed rock with air ducts at the top and bottom is created (Fig. 3.11). To charge
the system, air is heated using a steam-to-air heat exchanger delivering heat from the reactor, then
the air is circulated through the crushed rock heating the rock. To discharge the system, the airflow
is reversed, and cold air is circulated through the crushed rock. The discharged hot air can be used
to (1) produce steam for electricity or industry or (2) hot air for collocated industrial furnaces to
reduce natural gas consumption.
Figure 11 - Crushed Rock Thermal Energy Storage in Heating Mode
Heat storage systems are only charged at times of very low electricity prices. There is the
option with this system to first heat the air with a steam-air heat exchanger and then further heat
the air with electric resistance heating. LWR steam peak temperatures are near 300°C—well below
the temperature limits of the crushed rock. Higher temperatures improve system efficiency and
reduce costs. This can substantially boost rock temperatures and the efficiency of converting hot
air back to electricity, and reduce capital costs. Near atmospheric operating conditions increase
safety and reduce storage costs.
Page 29
29
The economics may allow hourly, daily, and weekly storage. The longer storage times may
be possible due to the very low incremental heat storage cost for crushed rock—far lower than any
of the previous options that have been discussed. As such this technology can address the weekday
weekend storage challenge where energy demand goes down on weekends but the production of
wind, solar and nuclear does not if these facilities are operated at their full capacity. It is a storage
technology that could potentially receive capacity payments for assured generation of electricity.
With proper selection of rock for the expected peak temperatures, this storage system should be
able to couple to most other reactors. The possible exception may be very high temperature reactors
where finding suitable rock for such high temperatures may be difficult.
2.5.1 Related Work
Much of the engineering knowledge required to construct this large TES system has been
developed through similar existing projects. A few companies and research groups have conducted
work relating to Hot Rock TES to varying degrees, particularly in the development of thermal
energy storage options for concentrated solar power.
Siemens Gamesa has begun a project to install hot rock heat storage in Germany to store
wind energy. Unlike Hot Rock TES coupled to nuclear reactors, the Siemens project plans to use
resistance heaters to heat airflow into an 800 cubic meter pile of crushed rock (“Siemens Gamesa
Starts Construction Of Heat Rock-Fill Storage For Wind Energy” 2017). While this storage system
is designed to provide approximately 30 MWh of electricity, Hot Rock TES coupled to nuclear
reactors may provide tens of gigawatt-hours of electricity. The figure below presents a schematic
design for the Siemens project.
Page 30
30
Figure 12 – Siemens Gamesa System (“Siemens Gamesa Starts Construction Of Heat Rock-Fill
Storage For Wind Energy” 2017)
REDLEAF Resources Inc. is an oil shale company based in Utah, which is developing a
large test bed for recovering fuel from a large pile of oil shale(“Red Leaf Resources, Inc. |” 2017).
Crushed shale is heated with hot gases to decompose the solid kerogen in the shale to liquid and
gaseous fuels. Oil shale volume shrinks as the kerogen decomposes. While this testbed may be
representative of the potential size of the Hot Rock TES coupled to nuclear reactors, significant
design differences limit the utility of REDLEAF’s findings. The primary distinction comes in the
form of thermal cycling and materials of interest. Whereas Hot Rock TES will cycle potentially
hundreds of times a year, the REDLEAF oil shale capsule is designed for the sole purpose of
recovering fuel and will be heated one time. Thus, the pile will shrink substantially in size
throughout the thermal loading as solid kerogen is converted to oil, and the process will not bring
light to the effects of repeated thermal loading on a Hot Rock TES using granite.
Crushed Rock Thermal Storage for Concentrated Solar Plants has gained traction as a field
of study, namely in South Africa, Switzerland, Australia, and Morocco(Laubscher, von
Page 31
31
Backstro¨m, and Dinter 2017; Jemmal, Zari, and Maaroufi 2016; Barton 2013; Ha¨nchen,
Bru¨ckner, and Steinfeld 2011). Unlike photovoltaic (PV) solar energy, concentrated solar power
(CSP) produces power primarily in the form of heat by concentrating sunlight. Thus, thermal
energy storage is attractive to CSP systems for many of the same reasons as with nuclear.
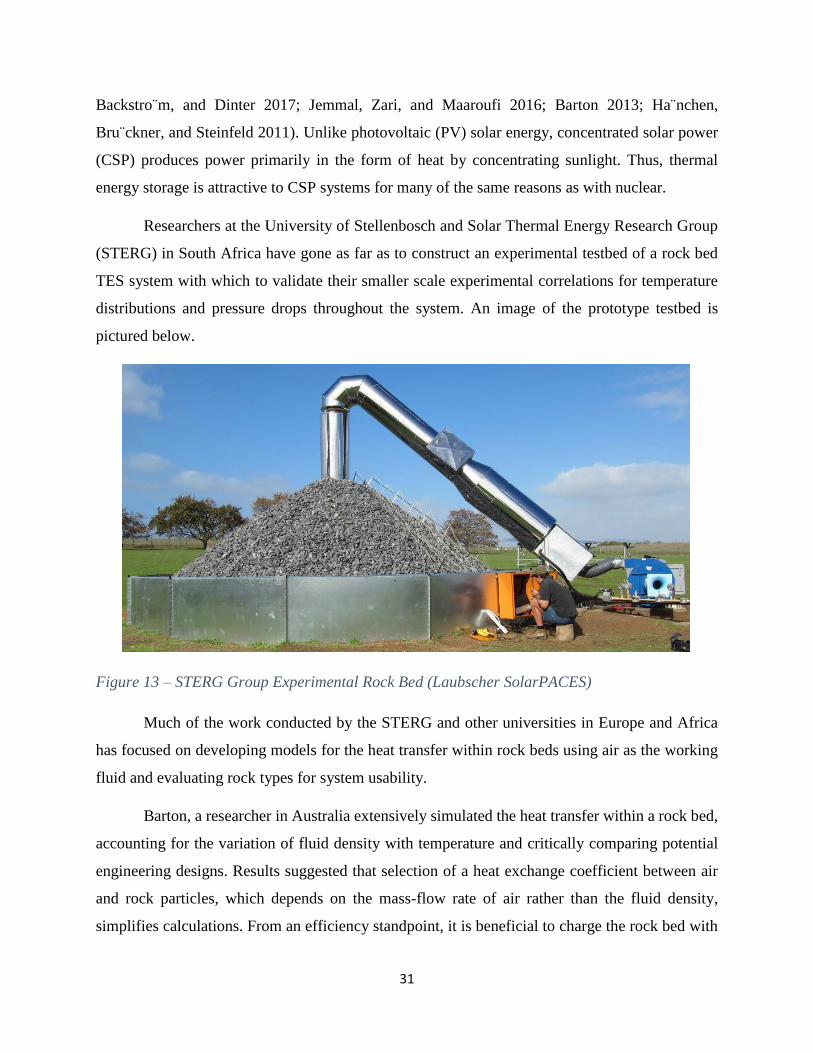
Researchers at the University of Stellenbosch and Solar Thermal Energy Research Group
(STERG) in South Africa have gone as far as to construct an experimental testbed of a rock bed
TES system with which to validate their smaller scale experimental correlations for temperature
distributions and pressure drops throughout the system. An image of the prototype testbed is
pictured below.
Figure 13 – STERG Group Experimental Rock Bed (Laubscher SolarPACES)
Much of the work conducted by the STERG and other universities in Europe and Africa
has focused on developing models for the heat transfer within rock beds using air as the working
fluid and evaluating rock types for system usability.
Barton, a researcher in Australia extensively simulated the heat transfer within a rock bed,
accounting for the variation of fluid density with temperature and critically comparing potential
engineering designs. Results suggested that selection of a heat exchange coefficient between air
and rock particles, which depends on the mass-flow rate of air rather than the fluid density,
simplifies calculations. From an efficiency standpoint, it is beneficial to charge the rock bed with
Page 32
32
downward airflow and discharge with upwards flow, rather than charge and discharge both via
upward flow(Barton 2013). This comparative advantage increases with increasing bed depth and
decreasing mass flow rates. Barton has determined that the storage efficiency for the two-way
system can be as high as 95% (Barton 2013).
Hanchen et al. conducted a similar heat transfer analysis for a rock bed using crushed
steatite (a compact form of talc) and charging to temperatures up to 800 °C with daily 6-hour
charge and 6-hour discharge cycles. The authors found that the system reached a cyclic steady
state after about twenty daily cycles. From an engineering perspective, the highest overall
efficiency was found with the smallest rock particles. As well, there seems to be a trade-off
between the capacity factor and overall efficiency with high air mass-flow rates and low storage
heights leading to the high capacity factors but decreased overall efficiencies (Ha¨nchen,
Bru¨ckner, and Steinfeld 2011).
Researchers from the Moroccan Foundation for Advanced Science Innovation and
Research (MAScIR), Mohammed V University, and the University of Stellenbosch have
conducted research on various rock types for use in rock bed thermal energy storage. Jemmal et
al. extensively studied the characteristics of two varieties of Moroccan gneiss rock up to
temperatures as high as 1000 °C. The authors concluded that both types of the rock have good
thermal stability up to 550 °C (Jemmal, Zari, and Maaroufi 2016). Allen et al. determined that, in
general, non-foliated rock is preferable to foliated rock, and that dolerite withstood the effects of
thermal cycling better than granite (Allen et al. 2014). As well, the authors determined that some
types of sedimentary rock may be suitable for use in a rock bed thermal energy storage system
(Allen et al. 2014).
Swiss Adiabatic Compressed Air Storage represents another field of study with many
common concerns as for crushed rock TES. A pilot project in the Swiss Alps, contracted by the
Swiss Federal Office of Energy, is assessing the suitability of caverns for compressed air storage
with thermal energy storage to take advantage of renewable energy fueled energy arbitrage
opportunities at low cost. One of the chief objectives of the pilot project is to understand the
behavior of rock under cyclic charging and discharging operations as well as its suitability to house
thermal energy storage (Giw Zanganeh 2016). The pilot plant currently exists, and the answers
Page 33
33
that this project may provide are certainly relevant to crushed rock thermal energy storage.
However, data gathered from the pilot plant are proprietary.
2.5.2 Considerations for Coupling Crushed Rock TES to Nuclear Reactors
Reactor Constraints
Nuclear reactors are a high capital, low variable cost energy producer. Operating reactors
at the maximum operating capacity thus maximizes their lifetime value. That is, operating a reactor
at half capacity effectively halves its lifetime value. Likewise, startup and shutdown processes
increase operational costs, and should be avoided where possible. These constraints carry
significant implications for coupling reactors to any form of thermal energy storage. Primarily, a
minimum amount of steam must drive the primary steam turbine providing energy to the grid in
order to avoid turbine startup and shutdown costs, as well as delays. This minimum value of steam
to generation depends heavily on the specific reactor in question, but likely ranges from 30-70%,
with new plants easily designed to operate at 30% of full load (Charles Forsberg et al. 2017). That
is, the minimum value of steam generation is a product of design goals rather than technological
constraints. Additionally, steam turbine efficiency decreases with decreasing loads. Thus,
determining the optimal amount of steam flow to thermal energy storage systems will depend on
the price of electricity, the efficiency of the turbine as a function of generation, and minimum
generation constraints.
Reactor designs will also determine operating parameters such as the outlet temperature.
Crushed rock TES may be suited for pressurized light water reactors (LWRs) as well as higher
temperature reactors, as indicated by the range of thermal stability for rock types demonstrated by
groups studying crushed rock TES for CSP. The rock type selected for use in crushed rock TES
should depend on local availability to minimize costs and thermal stability for the expected
temperature range and thermal cycling. Possible inlet temperatures to the crushed rock TES system
could range from 300°C for LWRs to approximately 700°C for HGTRs and FHRs (Neil Todreas
and Mujid Kazimi 2011).
Interface Constraints
Page 34
34
When sending steam from the reactor to the hot rock, the steam is sent to a steam-air heat
exchanger where the steam is condensed while air is heated. When going in the reverse direction
there are two options. First, the steam-air heat exchanger may operate in reverse with the hot air
producing excess steam from the reactor prior to the turbine hall. Second, a separate and
customized steam air heat exchanger could be used. Design decisions will depend on priorities,
namely capital costs and efficiencies. The first option incurs a lower capital cost than the second
since the same equipment is used in both directions, but the second option allows for each
exchanger to be optimized for its function. There would also be a significant size difference
between the two exchangers, with the steam-air heat exchanger being roughly three times as large
as the air-steam heat exchanger. This sizing difference would occur since large amounts of steam,
perhaps as high as 70%, would be diverted to storage at times of low electricity prices, but peaking
power from the thermal storage would be limited to 10-25% of the turbine capacity.
Energy Storage Independence and Integration
Energy storage systems may couple to nuclear reactors with varying degrees of
independence. On one extreme, a storage system may couple to a completely independent turbine
generator. Alternatively, the system could feed steam into the reactor turbine or feedwater heaters.
The decision of whether to construct a separate turbine and generator or use existing machinery
depends on existing equipment and desired electric output to the grid. Existing reactors may be
able to increase the maximum electric output by 5-10% of the base-load power, whereas
independent generators are not constrained to operate near base-load. Disadvantages to integrating
storage systems with generators include limits to maximum peak power of approximately 10%
above base-load power for existing turbines or 25% for new turbines, with an accompanying loss
in turbine efficiency either at base-load or when peaking (Charles Forsberg et al. 2017). That is, a
turbine optimized for output at 125% the rated capacity of a reactor will suffer an efficiency loss
when operating at the reactor’s rated capacity.
Diverting Steam for Process Heat
Precedent exists for the feasibility of splitting steam from nuclear production for multiple
purposes. In countries such as Russia, Switzerland and Canada, nuclear plants have long provided
variable electricity to the grid and steam to industry or district heating. This has not been the
custom in the United States. In 2005, Fort Calhoun Nuclear Power Plant owners investigated
Page 35
35
diverting steam to supply process heat to Cargill for processing corn. The project involved cost
analyses, engineering assessments, and conversations with the Nuclear Regulatory Commission
(NRC), which concluded the diversion would have no significant impact on safety(Charles
Forsberg et al. 2017).
Estimating the Cost of Turbine Halls
Data also exists for estimating the cost of constructing oversized turbine halls. A report
from Idaho National Labs indicates that the capital costs, including labor, of a complete turbine
hall in terms of 2006 costs amounts to roughly $500 per kilowatt of capacity (“Power Cycles for
the Generation of Electricity from a Next Generation Nuclear Plant” 2010). Constructing a
marginally larger turbine hall would likely cost hundreds of dollars per kilowatt of capacity, with
most components remaining unchanged, save for the actual turbine and generator. The decision to
feed heat from crushed rock TES to an existing turbine or feed water heater, expand an existing
turbine, or construct a new generator entirely will depend on existing construction, the cost of
turbine hall modifications, the cost of constructing a new turbine, and desired generator output.
Page 36
36
3. Engineering Modeling and Option Space Estimations
Modeling technologies on the expected scale of the crushed rock TS system is crucial to
demonstrating the viability of the concept prior to embarking on a costly engineering project.
While economic models, which are further discussed in the following chapter, have the ability to
illustrate economic competitiveness of various technologies, they rely heavily on technological
parameters as well as capital and variable cost predictions, which are in turn validated through
rigorous engineering analyses. Thus, the thermodynamic and economic models are closely linked
in the evaluation of theoretical technologies and ultimately the decision whether or not to bring
them to fruition. This chapter aims to estimate relevant parameters for the design of a crushed rock
TES system, such as pressure drops and charging time, in order to outline the option space.
Prior to forming and presenting any model estimates, the driving motivations and potential
biases must be considered. That is, models are by their very nature simplifications of complex,
natural systems which are never truly closed, and model-makers have the ability to skew results
through their choice of simplifications. Thus, as Naomi Oreskes, a Harvard Professor of the
History of Science, has written: “models can be confirmed by the demonstration of agreement
between observation and prediction, but confirmation is inherently partial” (Naomi Oreskes,
Kristin Shrader-Frechette, and Kenneth Belitz 1994). For the purposes of this project, the
thermodynamic model exists to provide insight to the technical limitations of the technology as
well as order-of-magnitude cost estimates for various conditions. Simplifications made in the
thermodynamic model presented in this thesis are recognized along with approximations as to how
they may skew results. For example, neglecting conduction as a mode of heat transfer through the
rock pile would result in an overestimate of the temperature of air extracted.
This chapter is organized into a sections on (1) the nomenclature used throughout the
chapter; (2) general principles in modeling single-phase heat transfer in packed beds; (3) examples
of experimentally vetted correlations for friction factors and heat transfer coefficients in irregular
rock beds; (4) unique considerations for crushed rock TES borne out of system requirements; and
(4) parametric estimates for a crushed rock TES system.
Page 37
37
3. 1 Nomenclature
Table 1 below lists the nomenclature used throughout the chapter. The Biot number is a
dimensionless quantity like the Reynolds and Prandtl numbers, but is less commonly used. In short,
the Biot number represents the relative heat transfer resistances inside of and at the surface of a
body. A Biot number much smaller than one allows for the assumption of uniform temperature
within a body, whereas larger Biot numbers result in more complicated heat transfer problems.
Table 1 – Nomenclature for Engineering Estimates
Bi Biot number T Air temperature [°C]
cp Air specific heat capacity [J/kg K] t Time [s]
cR Particle specific heat capacity [J/kg K] Vp Volume of a particle, [m3]
D Equivalent particle diameter [m] Vt Total bed volume [m3]
Dv Volume equivalent Diameter [m] vs Superficial flow speed [m/s]
h Surface area heat transfer coefficient [W/m2 K] α Void fraction
hv Volumetric heat transfer coefficient µ Air viscosity [kg/m s]
f Friction factor ρ Air density [kg/m3]
k Air thermal conductivity [W/m K] ρp Particle density [kg/m3]
kp Particle thermal conductivity [W/m K] Δp Pressure drop [Pa]
H Height of the rock pile [m] Δt Time interval [s]
m Air mass flow rate [kg/s] Δx Segment length [m]
G Air mass flux [kg/m2 s] τ Time constant [s]
NTU Number of transfer units A Surface area [m2]
Nu Nusselt Number
Pr Prandtl number
Re Reynolds number
Page 38
38
3.2 Modeling Single Phase Flow in Packed Beds
Heat transfer and pressure drops of single phase flow in packed beds are well-established
fields of study. Most simply, both heat transfer and pressure drops depend on the particle material,
heat transfer fluid, flow parameters, and geometry of the system, but to varying degrees. For the
purposes of engineering design, pressure drops set limits on minimum pumping power required to
force flow, while heat transfer determines the thermodynamic efficiency and temperature gradient
in storing and removing heat from a packed bed. Both pumping power, a driving parameter for
capital costs, and thermodynamic efficiencies, which strongly affect turbine efficiencies following
output from the system, are primary concerns for the viability of crushed rock TES.
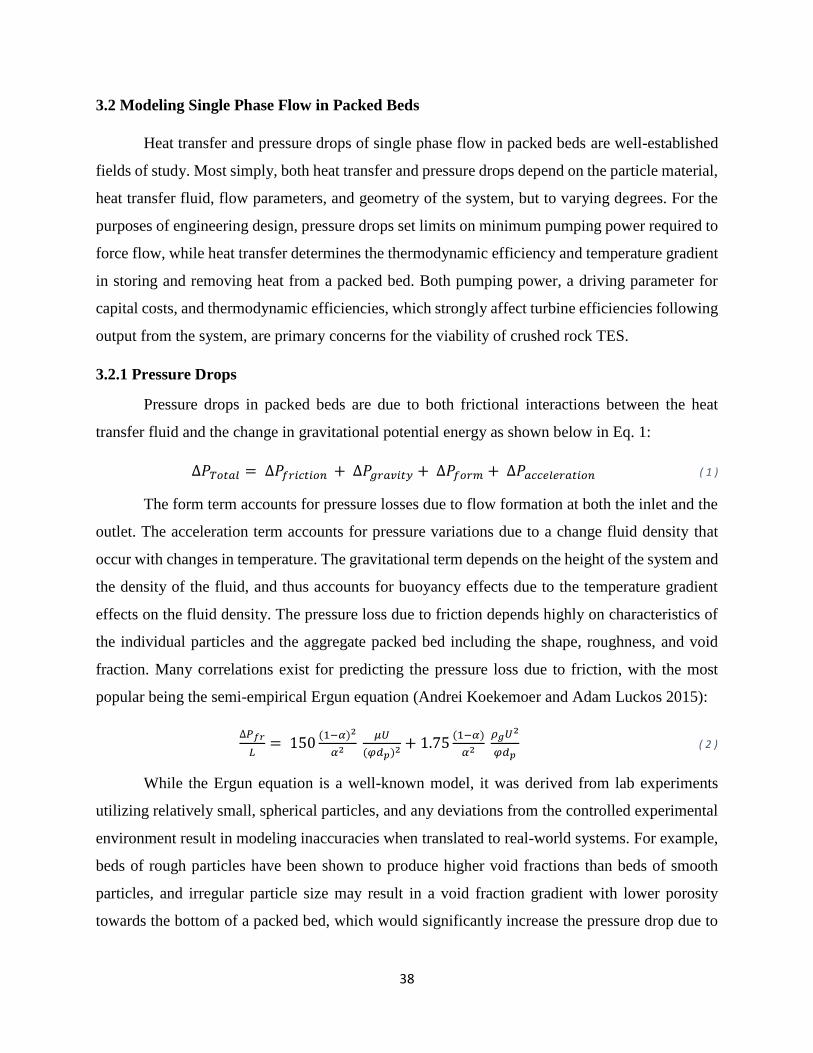
3.2.1 Pressure Drops
Pressure drops in packed beds are due to both frictional interactions between the heat
transfer fluid and the change in gravitational potential energy as shown below in Eq. 1:
∆𝑃𝑇𝑜𝑡𝑎𝑙 = ∆𝑃𝑓𝑟𝑖𝑐𝑡𝑖𝑜𝑛 + ∆𝑃𝑔𝑟𝑎𝑣𝑖𝑡𝑦 + ∆𝑃𝑓𝑜𝑟𝑚 + ∆𝑃𝑎𝑐𝑐𝑒𝑙𝑒𝑟𝑎𝑡𝑖𝑜𝑛 ( 1 )
The form term accounts for pressure losses due to flow formation at both the inlet and the
outlet. The acceleration term accounts for pressure variations due to a change fluid density that
occur with changes in temperature. The gravitational term depends on the height of the system and
the density of the fluid, and thus accounts for buoyancy effects due to the temperature gradient
effects on the fluid density. The pressure loss due to friction depends highly on characteristics of
the individual particles and the aggregate packed bed including the shape, roughness, and void
fraction. Many correlations exist for predicting the pressure loss due to friction, with the most
popular being the semi-empirical Ergun equation (Andrei Koekemoer and Adam Luckos 2015):
∆𝑃𝑓𝑟
𝐿= 150
(1−𝛼)2
𝛼2 𝜇𝑈
(𝜑𝑑𝑝)2 + 1.75(1−𝛼)
𝛼2 𝜌𝑔𝑈2
𝜑𝑑𝑝 ( 2 )
While the Ergun equation is a well-known model, it was derived from lab experiments
utilizing relatively small, spherical particles, and any deviations from the controlled experimental
environment result in modeling inaccuracies when translated to real-world systems. For example,
beds of rough particles have been shown to produce higher void fractions than beds of smooth
particles, and irregular particle size may result in a void fraction gradient with lower porosity
towards the bottom of a packed bed, which would significantly increase the pressure drop due to
Page 39
39
friction. Ultimately, correlations are only useful to the extent that they have been experimentally
verified with the relevant conditions of interest.
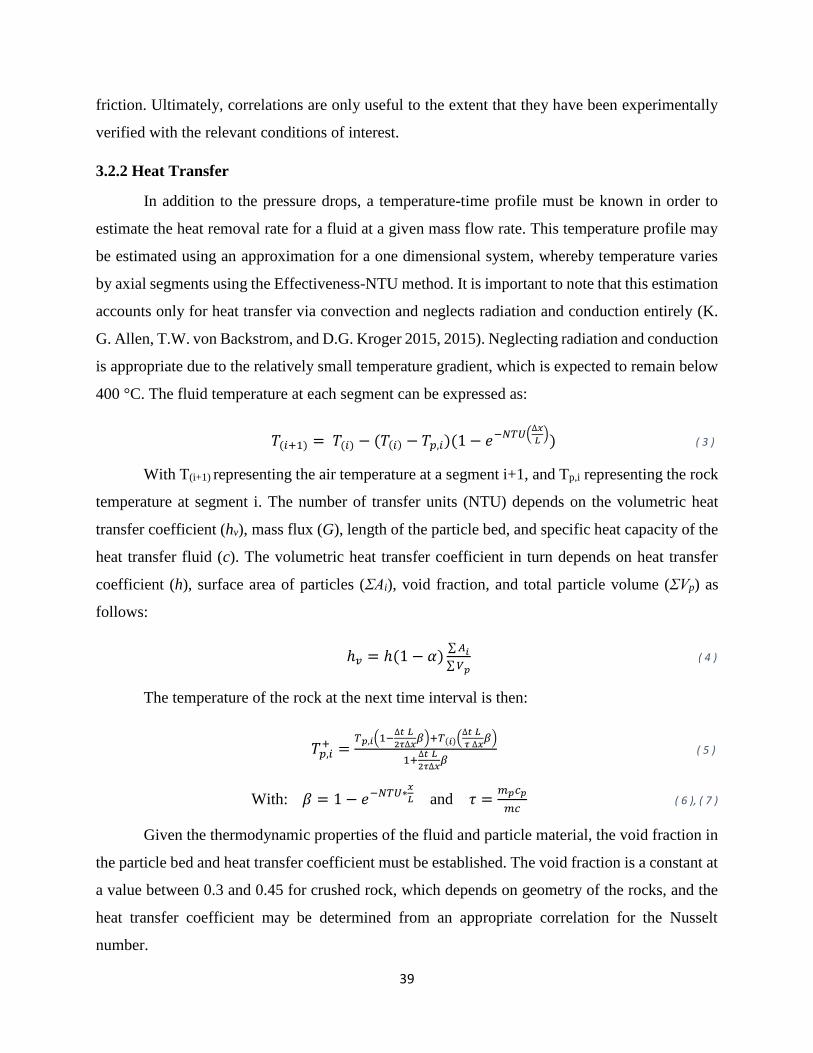
3.2.2 Heat Transfer
In addition to the pressure drops, a temperature-time profile must be known in order to
estimate the heat removal rate for a fluid at a given mass flow rate. This temperature profile may
be estimated using an approximation for a one dimensional system, whereby temperature varies
by axial segments using the Effectiveness-NTU method. It is important to note that this estimation
accounts only for heat transfer via convection and neglects radiation and conduction entirely (K.
G. Allen, T.W. von Backstrom, and D.G. Kroger 2015, 2015). Neglecting radiation and conduction
is appropriate due to the relatively small temperature gradient, which is expected to remain below
400 °C. The fluid temperature at each segment can be expressed as:
𝑇(𝑖+1) = 𝑇(𝑖) − (𝑇(𝑖) − 𝑇𝑝,𝑖)(1 − 𝑒−𝑁𝑇𝑈(∆𝑥
𝐿)) ( 3 )
With T(i+1) representing the air temperature at a segment i+1, and Tp,i representing the rock
temperature at segment i. The number of transfer units (NTU) depends on the volumetric heat
transfer coefficient (hv), mass flux (G), length of the particle bed, and specific heat capacity of the
heat transfer fluid (c). The volumetric heat transfer coefficient in turn depends on heat transfer
coefficient (h), surface area of particles (ΣAi), void fraction, and total particle volume (ΣVp) as
follows:
ℎ𝑣 = ℎ(1 − 𝛼)∑ 𝐴𝑖
∑ 𝑉𝑝
( 4 )
The temperature of the rock at the next time interval is then:
𝑇𝑝,𝑖+ =
𝑇𝑝,𝑖(1−∆𝑡
2𝜏
𝐿
∆𝑥𝛽)+𝑇(𝑖)(
∆𝑡
𝜏
𝐿
∆𝑥𝛽)
1+∆𝑡
2𝜏
𝐿
∆𝑥𝛽
( 5 )
With: 𝛽 = 1 − 𝑒−𝑁𝑇𝑈∗𝑥
𝐿 and 𝜏 =𝑚𝑝𝑐𝑝
𝑚𝑐 ( 6 ), ( 7 )
Given the thermodynamic properties of the fluid and particle material, the void fraction in
the particle bed and heat transfer coefficient must be established. The void fraction is a constant at
a value between 0.3 and 0.45 for crushed rock, which depends on geometry of the rocks, and the
heat transfer coefficient may be determined from an appropriate correlation for the Nusselt
number.
Page 40
40
3.3 Correlations for Modeling Flow in Irregular Rock Beds
3.3.1 Correlations for Friction Factors in Rock Beds
Absent the use of costly computational fluid dynamics (CFD) the construction of a
thermodynamic model for crushed rock TES requires correlations validated with representative
experimental testing. Fortunately, a research group from the University of Stellenbosch in South
Africa has vetted various correlations for pressure drops and heat transfer in rock beds which are
representative of crushed rock TES at a much smaller scale. Perhaps most importantly, the group
determined that experimental results are required for predictions for pressure drop and the heat
transfer coefficient to fall within 15% of the true value. Thus, the findings reported for the usability
of various correlations should be considered heuristically as appropriate approximations at small
scales may not apply at large scale.
Under isothermal conditions, a smooth sphere correlation valid from 10 < Re < 100000
consistently underestimates the friction factor for rock piles when compared to experimental
results. Allen at al. have reported more accurate correlations for the friction factor of air at
atmospheric pressure through crushed rock with both counter-current and cross-current flows
respectively as (K. G. Allen, T.W. von Backstrom, and D.G. Kroger 2015, 2015):
𝑓𝑣 =∆𝑝
𝐿(𝜌𝑣𝑠
2
2)
𝛼3
(1−𝛼)𝐷𝑣 =
620
𝑅𝑒𝑣+
13.7
𝑅𝑒𝑣0.08 and 𝑓𝑣 =
∆𝑝
𝐿(𝜌𝑣𝑠
2
2)
𝛼3
(1−𝛼)𝐷𝑣 =
600
𝑅𝑒𝑣+
12.3
𝑅𝑒𝑣0.08 ( 8 ), ( 9 )
With the effective volumetric diameter defined as:
𝐷𝑣 = (6
𝜋 [
1
𝑛∑ 𝑉𝑝𝑖
𝑛𝑖=1 ])
1
3 ( 10 )
And the Reynolds number defined as:
𝑅𝑒𝑣 = 𝜌𝑣𝑠𝐷𝑣
µ(1−𝛼) ( 11 )
The dependence on flow direction, either counter-current or cross-current, suggests that in
addition to the materials used, the process of constructing a crushed rock TES system can
significantly affect performance.
Page 41
41
3.3.2 Correlations for Heat Transfer Coefficients in Rock Beds
The results also suggest that, unlike the frictional pressure drop, the heat transfer does not
depend strongly on particle shape and flow direction, but rather almost entirely on the
thermodynamic properties of the packing material used. Allen et al. used various correlations such
as one provided by Wakao et al. to determine the Nusselt number, and thus the heat transfer
coefficient for the flow, where:
𝑁𝑢 =ℎ𝐷
𝑘= 2 + 1.1𝑅𝑒𝑝
0.6𝑃𝑟1/3 and 𝑅𝑒𝑝 =𝜌𝑣𝑠𝐷
𝜇 ( 12 ), ( 13 )
This correlation, which is appropriate for 15 < Rep < 8500 tracked experimental data well
for a single charge with mass flux of 0.2 kg/m2s and temperatures circa 500 °C.
Barton and Hanchen et al. use the following correlation for the heat transfer coefficient in
their calculations for air blown through a rock bed (Barton 2013; Ha¨nchen, Bru¨ckner, and
Steinfeld 2011):
ℎ =700
6(1−𝛼)𝐺0.76𝑑0.24 ( 14 )
The utility of these correlations is limited to conditions under which they were
experimentally validated.
3.4 Specific Considerations for Crushed Rock TES
Of course, the small rock bed used to experimentally validate these correlations is not
perfectly representative of a 30-meter-tall crushed rock pile running multiple cycles with
significant latent periods between charging and discharging. The isothermal conditions used in
determining the correlations presented do not account for the crushed rock TES system’s expected
buoyancy effect due to the temperature gradient, and as a result underestimate the total pressure
drop. As well, the friction factor was reported to increase over the course of multiple cycles and
remain constant thereafter. This change in friction factor was likely due to the movement of small
particles within the pile, effectively altering the void fraction throughout the pile.
Some deviations from the small scale experimentally determined correlations may,
however, be anticipated and engineered against. For instance, Zanganeh et al. reported that the
Page 42
42
axial void fraction distribution of their packed bed system decreased monotonically with
increasing packed bed height to an asymptotic value of 0.325 (G. Zanganeh and et al. 2012). This
variation in void fraction was likely due to both the total weight of the system bearing down on
itself and the random dispersion of particle sizes which filled lower voids throughout the course
of cycles. For the case of crushed rock TES on a large scale, a dead zone may be engineered to
allow dust and particulate to accumulate at the bottom of the system below the outlet air ducts so
that air flow is not unnecessarily impeded. For the purposes of this thesis, a conservative value of
0.3 is assumed for the void fraction.
Additionally, the anticipated time scale of the crushed rock TES system may affect primary
assumptions for the heat transfer mechanisms. In the case of the Stellenbosch rock bed analyzed
by Allen at al., conduction through the system was neglected due to the low calculated Biot number
(<0.1) and short time scale of charging and discharging during which forced convection surely
dominated. Instead of discharging immediately, crushed rock TES will not always charge from a
completely discharged state, and may idle for many hours before discharging heat to industry or a
turbine, which may provide ample time for the entire system to thermalize. Neglecting thermal
losses at the wall, this process would not decrease the total amount of energy stored, but would
reduce the gradient and ultimately the maximum outlet temperature during discharge, which is
directly related to the turbine efficiency.
3.5 Parametric Estimates for Crushed Rock TES Option Space
3.5.1 Thermal Losses at the Walls
If the efficiency losses at the walls are not neglected, then the time scale of energy storage
becomes increasingly important as energy is lost over time. Fortunately, the large scale of the
system opposes this effect as the surface area (heat loss) increases as the square of the dimensions
whereas the volume (storage capacity) increase as the cube of the dimensions. Ergo, the larger the
system is, the smaller the portion of energy lost to the surroundings will be for a given time period.
The Swiss Federal Office of Energy (SFOE) published a report in which fiberglass, concrete, and
proprietary material were used to insulate rock up to 550 °C (Giw Zanganeh 2016).
Page 43
43
Additionally, thermal losses to ambient conditions may be estimated for a system at a given
temperature with a given amount of insulation. Figure 1 below illustrates an estimate for the effect
of insulation thickness on the percentage of energy lost to ambient surroundings after one day for
an approximately 10 GWh crushed rock TES system with the geometry of a 20-meter cube and an
internal to external temperature difference of 300 °C. Fiberglass insulation is assumed with a
thermal conductivity of 0.04 W/m K (“Thermal Conductivity of Common Materials and Gases”
2003).
Figure 14 - Effect of Insulation Thickness on Ambient Energy Losses over 24 Hours for Crushed
Rock TES System
This estimation was calculated using equations from The Engineering ToolBox website for
calculating heat loss from buildings (“Heat Loss from Buildings” 2003). Heat loss caused by
ventilation and infiltration were neglected. Heat loss through the roof and walls were calculated
respectively as:
𝐻 = 1.15 ∗ 𝐴 ∗ 𝑈 ∗ (𝑇𝑖−𝑇𝑜) and 𝐻 = 𝐴 ∗ 𝑈 ∗ (𝑇𝑖−𝑇𝑜) ( 15 ), ( 16 )
Page 44
44
The factor of 1.15 for the losses from the roof estimates radiative losses to space. The
overall heat transmission coefficient (U) was calculated as:
𝑈 =𝐾𝑖
𝑋𝑖 ( 17 )
Where Ki and Xi are the thermal conductivity and thickness of fiberglass, respectively.
3.5.2 Pressure Drop
The pressure drop through one meter of crushed rock was estimated using a conservative
void fraction of 0.3 and the experimental correlation for friction factor, eq. 9 given by Allen et al.
for crushed rock with cross-current flow. The distinction between cross-current and counter-
current flow depends on the particle alignment relative to the flow direction of a fluid. Allen et al.
found that packing particles in a co-counter-current manner results in higher friction factors than
packing particles perpendicularly to the flow (K. G. Allen, T.W. von Backstrom, and D.G. Kroger
2015). As expected, the pressure drop increases exponentially with both increasing superficial flow
velocity and decreasing rock diameter. These effects are shown in the figure below.
Page 45
45
Figure 15 - Pressure Drops as a Function of Mass Flux and Rock Diameter
The total pressure drop for a column of crushed rock can be estimated as the product of the height
of the column and the pressure drop per meter of crushed rock. Pressure drops due to gravity are
approximately 10 Pa for a meter of crushed rock, and are thus insignificant when compared to the
frictional pressure drop.
3.5.3 Temperature Distribution and Charging Time
The temperature distribution and charging time for the system is calculated as a simplified, one-
dimensional heat transfer problem with the assumptions that (1) air is an ideal gas with constant
specific heat capacities; (2) the thermal mass of the rocks is much greater than the thermal mass
of the flowing air, such that the temperature front advances sharply. That is, the change in
temperature of the rock is equal to the change in temperature of the air at the heat transfer front;
Page 46
46
(3) the mass flux through the rock bed is constant; (4) the void fraction through the rock pile is
constant; (5) the rock bed is comprised of identical spherical particles; (6) there are no storage
system surface heat transfer losses; (7) conduction through the rocks is neglected; (8) radiation is
neglected. Assumption (2) simplifies the calculation for the speed at which the heat transfer front
moves through the packed bed, but breaks down as the mass flux through the system is increased.
Figure 16 - Illustration of Heat Transfer Simplification
First, the conservation of momentum for the control volume holds that the mass flux through the
system remains constant.
𝑑𝑚
𝑑𝑡= 0 ( 18 )
The conservation of energy equation for the control volume is:
𝜕𝐸𝐶𝑉
𝜕𝑡= 0 = 𝑄 + 𝑚ℎ𝑥 − 𝑚ℎ𝑥+𝑑𝑥 ( 19 )
The conservation of energy equation for the rocks is:
𝜕𝐸
𝜕𝑡 𝑅=
𝑑
𝑑𝑡[𝜌𝑝𝐴𝑑𝑥𝑐𝑅𝑇𝑅] = −𝑞′𝑑𝑥 ( 20 )
The conservation of energy for the air is:
𝜕𝐸
𝜕𝑡 𝑔= −𝐺𝐴𝑐𝑝𝑑𝑇𝑔 = 𝐺𝐴𝑐𝑝𝑑𝑇𝑅 = 𝑞′𝑑𝑥 ( 21 )
Combining equations (20) and (21) and rearranging:
𝑑𝑇𝑅
𝑑𝑡+
𝐺𝑐𝑝
𝜌𝑝𝑐𝑅
𝑑𝑇𝑅
𝑑𝑥= 0 ( 22 )
Page 47
47
The general solution for this partial differential equation is a one-dimensional wave with the
form:
𝑢(𝑥, 𝑡) = 𝐹(𝑥 − 𝑐𝑡) + 𝐺(𝑥 + 𝑐𝑡) ( 23 )
Here, the coefficient 𝐺𝑐𝑝
𝜌𝑝𝐶𝑅 represents the speed at which the temperature wave flows through the
rock bed, and the solutions to equation (22) are:
𝑇𝑅(𝑥, 𝑡) = 𝐹 (𝑥 −𝐺𝑐𝑝
𝜌𝑝𝑐𝑅𝑡) ( 24 )
Thus, under the given assumptions, the charging and discharging rates of the system depend on
the mass flux of the air, the relative specific heat capacities and the density of the rocks. The figure
below shows the calculated time to charge a crushed rock thermal energy storage system with
varying heights and mass fluxes of the air. The density of granite (2750 kg/m3) and specific heat
capacities of granite (0.790 kJ/kg K) and air (1.005 kJ/kg K) were taken from the engineering
toolbox website (“Densities of Solids” 2009; “Specific Heat of Common Substances” 2003).
Page 48
48
Figure 17 - Time to Fully Charge as a Function of Mass Flux, Air Velocity, and Rock Bed Height
Page 49
49
3.5.4 Sizing Energy Storage
The maximum storage capacity of the system can be modeled as the maximum internal
energy of the rocks at a full charge which can be transferred to the discharging air. That is:
𝐸𝑖𝑛𝑡𝑒𝑟𝑛𝑎𝑙 = 𝐻𝐴𝜌𝑝(1 − 𝛼)𝐶𝑅(𝑇𝑚𝑎𝑥 − 𝑇𝑚𝑖𝑛) ( 25 )
It is important to select proper dimmensions, however, since there are tradeoffs. For a given
storage capacity, shorter systems require more land. Conversely, taller systems result in higher
pressure drops and thus require greater pump work to fully charge the system in a given time. The
figure below illustrates this phenomenon. The pump work required is 𝑊𝑝 = 2𝑣∆𝑃𝑡, where
pressure drop is calculated with Ergun’s equation (eq. 18 in Barton), the time to charge is
calculated as in the previous section, and the factor of 2 reflects the need to pump air into and out
of the system. The energy stored is calculated as 𝐸𝑠𝑡𝑜𝑟𝑒𝑑 = 𝐶𝑎𝐺∆𝑇𝑡𝜂, and the ratio of pump work
to energy stored is 𝑊𝑝/𝐸𝑠𝑡𝑜𝑟𝑒𝑑. The code used to produce the following figures was validated
against values provided in Barton (Barton 2013). A 50% heat to power efficiency is used here,
which reflects the efficiency in converting heat to electricity. That is, 2 kWh of heat energy are
equivalent to 1 kWh of electricity with a 50% heat to power efficiency. The heat to power
efficiency, particle diameter, and temperature difference all have significant impacts on the
calculated results, with high values for all parameters leading to the most ostensibly favorable
results. However, heat to power efficiency is limited thermodynamically, large particle diameters
lead to relatively diffuse temperature fronts, and inlet and outlet temperature differences are
determined by reactor design and ambient external temperatures.
Page 50
50
Figure 18 - Pump Work Ratio for Varying Rock Bed Heights and Charging Times D = 0.1 m
Intuitively, the amount of pump work required to fully charge the heat storage increases as
the rock bed height and flow velocity, which is related to the time to full charge, increases.
Increasing the particle size significantly reduces the pump work required, but results in a less
efficient heat transfer, which is not observed here. The figure below illustrates the effect of
doubling the particle diameter to 0.2 m. Both figures use the same scale for comparison.
Page 51
51
Figure 19 - Pump Work Ratio for Varying Rock Bed Heights and Charging Times D = 0.2 m
The rate of heat deposition is another important parameter for sizing the energy storage
system. In short, the rate of heat deposition determines how quickly energy can be deposited and
recovered from the energy storage. The graphs below illustrate the effect of flow velocity and
mass flux on the rate of heat deposition as a function of mass flux and flow velocity. The rate of
heat deposition from the air is calculated as 𝑃𝑑𝑒𝑝𝑜𝑠𝑖𝑡𝑒𝑑 = 𝐶𝑎𝐺∆𝑇, with a temperature difference,
Δ𝑇, of 200 °C. The void fraction of the rock pile does not affect the rate of heat deposition, but
rather determines the height of rock required to hold the deposited heat.
Page 52
52
Figure 20 - Heat Deposition as Functions of Mass Flux and Flow Velocity
Page 53
53
The amount of energy stored scales linearly with the temperature difference. The figure
below illustrates the effect of the temperature difference on the total storage capacity. The
amount of energy stored is calculated as 𝐸𝑠𝑡𝑜𝑟𝑒𝑑 = (1 − 𝛼)𝜌𝑝𝑐𝑅𝐻∆𝑇, with a void fraction of 0.3.
Figure 21 - Effect of Temperature Differential on Energy Stored
3.5.5 Estimating the Temperature Front
The interface between the hot and cold regions becomes more diffuse as particle size
increases. This result is intuitive, since the efficiency of the heat transfer increases with increasing
surface area, which increases as particle diameter is reduced. Barton calculated the spread of the
hot-cold interface in a 1.6-meter-tall bed of steatite with an air mass-flow rate of 0.08 kg/(m2s) and
varying particle sizes. Particle diameters of 2 mm to 10 mm corresponded to a transition region
0.5 to 1 meter in length (Barton 2013). Accurate estimates of the temperature front for a larger
Page 54
54
system with two-way flow and multiple cycles requires experimental validation, but trends are
predictable. Increasing particle size and flow rates, which reduce heat transfer efficiency, increase
the length of the temperature front.
3.6 Future Work for Engineering Analysis
Further work is required for both accurate modeling of the crushed rock thermal energy
storage system and the tradeoffs produced by design decisions. In particular, modeling pressure
drops and heat transfer through the rock bed require experimental validation. Relaxing assumption
(2) in the heat transfer analysis results in a more complex calculation for the heat transfer between
the air and rocks with the governing equation:
𝜕2𝑇𝑅
𝜕𝑡𝜕𝑥+
ℎ
𝜌𝑝𝐴𝑐𝑅
𝜕𝑇𝑅
𝜕𝑥+
ℎ
𝑚𝑐𝑝
𝜕𝑇𝑅
𝜕𝑡= 0 ( 26 )
Solving this partial differential equation requires that the heat transfer coefficient, h, is
known. Correlations for determining the heat transfer coefficient are limited insofar as they are
validated experimentally in representative systems. The crushed rock thermal energy storage
system proposed in this thesis is an order of magnitude larger than the rock piles used to validate
the heat transfer correlations listed in this chapter. Future work on this subject would include
determining appropriate heat transfer correlations for rock beds which are tens of meters tall and
subsequently modeling the behavior of the heat transfer front. The total length of the temperature
gradient during charging and discharging will determine the optimal height of a crushed rock TES
system for a given amount of energy storage capacity.
The tradeoffs for design decisions must be better understood as well. Building a taller
system for a given capacity requires less land, but significantly increases the pump work required
to charge and discharge the system. As well, increasing the particle diameter of the rocks would
decrease the pump work required, but at the expense of heat transfer efficiency. In addition to
these generally well understood phenomena, there are other complications that may arise with a
large scale rock bed. For instance, the void fraction may vary significantly for tall rock beds due
to settling dust and heavy overburden. Implementing a dead zone below the lower air ducts may
correct for this effect, but experimental validation is required to determine how signification the
variation may be. In general, the body of knowledge behind irregular rock beds informs general
Page 55
55
trends and relationships between design choices, but these trends may not scale linearly,
requiring experimental validation on large scale. Because heat transfer and pressure drop are in
one direction, experiments must be the height of the storage system, but the cross sections can be
small but large relative to the crushed rock diameter to avoid wall effects.
Calculations used to produce the figures throughout this chapter are detailed in Appendix
A.
Page 56
56
4. Economic Modeling
4.1 Common Electricity Market Models
Grid-level electricity generation relies on a complex mix of generating technologies, each
with varying operational capabilities and associated costs. Since no single technology is purely
dominant over others, the optimal energy portfolio contains varying levels of production from a
mix of generation sources. The optimal mixture is not easily intuited, which has resulted in the use
of extensive economic modeling for informing both grid operations (production cost modeling)
and investment decisions (capacity expansion modeling).
Production Cost Modeling focuses on short term decision making on the order of hours or
minutes. These models can be optimized to either maximize profits or determine the least cost
means of meeting demand in a given region with a given set of generators. While production cost
models produce valuable information for grid operators, they provide poor insight for investment
decisions and do not address all aspects of reliability (Erin Boyd 2016). For this reason, production
cost modeling is not ideal for the techno-economic assessment of novel technologies.
Capacity Expansion Modeling, as the name suggests, focuses on investment decisions for
expanding capacity through the investment of new generators. Inputs to a typical capacity
expansion model include estimates for future demand, the prices and operational parameters of
generation, and policies such as expected subsidies and taxes (Erin Boyd 2016).Capacity
expansion models are ideal for techno-economic assessment of novel technologies due to their
longer time horizons. However, many existing models are not able to accurately model the effects
of intermittency from renewable energy generation due to poor temporal resolution.
4.2 GenX Formulation
The increasing complexity of the power sector requires higher resolution decision making.
Until recently, however, capacity expansion models were not capable of providing enough detailed
insight for decision making in the face of a growing renewable sector, increased electrification of
transportation, and massive deployment of distributed energy resources. Researchers at MIT
formulated GenX as a tool to overcome previous limitations, allowing for more detailed, modular
Page 57
57
results (Jesse D. Jenkins and Nestor A. Sepulveda 2017). GenX is “a highly configurable
electricity resource capacity expansion model.” Using constrained optimization, the model
“determines the mix of electricity generation, storage, and demand-side resource investments and
operational decisions to meet electricity demand in a future planning year at lowest cost subject to
a variety of power system operational constraints and specified policy constraints.” A basic
electricity market considering generation from renewable and thermal generators and demand
balanced by connected zones, demand side management, and storage technologies forms the basis
of the formulation for GenX. Figure 22 below provides a graphical illustration of this system.
Figure 22 - System Level Illustration of Electricity Market without TES
Unlike most capacity expansion models, GenX has the capability to perform simultaneous
co-optimization along seven decision layers, including capacity expansion planning, hourly
dispatch of resources, unit commitment decisions, commitment of generation, transmission power
flows, distributed network power flows, and interactions between electricity and heat markets
(Jesse D. Jenkins and Nestor A. Sepulveda 2017). This dimensional modularity allows users to
optimize the resolution of the model results along dimensions of interest while simplifying the
others. With regards to the techno-economic assessment of crushed rock thermal energy storage,
this flexibility allows for a high temporal resolution analysis of generation expansion and
Page 58
58
interactions between the heat and electricity market without being too computationally
cumbersome.
4.3 Modeling Crushed Rock Heat Storage with GenX
4.3.1 System-Level Model
In addition to determining optimal energy portfolios of existing technologies, GenX can
function as a tool for the techno-economic assessment of novel technologies. This approach was
employed to evaluate the impact of heat storage technologies, namely FIRES (Firebrick
Resistance-heated Energy Storage) coupled to a Nuclear Air-Bryton Cycle, on the cost of
decarbonization (Jenkins and Sepulveda, 2017). Figure 23 below illustrates how FIRES would
alter the base scenario for GenX, allowing excess electricity to heat FIRES to either provide heat
as a topping cycle for a fluoride salt-cooled high-temperature reactor (FHR) or export heat to the
local heat market.
Figure 23 - System Level Illustration of Electricity Market With FIRES
Page 59
59
A similar graphic can illustrate the theoretical relationship between crushed rock TES and the
existing market. Unlike FIRES, which are heated using electricity and resistance heaters, crushed
rock TES would charge using heat produced from a LWR at times of excess renewable production
in order for the LWR to capitalize when renewable production is low. As with FIRES, crushed
rock TES could provide heat to a local heat market, reducing a need for fossil fuels in
manufacturing and other heat-intensive industries. Unlike FIRES with an FHR, the charging phase
of the TES limits the coupled reactor’s maximum energy output. Figure 24 illustrates the
conceptual relationship of crushed rock TES to the rest of the system.
Figure 24 - System Level Illustration with Crushed Rock TES
Page 60
60
4.3.2 LWR Base Case Formulation
The interaction between a crushed rock TES and a LWR carries significant implications for
adapting GenX to model crushed rock TES. The base-case constraints for modeling a LWR are
detailed below, followed by modified constraints for incorporating crushed rock TES.
Figure 25 - LWR Base Case Interaction with the Generation Pool
Page 61
61
Table 2 - Parameters for LWR Base Case Formulation
Table 3 - Variables for LWR Base Case Scenario
Table 4 - Constraints for LWR Base Case Scenario
Variable Notation Description
𝑣𝐶 Generator Capacity[MWe]
𝑣𝑃 Generator Power [MWe]
Constraint Description
𝑣𝑃 ≤ 𝑣𝐶 The power output must be less than the maximum capacity
𝑣𝑃 ≥ 𝑣𝐶 ∗ 𝜌𝐿𝑊𝑅𝑚𝑖𝑛 The power output at any time must exceed the minimum power
𝑣𝐶 ≤ 𝐶𝐿𝑊𝑅𝑚𝑎𝑥 The model can only choose to install capacity up to a maximum
value
𝑣𝑃𝑡 − 𝑣𝑃𝑡−1 ≤ 𝑣𝐶 ∗ 𝜌𝐿𝑊𝑅𝑟𝑎𝑚𝑝 −𝑢𝑝
Changes in power output are limited by the ramp-up rate
𝑣𝑃𝑡−1 − 𝑣𝑃𝑡 ≤ 𝑣𝐶 ∗ 𝜌𝐿𝑊𝑅𝑟𝑎𝑚𝑝 −𝑑𝑜𝑤𝑛 Changes in power output are limited by the ramp-down rate
Page 62
62
4.3.3 LWR with Crushed Rock Thermal Storage Formulation
Incorporating thermal energy storage can allow a LWR to provide peaking power at the cost of an
efficiency loss at the heat exchangers to and from the storage unit. The maximum charge and
discharge rates of the storage unit would impose constraints as well.
Figure 26 - LWR with TES Interaction with the Generation Pool
Page 63
63
Table 5 - Parameters for LWR with Crushed Rock TES
Table 6 - Variables for LWR with Crushed Rock TES
Parameter Notation Description
𝜌𝐿𝑊𝑅𝑚𝑖𝑛 Minimum stable power output from the LWR [%]
𝜌𝑇𝑢𝑟𝑏𝑚𝑖𝑛 Minimum stable power output from the turbine hall [%]
𝜌𝐿𝑊𝑅𝑟𝑎𝑚𝑝 −𝑢𝑝
Maximum amount of capacity the power output from the LWR may
increase in a time period t [%]
𝜌𝐿𝑊𝑅𝑟𝑎𝑚𝑝 −𝑑𝑜𝑤𝑛
Maximum amount of capacity the power output from the LWR may
decrease in a time period t [%]
𝜂𝑣𝐻1 TES charging efficiency [%]
𝜂𝑣𝐻2 TES discharging efficiency [%]
𝛿ℎ𝑒𝑎𝑡 Peak to base generation ratio for LWR [%]
𝛾 TES self-discharge [%/t]
𝛼 Electricity to heat conversion [MWh/MWe]
Page 64
64
Table 7 - Variables for LWR with Crushed Rock TES
Page 65
65
Objective cost functions are used to evaluate the cost-competitiveness of each formulation
as demonstrated below. The fuel and variable operations and maintenance cost of the TES are
assumed negligible.
Table 8 - Objective Cost Functions
Scenario Cost Function for Nuclear Generation
Base-case w/o TES min [(𝑐𝑎𝑝𝑖𝑡𝑎𝑙 + 𝑓𝑖𝑥𝑒𝑑 𝑂&𝑀) ∗ 𝑣𝐶𝑎𝑝 + (𝑓𝑢𝑒𝑙 + 𝑣𝑎𝑟. 𝑂&𝑀) ∗ 𝑣𝑃]
Base-case with TES min [(𝑐𝑎𝑝𝑖𝑡𝑎𝑙 + 𝑓𝑖𝑥𝑒𝑑 𝑂&𝑀)𝐿𝑊𝑅 ∗ 𝑣𝐶𝑎𝑝 + (𝑓𝑢𝑒𝑙 + 𝑣𝑎𝑟. 𝑂&𝑀) ∗ (𝑣𝑃2𝑝 + 𝑣𝐻1)
+(𝑐𝑎𝑝𝑖𝑡𝑎𝑙 + 𝑓𝑖𝑥𝑒𝑑 𝑂&𝑀)𝑇𝐸𝑆 ∗ 𝑣𝑆 + 𝑐𝑎𝑝𝑖𝑡𝑎𝑙 ∗ (𝑣𝐶𝑎𝑝𝑐ℎ𝑎𝑟𝑔𝑒 + 𝑣𝐶𝑎𝑝𝑑𝑖𝑠𝑐ℎ𝑎𝑟𝑔𝑒)]
4.4 Model Input Estimates
4.4.1 Parameter Estimates for Existing Technologies
Useful models require accurate estimates for generator operational and cost parameters.
The GenX optimization used here considers investment decisions for one year. Thus, the capital
costs are annualized to provide relevant comparisons between technologies with different
construction and operation times. The equation below is used to calculate the future cost (Fc) of
construction for a technology at the time operations begin as a function of the construction cost
(Io), interest rate (r), and construction time in years (nc). The construction cost includes capital
costs for a technology, including direct construction costs, licensing, and other one-time indirect
costs incurred by the owner during construction.
𝐹𝑐 = 𝐼𝑜 ∗𝑒𝑟𝑛𝑐−1
𝑟𝑛𝑐 ( 27 )
The future cost is then repaid over the operating lifetime of the technology, with profits
discounted at the same discount rate. The equation below is used to calculate the annualized
investment cost, A.
𝐴 = 𝐹𝑐 ∗𝑒𝑟𝑛𝑜(𝑒𝑟−1)
𝑒𝑟𝑛𝑜−1 ( 28 )
Detailed below are annualized costs for natural gas, coal, nuclear, nuclear with hot rock,
land-based wind, utility-scale solar PV, and batteries. Overnight capital costs for natural gas, coal,
Page 66
66
nuclear, wind, and solar technologies were taken from the 2017 NREL Annual Technology
Baseline Data estimates for the year 2040 (“NREL Annual Technology Baseline Data” 2017). The
capital cost for nuclear with crushed rock was estimated by adding $100/kW, one fifth of the
estimated cost for turbine hall modifications, to the overnight capital cost for nuclear generators
provided by NREL. This increase in investment cost totals $100 million for a 1 GW LWR and
accounts for necessary modifications required to install crushed rock TES technology. These
modifications may take the form of adding infrastructure to divert heat from the secondary loop to
a steam-air heat exchanger, or simply the addition of a steam air heat exchanger to the secondary
loop. The energy transferred at such an exchanger would be determined by the mass flux of air on
the cold side; higher air flow would result in greater energy transfer and thus faster charging of the
TES system. Battery costs were taken from Lazard’s 2017 levelized cost of storage analysis
(“Lazard’s Levelized Cost of Storage Analysis - Version 3.0” 2017). An interest rate of 7.7% is
used for all calculations.
Table 9 – Annualized Cost Parameters for Generation Technologies
Technology Overnight Cost [$/MWe]
Construction [yr]
Life time [yr]
Investment Cost [$/MWe-yr]
Natural Gas 782,000 2 30 75,127
Coal 3,342,000 2 30 321,067
Nuclear 4,776,000 7 60 511,646
Nuclear with Hot Rock
4,876,000 7 60 522,359
Wind 1,202,000 1 25 117,093
Solar 808,000 1 25 78,711
Batteries 1,600,000 1 20 169,455
Crushed rock thermal energy storage capital costs were estimated for both the charging and
discharging capacity in $/MW-yr thermal and the total storage capacity in $/MWh-yr thermal,
corresponding to charging capacity costs of $50 and $150/kW thermal and storage capacity costs
ranging from $1-100/kWh thermal.
The table below illustrates the fixed and variable O&M costs and fuel costs which do not
depend on the lifetime of the generating technology. Parameters for natural gas, coal, nuclear,
wind, and solar technologies were gathered from the 2017 NREL data, and parameters for batteries
Page 67
67
were gathered from the EIA’s capital cost estimates (“NREL Annual Technology Baseline Data”
2017; “Updated Capital Cost Estimates for Utility Scale Electricity Generating Plants” 2016).
Table 10 - Cost Parameters for Generators
Technology Variable O&M
[$/MWh] Fixed O&M [$/MW yr]
Fuel Costs [$/MMBtu]
Heat Rate [MMBtu/MWh]
Emissions [tons CO2/MMBtu]
Natural Gas 7 12,000 5.33 9.92 0.0585
Coal 5 32,000 2.00 8.8 0.1053
Nuclear 2 101,000 1.06 10.46 0 Nuclear with Crushed Rock 2 101,000 1.06 10.46 0
Wind 0 51,000 0 0 0
Solar 0 13,000 0 0 0
Batteries 0 40,000 0 0 0
The operational parameters listed below were estimated using the 2017 NREL data and
Lazard’s Levelized Cost of Storage Analysis (“NREL Annual Technology Baseline Data” 2017;
“Lazard’s Levelized Cost of Storage Analysis - Version 3.0” 2017). The minimum load of the
reactor set at 30% is used for nuclear with hot rock to reflect the flexibility provided by the crushed
rock thermal energy storage.
Table 11 - Performance Parameters for Generators
Technology Minimum Load Turbine [%]
Minimum Load Reactor [%]
Ramp Rate [%]
Charging Efficiency [%]
Discharging Efficiency [%]
Natural Gas 0 0 1
Coal 0.4 0 1
Nuclear 0.5 0 0.1
Nuclear with Crushed Rock
0.5 0.3 0.1
Wind 0 0 1
Solar 0 0 1
Batteries 0 0 1 0.9274 0.9274
4.4.2 Parameter Estimates for Crushed Rock Thermal Energy Storage
The technical parameters used for the crushed rock heat storage system will largely dictate
the performance of the system, and thus form the basis for the experimental design. Significant
parameters for the crushed rock TES system include the marginal cost of energy storage (in
Page 68
68
$/MWh), the capital cost of charging and discharging capacity (in $/kW), the round-trip efficiency
of storing and recovering energy, and the peaking capacity provided as a percentage of the coupled
reactor’s rated output. In the interest of the timescale for this experiment, favorable and
unfavorable performance scenarios will be considered for the crushed rock thermal energy storage
system with regards to the round trip efficiency and capital cost of charging and discharging
capacity.
The capital cost of charging and discharging the system reflects the costs of the pump
required to circulate the air, and the heat exchangers. Turbine halls cost on the order of $500/kW,
and include turbine generators, heat exchangers, and many other components (“Power Cycles for
the Generation of Electricity from a Next Generation Nuclear Plant” 2010). The cost of heat
exchangers alone is then favorably estimated to be an order of magnitude reduction from the cost
of a complete turbine hall, or $50/kW, and unfavorably as $150/kW thermal. Round trip
efficiencies for similar sensible heat storage technologies coupled to LWRs was estimated by
Westinghouse to be 60% (Charles Forsberg et al. 2017). This thesis bounds Westinghouse’s
estimate for the round trip charging efficiency with a favorable estimate of 70% and an
unfavorable estimate of 50%. Peaking potentials are estimated favorably at 25%, and
unfavorably at 10% of the rated capacity of the coupled LWR. These peaking values represent
reasonably achievable peaking factors from turbines constructed with peaking in mind and
existing turbines, respectively. The marginal capital cost for constructing a crushed rock TES is
expected to distinguish crushed rock TES, at a value near $5/kWh thermal.
4.5 Experimental Design
This thesis considers the favorable and unfavorable parameter estimates for round trip
efficiencies and capital costs of charging the system as coupled into two performance scenarios
for crushed rock thermal energy storage. This coupling reduces computational stress at the cost
of considering all combinations of the varied parameters.
In short, the experiment uses GenX to minimize the price of electricity both with and
without the use of crushed rock TES, using historic demand data and renewable resource
availability from ERCOT, while varying a carbon constraint and the capital cost of constructing
crushed rock TES. Historic demand data and IR resource availability has been provided by
Nestor Sepulveda, a creator of the GenX model.
Page 69
69
Each scenario considers a green field scenario with varying carbon constraints, allowing
GenX to optimize the generation portfolio. The availability of LWRs coupled to crushed rock
TES is also varied, considering favorable and unfavorable performance cases for crushed rock
TES with capital costs of constructing the system of $1, $5, $10, $50, and $100/kWh thermal, as
well as a base case scenario without thermal energy storage. In total, one set of demand and
resource data, seven carbon constraints, two crushed rock performance scenarios with five
potential capital costs, and a base case without thermal energy storage results in 77 total
scenarios. Capacity investment decisions under various conditions will illustrate the value of
crushed rock TES. The figure below illustrates the experimental design.
Figure 27 - Experimental Design
Page 70
70
5. Results and Discussion
5.1 Base Case Investments
The base case scenario, without the option to invest in crushed rock TES, forms the basis
for analysis. The figure below illustrates the effect of a carbon constraint on capacity investment
decisions. All values for invested capacity reported in MW throughout this chapter are in MW
electric. All marginal cost values for reported in $/kWh refer to the cost per kWh of heat stored.
All carbon constraints reported in g CO2/kWh refer to grams of CO2 emitted per kWh of electricity
produced.
The data used for analysis here was taken from the independent system operator for Texas,
ERCOT. As seen below, the Texas grid is a favorable environment for renewables with plentiful
wind and solar availability coupled with cheap natural gas prices. Thus, ERCOT provides a
conservative case for the deployment of thermal energy storage systems; if ERCOT data leads to
heavy investment in thermal energy storage, then the northeast US would likely invest even more
heavily in thermal energy storage technologies.
Figure 28 - Base Case Capacity Investments without TES
Page 71
71
As shown in the above figure, investment in nuclear generation increases with an
increasingly restrictive carbon constraint. The total invested capacity grows as well until a
constraint set at 100 g CO2/kWh before declining with an increasingly restrictive constraint.
Investment in wind generation increases until an emission constraint of 100 g CO2/kWh with
natural gas providing electricity at times of low wind availability. Increasing the constraint beyond
100 g CO2/kWh forces natural gas out of the system, and nuclear generation enters as a partial
replacement. Wind generation decreases as nuclear replaces natural gas, which previously acted
as a low cost substitute for wind at times of low wind availability. Battery storage also increases
at very severe emissions constraints to balance intermittency and partly replace natural gas for
peak production.
5.2 Favorable TES Results
The following figures illustrate the capacity investments resulting from favorable estimates
for crushed rock TES (70% round trip efficiency; $50/kW charging capacity; 25% peaking
capacity) at marginal costs ranging from $1 to $100/kWh. The LWR has an additional cost of
$100/kWe for coupling to TES. Investment in electricity generation from burning coal is not
shown, as investment in coal capacity was never favored. The light pink sections labeled “LWR
with TES” represent the capacity of the coupled LWRs alone without peaking capacity from the
TES. Peaking capacity from TES is illustrated separately as the yellow band at the bottom. As seen
in the figures below, variations in investment differ insignificantly between the favorable trials,
with investment in nuclear generation increasing as expected with an increasingly restrictive
carbon constraint.
Page 74
74
Figure 29 - Capacity Investment for Favorable Crushed Rock Parameters with Varying Marginal
Cost ($1-100/kWh heat)
Table 12 - Capacity Investments for Favorable Cases at 1 and 0 g CO2/kWh Constraint
TES Marginal Cost [$/kWh-heat]CCGT ICGT Nuclear Wind Solar Battery Storage 4h LWR with TES TES Discharge
Base Case (no TES) 9797 0 55942 17542 37685 21992 0 0
1 8738 0 0 14749 55621 12844 47989 5999
5 8603 0 0 15387 54497 12447 48299 6038
10 8109 0 0 14673 54941 12933 48469 6059
50 8384 0 0 13957 46481 7494 53572 6697
100 9177 0 0 14910 42863 5303 55285 6911
Capacity Investment at 1 g CO2/kWhe constraint [MWe]
TES Marginal Cost [$/kWh] CCGT ICGT Nuclear Wind Solar Battery Storage 4h LWR with TES TES Discharge
Base Case (no TES) 9797 0 55942 17542 37685 21992 0 0
1 0 0 0 7901 44388 13650 54484 6811
5 0 0 0 7967 44351 13517 54492 6812
10 0 0 0 7945 44384 13507 54501 6813
50 0 0 0 10997 28407 2413 62746 7844
100 0 0 0 8980 25900 1797 64088 8011
Capacity Investment at 0 g CO2/kWhe constraint [MWe]
Page 75
75
In summary, the model shows major differences between the base-case scenario without
TES and optimal portfolios with TES available. Under favorable conditions, nuclear generation
coupled to TES dominates nuclear generation without TES. Standard investment in nuclear
coupled to TES also decreases battery storage, and as discussed in section 5.5, significantly
decreases electricity prices.
The results reported above suggest that investment in nuclear generation coupled to
crushed rock TES increases with an increasingly restrictive carbon constraint, but that the capacity
share of nuclear generation and TES discharge capacity vary little with an increasing marginal cost
of TES. Under favorable performance assumptions, nuclear generation coupled to TES dominates
the cheaper nuclear generation without TES at any marginal cost of TES. It also seems as though
more expensive TES lowers capacity investments in solar PV generation and slightly increase
investment in wind, albeit well below the wind investment in the base case scenario. Also, an
increasing marginal cost of TES seems counterintuitively correlated with reduced investment in
battery technology. This effect may be due to the effect that expensive TES has on the average
price of electricity. That is, an increase in the price of electricity due to relatively expensive TES
may disproportionately harm the investment prospects for battery storage under the assumed
parameters.
The formulation in GenX also allowed the system to determine both the total capacity of
the TES system (MWh) and the optimal charging and discharging capacities. As the emissions
constraint grows more restrictive, the ratio of crushed rock discharging capacity in MW electric to
LWR capacity decreases to a value of approximately 13%. This value represents the extra peaking
capacity needed to provide the coupled LWRs with the flexibility to balance supply from
renewables and demand. The figure below illustrates this phenomenon for the favorable scenarios.
For example, the total discharge capacity for TES in the $10/kWh scenario amounted to between
12-14% of the total capacity of LWRs coupled to TES at a constraint of 50 g CO2/kWh of energy
produced. The figure below excludes data from a carbon constraint at 200 g CO2/kWh because
both the capacity of LWRs coupled to TES and TES discharge were found to be 0.
Page 76
76
Figure 30 - Optimal Peaking Capacity for Favorable Scenarios
The following graph illustrates the optimal storage capacity under the different scenarios,
with values for the favorable scenarios with marginal costs from $5-50/kWh suggesting 6-12 MWh
heat of storage capacity per MWe of coupled LWR capacity. For example, just above 10 MWh-
heat per MWe of installed LWR capacity would be optimal at a TES marginal cost of $5/kWh and
carbon constraint of 50 g CO2/kWh. The sharp rise at a very restrictive carbon constraint reflects
the increased demand for total TES capacity in the complete absence of natural gas.
Page 77
77
Figure 31 - Sizing TES Capacity [MWh] for Favorable Scenarios Relative to Installed LWR
Capacity [MWh-heat/MWe]
The mixture of nuclear investment is interesting as well. Nuclear generation without
crushed rock TES, which is $100/kWe cheaper than LWR with TES, is never preferred to the LWR
coupled to crushed rock TES under the assumed conditions. However, total investment in crushed
rock TES capacity decreases as the marginal cost of the system increases. The figure below
illustrates this phenomenon of decreasing investment in crushed rock TES as the marginal cost of
storage increases for favorable scenarios. The graphs in Figure 29 provide the total capacity of the
coupled LWRs for comparison. For example, optimal TES capacity investment amounts to
approximately 300 GWh-heat coupled to 14.5 GWe of nuclear generation with a $1/kWh TES
marginal cost and 100 g CO2/kWh constraint. The exact trends between the discrete scenarios ($1,
5, 10, 50, and 100/kWh) are uncertain, but represented here as linear relationships.
Page 78
78
Figure 32 - Total Capacity Investments for TES [MWh-heat] for Favorable Scenarios.
Page 79
79
5.3 Unfavorable TES Scenario Investments
The figures below illustrate the capacity investments for unfavorable crushed rock
conditions (50% round-trip efficiency; 10% peaking capacity; $150/kW charging capacity). As
with the favorable scenario, nuclear generation coupled to TES also incurs a $100/kWe cost
relative to nuclear generation without TES. Unfavorable conditions result in investments in
crushed rock similar to those under favorable conditions, with cases from $1-50/kWh resembling
the favorable scenarios. Nuclear generation without crushed rock TES only becomes favorable
once crushed rock TES reaches a marginal cost of $100/kWh.
Page 82
82
Figure 33 - Capacity Investment for Unfavorable Crushed Rock Parameters with Varying
Marginal Cost ($1-100/kWh heat)
5.4 Charging and Storage Level Samples
As expected, the crushed rock TES charges at times of low prices and discharges at times
of high prices, resulting in similar curves to battery storage. It is important to note that the scenario
with favorable crushed rock TES parameters, a marginal cost of $1/kWh, and carbon constraint at
5 g CO2/kWh charge and discharge over approximately ten hour periods. This charging period is
expected to vary with different renewable availability, but proves the concept that crushed rock
TES could provide at least daily energy storage. Storage levels are cumulative.
Page 83
83
Figure 34 - Crushed Rock Charging and Discharging Profiles and Battery Comparison Over 75
Hour Window
Page 84
84
5.5 Average Prices
The GenX model produces the shadow price, or marginal cost of electricity production, at
each hour for each scenario. Average values of the marginal price for each scenario are plotted
below to illustrate the effect of crushed rock TES on electricity prices. As expected, the lowest
price scenario occurs with the most lenient carbon constraint, where combined-cycle natural gas
plants provide peaking capacity and flexibility to energy generation. However, the average price
for the base case without crushed rock TES rises to $81-82/MWh under more restrictive emission
constraints. Introducing crushed rock TES with either favorable or unfavorable parameter values
results significant price reductions at restrictive emission constraints.
The option to invest in crushed rock TES with favorable parameters at $1/kWh reduced the
average marginal price of electricity from $81/MWh to just above $73/MWh at an emission
constraint of 100 g CO2/kWh. This corresponds to a 23% increase in the price of electricity without
crushed rock TES as the carbon constraint reduces to from 200 to 100 g CO2/kWh, but only an
11% increase in the price of electricity with crushed rock TES. Even trials with unfavorable
parameter estimates reduce the price of electricity by as much as $3/MWh at severe carbon
constraints. As expected, price reductions become less significant as the marginal price of crushed
rock TES increases, with cases at $100/kWh nearly resembling the base case scenario.
Page 85
85
Figure 35 - Effect of Crushed Rock TES Availability on Average Electricity Prices
Page 86
86
5.6 Results with $500/kW Cost for Crushed Rock Capability
All results shown thus far carry the assumption that an LWR with the capability to couple
to crushed rock TES is valued at $100/kW overnight cost more than nuclear generation without
TES. This cost amounts to $100 million higher overnight cost for a 1 GWe reactor with crushed
rock TES capability than one without. The results below illustrate the effect of increasing the
difference in overnight cost to $500/kW, or $500 million for a 1 GWe reactor.
Capacity investment results are similar until a marginal cost of $50/kWh in favorable cases,
at which point a combination of LWRs with crushed rock TES and nuclear generation without
TES becomes favorable. The favorable scenario with a marginal cost of $100/kWh also shows no
investment in crushed rock TES due to the high cost. Unfavorable scenarios all resemble the base
case without TES, except for the scenario with a $1/kWh marginal cost, which shows minor
investment in crushed rock TES at constraints more severe than 10 g CO2/kWh.
Page 88
88
Figure 36 - Capacity Investment with High Overnight Cost for Crushed Rock Availability
Higher overnight costs for LWRs with crushed rock TES also lessened the effect of
crushed rock TES on the average price of electricity as shown in the figures below. Price impacts
are nearly negligible in the unfavorable cases and only drop the marginal cost of electricity
approximately $3/MWh electric in the favorable cases.
Page 89
89
Figure 37 - Crushed Rock TES Effect on Average Prices with High Overnight Cost for Crushed
Rock Availability
Page 90
90
6. Conclusion
6.1 Policy Matters
The results illustrate that coupling crushed rock TES to nuclear generation can provide
flexibility to nuclear generation, better enabling them to load follow. As a result, crushed rock TES
can result in significant price reductions for generation portfolios with significant amounts of
renewable energy generation and low amounts of fossil fuel burning plants. However, the data
suggests that such a portfolio would not exist absent a constraint on carbon emissions. In the
absence of emissions constraints, combined-cycle plants would provide the flexibility needed to
balance demand at low cost ($5.33/MMBtu natural gas), and battery technology could take
advantage of energy arbitrage opportunities presented by heavy investment in renewable
generation (“NREL Annual Technology Baseline Data” 2017). Thus, subsidies for renewable
generation, however well intentioned they may be for limiting emissions, could result in energy
portfolios comprised primarily of renewables, batteries, and natural gas plants.
6.2 Future Work
Results presented in this thesis are largely a product of assumptions. Parametric variations
were used to capture some of the uncertainty in these assumptions, but further investigation is
required. First, a sensitivity analysis is necessary to determine which parameters had the greatest
impact in the variation between the favorable and unfavorable cases. Second, pilot plants should
be used to experimentally confirm performance parameters. Complex interdependencies exist
between system size, charging capacities, peaking capacity, and efficiency, all of which may be
better understood with experimental testing on a large rock pile. As mentioned previously, the
system can be modeled in one dimension, meaning useful results can be obtained from a relatively
inexpensive test bed with a small cross section. Lumped parameters allowed for a relatively simple
proof-of-concept here, but a better understanding of the relationships between parameters is
important for real investment decisions.
The crushed rock TES system was also tested against a limited set of competing
technologies with limited historic data. Fortunately, the formulation used implemented in GenX
for this study is technology agnostic, and can broadly represent any heat storage technology that
couples directly to a reactor. That is, the formulation used in this thesis can represent steam
Page 91
91
accumulators or other sensible heat storage systems. Still, future studies should compare relative
advantages of crushed rock TES over other storage technologies that interact differently on a
system level such as FIRES, and with varying data sources representing regions favorable and
unfavorable for renewable generation. The data set used in this study from ERCOT represents a
region that is favorable to renewable energy generation and has cheap natural gas, making for a
somewhat poor storage environment. The results found in this study suggest storage may be even
more favorable in regions such as the Northeast United States. Different regional data could also
verify system level effects found here, such as the effect of thermal energy storage coupled to
nuclear and battery, wind, and solar investments. Additionally, including data for a heat market
could illustrate the dual-use for crushed rock TES providing industry heat in lieu of natural gas.
In summary, crushed rock TES, subject to parametric constraints, could reduce the price of
electricity in a carbon constrained grid, but the relative advantage compared to other technologies
is still uncertain in the context of LWRs.
As discussed in chapter 3, the temperature difference between the inlet and outlet of a TES
system significantly impacts performance, both in terms of efficiencies and sizing of energy
storage. Separate from the analysis here is the idea that crushed rock TES could be coupled to
other reactor types, such as High-temperature Gas-cooled reactors (HTGRs) and Fluoride-salt-
cooled High-temperature Reactors (FHRs). These reactors operate at significantly higher
temperatures than LWRs, which suggests significant impacts on engineering parameters and costs.
Different reactor designs provide a different market for TES with different competing
technologies. Thus, further studies are required to evaluate the relative advantage of coupling TES
to different reactor designs.
Page 92
92
Appendix A – Engineering Analysis MATLAB Code
The MATLAB code used to produce the figures in chapter 3 is detailed below. Comments
throughout the code explain the structure, and should provide ample guidance for clear
replication.
A.1 Calculating Frictional Pressure Drop
Friction factor is determined as in Allen et al. then plotted as a function of the mass flux
% Parameters
vs = linspace(1,2); % Superficial flow velocity [m/s]
alpha = 0.3; % Void fraction
rho_fluid = 1.2; % Density of air at 20C [kg/m3]
mu = 0.00001846; % Air viscosity at 20C [kg/ms]
G = vs*rho_fluid*alpha; % Mass flux [kg/m2/s]
% Write 0 matrices to decrease runtime
Pumping_p = zeros(100,5);
Pressure_drop = zeros(100,5);
Pressure_drop_kPa = zeros(100,5);
deltaP = zeros(1,100);
figure
hold on
grid on
% For loop calculates pressure drop for rock diameters 4, 8, 12, 16, 20 cm
for i = (1:5)
r = i*0.02; % Radius of the rocks [m]
Dv = ((6/pi*(4/3*pi*r^3))^(1/3));
Re = rho_fluid*vs*Dv/(mu*(1-alpha));
f = 600./Re+12.3./(Re.^0.14); % Equation 9 from Allen et al.
%Calculate the pressure drop through 1 meter of crushed rock
deltaP = ((1-alpha)/(alpha^3)).*f.*(rho_fluid.*(vs.^2)/2); %[Pa]
Pressure_drop(:,i)=deltaP'; % Pressure drop [Pa]
Pressure_drop_kPa = Pressure_drop./1000; % Pressure drop [kPa]
% Calculate the pumping power
Pumping_p(:,i) = deltaP.*vs; %[W]
end
% Plot the pressure drop for different diameters as a function of G
plot(G,Pressure_drop)
title('Flow vs Pressure Drop through One Meter of Crushed Rock')
xlabel('Mass Flux [kg/m^{2}s]')
ylabel('Pressure Drop [Pa]')
Page 93
93
leg1 = legend('4 cm','8 cm','12 cm','16 cm','20 cm');
title(leg1,'Rock Diameter');
Page 94
94
A.2 Time to charge
cp_air = 1.005; % Specific heat capacity of air [kJ/kgK]
Tin = 500; % Inlet temeorature [K]
Tout = 300; % Outlet temperature [K]
c_granite = .790; % Specific heat capacity of granite [kJ/kgK]
rho_granite = 2750; % Density of granite[kg/m3]
figure
hold on
grid on
% For loop calculates times to charge at different heights
for i=[5 10 15 20 25] % 'i' represents the column height here in meters
% Temperature front speed is calculated as in equation 24
Temperature_front_speed = ((G.*cp_air)./(rho_granite.*(1-alpha).*c_granite));
time_to_charge = (i./(Temperature_front_speed))/3600;
plot(G,time_to_charge)
end
ylabel('Time to charge [h]')
xlabel('Mass Flux [kg/m^{2}s]')
title('Charging Time as a Function of Mass Flux')
leg = legend('5 m', '10 m','15 m','20 m','25 m');
title(leg,'Rock Bed Height');
Page 95
95
A.3 Heat Deposited from Air as a Function of mass flux
Calculate the heat deposited [MWh-heat/m2h]
E_deposited = cp_air*G*(Tin-Tout)/1000;
% Plot energy deposited as a function of mass flux
figure
plot(G,E_deposited)
grid on
xlabel('Mass Flux [kg/m^{2}s]')
ylabel('Heat Deposited from Air Inflow [MWh/m^{2}h]')
title('Heat Deposition as a Function of Mass Flux')
% Plot energy deposited as a function of flow velocity
figure
plot(vs,E_deposited)
grid on
xlabel('Superficial Flow Velocity [m/s]')
ylabel('Heat Deposited from Air Inflow [MWh/m^{2}h]')
title('Heat Deposition as a Function of Flow Velocity')
Page 97
97
A.4 Energy Stored at Varying Temperatures
figure
hold on
grid on
height = linspace(1,30);
% For loop calculates energy stored with various temperature differences
for deltaT = [100 200 300 400 500]
% Energy stored in a column is calculated as the mass of granite
% multiplied by the specific heat capacity temperature difference
E_column = (2.77777e-7)*(1-alpha)*rho_granite*c_granite*height*(deltaT);
plot(height,E_column);
end
title('Effect of Temperature Differential on Energy Stored')
ylabel('Energy Stored [MWh/m^{2}]')
xlabel('Height [m]')
leg2 = legend('100 C', '200 C', '300 C', '400 C', '500 C');
title(leg2,'Temperature Differential')
Page 98
98
A.5 Calculating Pumping Power as in Barton
This code plots the ratio of pump work to energy stored as a function of the time to fully charge a
system for rock piles of varying height. Important parameters to consider are the heat conversion
efficiency, temperature difference, and rock diameter
% Parameters
for d=[0.1 0.2]
%d = 0.2; % Diameter of pebbles [m]
Delta_T = 200; % Delta T [K]
v_h = linspace(.5,5); % Bulk air speed [m/s]
alpha = 0.3; % Void fraction
alpha_i = (1-alpha);
mu_a = .000021; % Air viscosity [Pas]
rho_a = 0.854; % Density of air at 140C [kg/m3]
Ca = 1009; %[J/(kgK)]
c_granite = 790; % Specific heat capacity of granite [kJ/kgK]
rho_granite = 27500; % Density of granite [kg/m3]
heat_conversion_efficiency = 0.5; % Unitless
G = rho_a*v_h; % Mass flux [kg/(m2s)]
% Calculate temperature speed as before
Temperature_front_speed = ((G.*Ca)./(rho_granite.*alpha_i*c_granite));
figure
hold on
% For loop calculates data for various rock bed heights
for i = 1:5
H(i) = 5*i; % Height [m]
% Calculate Delta P - Equation 18 from Barton
P_term
=(150*mu_a*(alpha_i^2).*v_h)/((alpha^3)*(d^2))+(1.755*alpha_i*rho_a.*v_h.^2)/(d*alpha^3);
Delta_P = P_term.*H(i); % Pressure drop [Pa]
% Calculate time to charge
time_to_charge = (H(i)./(Temperature_front_speed)); % charging time [s]
time_hours(:,i) = time_to_charge/3600;
%Calculate pumping energy
E_pump = time_to_charge.*Delta_P.*v_h; % Pumping energy required [J/m2]
% Compare to heat from airstream
E_air = Delta_T*G*Ca.*time_to_charge*heat_conversion_efficiency;
% Calculate Pump Work Ratio
Pump_work_ratio = 200.*E_pump./E_air; %multiplied by 2 to account for discharge
percent_power_used(:,i) = Pump_work_ratio;
end
Page 99
99
plot(time_hours, percent_power_used)
grid on
ylabel('Ratio of Pump Work to Energy Stored [%]');
ylim([0,100]);
xlabel('Time to Full Charge in Hours');
xlim([0,60]);
basetitle = 'Pumping Work Required to Charge Rock Beds of Varying Heights; D = ';
title([basetitle,num2str(d)]);
leg = legend('5 m','10 m','15 m','20 m','25 m');
title(leg,'Rock Bed Height');
end
Page 100
100
Published with MATLAB® R2017b
Page 101
101
References
Allen, K.g., T.w. von Backström, D.g. Kröger, and A.f.m. Kisters. 2014. “Rock Bed Storage for
Solar Thermal Power Plants: Rock Characteristics, Suitability, and Availability.” Solar
Energy Materials and Solar Cells 126 (July): 170–83.
https://doi.org/10.1016/j.solmat.2014.03.030.
Andrei Koekemoer, and Adam Luckos. 2015. “Effect of Material Type and Particle Size
Distribution on Pressure Drop in Packed Beds of Large Particles: Extending the Ergun
Equation.” Fuel 158 (October): 232–38.
Barton, N.g. 2013. “Simulations of Air-Blown Thermal Storage in a Rock Bed.” Applied
Thermal Engineering 55 (June): 43–50.
https://doi.org/10.1016/j.applthermaleng.2013.03.002.
Braff, W.a., J.m. Mueller, and J.e. Trancik. 2016. “Value of Storage Technologies for Wind and
Solar Energy.” Nature Climate Change 6 (10): 964–69.
https://doi.org/10.1038/nclimate3045.
“California Plug-In Electric Vehicle Infrastructure Projections: 2017-2025.” 2018. 17-ALT-01.
California Energy Commission.
“California Solar Spike Leads to Negative CAISO Real-Time Prices in March.” 2017. Utility
Dive. 2017. http://www.utilitydive.com/news/california-solar-spike-leads-to-negative-
caiso-real-time-prices-in-march/440114/.
Canada, Environment and Climate Change, and Environment and Climate Change Canada. 2017.
“Pricing Carbon Pollution in Canada: How It Will Work.” Backgrounders. Gcnws. May
18, 2017. https://www.canada.ca/en/environment-climate-
change/news/2017/05/pricing_carbon_pollutionincanadahowitwillwork.html.
Charles Forsberg. 2017. “Heat Storage for Peak Power with Base-Load Rankine-Cycle LWRs
And Brayton-Cycle High-Temperature Reactors.” American Nuclear Society Annual
Meeting, Vol. 116, June 11-15, 2017.
Charles Forsberg, J. Parsons, G. Haratyk, J. Jenkins, J. Wooten, J. Gasper, S. Brick, et al. 2017.
“Light Water Reactor Heat Storage for Peak Power and Increased Revenue: Focused
Workshop on Near-Term Options.” MIT-ANP-TR-170. MIT CANES.
https://energy.mit.edu/publication/light-water-reactor-heat-storage-peak-power-
increased-revenue/.
“Densities of Solids.” 2009. 2009. https://www.engineeringtoolbox.com/density-solids-
d_1265.html.
Erin Boyd. 2016. “Power Sector Modeling 101.” Department of Energy - Office of Energy
Policy and Systems Analysis, February 18.
https://www.energy.gov/sites/prod/files/2016/02/f30/EPSA_Power_Sector_Modeling_FI
NAL_021816_0.pdf.
Forsberg, C. W., D. Curtis, and D. Stack. 2017. “Light Water Reactors with Crushed Rock
Thermal Storage for Industrial Heat and High-Value Electricity.” NUCLEAR
TECHNOLOGY 198 (1): 70–78.
Forsberg, C. W.1, D.1 Curtis, and D.1 Stack. 2017. “Light Water Reactors with Crushed Rock
Thermal Storage for Industrial Heat and High-Value Electricity.” Nuclear Technology
198 (1): 70–78. https://doi.org/10.1080/00295450.2017.1294426.
G. Zanganeh, and et al. 2012. “Packed-Bed Thermal Storage for Concentrated Solar Power –
Pilot-Scale Demonstration and Industrial-Scale Design.” Solar Energy 86: 3084–98.
Page 102
102
Giw Zanganeh. 2016. “Demonstration of the Ability of Caverns for Compressed AIr Storage
with Thermal Energy Recuperation.” Biasca: Swiss Federal Office of Energy SFOE.
Goran Strbac, Marko Aunedi, Danny Pudjianto, Predrag Djapic, Fei Tang, Alexander Sturt,
Dejvises Jackravut, Robert Sansom, Vladimir Yufit, and Nigel Brandon. 2012. “Strategic
Assessment of the Role and Value of Energy Storage Systems in the UK Low Carbon
Energy Future.” Energy Futures Lab, Imperial College London.
Ha¨nchen, M., S. Bru¨ckner, and A. Steinfeld. 2011. “High-Temperature Thermal Storage Using
a Packed Bed of Rocks - Heat Transfer Analysis and Experimental Validation.” Applied
Thermal Engineering 31 (10): 1798–1806.
https://doi.org/10.1016/j.applthermaleng.2010.10.034.
“Heat Loss from Buildings.” 2003. 2003. https://www.engineeringtoolbox.com/heat-loss-
buildings-d_113.html.
H.R. 2029 Consolidated Appropriations Act. 2016.
Ignacio Perez-Arriaga, and Christopher Knittel. 2016. “Utility of the Future: An MIT Energy
Initiative Response to an Industry in Transition.” MIT Energy Initiative.
energy.mit.edu/uof.
Jemmal, Y., N. Zari, and M. Maaroufi. 2016. “Thermophysical and Chemical Analysis of Gneiss
Rock as Low Cost Candidate Material for Thermal Energy Storage in Concentrated Solar
Power Plants.” Solar Energy Materials and Solar Cells 157 (December): 377–82.
https://doi.org/10.1016/j.solmat.2016.06.002.
Jesse D. Jenkins, and Nestor A. Sepulveda. 2017. “Enhanced Decision Support for a Changing
Electricity Landscape: The GenX Configurable ELectricity Resource Capacity Expansion
Model.” An MIT Energy Initiative Working Paper. https://energy.mit.edu/wp-
content/uploads/2017/10/Enhanced-Decision-Support-for-a-Changing-Electricity-
Landscape.pdf.
K. G. Allen, T.W. von Backstrom, and D.G. Kroger. 2015. “Rock Bed Pressure Drop and Heat
Transfer: Simple Design Correlations.” Solar Energy 115 (May): 525–36.
Laubscher, H.f., T.w. von Backstro¨m, and F. Dinter. 2017. “Developing a Cost Effective Rock
Bed Thermal Energy Storage System: Design and Modelling.” In AIP Conference
Proceedings, 1850:080015. AIP - American Institute of Physics.
https://doi.org/10.1063/1.4984436.
“Lazard’s Levelized Cost of Storage Analysis - Version 3.0.” 2017. Lazard.
Li, Jianlin, Zhijia Du, Rose E. Ruther, Seong Jin An, Lamuel Abraham David, Kevin Hays,
Marissa Wood, et al. 2017. “Toward Low-Cost, High-Energy Density, and High-Power
Density Lithium-Ion Batteries.” JOM 69 (9): 1484–96. https://doi.org/10.1007/s11837-
017-2404-9.
Lucas W. Davis. 2012. “Prospects for Nuclear Power.” Journal of Economic Perspectives 26 (1).
Naomi Oreskes, Kristin Shrader-Frechette, and Kenneth Belitz. 1994. “Verification, Validation,
and Confirmation of Numerical Models in the Earth Sciences.” Science 263 (5147): 641.
Neil Todreas, and Mujid Kazimi. 2011. Nuclear Systems: Thermal Hydraulic Fundamentals.
Second. CRC Press.
“NREL Annual Technology Baseline Data.” 2017. 2017.
https://atb.nrel.gov/electricity/data.html.
“Power Cycles for the Generation of Electricity from a Next Generation Nuclear Plant.” 2010.
Technical Evaluation Study 23843. Idaho National Laboratory.
Page 103
103
Projected Costs of Generating Electricity. 2015. International Energy Agency. 2015.
https://webstore.iea.org/projected-costs-of-generating-electricity-2015
“Red Leaf Resources, Inc. |.” 2017. 2017. http://redleafinc.com/.
“Renewable Electricity Production Tax Credit (PTC) | Department of Energy.” 2018. 2018.
https://energy.gov/savings/renewable-electricity-production-tax-credit-ptc.
Reuters. 2017. “U.S. Submits Formal Notice of Withdrawal from Paris Climate Pact,” August 4,
2017. https://www.reuters.com/article/us-un-climate-usa-paris/u-s-submits-formal-notice-
of-withdrawal-from-paris-climate-pact-idUSKBN1AK2FM.
Robin Cowan. 1990. “Nuclear Power Reactors: A Study in Technological Lock-In.” The Journal
of Economic History 50 (3): 541–67.
“RPS Homepage.” 2018. 2018. http://www.cpuc.ca.gov/RPS_Homepage/.
“Siemens Gamesa Starts Construction Of Heat Rock-Fill Storage For Wind Energy.” 2017.
CleanTechnica. December 1, 2017. https://cleantechnica.com/2017/12/01/siemens-
gamesa-starts-construction-heat-rock-fill-storage-wind-energy/.
“Specific Heat of Common Substances.” 2003. 2003.
https://www.engineeringtoolbox.com/specific-heat-capacity-d_391.html.
Talavera, D.l., J.p. Ferrer-Rodríguez, P. Pérez-Higueras, J. Terrados, and E.f. Fernández. 2016.
“A Worldwide Assessment of Levelised Cost of Electricity of HCPV Systems.” Energy
Conversion and Management 127 (November): 679–92.
https://doi.org/10.1016/j.enconman.2016.09.054.
“The Future of Solar Energy.” 2015. Massachusetts Institute of Technology.
“The Paris Agreement - Main Page.” 2018. 2018.
http://unfccc.int/paris_agreement/items/9485.php.
“The U.S. Won’t Actually Leave the Paris Climate Deal Anytime Soon - The New York Times.”
2017. 2017. https://www.nytimes.com/2017/06/07/climate/trump-paris-climate-
timeline.html.
“Thermal Conductivity of Common Materials and Gases.” 2003. 2003.
https://www.engineeringtoolbox.com/thermal-conductivity-d_429.html.
“Updated Capital Cost Estimates for Utility Scale Electricity Generating Plants.” 2016. U.S.
Energy Information Administration. November 22, 2016.
https://www.eia.gov/analysis/studies/powerplants/capitalcost/.
U.S. Department of Energy. 2017. “Staff Report on Electricity Markets and Reliability.”