Crustal tomography under the Median Tectonic Line in Southwest Japan using P and PmP data Sandeep Gupta a,b, * , Dapeng Zhao b , M. Ikeda c , S. Ueki b , S.S. Rai a a National Geophysical Research Institute, Hyderabad 500 007, India b Department of Geophysics, Tohoku University, Sendai 980-8578, Japan c Department of Civil Engineering, Shikoku Research Institute, Takamatsu 761-0192, Japan article info Article history: Received 9 June 2008 Received in revised form 24 December 2008 Accepted 7 January 2009 Keywords: Median tectonic line (MTL) Seismic tomography Reflected waves Low-velocity anomalies Fluids abstract The Median Tectonic Line (MTL) is the largest active fault system on the Japan Islands and underlies many densely populated areas. To understand the seismotectonics and to reduce seismic hazard in the MTL region, we determined a detailed 3-D crustal structure under the region using a large number of arrival times of the first P-waves and Moho-reflected waves (PmP). Results of detailed resolution tests show that the addition of PmP data can significantly improve the resolution of the lower crustal structure and the entire crustal structure can be imaged better than that by using P-wave data alone. The obtained tomo- graphic images show that prominent low-velocity (low-V) anomalies are visible in the upper crust along the MTL. In addition, some low-V anomalies are visible in the lower crust on either side of the MTL. These low-V anomalies can be the weaker sections of the seismogenic crust and can be imprint of the existence and migration of aqueous fluids released by the dehydration process of the subducting Philippine Sea plate under Southwest Japan. Ó 2009 Elsevier Ltd. All rights reserved. 1. Introduction The Japanese Islands are broadly divided into Northeastern (NE) and Southwestern (SW) Japan based the geo-tectonic features. In SW Japan, the Pacific plate is descending from the east beneath the Philippine Sea (PHS) and Eurasian plates, while the PHS plate is subducting beneath the Eurasian plate from the Nankai Trough at a rate of about 4 cm/year in the N50°W direction (Seno et al., 1993). Roughly parallel with the Nankai Trough, the east–west trending Median Tectonic Line (MTL) is the largest arc-parallel ac- tive fault system in SW Japan and is located above the subducting PHS slab (Shiono, 1980; Zhao et al., 2004; Maruyama and Santosh, 2007)(Fig. 1). The MTL fault system was formed probably during the Cretaceous and reactivated many times with both right- and left-lateral strike-slip faultings (Tsutsumi et al., 1991; Tsutsumi and Okada, 1996). Similar to the San Andreas and North Anatolian fault systems, the long MTL fault system probably does not rupture along its en- tire length during a single earthquake. As implied by its multiple seismic segmented characters, rupturing more likely occurs as suc- cessive, independent events (Tsutsumi and Okada, 1996; Goto et al., 2001; Ikeda et al., 2006). Since A.D. 1500, eight destructive earthquakes of magnitude (M) 6.5 or greater occurred along the MTL in Shikoku and western Kii Peninsula (Usami, 1996). Many geological studies have also been made to investigate the past activity of the MTL (e.g., Tsutsumi and Okada, 1996; Goto et al., 2001). The earthquake recurrence interval is estimated to be 1000–3000 years in Shikoku Island (Tsutsumi and Okada, 1996). But the historical records, geological studies, and the time-predict- able models for earthquake recurrence are not sufficient for fore- casting earthquakes in the MTL for next a few hundred years. Previous studies have shown that the presence of fluids in and be- low the seismogenic zone can affect the long-term structural evo- lution of the fault zone, and can alter the fault-zone strength and local stress regime (Sibson, 1992; Hickman et al., 1995). Moreover, Zhao et al. (1996, 2000) have shown the effect of fluids on the shortening of seismic cycles in a tectonically active region, taking the 1995 Kobe earthquake (M 7.2) as an example in SW Japan. Therefore, studying the crustal heterogeneity (through detailed crustal velocity structure), in particular, the role of fluids in the MTL fault system which underlies many densely populated areas, becomes very important to understand the seismotectonics and seismic hazard scenario in SW Japan. Seismic tomography is a very useful tool for clarifying the crus- tal structure, seismotectonics, and volcanism. Using seismic tomography, Zhao et al. (2000) have shown that in Japan the presence and distribution of low-velocity (low-V) anomalies in the crust and uppermost mantle are closely correlated with the 1367-9120/$ - see front matter Ó 2009 Elsevier Ltd. All rights reserved. doi:10.1016/j.jseaes.2009.01.004 * Corresponding author. Address: National Geophysical Research Institute, Hyderabad, Andhra Pradesh 500 007, India. Tel.: +91 40 23434700; fax: +91 40 23434651, +81 22 2643292. E-mail addresses: [email protected], [email protected](S. Gupta), [email protected](D. Zhao). Journal of Asian Earth Sciences 35 (2009) 377–390 Contents lists available at ScienceDirect Journal of Asian Earth Sciences journal homepage: www.elsevier.com/locate/jaes
Transcript
Journal of Asian Earth Sciences 35 (2009) 377–390
Contents lists available at ScienceDirect
Journal of Asian Earth Sciences
journal homepage: www.elsevier .com/ locate/ jaes
Crustal tomography under the Median Tectonic Line in Southwest Japanusing P and PmP data
Sandeep Gupta a,b,*, Dapeng Zhao b, M. Ikeda c, S. Ueki b, S.S. Rai a
a National Geophysical Research Institute, Hyderabad 500 007, Indiab Department of Geophysics, Tohoku University, Sendai 980-8578, Japanc Department of Civil Engineering, Shikoku Research Institute, Takamatsu 761-0192, Japan
a r t i c l e i n f o a b s t r a c t
Article history:Received 9 June 2008Received in revised form 24 December 2008Accepted 7 January 2009
Keywords:Median tectonic line (MTL)Seismic tomographyReflected wavesLow-velocity anomaliesFluids
1367-9120/$ - see front matter � 2009 Elsevier Ltd. Adoi:10.1016/j.jseaes.2009.01.004
* Corresponding author. Address: National GeoHyderabad, Andhra Pradesh 500 007, India. Tel.: +923434651, +81 22 2643292.
The Median Tectonic Line (MTL) is the largest active fault system on the Japan Islands and underlies manydensely populated areas. To understand the seismotectonics and to reduce seismic hazard in the MTLregion, we determined a detailed 3-D crustal structure under the region using a large number of arrivaltimes of the first P-waves and Moho-reflected waves (PmP). Results of detailed resolution tests show thatthe addition of PmP data can significantly improve the resolution of the lower crustal structure and theentire crustal structure can be imaged better than that by using P-wave data alone. The obtained tomo-graphic images show that prominent low-velocity (low-V) anomalies are visible in the upper crust alongthe MTL. In addition, some low-V anomalies are visible in the lower crust on either side of the MTL. Theselow-V anomalies can be the weaker sections of the seismogenic crust and can be imprint of the existenceand migration of aqueous fluids released by the dehydration process of the subducting Philippine Seaplate under Southwest Japan.
� 2009 Elsevier Ltd. All rights reserved.
1. Introduction
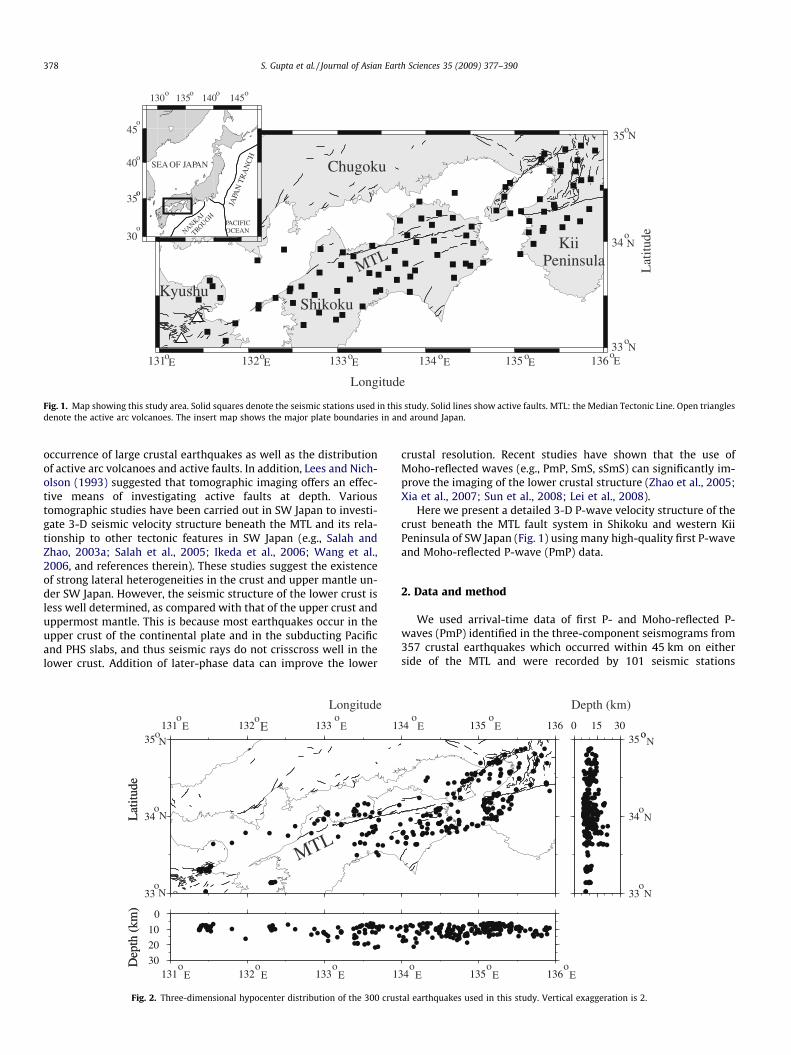
The Japanese Islands are broadly divided into Northeastern (NE)and Southwestern (SW) Japan based the geo-tectonic features. InSW Japan, the Pacific plate is descending from the east beneaththe Philippine Sea (PHS) and Eurasian plates, while the PHS plateis subducting beneath the Eurasian plate from the Nankai Troughat a rate of about 4 cm/year in the N50�W direction (Seno et al.,1993). Roughly parallel with the Nankai Trough, the east–westtrending Median Tectonic Line (MTL) is the largest arc-parallel ac-tive fault system in SW Japan and is located above the subductingPHS slab (Shiono, 1980; Zhao et al., 2004; Maruyama and Santosh,2007) (Fig. 1). The MTL fault system was formed probably duringthe Cretaceous and reactivated many times with both right- andleft-lateral strike-slip faultings (Tsutsumi et al., 1991; Tsutsumiand Okada, 1996).
Similar to the San Andreas and North Anatolian fault systems,the long MTL fault system probably does not rupture along its en-tire length during a single earthquake. As implied by its multipleseismic segmented characters, rupturing more likely occurs as suc-cessive, independent events (Tsutsumi and Okada, 1996; Goto
ll rights reserved.
physical Research Institute,1 40 23434700; fax: +91 40
et al., 2001; Ikeda et al., 2006). Since A.D. 1500, eight destructiveearthquakes of magnitude (M) 6.5 or greater occurred along theMTL in Shikoku and western Kii Peninsula (Usami, 1996). Manygeological studies have also been made to investigate the pastactivity of the MTL (e.g., Tsutsumi and Okada, 1996; Goto et al.,2001). The earthquake recurrence interval is estimated to be1000–3000 years in Shikoku Island (Tsutsumi and Okada, 1996).But the historical records, geological studies, and the time-predict-able models for earthquake recurrence are not sufficient for fore-casting earthquakes in the MTL for next a few hundred years.Previous studies have shown that the presence of fluids in and be-low the seismogenic zone can affect the long-term structural evo-lution of the fault zone, and can alter the fault-zone strength andlocal stress regime (Sibson, 1992; Hickman et al., 1995). Moreover,Zhao et al. (1996, 2000) have shown the effect of fluids on theshortening of seismic cycles in a tectonically active region, takingthe 1995 Kobe earthquake (M 7.2) as an example in SW Japan.Therefore, studying the crustal heterogeneity (through detailedcrustal velocity structure), in particular, the role of fluids in theMTL fault system which underlies many densely populated areas,becomes very important to understand the seismotectonics andseismic hazard scenario in SW Japan.
Seismic tomography is a very useful tool for clarifying the crus-tal structure, seismotectonics, and volcanism. Using seismictomography, Zhao et al. (2000) have shown that in Japan thepresence and distribution of low-velocity (low-V) anomalies inthe crust and uppermost mantle are closely correlated with the
Fig. 1. Map showing this study area. Solid squares denote the seismic stations used in this study. Solid lines show active faults. MTL: the Median Tectonic Line. Open trianglesdenote the active arc volcanoes. The insert map shows the major plate boundaries in and around Japan.
378 S. Gupta et al. / Journal of Asian Earth Sciences 35 (2009) 377–390
occurrence of large crustal earthquakes as well as the distributionof active arc volcanoes and active faults. In addition, Lees and Nich-olson (1993) suggested that tomographic imaging offers an effec-tive means of investigating active faults at depth. Varioustomographic studies have been carried out in SW Japan to investi-gate 3-D seismic velocity structure beneath the MTL and its rela-tionship to other tectonic features in SW Japan (e.g., Salah andZhao, 2003a; Salah et al., 2005; Ikeda et al., 2006; Wang et al.,2006, and references therein). These studies suggest the existenceof strong lateral heterogeneities in the crust and upper mantle un-der SW Japan. However, the seismic structure of the lower crust isless well determined, as compared with that of the upper crust anduppermost mantle. This is because most earthquakes occur in theupper crust of the continental plate and in the subducting Pacificand PHS slabs, and thus seismic rays do not crisscross well in thelower crust. Addition of later-phase data can improve the lower
33
34
35131 132 133 1
0
10
20
30131 132 133 1
oE
oE
oE
oE
oE
oE
oN
oN
oN
Longitude
)mk(
htpeD
edutitaL
MTL
)mk(
htpeD
edutitaL
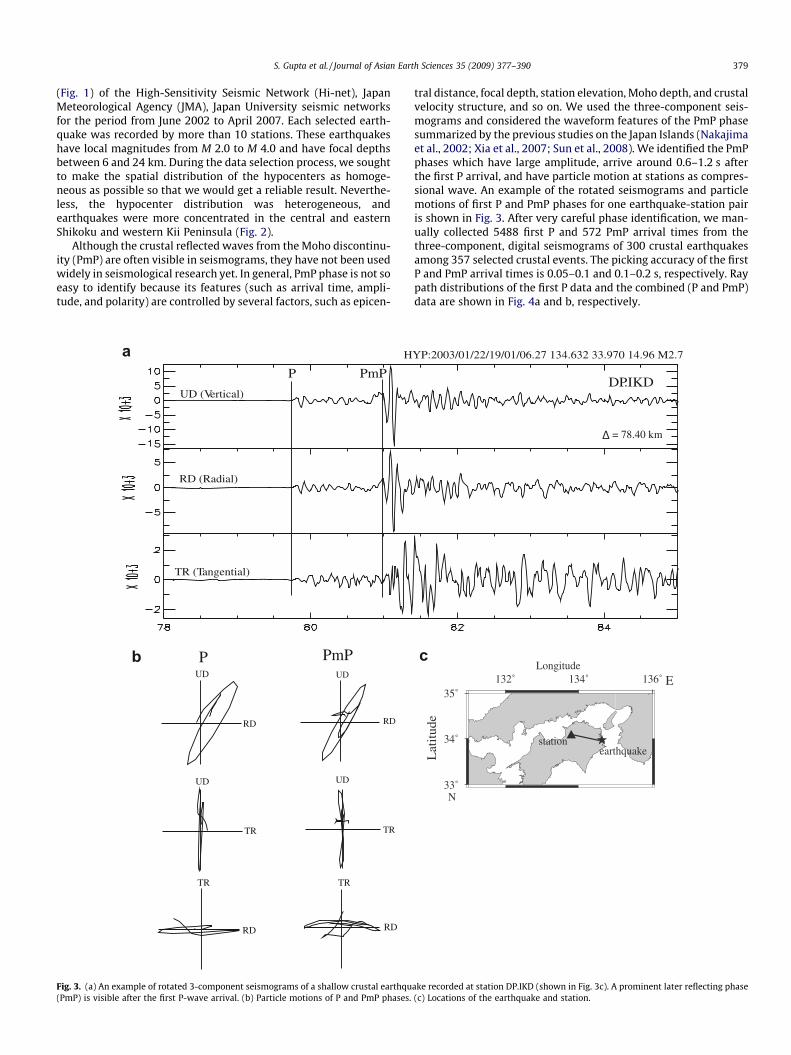
Fig. 2. Three-dimensional hypocenter distribution of the 300 crus
crustal resolution. Recent studies have shown that the use ofMoho-reflected waves (e.g., PmP, SmS, sSmS) can significantly im-prove the imaging of the lower crustal structure (Zhao et al., 2005;Xia et al., 2007; Sun et al., 2008; Lei et al., 2008).
Here we present a detailed 3-D P-wave velocity structure of thecrust beneath the MTL fault system in Shikoku and western KiiPeninsula of SW Japan (Fig. 1) using many high-quality first P-waveand Moho-reflected P-wave (PmP) data.
2. Data and method
We used arrival-time data of first P- and Moho-reflected P-waves (PmP) identified in the three-component seismograms from357 crustal earthquakes which occurred within 45 km on eitherside of the MTL and were recorded by 101 seismic stations
34 135 136
33
34
350 15 30
34 135 136
oN
oE
oE
oE
oE
oE
oN
oN
o
Depth (km)
tal earthquakes used in this study. Vertical exaggeration is 2.
S. Gupta et al. / Journal of Asian Earth Sciences 35 (2009) 377–390 379
(Fig. 1) of the High-Sensitivity Seismic Network (Hi-net), JapanMeteorological Agency (JMA), Japan University seismic networksfor the period from June 2002 to April 2007. Each selected earth-quake was recorded by more than 10 stations. These earthquakeshave local magnitudes from M 2.0 to M 4.0 and have focal depthsbetween 6 and 24 km. During the data selection process, we soughtto make the spatial distribution of the hypocenters as homoge-neous as possible so that we would get a reliable result. Neverthe-less, the hypocenter distribution was heterogeneous, andearthquakes were more concentrated in the central and easternShikoku and western Kii Peninsula (Fig. 2).
Although the crustal reflected waves from the Moho discontinu-ity (PmP) are often visible in seismograms, they have not been usedwidely in seismological research yet. In general, PmP phase is not soeasy to identify because its features (such as arrival time, ampli-tude, and polarity) are controlled by several factors, such as epicen-
bUD
RD
PUD
RD
PmP
UD
TR
UD
TR
TR TR
RD RD
UD (Vertical)
RD (Radial)
TR (Tangential)
P PmP
Ha
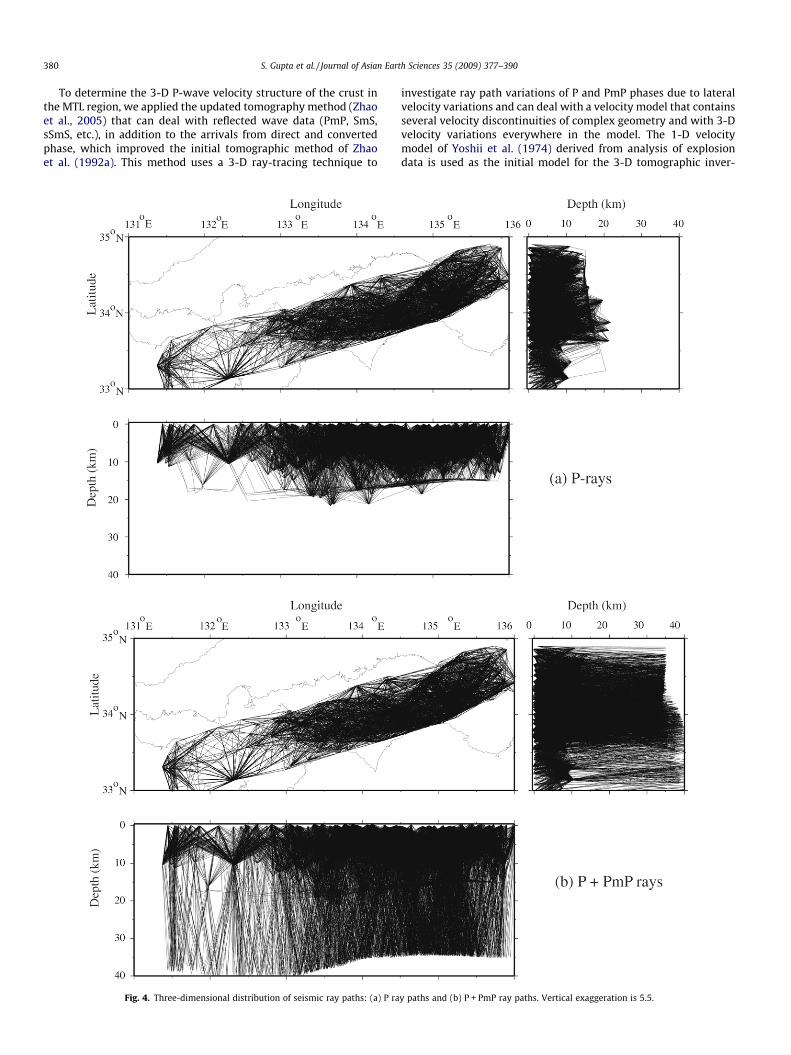
Fig. 3. (a) An example of rotated 3-component seismograms of a shallow crustal earthqu(PmP) is visible after the first P-wave arrival. (b) Particle motions of P and PmP phases.
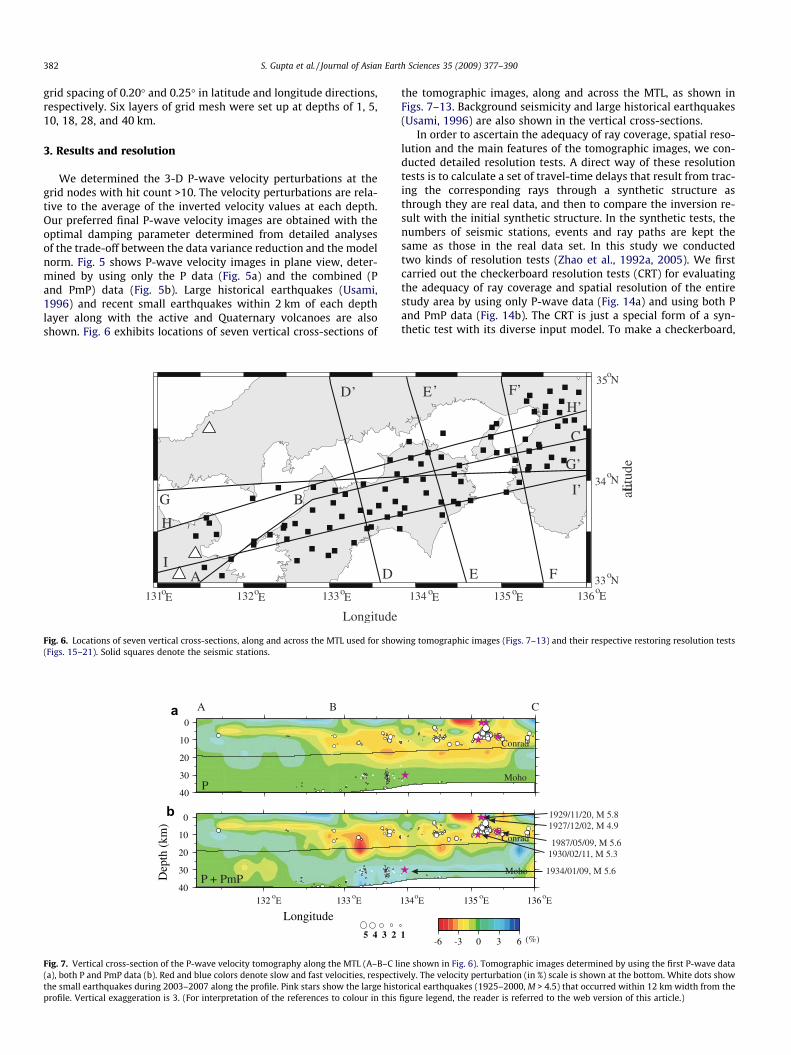
tral distance, focal depth, station elevation, Moho depth, and crustalvelocity structure, and so on. We used the three-component seis-mograms and considered the waveform features of the PmP phasesummarized by the previous studies on the Japan Islands (Nakajimaet al., 2002; Xia et al., 2007; Sun et al., 2008). We identified the PmPphases which have large amplitude, arrive around 0.6–1.2 s afterthe first P arrival, and have particle motion at stations as compres-sional wave. An example of the rotated seismograms and particlemotions of first P and PmP phases for one earthquake-station pairis shown in Fig. 3. After very careful phase identification, we man-ually collected 5488 first P and 572 PmP arrival times from thethree-component, digital seismograms of 300 crustal earthquakesamong 357 selected crustal events. The picking accuracy of the firstP and PmP arrival times is 0.05–0.1 and 0.1–0.2 s, respectively. Raypath distributions of the first P data and the combined (P and PmP)data are shown in Fig. 4a and b, respectively.
ake recorded at station DP.IKD (shown in Fig. 3c). A prominent later reflecting phase(c) Locations of the earthquake and station.
380 S. Gupta et al. / Journal of Asian Earth Sciences 35 (2009) 377–390
To determine the 3-D P-wave velocity structure of the crust inthe MTL region, we applied the updated tomography method (Zhaoet al., 2005) that can deal with reflected wave data (PmP, SmS,sSmS, etc.), in addition to the arrivals from direct and convertedphase, which improved the initial tomographic method of Zhaoet al. (1992a). This method uses a 3-D ray-tracing technique to
Fig. 4. Three-dimensional distribution of seismic ray paths: (a) P ra
investigate ray path variations of P and PmP phases due to lateralvelocity variations and can deal with a velocity model that containsseveral velocity discontinuities of complex geometry and with 3-Dvelocity variations everywhere in the model. The 1-D velocitymodel of Yoshii et al. (1974) derived from analysis of explosiondata is used as the initial model for the 3-D tomographic inver-
y paths and (b) P + PmP ray paths. Vertical exaggeration is 5.5.
S. Gupta et al. / Journal of Asian Earth Sciences 35 (2009) 377–390 381
sions. The lateral depth variations of the Conrad and Moho discon-tinuities under the study region (Zhao et al., 1992b; Shiomi et al.,2006) were taken into account in the 3-D ray tracing and the tomo-graphic inversion. The LSQR algorithm (Paige and Saunders, 1982)
Fig. 5. Plane views of P-wave velocity tomography obtained by using the first P-wave daeach map. Red and blue colors denote slow and fast velocities, respectively. The velocity psmall earthquakes during 2003–2007 and large historical earthquakes (1925–2000, M >show the active and Quaternary volcanoes. (For interpretation of the references to colou
with damping and smoothing regulations (Zhao et al., 2005), wasused to solve the observation equations. For the model space, weconsidered 33�–35�N, 131�–136�E and 0–40 km in latitude, longi-tude, and depth ranges, respectively. We set up grid nodes with a
ta (a), both P and PmP data (b). The layer depth is shown on the upper-left corner oferturbation (in %) scale is shown at the bottom. White dots and pink stars show the4.5), respectively, that occurred within 2 km of each depth slice. The red trianglesr in this figure legend, the reader is referred to the web version of this article.)
382 S. Gupta et al. / Journal of Asian Earth Sciences 35 (2009) 377–390
grid spacing of 0.20� and 0.25� in latitude and longitude directions,respectively. Six layers of grid mesh were set up at depths of 1, 5,10, 18, 28, and 40 km.
3. Results and resolution
We determined the 3-D P-wave velocity perturbations at thegrid nodes with hit count >10. The velocity perturbations are rela-tive to the average of the inverted velocity values at each depth.Our preferred final P-wave velocity images are obtained with theoptimal damping parameter determined from detailed analysesof the trade-off between the data variance reduction and the modelnorm. Fig. 5 shows P-wave velocity images in plane view, deter-mined by using only the P data (Fig. 5a) and the combined (Pand PmP) data (Fig. 5b). Large historical earthquakes (Usami,1996) and recent small earthquakes within 2 km of each depthlayer along with the active and Quaternary volcanoes are alsoshown. Fig. 6 exhibits locations of seven vertical cross-sections of
133132131 oE
oE
oE
Longitude
D
D’
G
H
IA
B
Fig. 6. Locations of seven vertical cross-sections, along and across the MTL used for show(Figs. 15–21). Solid squares denote the seismic stations.
0
10
20
30
40
0
10
20
30
40
)mk(
htpeD
132 133
Longitude
5 4 3 2
oE oE
A B
P
P + PmP
a
b
Fig. 7. Vertical cross-section of the P-wave velocity tomography along the MTL (A–B–C li(a), both P and PmP data (b). Red and blue colors denote slow and fast velocities, respectithe small earthquakes during 2003–2007 along the profile. Pink stars show the large histprofile. Vertical exaggeration is 3. (For interpretation of the references to colour in this
the tomographic images, along and across the MTL, as shown inFigs. 7–13. Background seismicity and large historical earthquakes(Usami, 1996) are also shown in the vertical cross-sections.
In order to ascertain the adequacy of ray coverage, spatial reso-lution and the main features of the tomographic images, we con-ducted detailed resolution tests. A direct way of these resolutiontests is to calculate a set of travel-time delays that result from trac-ing the corresponding rays through a synthetic structure asthrough they are real data, and then to compare the inversion re-sult with the initial synthetic structure. In the synthetic tests, thenumbers of seismic stations, events and ray paths are kept thesame as those in the real data set. In this study we conductedtwo kinds of resolution tests (Zhao et al., 1992a, 2005). We firstcarried out the checkerboard resolution tests (CRT) for evaluatingthe adequacy of ray coverage and spatial resolution of the entirestudy area by using only P-wave data (Fig. 14a) and using both Pand PmP data (Fig. 14b). The CRT is just a special form of a syn-thetic test with its diverse input model. To make a checkerboard,
136135134oEo
EoE
35
34
33oN
oN
oN
edutitaL
E F
E’ F’H’
I’
G’
C
ing tomographic images (Figs. 7–13) and their respective restoring resolution tests
134 135 136
1-6 -3 0 3 6 (%)
oE oE oE
C
Moho
Moho
Conrad
Conrad
1927/12/02, M 4.91929/11/20, M 5.8
1987/05/09, M 5.61930/02/11, M 5.3
1934/01/09, M 5.6
ne shown in Fig. 6). Tomographic images determined by using the first P-wave datavely. The velocity perturbation (in %) scale is shown at the bottom. White dots showorical earthquakes (1925–2000, M > 4.5) that occurred within 12 km width from thefigure legend, the reader is referred to the web version of this article.)
0
10
20
30
40
0
10
20
30
40
)mk(
htpeD
33 34 35
Latitude
5 4 3 2 1-6 -3 0 3 6 (%)
oN
Moho
Conrad
P + PmP
Surface trace of MTLE E’
P
Moho
Conrad
oNoN
1955/07/27,M 6.4
a
b
Fig. 9. The same as Fig. 7 but along the profile E–E0 shown in Fig. 6.
0
10
20
30
40
0
10
20
30
40
)mk(
htpeD
33 34 35Latitude
P (a)
oN oN
P + PmP
Moho
Conrad
Moho
Conrad
(b)oN
5 4 3 2 1-6 -3 0 3 6 (%)
F F’
1929/11/20, M 5.81927/12/02, M 4.9
1987/05/09, M 5.6
1930/02/11, M 5.3
1995/01/17, M 7.2(Kobe EQ)
1948/06/15,M 6.7
Surface trace of MTL
a
b
Fig. 10. The same as Fig. 7 but along the profile F–F0 shown in Fig. 6.
0
10
20
30
40
0
10
20
30
40
)mk(
htpeD
33 34 35
Latitude
5 4 3 2 1-6 -3 0 3 6 (%)
oN
MohoP
P + PmPoNoN
1970/09/29, M 4.9
Surface trace of MTLD D’
Conrad
Moho
Conrad
a
b
Fig. 8. The same as Fig. 7 but along the profile D–D0 shown in Fig. 6. The red arrowon the top shows the surface trace of the MTL. (For interpretation of the referencesto colour in this figure legend, the reader is referred to the web version of thisarticle.)
S. Gupta et al. / Journal of Asian Earth Sciences 35 (2009) 377–390 383
positive and negative velocity perturbations (±3%) are assigned tothe alternate 3-D grid nodes in the modeling space, the image ofwhich is straightforward and easy to remember. Therefore, by justexamining the inverted images of the checkerboard, one can easilyunderstand where the resolution is good and where it is poor. Thetest results show that the checkerboard image is recovered downto 18 km depth when only the first P-wave data are used(Fig. 14a), because most of the earthquakes are located in the uppercrust and rays crisscross well from the surface down to about20 km depth (Fig. 4a). When both P and PmP data are used, dueto quite different trajectories of the PmP rays from those of the first
P rays, the ray coverage has improved significantly, especially inthe lower crust (Fig. 4b), and the checkerboard pattern is recoveredin the entire crust (Fig. 14b). Due to the lack of sufficient data in thewestern part of the MTL we could not get good resolution in thatarea for both tests (Fig. 14a and b).
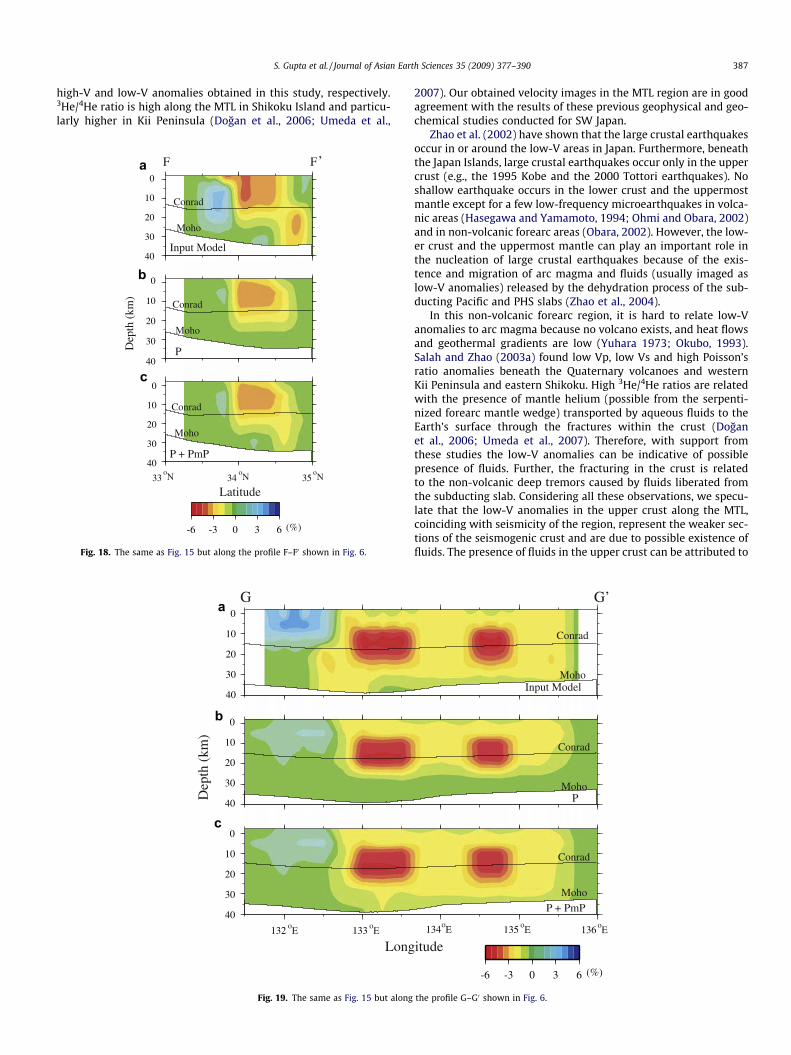
To assess the reliability of the main features appearing in theobtained tomographic images, we carried out another synthetictest, called restoring resolution test (Zhao et al., 1992a). In this test,to make input model for each individual cross-section (shown inFig. 6) we assigned velocity anomalies resembling with the ob-tained velocity images for corresponding cross-section (Figs. 7–13). The synthetic tests were done by using only P-wave data aswell as both P and PmP data. The inverted results of the restoringresolution test (Figs. 15c–21c) show that the velocity anomalies inthe MTL region are well recovered by using the combined data set(P and PmP). Through these synthetic tests, we believe that themain features of the obtained tomographic images (Figs. 5b, 7b–13b) are reliably resolved by our data set and the tomographicmethod. Since we could image the entire crust by using both Pand PmP data than by using only the first P-wave data, in the fol-lowing we discuss the results obtained with the combined data set(P and PmP).
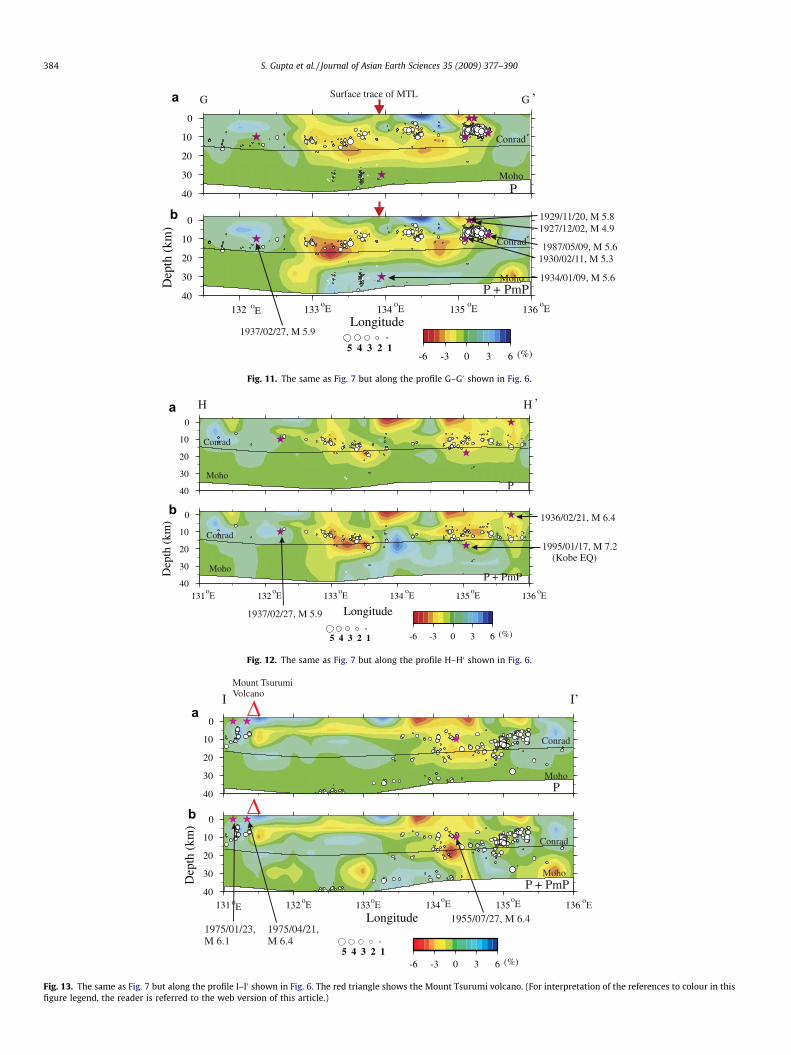
Our tomographic images show that the crustal structure in theMTL region is very heterogeneous. Significant low-V anomalies arevisible down to a depth of nearly 15 km under Shikoku and wes-tern Kii regions (Figs. 5b, 7b, 11b–13b), and they further deepento a depth of nearly 20 km under central and eastern Shikoku re-gions. The recent seismic reflection survey and receiver functionanalysis have also reported the similar trend of low-V anomalies(Kodaira et al., 2002; Yamauchi et al., 2003). The low-V anomaliesare surrounded by several high-velocity (high-V) anomalies (Figs.5b, 7b–13b). In the lower crust (deeper than 20 km), the MTLexhibits high-V, while a few low-V anomalies exist away fromthe MTL (Figs. 5b, 8b–10b, 13b)
Most of the shallow crustal earthquakes (e.g., the destructive1995 Kobe (M 7.2) and 1955 Tokusima (M 6.4) earthquakes), are lo-cated in or around the low-V anomalies. The occurrence of theKobe earthquake in a low-V anomaly is in accordance with the re-sult of Zhao et al. (1996).
0
10
20
30
40
0
10
20
30
40
)mk(
htpeD
132 133 134 135 136Longitude
1927/12/02, M 4.91929/11/20, M 5.8
1987/05/09, M 5.61930/02/11, M 5.3
1937/02/27, M 5.9
-6 -3 0 3 6 (%)
oEoE oE oEoE
Conrad
Moho
Moho
Conrad
P
P + PmP
5 4 3 2 1
Surface trace of MTL GG ’
1934/01/09, M 5.6
a
b
Fig. 11. The same as Fig. 7 but along the profile G–G0 shown in Fig. 6.
0
10
20
30
40
0
10
20
30
40
)mk(
htpeD
131 132 133 134 135 136
Longitude
5 4 3 2 1 -6 -3 0 3 6 (%)
Moho
Conrad
P
P + PmPMoho
Conrad
oE oE oEoE oE
oE
HH ’
1936/02/21, M 6.4
1937/02/27, M 5.9
1995/01/17, M 7.2(Kobe EQ)
b
a
Fig. 12. The same as Fig. 7 but along the profile H–H0 shown in Fig. 6.
0
10
20
30
40
0
10
20
30
40
)mk(
htpeD
131 132 133 134 135 136Longitude
5 4 3 2 1-6 -3 0 3 6 (%)
oE
Moho
Conrad
P
P + PmPoE oE
oE oE oE
Moho
Conrad
1955/07/27, M 6.41975/01/23,M 6.1
1975/04/21,M 6.4
II ’Mount TsurumiVolcano
a
b
Fig. 13. The same as Fig. 7 but along the profile I–I0 shown in Fig. 6. The red triangle shows the Mount Tsurumi volcano. (For interpretation of the references to colour in thisfigure legend, the reader is referred to the web version of this article.)
384 S. Gupta et al. / Journal of Asian Earth Sciences 35 (2009) 377–390
131˚ 132˚ 133˚ 134˚ 135˚ 136˚
33˚
34˚
35˚5 km
131˚ 132˚ 133˚ 134˚ 135˚ 136˚
33˚
34˚
35˚10 km
33˚
34˚
35˚18 km
131˚ 132˚ 133˚ 134˚ 135˚ 136˚33˚
34˚
35˚28 km
131˚ 132˚ 133˚ 134˚ 135˚ 136˚33˚
34˚
35˚40 km
-3.0-1.501.53.0
Longitude
(%)
Lat
itude
(b) With P + PmP data
131˚ 132˚ 133˚ 134˚ 135˚ 136˚
33˚
34˚
35˚5 km
131˚ 132˚ 133˚ 134˚ 135˚ 136˚
33˚
34˚
35˚10 km
131˚ 132˚ 133˚ 134˚ 135˚ 136˚33˚
34˚
35˚18 km
131˚ 132˚ 133˚ 134˚ 135˚ 136˚33˚
34˚
35˚28 km
(a) With P-wave data
Fig. 14. Results of the checkerboard resolution test (CRT) by using the first P-wave data (a), both P and PmP data (b). The layer depth is shown on the upper-left corner of eachmap. Open and solid circles represent fast and slow velocity perturbations, respectively. The scale for the velocity perturbation (in %) is shown in the right bottom.
S. Gupta et al. / Journal of Asian Earth Sciences 35 (2009) 377–390 385
4. Discussion
In the following we discuss velocity images obtained from thisstudy in cohesion with results of other geophysical and geochem-ical studies carried out in this non-volcanic forearc region of SWJapan.
The cutoff depth of crustal seismicity in the study area is around18 km (Ito, 1999). Mizoue et al. (1983) observed long, continuing
seismic swarm activities in and around Kii Peninsula. Salah andZhao (2003b) studied the 3-D P-wave attenuation (Q) structureof the crust and uppermost mantle beneath SW Japan and identi-fied the zones of low- to average- Q in the upper crust (0–20 kmdepth range) beneath western Kii Peninsula and eastern Shikoku.Low-V anomalies in the epicenter area of the 1995 Kobe earth-quake, eastern Shikoku, western Kii Peninsula and surroundingareas have also been reported by other tomographic studies (Zhao
oE
Moho
Conrad
P
P + PmP
)mk(
htpeD
Longitude-6 -3 0 3 6 (%)
Moho
Conrad
Moho
Conrad
Input Model
A B C
oE oEoE oE
a
b
c
Fig. 15. Results of the restoring resolution test (see text for details) along the MTL (A–B–C line shown in Fig. 6). (a) Input model. Inverted result of the synthetic testsconducted by using the first P-wave data (b), both P and PmP data (c). Red and blue colors denote slow and fast velocities, respectively. The velocity perturbation (in %) scale isshown at the bottom. Vertical exaggeration is 3. (For interpretation of the references to colour in this figure legend, the reader is referred to the web version of this article.)
-6 -3 0 3 6 (%)
Latitude
)mk(
htpeD
Moho
Conrad
Moho
Conrad
Moho
Conrad
P
P + PmP
Input Model
DD ’a
b
c
33 34 35oN
oNoN
0
10
20
30
40
0
10
20
30
40
0
10
20
30
40
Fig. 16. The same as Fig. 15 but along the profile D–D0 shown in Fig. 6.
Latitude
)mk(
htpeD
-6 -3 0 3 6 (%)
Moho
Conrad
Moho
Conrad
Moho
Conrad
Input Model
P
P + PmP
E E’a
b
c0
10
20
30
40
0
10
20
30
40
0
10
20
30
40
33 34 35oN oNoN
Fig. 17. The same as Fig. 15 but along the profile E–E0 shown in Fig. 6.
386 S. Gupta et al. / Journal of Asian Earth Sciences 35 (2009) 377–390
et al., 1996, 2000; Zhao and Mizuno, 1999; Salah et al., 2005; Ikedaet al., 2006).
The magnetotelluric (MT) study in Kii Peninsula (Fuji-ta et al.,1997) have reported two anomalies in the upper crust: a subhori-
zontal conductive layer and a resistive block in the western and thesoutheastern parts of Kii Peninsula, respectively. A conductivelayer has also been revealed in the deep crust. The locations ofthese resistive and conductive bodies agree with the average
S. Gupta et al. / Journal of Asian Earth Sciences 35 (2009) 377–390 387
high-V and low-V anomalies obtained in this study, respectively.3He/4He ratio is high along the MTL in Shikoku Island and particu-larly higher in Kii Peninsula (Dogan et al., 2006; Umeda et al.,
-6 -3 0 3 6 (%)
P
P + PmP
Latitude
Input Model
Moho
Conrad
Moho
Conrad
Moho
Conrad
F F’
)mk(
htpeD
a
b
c0
10
20
30
40
0
10
20
30
40
0
10
20
30
40
33 34 35oN oNoN
Fig. 18. The same as Fig. 15 but along the profile F–F0 shown in Fig. 6.
)mk(
htpeD
G
Long
0
10
20
30
40
0
10
20
30
40
0
10
20
30
40
132 133oE oE
a
b
c
Fig. 19. The same as Fig. 15 but along
2007). Our obtained velocity images in the MTL region are in goodagreement with the results of these previous geophysical and geo-chemical studies conducted for SW Japan.
Zhao et al. (2002) have shown that the large crustal earthquakesoccur in or around the low-V areas in Japan. Furthermore, beneaththe Japan Islands, large crustal earthquakes occur only in the uppercrust (e.g., the 1995 Kobe and the 2000 Tottori earthquakes). Noshallow earthquake occurs in the lower crust and the uppermostmantle except for a few low-frequency microearthquakes in volca-nic areas (Hasegawa and Yamamoto, 1994; Ohmi and Obara, 2002)and in non-volcanic forearc areas (Obara, 2002). However, the low-er crust and the uppermost mantle can play an important role inthe nucleation of large crustal earthquakes because of the exis-tence and migration of arc magma and fluids (usually imaged aslow-V anomalies) released by the dehydration process of the sub-ducting Pacific and PHS slabs (Zhao et al., 2004).
In this non-volcanic forearc region, it is hard to relate low-Vanomalies to arc magma because no volcano exists, and heat flowsand geothermal gradients are low (Yuhara 1973; Okubo, 1993).Salah and Zhao (2003a) found low Vp, low Vs and high Poisson’sratio anomalies beneath the Quaternary volcanoes and westernKii Peninsula and eastern Shikoku. High 3He/4He ratios are relatedwith the presence of mantle helium (possible from the serpenti-nized forearc mantle wedge) transported by aqueous fluids to theEarth’s surface through the fractures within the crust (Doganet al., 2006; Umeda et al., 2007). Therefore, with support fromthese studies the low-V anomalies can be indicative of possiblepresence of fluids. Further, the fracturing in the crust is relatedto the non-volcanic deep tremors caused by fluids liberated fromthe subducting slab. Considering all these observations, we specu-late that the low-V anomalies in the upper crust along the MTL,coinciding with seismicity of the region, represent the weaker sec-tions of the seismogenic crust and are due to possible existence offluids. The presence of fluids in the upper crust can be attributed to
G’
P
P + PmP
Input Model
-6 -3 0 3 6 (%)
itude
Moho
Conrad
Moho
Conrad
Moho
Conrad
134 135 136oE oE oE
the profile G–G0 shown in Fig. 6.
-6 -3 0 3 6 (%)
Moho
Conrad
P
P + PmP
)mk(
htpeD
Longitude
Input Model
II ’
Moho
Conrad
Moho
Conrad
a
b
c
132 133 134 135 136oE131 oE oEoE oE oE
0
10
20
30
40
0
10
20
30
40
0
10
20
30
40
Fig. 21. The same as Fig. 15 but along the profile I–I0 shown in Fig. 6.
-6 -3 0 3 6 (%)
Moho
Conrad
P
P + PmP
Longitude
Input Model
HH ’
)mk(
htpeD
Moho
Conrad
Moho
Conrad
0
10
20
30
40
0
10
20
30
40
0
10
20
30
40
132 133 134 135 136oE131 oE oEoE oE oE
Fig. 20. The same as Fig. 15 but along the profile H–H0 shown in Fig. 6.
388 S. Gupta et al. / Journal of Asian Earth Sciences 35 (2009) 377–390
shallow origins (such as meteoric water, pore fluids and mineraldehydration) and/or to migration of dehydrated fluids of the sub-ducting PHS slab through fracture zones within the crust, whichare imaged as low-V anomalies approaching the lower crust (Figs.8b–10b, 13b).
The earthquake cycle of the MTL fault system in Shikoku is1000–3000 years, and the elapsed time since the most recent his-
torical earthquake in the MTL is about 500 years (Tsutsumi andOkada, 1996). In the case of the 1994 Northridge earthquake (M6.7) in southern California, stress recovery was apparently com-pleted within 2 years after the main shock, as revealed by stress-tensor inversions (Zhao et al., 1997). Similarly, rapid fault healingof the 1995 Kobe earthquake has also been observed by repeatedS-wave splitting analyses of the Nojima fault zone (Tadokoro and
S. Gupta et al. / Journal of Asian Earth Sciences 35 (2009) 377–390 389
Ando, 2002). Thus, the healing time of an active fault system can bevery short. Therefore, fault healing of the MTL fault system hasprobably been completed. In addition, the presence of fluidsaround and below the seismogenic zone can influence the activityof the fault system. As the fluids enter the active faults in the crust(such as the MTL), fault zone friction decrease, and thus fault rup-ture can be triggered to generate large crustal earthquakes.
5. Conclusions
We determined a detailed 3-D P-wave velocity structure of thecrust beneath the MTL fault system in Shikoku and western KiiPeninsula of SW Japan by using high-quality first P-wave andMoho-reflected P-wave (PmP) arrivals from 300 crustal earth-quakes recorded by 101 seismic stations. Our results show thatthe addition of PmP data can significantly improve the resolutionof the lower crust tomography and the entire crust can be betterimaged than by using only the first P-wave data. Results of exten-sive resolution tests show that major velocity anomalies revealedare reliable. Prominent low-V anomalies are visible in the uppercrust along the MTL, and the low-V anomalies are surrounded byseveral high-V anomalies. In the lower crust, the MTL exhibits highvelocity, while a few low-V anomalies exist away from the MTL.Many large crustal earthquakes are located in or around theselow-V anomalies. These low-V anomalies can represent the weakersections of the seismogenic crust and can be imprint of the aque-ous fluids released by the dehydration process of the subductingPHS slab under SW Japan. These seismic images together withother geological, geochemical and geophysical studies can improveour understanding of seismotectonics and can provide useful infor-mation for seismic hazard mitigation in SW Japan.
Acknowledgements
We thank the Hi-net Data Center for providing the waveformdata used in this study. S. Gupta thanks the NGRI director for hisencouragement and support and the Department of Science andTechnology, Government of India for the BOYSCAST fellowship tostudy at Tohoku University, Japan. We thank Dr. Y. Ohta for hishelp at the data processing stage. This work was partially sup-ported by a grant (Kiban-A 17204037) from Japan Society for thePromotion of Science to D. Zhao. Figures were made by using theGMT (Generic Mapping Tools) software by Wessel and Smith(1998). Two anonymous reviewers provided thoughtful reviewcomments which improved the manuscript.
References
Dogan, T., Sumino, H., Nagao, K., Notsu, K., 2006. Release of mantle helium fromforearc region of the Southwest Japan arc. Chemical Geology 233, 235–248.
Fuji-ta, K., Ogawa, Y., Yamaguchi, S., Yaskawa, K., 1997. Magnetotelluric imaging ofthe SW Japan forearc – a lost paleoland revealed? Physics of the Earth andPlanetary Interiors 102, 231–238.
Goto, H., Nakata, T., Tsutsumi, H., Okamura, K., Imaizumi, T., Nakamura, T.,Watanabe, T., 2001. The latest surface-faulting events on the Median TectonicLine in Shikoku, Southwest Japan based, on mini-trenching and geoslicerstudies. Zisin2 (Journal of Seismological Society of Japan) 53, 205–219 (inJapanese with English abstract).
Hasegawa, A., Yamamoto, A., 1994. Deep, low-frequency microearthquakes in oraround seismic low-velocity zones beneath active volcanoes in northeasternJapan. Tectonophysics 233, 233–252.
Hickman, S., Sibson, R., Bruhn, R., 1995. Introduction to special section: mechanicalinvolvement of fluids in faulting. Journal of Geophysical Research 100, 12831–12840.
Ikeda, M., Zhao, D., Ohno, Y., 2006. Crustal structure, fault segmentation, andactivity of the Median Tectonic Line in Shikoku, Japan. Tectonophysics 412, 49–60.
Ito, K., 1999. Seismogenic layer, reflective lower crust, surface heat flow and largeinland earthquakes. Tectonophysics 306, 423–433.
Kodaira, S., Kurashimo, E., Park, J.-O., Takahashi, N., Nakanishi, A., Miura, S., Iwasaki,T., Hirata, N., Ito, K., Kaneda, Y., 2002. Structural factors controlling the rupture
process of a megathrust earthquake at the Nankai trough seismogenic zone.Geophysical Journal International 149, 815–835.
Lees, J.M., Nicholson, E., 1993. Three-dimensional tomography of the 1992 southernCalifornia earthquake sequence: constraints on dynamic earthquake rupture.Geology 21, 387–390.
Lei, J., Xie, C., Lan, C., Ma, S., 2008. Seismic images under the Beijing region using Pand PmP data. Physics of the Earth and Planetary Interiors 168, 134–146.
Maruyama, S., Santosh, M., 2007. Island arcs: past and present. Gondwana Research11, 3–6.
Mizoue, M., Nakamura, M., Seto, N., Ishiketa, Y., Yokota, T., 1983. Three-layereddistribution of microearthquakes in relation to focal mechanism variation in theKii Peninsula, Southwestern Honshu, Japan. Bulletin of the Earthquake ResearchInstitute, University of Tokyo 58, 287–310.
Nakajima, J., Matsuzawa, T., Hasegawa, A., 2002. Moho depth variation in the centralpart of northeastern Japan estimated from reflected and converted waves.Physics of the Earth and Planetary Interiors 130, 31–47.
Obara, K., 2002. Nonvolcanic deep tremor associated with subduction in SouthwestJapan. Science 296, 1679–1681.
Ohmi, S., Obara, K., 2002. Deep low-frequency earthquakes beneath the focal regionof the Mw 6.7 2000 Western Tottori earthquake. Geophysical Research Letters29 (16). doi:10.1029/2001GL014469.
Okubo, Y., 1993. Temperature gradient map of the Japanese Islands. Journal of theGeothermal Research Society of Japan 15, 1–21.
Paige, C., Saunders, M., 1982. LSQR: an algorithm for sparse linear equations andsparse least squares. ACM Transactions on Mathematical Software 8, 43–71.
Salah, M.K., Zhao, D., 2003a. 3-D seismic structure of Kii Peninsula in SouthwestJapan: evidence for slab dehydration in the forearc. Tectonophysics 364, 191–213.
Salah, M.K., Zhao, D., 2003b. Three-dimensional attenuation structure beneathSouthwest Japan estimated from spectra of microearthquakes. Physics of theEarth and Planetary Interiors 136, 215–231.
Salah, M.K., Zhao, D., Lei, J., Abdelwahed, M.F., 2005. Crustal heterogeneity beneathSouthwest Japan estimated from direct and Moho-reflected waves.Tectonophysics 395, 1–17.
Seno, T., Stein, S., Gripp, A., 1993. A model for the motion of the Philippine Sea plateconsistent with NUVEL-1 and geological data. Journal of Geophysical Research98, 17941–17948.
Shiomi, K., Obara, K., Sato, H., 2006. Moho depth variation beneath SouthwesternJapan revealed from the velocity structure based on receiver function inversion.Tectonophysics 420, 205–221.
Shiono, K., 1980. Seismological study on the Median Tectonic Line of SouthwestJapan. In Median Tectonic Line of Southwest Japan. Geological Society of JapanMemoir 18, 155–174.
Sibson, R.H., 1992. Implications of fault-value behavior for rupture nucleation andrecurrence. Tectonophysics 11, 283–293.
Sun, A., Zhao, D., Ikeda, M., 2008. Seismic imaging of Southwest Japan using P andPmP data: Implications for arc magmatism and seismotectonics. GondwanaResearch 13, 535–542.
Tadokoro, K., Ando, M., 2002. Evidence for rapid fault healing derived from temporalchanges in S wave splitting. Geophysical Research Letters 29 (4), 1047.doi:10.1029/2001GL013644.
Tsutsumi, H., Okada, A., 1996. Segmentation and Holocene surface faulting on theMedian Tectonic Line, Southwest Japan. Journal of Geophysical Research 101,5855–5871.
Tsutsumi, H., Okada, A., Nakata, T., Ando, M., 1991. Timing and displacement ofHolocene faulting on the Median Tectonic Line in central Shikoku, SouthwestJapan. Journal of Structural Geology 13, 227–233.
Umeda, K., McCrank, G.F., Ninomiya, A., 2007. Helium isotopes as geochemicalindicators of a serpentinized fore-arc mantle wedge. Journal of GeophysicalResearch 112, B10206. doi:10.1029/2007JB005031.
Usami, T., 1996. Materials for Comprehensive List of Destructive Earthquakes inJapan. University of Tokyo Press. 493p, (in Japanese).
Wang, Z., Zhao, D., Mishra, O.P., Yamada, A., 2006. Structural heterogeneity and itsimplications for the low-frequency tremors in Southwest Japan. Earth andPlanetary Science Letters 251, 66–78.
Wessel, P., Smith, W.H.F., 1998. New improved version of the Generic MappingTools released. EOS, Transactions, American Geophysical Union 79, 579.
Xia, S., Zhao, D., Qiu, X., Nakajima, J., Matsuzawa, T., Hasegawa, A., 2007. Mappingthe crustal structure under active volcanoes in central Tohoku, Japan using Pand PmP data. Geophysical Research Letters 34, L10309. doi:10.1029/2007GL030026.
Yamauchi, M., Hirahara, K., Shibutani, T., 2003. High resolution receiver functionimaging of the seismic velocity discontinuities in the crust and the uppermostmantle beneath Southwest Japan. Earth Planets and Space 55, 59–64.
Yoshii, T., Sasaki, Y., Tada, T., Okada, H., Asano, S., Muramatsu, I., Moriya, T., 1974.The third Kurayoshi explosion and the crustal structure in the western part ofJapan. Journal of Physics of the Earth 22, 109–121.
Yuhara, K., 1973. Effect of the hydrothermal systems of the terrestrial heat flow.Bulletin of the Volcanological Society of Japan 18, 129–142.
Zhao, D., Mizuno, T., 1999. Crack density and saturation rate in the 1995 Kobeearthquake region. Geophysical Research Letters 26, 3213–3216.
Zhao, D., Hasegawa, A., Horiuchi, S., 1992a. Tomographic imaging of P and S wavevelocity structure beneath northeastern Japan. Journal of Geophysical Research97, 19909–19928.
Zhao, D., Horiuchi, S., Hasegawa, A., 1992b. Seismic velocity structure of the crustbeneath the Japan Islands. Tectonophysics 212, 289–301.
390 S. Gupta et al. / Journal of Asian Earth Sciences 35 (2009) 377–390
Zhao, D., Kanamori, H., Negishi, H., 1996. Tomography of the source area of the 1995Kobe earthquake: evidence for fluids at the hypocenter? Science 274, 1891–1894.
Zhao, D., Kanamori, H., Wiens, D., 1997. State of stress before and after the 1994Northridge earthquake. Geophysical Research Letters 24, 519–522.
Zhao, D., Ochi, F., Hasegawa, A., Yamamoto, Y., 2000. Evidence for the location andcause of large crustal earthquakes in Japan. Journal of Geophysical Research105, 13579–13594.
Zhao, D., Mishra, O.P., Sanda, R., 2002. Influence of fluids and magma onearthquakes: seismological evidence. Physics of the Earth and PlanetaryInteriors 132, 249–267.
Zhao, D., Tani, H., Mishra, O.P., 2004. Crustal heterogeneity in the 2000 westernTottori earthquake region: effect of fluids from slab dehydration. Physics of theEarth and Planetary Interiors 145, 161–177.
Zhao, D., Todo, S., Lei, J., 2005. Local earthquake reflection tomography of theLanders aftershock area. Earth and Planetary Science Letters 235, 623–631.