or passively cooled telescopes such as the Europeanpace Agency’s �ESA’s� Herschel 3.5-m silicon car-ide �SiC� telescope1,2 to be launched in 2007 aboardn Ariane 5 rocket to orbit the Earth–Sun secondagrangian point, L2, the signal from the thermalelf-emission of the Cassegrain telescope’s reflectingurfaces is expected to be the dominant source ofoise for two of the three observatory instruments.hermal models of the telescope–spacecraft systemredict an equilibrium operating telescope tempera-ure in the range 70–90 K. Both the Photodetectorrray Camera & Spectrometer3 �PACS� and the Spec-
J. Fischer �[email protected]� and O. Sternberg areith the Remote Sensing Division, Naval Research Laboratory,ode 7213, Washington, D.C. 20375. T. O. Klaassen and J. N.ovenier are with the Faculty of Applied Sciences, Delft Univer-
ity of Technology, P.O. Box 5046, 2600 GA Delft, The Nether-ands. G. Jakob and A. Poglitsch are with the Max-Planck-nstitut fur Extraterrestrische Physik, Postfach 1603, D-85740,arching, Germany.Received 1 December 2003; revised manuscript received 12 April
ral and Photometric Imaging Receiver4 �SPIRE�,hich together provide both imaging and moderate
esolution ����� 100–2000� spectroscopy over the 55–70-�m spectral range, are expected to be back-round limited by the thermal self-emission of theelescope’s reflecting mirrors. To estimate the sen-itivity of these instruments in orbit and the back-round flux on their detectors and to determine tohat extent further reduction of stray light originat-
ng from thermal emission from payload objects isecessary, we have carried out a set of measurementsesigned to estimate the expected emissivity of theirror surfaces in orbit in the far-infrared–
ubmillimeter spectral range.
. Experiment Concept
ccording to Kirchhoff ’s law,5 for equilibrium condi-ions the fraction of blackbody radiation emitted byhe surface of an object at a given temperature andavelength, i.e., its emissivity ε, is equal to the frac-
ion that it absorbs at the same temperature andavelength, i.e., its absorptivity �. This applies to
otal, spectral, directional, and polarization quanti-ies. Thus one can indirectly measure the emissiv-ty of a surface by calorimetrically measuring theraction of radiation that the surface absorbs at a
iven wavelength. To do this we developed an ex-erimental procedure in which Herschel Telescopeirror samples are weakly coupled to a thermal bath
nd then illuminated by far-infrared �FIR� radiationf known wavelength and power P0 until a stableample temperature is reached. The resultantmall temperature increase �T is recorded through aemperature sensor, which is glued to the back side ofhe sample. Subsequently the FIR radiation islocked and the sample is electrically heated by aesistor, which is also glued to the back side of theample. The heating current is then adjusted untilhe sample reaches equilibrium at the same temper-ture that was recorded during laser illumination,hereby heating the sample with power PH � IHVH,here IH and VH are the heater’s current and voltage,
espectively. As the conductivity of SiC is high, theeat is quickly distributed across the sample, andhus the electrical and radiative heat input requiredo reach the same reading of the temperature sensorre equal; i.e., the electrical heating power PH isqual to the absorbed FIR power, Pabs. Finally, ifhe incoming power P0 can be experimentally deter-ined, the absorptivity � and thus the emissivity ε atgiven laser wavelength can be ascertained:
ε � � � Pabs�P0 � PH�P0. (1)
For opaque coatings the reflectivity R is 1 � �, soormally one can measure � by measuring R,6 whichs often an easier quantity to measure. However, foroatings with high reflectivity and small absorptivity,ay, R 0.99 and � 0.01, the required accuracy inhe determination of R, of the order of 0.1%, is pro-ibitively difficult to achieve. Alternatively, one caneasure the emissivity of a sample by comparing the
hermal emission with that of a reference surface.7o avoid the need for special filters at each wave-
ength, and because of the lack of a suitable referenceurface, we instead chose absorption calorimetry.
. Experimental Configuration and Calibration
. Sample Preparation
o represent the Herschel Space Observatory tele-cope most accurately, SiC sample substrates wererepared by Boostec Industries �France� and polishedith the same surface roughness as the Herschelelescope �30 nm rms� by Opteon, Ltd. �Finland� for
he European Aeronautic Defense and SpaceEADS�–Astrium Company �France�. The samplesere cut and ground to dimensions of 14 mm � 14m � 0.5 mm to minimize their heat capacity while
nsuring that the beam could be focused onto theample even at the longest measurement wave-ength. The samples were coated with aluminumnd a thin protective layer of Plasil, a form of SiO2eveloped by Leybold Optics �Germany� during theualification Herschel mirror coating run at Calarlto Astronomical Observatory in Spain. Because
he samples were placed at different positions in theoating chamber, different coating thicknesses dere deposited for each sample. For sample 1,
�aluminum� � 400 nm and d�Plasil� � 25 nm, andor sample 2, d�aluminum� � 300 nm and d�Plasil� �nm. Measurements were made of the two samplesith the largest thickness differences.A third set of measurements of sample 2 was made
fter the sample had been contaminated with dust atlevel of 5000 � 50 areal parts in 106 �ppm�.8 Be-
ore their contamination the clean samples were in-pected with bright illumination, and microscopeleanliness and particle counting tests were per-ormed; the samples were found to be free of grossefects and had minimal contamination, with no par-icles larger than 5 �m. Dust for the contaminationas collected from a class 100,000 clean room at theuropean Space Research and Technology Centre
ESTEC� test center. This type of dust was choseno be representative of what might fall upon the Her-chel Telescope prior to and during launch, althoughhe exact chemical composition and size distributionf clean room dust may be variable. A clean paint-rush was used to deposit the dust onto the sample tolevel of 15,000 ppm. Subsequently the level was
djusted to 5000 ppm with a soft helium-gas flow.he particle count was rechecked after the sampleas vertically positioned in a vacuum chamber at0�4-Pa pressure and again after completion of thebsorptivity measurements in the cryostat. Afterhe cold measurements the average particle counteasured on four plates in scattered light by a
article-fallout meter was found to be 5000 � 50 ppm.article count and size measurements were also car-ied out at six positions with a total area of 60 mm2,efore and after the absorptivity measurements.he results were found to be roughly similar at theix positions and before and after the measurements.he particle size and areal distribution from theseeasurements are listed in Table 1. The counts are
verages of values obtained before and after the ab-orptivity measurements.
. Sample Housing and Sample Thermal Connection tohe 77-K Bath
amples prepared during the Herschel Telescopeoating qualification run were mounted in a sampleousing that was mounted on the cold plate of aewar filled with liquid nitrogen at 77 K. Figure 1
s a photograph of the sample carrier in the sample
Table 1. Number and Size Distribution of Dust Particlesa
ousing. The sample carrier and the inner surfacesf the box were coated with black paint, and the wiresnd electrical connections to the sample were baffledy aluminum tape �not shown in Fig. 1�. The sam-les were held by four steel wires of 200-�m diameternd length of 23 mm, which were attached withcrews to the rectangular carrier. The carrier wascrewed to the box, and the sample box was directlycrewed to the 77-K cold plate of the cryostat. Thehoice of the exact value of the thermal coupling ofhe sample to the 77-K bath, G, was a trade-off be-ween the desire to reach a large temperature in-rease and a small thermal time constant. Thehermal time constant � is C�G, where C is the heatapacity of the sample, and the temperature increaseT � Pabs�G. The electrical connection of the heater
two wires� and the temperature sensor �four wires�as accomplished with six constantan wires of 75-�miameter and 40-mm length. These parametersere chosen to yield a thermal time constant of min-tes and to be such that the contribution of the con-tantan wires to the thermal coupling would be smallompared with that of the four steel wires. Experi-entally we found that thermal time constant � was
ig. 1. Photograph of a sample and a sample carrier mounted inhe sample housing.
ig. 2. Schematic drawing of the optical configuration used for thor power calibration and beam profile verification, respectively, a
f the order of 10 min, during which time the laseras stable and the temperature increase �T was
arge enough ��0.1 K� to be measured easily.
. Optical Configuration
he measurements were performed at the Delft Uni-ersity of Technology in The Netherlands, which pro-ided an Edinburgh Instruments Ltd. Model 295O2-pumped FIR laser. To cover most of the spec-
ral range of the Herschel Space Observatory suite ofnstruments we chose four strong lines for the mea-urements: the 70- and 118-�m lines of CH3OHmethanol�, a 184-�m line of CH2F2, and a 496-�mine of CH3F. Figure 2 is a schematic drawing ofhe optical setup of the FIR laser absorption mea-urements, and Figs. 3 and 4 are photographs of theptical setup and the cryostat cold plate. A 12-�m-hick Mylar beam splitter reflected a small fraction ofhe laser power to a pyroelectric monitor to recordny change of the incoming laser power. A polyeth-lene lens focused the laser beam through the poly-thylene cryostat window onto the sample, which wasilted at an angle of 14° with respect to the laseream. This configuration directed the reflectedeam onto an absorptive screen located in front of theryostat window. This screen, which comprised anluminum substrate coated with an absorptive mix-ure9 of 1-mm silicon carbide grains and black Stycast850 FT �a low-temperature, two-component resinanufactured by Emerson and Cuming, 46 Manningoad, Billerica, Massachusetts�, absorbed 95% of the
adiation reflected from the sample. To absorb anyadiation spilling over the edge of the sample, andentical absorbing screen was mounted onto the rearall of the sample housing. A flip mirror in front of
he cryostat was used to send light periodically to aecond pyroelectric detector located at the same dis-ance from the lens as the sample to monitor theosition and the beam profile of the focused beam athe sample. Horizontal and vertical 1�e2 beam di-meters measured with the monitor were 5.7–7.0 mmt wavelengths of 70, 118, and 184 �m and 12–14 mmt 496 �m. Before and after the FIR irradiation ofhe sample, a slide-in mirror, also in front of theryostat window, was used to direct the light to acientech 372-380101 powermeter–calorimeter to
asurements. Sliding and flip mirrors are inserted into the beamwn.
easure the laser power incident onto the window ofhe cryostat. �The determination of the absolute cal-bration of this powermeter at the laser line wave-engths is described in Subsection 3.E below.�
. Electrical Configuration
he temperature increase in the sample that resultedrom either FIR illumination or electrical heatingith a thin-film metal resistor �RH � 470 �, withegligible temperature dependence� was measuredith a Pt-1000 temperature sensor at the back side of
he sample. A Pt-1000 temperature sensor was alsoounted on the sample housing, which was in good
hermal contact with the cryostat cold plate. An acheatstone bridge circuit was used to measure the
emperature of the sample. In this circuit the ratiof a pair of 10-k� resistors at ambient temperature,ne fixed and one adjustable, was balanced with theatio of the two Pt-1000 cold resistances, each approx-mately equal to 200 � at liquid-nitrogen tempera-
ig. 4. Photograph of the open cryostat cold plate and sampleousing. The laser beam enters through the cryostat windowleft�, passes through the aperture in the absorbing screen, and iseflected by the tilted sample back onto the absorbing screen.
ure. The current across the bridge was measuredith a lock-in amplifier and set to zero, providing arecise method by which to match the electrical heat-ng power to that of the laser illumination. Becausehe temperature difference between the two Pt-1000ensors was measured with this circuit, slow varia-ions in the cold plate temperature, which were due,or instance, to changes in the ambient pressure, didot affect the results. With this method a rms noise
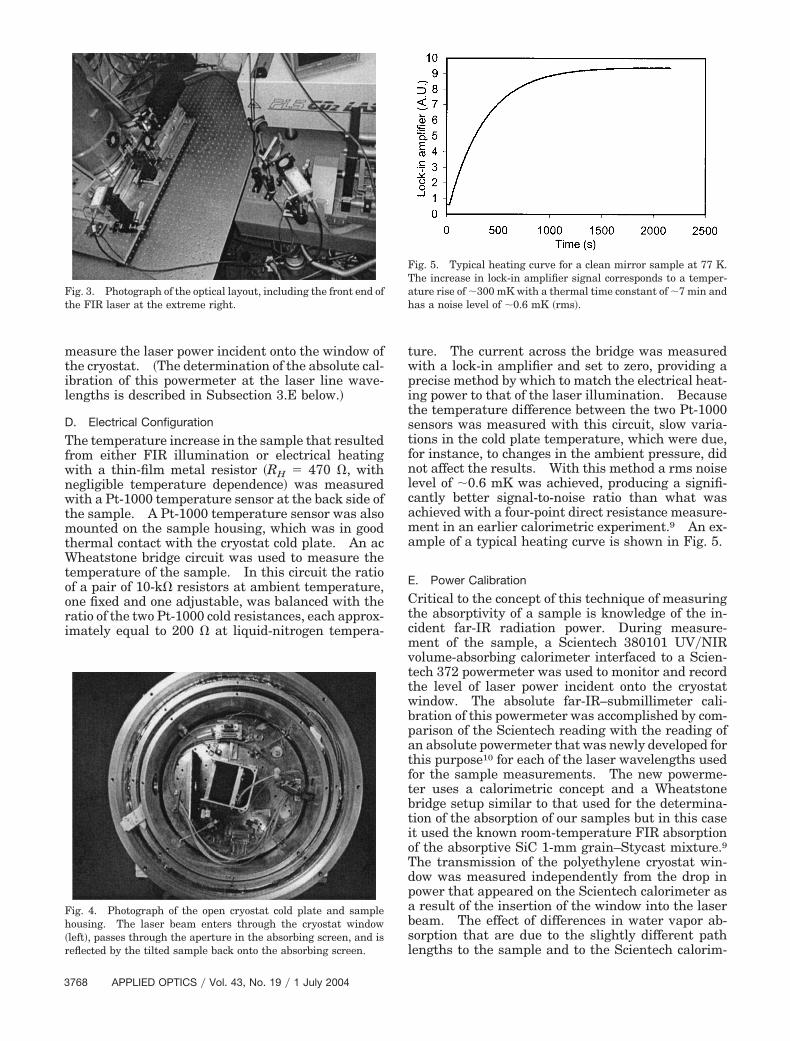
evel of 0.6 mK was achieved, producing a signifi-antly better signal-to-noise ratio than what waschieved with a four-point direct resistance measure-ent in an earlier calorimetric experiment.9 An ex-
mple of a typical heating curve is shown in Fig. 5.
. Power Calibration
ritical to the concept of this technique of measuringhe absorptivity of a sample is knowledge of the in-ident far-IR radiation power. During measure-ent of the sample, a Scientech 380101 UV�NIR
olume-absorbing calorimeter interfaced to a Scien-ech 372 powermeter was used to monitor and recordhe level of laser power incident onto the cryostatindow. The absolute far-IR–submillimeter cali-ration of this powermeter was accomplished by com-arison of the Scientech reading with the reading ofn absolute powermeter that was newly developed forhis purpose10 for each of the laser wavelengths usedor the sample measurements. The new powerme-er uses a calorimetric concept and a Wheatstoneridge setup similar to that used for the determina-ion of the absorption of our samples but in this caset used the known room-temperature FIR absorptionf the absorptive SiC 1-mm grain–Stycast mixture.9he transmission of the polyethylene cryostat win-ow was measured independently from the drop inower that appeared on the Scientech calorimeter asresult of the insertion of the window into the laser
eam. The effect of differences in water vapor ab-orption that are due to the slightly different pathengths to the sample and to the Scientech calorim-
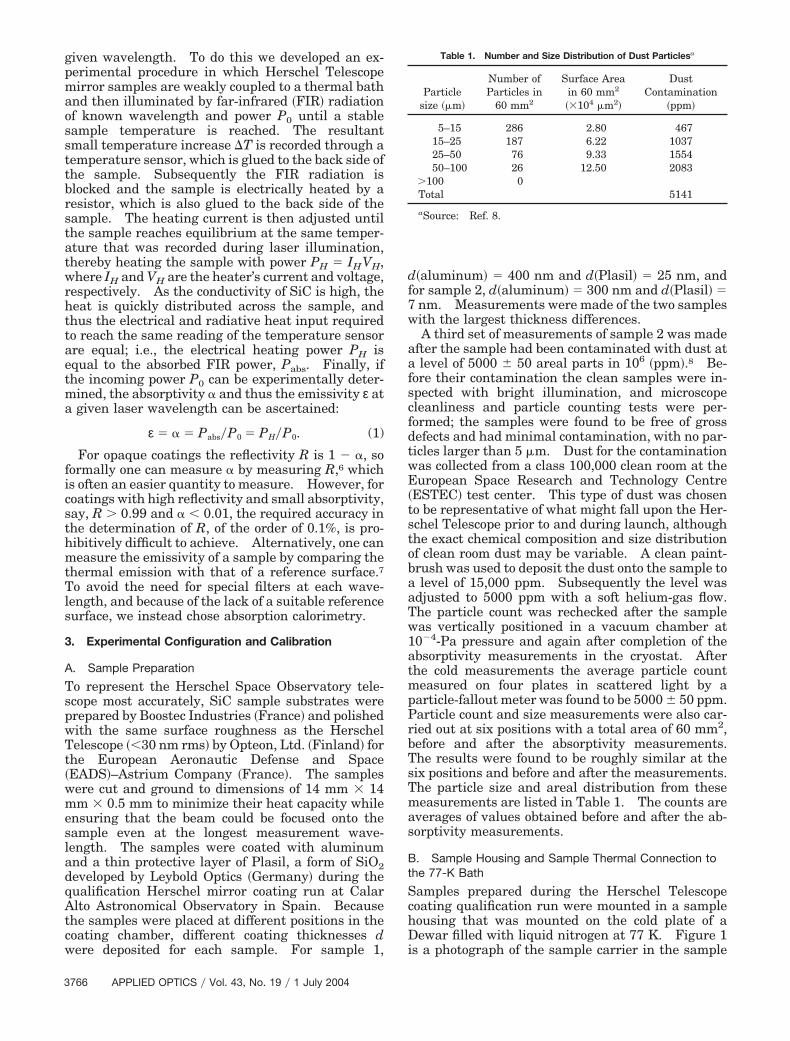
ig. 3. Photograph of the optical layout, including the front end ofhe FIR laser at the extreme right.
ig. 5. Typical heating curve for a clean mirror sample at 77 K.he increase in lock-in amplifier signal corresponds to a temper-ture rise of 300 mK with a thermal time constant of 7 min andas a noise level of 0.6 mK �rms�.
et
4
MsstcwmWfittoioispsoac
moattt�1tdspgc�t
cthepimt
latsSisldtwpw
5
Ttsttaii�dn
Fmtapttw
ter was measured and used to correct the calorime-er’s power readings.
. Measurements and Uncertainties
easurements of the heater power that produced theame temperature increase as the laser power ab-orbed by the mirror and of the power measured byhe Scientech powermeter were made with the beamentered on the sample. To ensure that this valueas representative, we made a number of measure-ents at beam positions around the sample center.e varied the position of the beam by moving the
ocusing lens in transverse directions and monitoredt by using the second pyroelectric detector. Nearhe edges of the sample, clear changes in the magni-ude of the heating were observed. Intentional spill-ver of the beam was found to lead to a strongncrease in sample heating, because some of the spill-ver radiation hit the curved edge of the sample hous-ng, which was not covered by the flat absorbingcreen behind the sample �see Fig. 4�. As the blackaint on the inside of the housing is not a good ab-orber at these wavelengths, a considerable fractionf that radiation was directly reflected onto the highlybsorbing back side of the sample, causing this in-reased heating.
The systematic uncertainties in the absorptivityeasurements are due to errors in the determination
f window transmission, absolute powermeter sensorbsorption coefficient, path-length difference correc-ions, electrical power absorbed, and signal ratio ofhe absolute powermeter to the Scientech powerme-er. We estimate these errors to be �5%, �5%,5%, �5%, and �10%, respectively, at 70, 118, and84 �m. Error propagation leads to total uncertain-ies of �14%. At 496 �m, the larger size of the beamiameter is thought to lead to a small amount ofpillage of the laser power over the edge of the sam-le, with subsequent scattering leading to nonnegli-ible absorption on the back side of the sample andonsequently to systematic errors of approximately25% and �50% in the determination of the absorp-
ivity.The absorptivity values and their calibration un-
ertainties are given in Table 2. They are based onhe weighted mean values of the ratio of the electricaleating power, PH, to the power reading on the Sci-ntech powermeter measured at a small number ofositions in the central region of the sample. Theres no statistically significant difference between the
easured values of the two clean samples, despiteheir different thicknesses of aluminum and Plasil
ayers. Inasmuch as the skin depth of aluminumt 77 K is more than an order of magnitude smallerhan the thickness of the aluminum layer on bothamples, no laser radiation is expected to reach theiC substrate for either sample. Thus the similar-
ty in the absorptivity of the two clean samplesuggests that the absorption in the Plasil layer isess than our measurement uncertainties, i.e.,0.10%. To check for a strong temperature depen-ence of the emissivity in this temperature range weook one measurement at each wavelength at 66 Khile the liquid-nitrogen bath was pumped for sam-les 1 and 2. No statistically significant differencesere observed.
. Model Fits to the Measurements
he averages of the absorptivity measurements of thewo clean samples are plotted in Fig. 6. The mea-ured absorptivity values are 0.1–0.2% higher thanhose expected for a pure aluminum mirror based onhe Hagen–Rubens formula11 and the dc resistivity ofluminum12 at 77 K �0.23 � 10�8 � m; dotted curven Fig. 6�. With resistivity taken as a free parametern the Hagen–Rubens formula, the best fit to the datawe used the 70-, 118-, and 184- but not the 496-�mata because of the larger uncertainty of the last-amed value� yielded a resistivity of 0.85 � 10�8 � m,
ig. 6. Measurements and estimated uncertainties for the cleanirror samples. Because there were no significant differences in
he measurements for the two clean samples, the average valuesre shown. The dotted curve is the absorptivity expected for aure aluminum mirror based on the Hagen–Rubens11 formula andhe resistivity12 of aluminum at 77 K. The dashed curve showshe best fit to the data, excluding the measurement at 496 �m,ith resistivity taken as a free parameter �see text�.
.7 times higher than the dc value �dashed curve inig. 6�. Discrepancies at this level are commonlybserved and are attributed to surface roughness andurface preparation issues and to the complex andrequency-dependent nature of a metal’s resistivity.6n particular, we investigated the importance of themall holes that were observed on the surfaces of theerschel mirrors �100 holes�mm2, radii, 2 �m� andere due to the preparation of the SiC substrate by
lectromagnetic field simulation software, and weound no significant effect caused by the presence ofhe holes. The fit fell within the estimated errorsxcept at 496 �m; we attribute this discrepancy to theifficulty of estimating systematic uncertainties.The measurements and uncertainties are plotted
n Fig. 7 for the dusty mirror sample. These values,ncluding the highest dust absorptivity value of 0.004t 70 �m, are consistent to within the measurementncertainties with the dust particle surface’s arealensity of 0.005, because peak absorption efficienciess high as 2 are found for spherical dust particles.13
he spectral dependence of the emissivity of dustarticles for wavelengths greater than the particleize is expected to be of the form ���, where 1 � � �.14 The best fit to the absorptivity of the clean sam-le measurements �dashed curves in Figs. 6 and 7�as added to an absorptivity proportional to ��� for� 1, 1.5, 2. The best fit to this part of the spectrum
or the dusty sample �solid curve in Fig. 7� obtainedith the proportionality constant as a free parameteras found for � � 1; specifically,
� � 0.0336��0.5 � 0.273��1. (2)
gain, the 496-�m measurement was not used tobtain the fit, but it is consistent with the fit.
he measurements reported here provide informa-ion that is important to the final design of the Her-chel Telescope’s structure, its surroundings, and itsaffle system. The emissivity values measured forll samples are significantly lower than the contrac-ually specified values for the telescope mirrors, i.e.,.5% per mirror. To ensure that the full benefit ofhe low emissivity and the cold telescope temperaturechieved by the design of the telescope and its sur-oundings are utilized, extreme care will need to beaken to reduce the levels of stray light reaching thenstrument focal plane array detectors from warm orffectively high-emissivity payload objects such ashe sunshade and the cryostat cover and surroundingavity. Inasmuch as the ideal conductance of theolometer arrays for achievement of the greatest ar-ay sensitivity depends on the level of the operatingackground radiation, and because the conductancean be modified during an etching step in a relativelyate stage of the array fabrication, the emissivity
easurement values presented here have additionalractical importance. These results will also pro-ide important input to observing time-estimationalculations that will determine the types of observ-ng programs that will be feasible with this poten-ially powerful new observatory. Similareasurements near the peak of the thermal emission
ange would help to improve the accuracy of predic-ions of the equilibrium temperature of the telescope.
We gratefully acknowledge suggestions made byerschel project scientist Goran Pilbratt and byierre Olivier �ESA�ESTEC�, helpful discussions onust absorption properties with Chris Dudley �U.S.aval Research Laboratory�, mirror samples sup-lied by Dominique Pierot �EADS–Astrium, France�,nd sample contamination and characterization bylivier Schmeitzky and Mark van Eesbeck �ESA–STEC�. We thank Thomas Passvogel and Daniele Chambure for making available partial funding ofhese measurements from the ESA Herschel–Planckroject office. J. Fischer and O. Sternberg �Nationalesearch Council Research Associate� acknowledgeupport from the U.S. Office of Naval Research andhe National Aeronautics and Space Administration’serschel Project Office at the Jet Propulsion Labora-
ory, California Institute of Technology.
eferences1. E. Sein, Y. Toulemont, F. Safa, M. Duran, P. Deny, D. de
Chambure, T. Passvogel, and G. Pilbratt, “A � 3.5 M SiCtelescope for Herschel mission,” in IR Space Telescopes andInstruments, J. Mather, ed., Proc. SPIE 4850, 606–618 �2003�.
2. G. Pilbratt, “Herschel Space Observatory mission overview,” inIR Space Telescopes and Instruments, J. Mather, ed., Proc.SPIE 4850, 586–597 �2003�.
3. A. Poglitsch, C. Waelkens, and N. Geis, “The PhotodetectorArray Camera & Spectrometer �PACS� for the Herschel SpaceObservatory,” in IR Space Telescopes and Instruments, J.Mather, ed., Proc. SPIE 4850, 662–673 �2003�.
4. M. Griffin, B. Swinyard, and L. Vigroux, “SPIRE—Herschel’ssubmillimetre camera and spectrometer,” in IR Space Tele-
ig. 7. Measurements and estimated uncertainties for the dustyirror sample. The dashed curve shows the best fit to the cleanirror sample �see Fig. 6�, and the solid curve shows the best fit to
he dusty mirror data �excluding the measurement at 496 �m�sing the sum of the clean mirror fit and a ��1 absorptivity de-endence for the dust �see text�.
1
1
1
1
1
scopes and Instruments, J. Mather, ed., Proc. SPIE 4850, 686–696 �2003�.
5. W. L. Wolfe, “Radiation theory,” in Sources of Radiation, G. J.Zissis, ed., Vol. 1 of The Infrared & Electro-Optical SystemsHandbook, J. S. Accetta and D. L. Shumaker, eds. �ERIM, AnnArbor, Mich., 1993�, pp. 1–48.
6. A. J. Gatesman, R. H. Giles, and J. Waldman, “High-precisionreflectometer for submillimeter wavelengths,” J. Opt. Soc. Am.B 12, 212–219 �1995�.
7. J. J. Bock, M. K. Parikh, M. L. Fischer, and A. E. Lange,“Emissivity measurements of reflective surfaces at near-millimeter wavelengths,” Appl. Opt. 34, 4812–4816 �1995�.
8. O. Schmeitzky, “Particle contamination simulation on SCI-sample-wafer Herschel–Planck project,” internal rep. TOS-QMC 2003�134 �European Space Research and TechnologyCenter, Noordwijk, The Netherlands, 2003�.
9. T. O. Klaassen, J. H. Blok, J. N. Hovenier, G. Jakob, D.Rosenthal, and K. J. Wildeman, “Scattering of sub-millimeter
radiation from rough surfaces: absorbers and diffuse reflec-tors for HIFI and PACS,” in IR Space Telescopes and Instru-ments, J. Mather, ed., Proc. SPIE 4850, 788–796 �2003�.
0. T. O. Klaassen, J. N. Hovenier, J. Fischer, G. Jakob, A. Po-glitsch, and O. Sternberg, “THz calorimetry: an absolutepower meter for terahertz radiation and the absorptivity of theHerschel Space Observatory telescope mirror coating,” inTerahertz and Gigahertz Electronics and Photonics III, R. J.Hwu, ed., Proc. SPIE 5354 �to be published�.
1. M. Born and E. Wolf, Principles of Optics, 6th ed. �Pergamon,Oxford, 1986�.
2. G. W. C. Kaye and T. H. Laby, Tables of Physical and ChemicalConstants, 16th ed. �Longman, Essex, UK, 1995�.
3. H. C. van de Hulst, Light Scattering by Small Particles �Dover,New York, 1957�.
4. B. T. Draine and H. M. Lee, “Optical properties of interstellargraphite and silicate grains,” Astrophys. J. 285, 89–108�1984�.