Crystal identification in positron emission tomographyusing nonrigid registration to a Fourier-basedtemplate
Abhijit J Chaudhari1,4, Anand A Joshi2,4, Spencer L Bowen1,Richard M Leahy2, Simon R Cherry1 and Ramsey D Badawi3
1 Department of Biomedical Engineering, University of California-Davis, Davis, CA 95616, USA2 Signal and Image Processing Institute, University of Southern California, Los Angeles,CA 90089, USA3 Department of Radiology, UC Davis Medical Center, Sacramento, CA 95817, USA
Received 19 May 2008, in final form 11 July 2008Published 22 August 2008Online at stacks.iop.org/PMB/53/5011
AbstractModern positron emission tomography (PET) detectors are typically madefrom 2D modular arrays of scintillation crystals. Their characteristic floodfield response (or flood histogram) must be segmented in order to correctlydetermine the crystal of annihilation photon interaction in the system. Crystalidentification information thus generated is also needed for accurate systemmodeling as well as for detailed detector characterization and performancestudies. In this paper, we present a semi-automatic general purpose template-guided scheme for the segmentation of flood histograms. We first generatea template image that exploits the spatial frequency information in the givenflood histogram using Fourier-space analysis. This template image is a lowerorder approximation of the flood histogram, and can be segmented withhorizontal and vertical lines drawn midway between adjacent peaks in thehistogram. The template is then registered to the given flood histogram by adiffeomorphic polynomial-based warping scheme that is capable of iterativelyminimizing intensity differences. The displacement field thus calculatedis applied to the segmentation of the template resulting in a segmentationof the given flood histogram. We evaluate our segmentation scheme fora photomultiplier tube based PET detector, a detector with readout by aposition-sensitive avalanche photodiode (PSAPD) and a detector consistingof a stack of photomultiplier tubes and scintillator arrays. Further, wequantitatively compare the performance of the proposed method to that ofa manual segmentation scheme using reconstructed images of a line-source
4 Both authors have contributed equally to this work.
phantom. We also present an adaptive method for distortion reduction in floodhistograms obtained for PET detectors that use PSAPDs.
(Some figures in this article are in colour only in the electronic version)
1. Introduction
Positron emission tomography (PET) cameras currently used for clinical as well as pre-clinicalapplications are frequently made up of 2D modular detector arrays of scintillation crystals(Humm et al 2003, Phelps 2004). Incident annihilation photons interact in these scintillationcrystals producing a proportionate number of optical photons that are routed toward the frontand back face of the crystals due to thin reflector sheets placed between adjacent crystals(Cherry et al 2003). All crystals of the detector array can be read out simultaneously either bya single position-sensitive photodetector device or an array of discrete detector elements thatare optically coupled to the rear end of the array (Muehllehner and Karp 2006).
When the detector array is irradiated with an annihilation photon flood source, theoutput electronic signals from the photodetectors can be used to create a two-dimensionaldistribution of the horizontal (X) and vertical (Y ) positions of the detected events. Thisprobabilistic map, where each peak corresponds to a single crystal in the detector array,is called the flood histogram. For conventional block detectors that use a stack of foursingle-channel photomultiplier tubes (PMTs) or for those based on multi-channel positionsensitive PMTs (PSPMTs) with multiplexed readout, the X and Y positions, typically, arecomputed using Anger’s method (Anger 1964, Siegel et al 1996). However, for detectors thatuse position sensitive avalanche photodiodes (PSAPD), a pincushion distortion results whenAnger’s equations are used (Shah et al 2002, Olcott et al 2005). A mathematical descriptionof the charge sharing mechanism that leads to the pincushioning effect was given by Despreset al (2007). This work proposed a correction method, but concluded that the recovery ofcorner and edge crystals was largely limited by the underlying physics. A new positioningalgorithm for reducing the pincushion distortion was developed by Zhang et al (2007). Thismethod, while demonstrating desirable performance for certain PSAPD designs, overestimatesthe pincushioning effect in other cases and leads to barrel distortions. This phenomenon maybe attributed to the different resistive readout schemes used in the manufacturing process ofPSAPDs that tend to produce different orders of pincushioning in the flood histogram (Despreset al 2007).
For detailed characterization of PET detectors in a scanner and consequently, foraccurate system modeling and image reconstruction, parameters like energy resolution, timingresolution and light collection need to be measured for each crystal in the system. Thisis because individual crystals even in the same detector array can have different detectionefficiencies, varying energy deposition characteristics and diverse optical photon collectionproperties (Dahlbom and Hoffman 1988). In addition, there may be variations across detectorblocks. For characterization measurements, a look-up table (LUT) that delineates events inone crystal from those in adjacent crystals is created. This is done by segmenting the floodhistograms of each detector block into regions equal in number to the total number of crystalsin that block, such that each region contains one peak. Events are assigned to the crystals basedon their X and Y signals and the corresponding value in the LUT. This procedure facilitatesperformance analysis for individual crystals in detector arrays, and provides normalizationdata needed for system modeling. It is crucial that the LUT be reasonably accurate since
Crystal identification for PET using nonrigid registration 5013
imprecisions may affect scanner spatial resolution (Cutler and Hoffman 1994). Sensitivitymay also be impaired since mispositioned events will be subject to incorrect detection energywindows.
Modern PET scanners typically have thousands of crystals (e.g. the microPET II smallanimal PET scanner has a total of 17 640 crystals, while the Siemens Biograph four-ringclinical PET scanner has 32 448 crystals). The most time-consuming method for segmentationof flood histograms is to manually select the peaks by clicking at appropriate points onthe computer screen and then use the binary file thus created (1 corresponding to pixelsclicked and 0 otherwise) as an input to a standard segmentation method, e.g. the watershedmethod (Vincent and Soille 1991). A semi-automatic method where the manual process wasreplaced by background subtraction of the flood histogram followed by spatial filtering fornoise removal and peak identification by intensity-based thresholding was developed by Mao(2000). This method, however, was not robust for the identification of edge crystals due to thehard thresholding condition and hence, considerable time was needed for manually correctingthe segmentation. An approach using Gaussian mixture models (GMM) for segmentingflood histograms from multilayer GSO-based depth-of-interaction (DOI) capable detectorswas proposed by Yoshida et al (2004). Their approach performed well for complex floodhistograms of individual blocks, but was impractical for the flood histogram of the wholedetector because a large number of parameters for the GMM must be estimated. A methodbased on neural networks and self-organizing maps for the small animal YAP-(S)PET scanner(Del Guerra et al 1998) was implemented by Lazerrini et al (2004). A similar approach wastaken by Hu et al (2006) for the Inveon scanner. These methods were able to achieve highaccuracy for their specific detector designs, but suffered from instability due to inconsistenciesin training data. Segmentation methods directly based on absolute intensities of the individualspots in the original flood histogram are likely to fail. This is because individual crystals in thedetector array may have dissimilar efficiencies and as a consequence, may produce spots oflargely varying intensities in the flood histogram. Choosing an appropriate threshold neededfor segmentation is then non-trivial.
In this paper, we present a general purpose scheme for segmenting flood histogramsmeasured from PET detectors that use 2D detector arrays. We also propose an adaptivemethod for distortion correction of flood histograms obtained from PSAPDs that rendersthem suitable for segmentation using the proposed scheme. For the segmentation process,we start with an intensity correction step based on Fourier methods. Further, the discreteFourier transform (DFT) of the corrected image is exploited to derive a template image thatis a lower order spatial approximation of the flood histogram. In this process, knowledgeabout the total number of crystals in the array is incorporated. The template image is suchthat it lends itself to segmentation by horizontal and vertical lines between adjacent peaks.A scheme based on intensity matching is used to register the template to the flood histogram(in this case, the target). Diffeomorphism constraints are imposed on the warp leading toan invertible transformation. This invertibility of the mapping ensures that there is a one-to-one correspondence between the template and target, and hence, no ambiguity in assigningintensity values will be encountered. The segmentation derived from the template is thentransformed into the target coordinates using the calculated warping function, resulting in thesegmentation of the flood histogram. We also report on a tool for manual correction we havedeveloped which allows the user to modify the underlying flood histogram for the sake ofsegmentation in aberrant cases, e.g. when a complete horizontal or vertical line is missingfrom the map.
This paper is organized as follows. We first present formulae for computing floodhistograms for PET detectors using PSPMTs and PSAPDs that include an adaptive method
5014 A J Chaudhari et al
(a)
(b) (c)
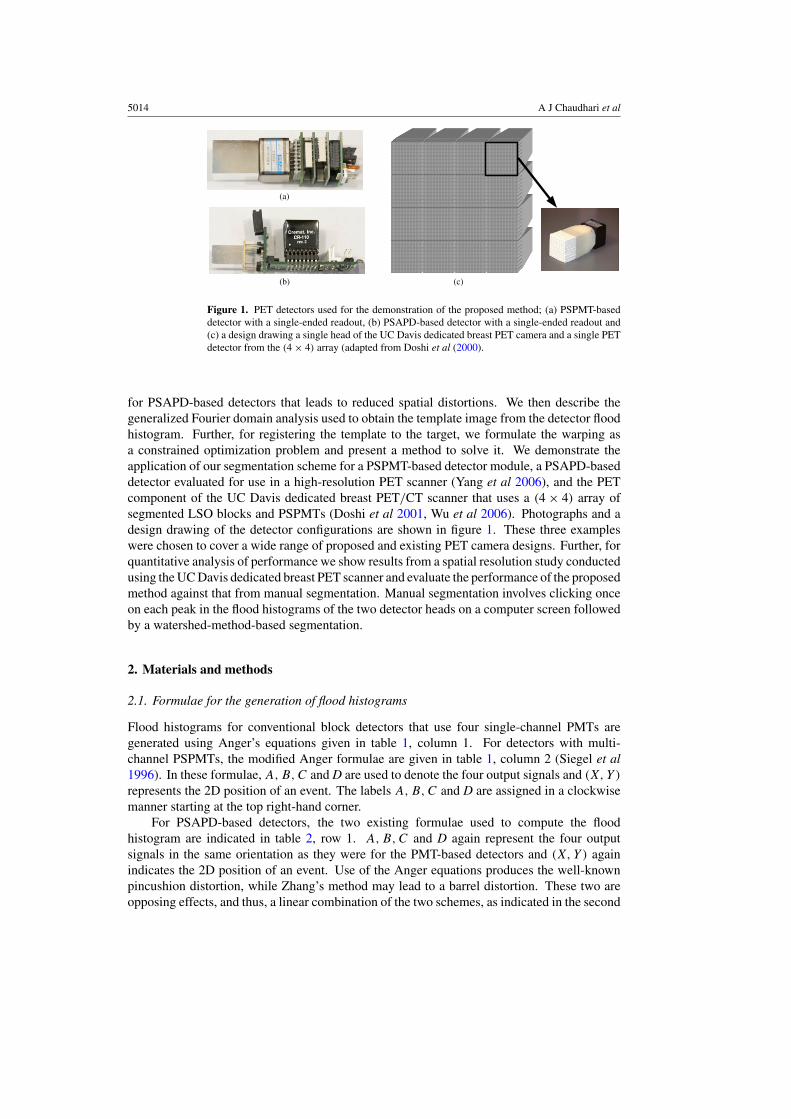
Figure 1. PET detectors used for the demonstration of the proposed method; (a) PSPMT-baseddetector with a single-ended readout, (b) PSAPD-based detector with a single-ended readout and(c) a design drawing a single head of the UC Davis dedicated breast PET camera and a single PETdetector from the (4 × 4) array (adapted from Doshi et al (2000).
for PSAPD-based detectors that leads to reduced spatial distortions. We then describe thegeneralized Fourier domain analysis used to obtain the template image from the detector floodhistogram. Further, for registering the template to the target, we formulate the warping asa constrained optimization problem and present a method to solve it. We demonstrate theapplication of our segmentation scheme for a PSPMT-based detector module, a PSAPD-baseddetector evaluated for use in a high-resolution PET scanner (Yang et al 2006), and the PETcomponent of the UC Davis dedicated breast PET/CT scanner that uses a (4 × 4) array ofsegmented LSO blocks and PSPMTs (Doshi et al 2001, Wu et al 2006). Photographs and adesign drawing of the detector configurations are shown in figure 1. These three exampleswere chosen to cover a wide range of proposed and existing PET camera designs. Further, forquantitative analysis of performance we show results from a spatial resolution study conductedusing the UC Davis dedicated breast PET scanner and evaluate the performance of the proposedmethod against that from manual segmentation. Manual segmentation involves clicking onceon each peak in the flood histograms of the two detector heads on a computer screen followedby a watershed-method-based segmentation.
2. Materials and methods
2.1. Formulae for the generation of flood histograms
Flood histograms for conventional block detectors that use four single-channel PMTs aregenerated using Anger’s equations given in table 1, column 1. For detectors with multi-channel PSPMTs, the modified Anger formulae are given in table 1, column 2 (Siegel et al1996). In these formulae, A,B,C and D are used to denote the four output signals and (X, Y )
represents the 2D position of an event. The labels A,B,C and D are assigned in a clockwisemanner starting at the top right-hand corner.
For PSAPD-based detectors, the two existing formulae used to compute the floodhistogram are indicated in table 2, row 1. A,B,C and D again represent the four outputsignals in the same orientation as they were for the PMT-based detectors and (X, Y ) againindicates the 2D position of an event. Use of the Anger equations produces the well-knownpincushion distortion, while Zhang’s method may lead to a barrel distortion. These two areopposing effects, and thus, a linear combination of the two schemes, as indicated in the second
Crystal identification for PET using nonrigid registration 5015
Table 1. Formulae used for event positioning for PMTs.
Conventional block detectors Multichannel PSPMTs
X1 = (A+B)−(C+D)A+B+C+D
X2 = AA+B
Y1 = (A+D)−(B+C)A+B+C+D
Y2 = CC+D
Table 2. Formulae used for event positioning for PSAPDs.
row of table 2, is expected to yield outcomes with the least distortion. In these proposedadaptive formulae, we have allowed for α to take on a value between 0 and 1 since thepincushioning effect need not be an exact inverse of the barrel one. The special cases α = 0and α = 1 correspond to Zhang’s method and Anger’s method respectively.
2.2. Measurement of flood histograms for PET detectors
2.2.1. The single PSPMT-based detector block. The PSPMT used in the detector was fromHamamatsu Corporation, Bridgewater, NJ, USA (part #R7600-00-C12). The anode signalsfrom the PSPMT were mapped to four position-encoding signals using a resistive network(Seidel et al 1999). The PSPMT was coupled by optical grease (Bicron, Saint-GobainCeramics & Plastics Inc., Paris, France) to a 14×14 array of (1.5×1.5×20) mm3 unpolishedLutetium Oxyorthosilicate (LSO) scintillation crystals (Agile Engineering, Knoxville, TN,USA). Electronic collimation was achieved using a setup previously reported (Yang et al2006) with a 1.67 MBq 22Na point source with diameter 0.5 mm. The detector array wasirradiated from one side along its longer axis at distances of 2 mm and 18 mm from thePSPMT for 5 min each, and data were measured in a coincidence mode. This arrangementallowed for evaluating the robustness of our method to depth-dependent effects that are awell-known characteristic of flood histograms in PET detectors with single-ended readout(Yang et al 2007). Singles mode data were also measured without collimation with the 22Nasource irradiating the array from one side at distance 5 cm. The flood histogram acquired in acoincidence mode with electronic collimation at 2 mm from the PSPMT is used to demonstratestep by step the outcomes of the proposed segmentation method.
2.2.2. The PSAPD-based detector. The PSAPD used for this detector was manufactured atRadiation Monitoring Devices Inc. (RMD), Watertown, MA, USA and had an approximateactive area of (14 × 14) mm2 (Shah et al 2002). The device had four anodes for thedetermination of position and energy and a single cathode for timing measurement. The totalenergy of a particular event was determined by summing the corresponding measurementsfrom the four anodes. The array used in this case was a (9 × 9) stack of (1.5 × 1.5 × 30) mm3
unpolished LSO crystals. The detector was cooled to 0 ◦C and the flood histogram shown in
5016 A J Chaudhari et al
this paper was measured by irradiating the array for a 5 min duration in a coincidence modewith electronic collimation at 10 mm from the PSAPD employing the same setup used forthe PSPMT-based detector. We also examined the performance of the proposed method forhigh-resolution PET detectors that used (8 × 8) mm2 PSAPDs coupled to a (7 × 7) array of(0.9225 × 0.9225 × 20) mm3 unpolished LSO crystals (Yang et al 2008). In this case, thedetector was cooled to 0 ◦C and data were measured in a coincidence mode.
2.2.3. The PET component of the UC Davis dedicated breast PET/CT system. The PETcamera in this case consists of two flat-panel detector heads that rotate around the pendantbreast in the prone PET/CT scanner geometry (Wu et al 2006). Each of the heads consist ofa (4 × 4) array of position-sensitive photomultiplier tubes (PSPMT) coupled individually viaa lightguide to a (9 × 9) array of (3 × 3 × 20) mm3 LSO crystals. This design provides anexample of a stack of photodetectors and arrays that constitute a single detector head. Theflood histogram in this case was measured for 10 min using the LSO background.
2.3. Generating a template from the flood histogram
Due to crystal-to-crystal variability in the detector array, individual elements may not producespots with similar intensities in the flood histogram. To account for this effect, we first need toautomatically correct intensities over the whole image. The method proposed in section 2.3.1addresses this issue. The second step for the generation of the template is to use the horizontaland vertical patterns in the flood histogram effectively to achieve a reasonable approximationof the peak locations in it. A procedure developed for this is discussed in section 2.3.2. Forour discussion, let T ∈ R
M×N denote the flood histogram with M rows and N columns to besegmented and let Kx and Ky denote the number of crystals in the detector array in the X and Ydirections respectively. For the illustration of the intermediate steps, we use a flood histogramgenerated from the single PSPMT-based detector.
2.3.1. Intensity correction using the Fourier transform. Using the discrete Fourier transform(DFT), we represent T = FMΛFT
N , where FM ∈ CM×M and FN ∈ C
N×N denote the Fouriermatrices, and Λ ∈ C
M×N is the matrix of Fourier coefficients. We define a mask in the Fourierdomain for low-pass filtering that retains only (7×7) lower order coefficients in Λ (Jain 1989).The dimensions of this low-pass filter mask were chosen empirically. We then compute theinverse DFT of this masked image and take its absolute value, W, which is an overly smoothedversion of T but represents regions of high and low intensity. The intensity-corrected imageTI is obtained by performing a pixel-by-pixel division of T by W. Figure 2(a) shows theuncorrected flood histogram T, and figure 2(b) is W, the low-pass filtered version of figure 2(a).After scaling T by W, the resultant TI is shown in figure 2(c). High-intensity values in thetop portion of T are due to proximity to the radiation source. After correction, we observe anenhancement in the intensity of the spots, especially in the lower half of TI, as desired.
2.3.2. Obtaining the template. The flood histogram has dominant horizontal and verticalspatial components. Horizontal patterns in the image will correspond to vertical ones in theFourier domain. Similarly, vertical bands in space would correspond to horizontal patternsin the frequency domain. Starting with TI, we first obtain its DFT, denoted here by ΛI. Wethen create a mask in the frequency domain that has an intensity value of 1 along the lineswith spatial frequency along X or λx = 0 and spatial frequency along Y or λy = 0, and 0otherwise. Further, we perform a pixel-by-pixel multiplication of this mask with ΛI followed
Crystal identification for PET using nonrigid registration 5017
(a) (b) (c)
Figure 2. Fourier-based intensity correction; (a) the uncorrected flood histogram T for thePSPMT-based detector, (b) a low-pass filtered version W of (a) and (c) the intensity-correctedflood histogram TI.
(a) (b) (c)
Figure 3. Fourier-based template generation; (a) a filtered version of figure 2(c) keepingcoefficients only along the λx = 0 and λy = 0 lines in the frequency domain, (b) the estimatedtemplate image and (c) a segmentation of (b) into 196 non-overlapping regions. The black linesdenote region boundaries.
by an inverse DFT of the resultant, which we called TR. The image TR, shown in figure 3(a),indeed, highlights the vertical and horizontal grid lines of T. We then obtain the projectionsof TR along the X and Y directions. From these one-dimensional projections, we use a schemebased on first and second derivative properties of the underlying functions for finding Kx
and Ky peaks in the X and Y directions respectively. In this peak identification method,the inflection points for each projection are determined by finding zero crossings of its firstderivative, and then choosing those inflection points where its second derivative is negative.Once the peak locations are determined, a binary image with an intensity of 1 at the peaklocations and 0 otherwise is created. The binary image is then smoothed by convolving itwith a 2D spatial Gaussian filter whose standard deviation is set to be one third of the shortestdistance between adjacent peaks in the X or Y direction. This smoothing procedure reducesthe computational burden on the registration scheme we present in section 2.4. The templateimage thus obtained (denoted by S) is shown in figure 3(b). A segmentation of S into 196discrete regions generated from drawing horizontal and vertical lines midway between thepeaks is shown in figure 3(c). The pseudo-color denotes the region labels 1–196.
2.4. Intensity-based warping procedure
For registering image S to image T, we use an intensity-based warping scheme with polynomialbases. The objective of our registration scheme is to find a deformation field u(x) such that
5018 A J Chaudhari et al
the root mean square (RMS) error between the target image T(x) and the deformed templateimage S(x − u(x)) is minimized. We found that the spatial deformation in T from S can bemodeled accurately by polynomial warps of fifth or lesser order. The RMS cost functional inour case is given by
C(u(x)) = ‖S(x − u(x)) − T(x)‖2, (1)
where x = [x1, x2] and u(x) = [u1(x1, x2), u2(x1, x2)] are 2D-vector-valued variables andfunctions, and x1 and x2, and u1 and u2 are the coordinate components of x and u respectively.By writing the deformation fields in terms of polynomials, we get
u1(x1, x2) =n∑
r=0
r∑q=0
arqx
r−q
1 xq
2 , (2)
u2(x1, x2) =n∑
r=0
r∑q=0
brqx
r−q
1 xq
2 , (3)
where n is the rank of the polynomial bases and arq and br
q are the coefficients of the polynomialbases. In order to minimize C(u(x)) in (1) as a function of the polynomial coefficients, weuse the conjugate gradient algorithm with the Armijo line search (Luenberger 1984, Armijo1966). The gradient of the cost function C with respect to the coefficients ar
q was computedas follows:
∂C∂ar
q
= ∂
∂arq
∫(S(x − u(x)) − T(x))2 dx, (4)
=∫
2(S(x − u(x)) − T(x))∂S(x − u(x))
∂(x1 − u1(x))(−1)xk−r
1 xr2 dx. (5)
Here ∂S(x−u(x))
∂(x1−u1(x))is ∇x1 S interpolated at x − u(x). The derivative of the cost function with
respect to the coefficients brq is computed in a similar manner. Since the order of polynomial
used is very low, the resulting displacement is sufficiently smooth and regularizers such aslinear elastic energy are not required in practice. To test the invertibility of the deformationfield, we compute the Jacobian of the resulting mapping x �→ x − u(x) and make sure that itis positive definite at every step (Jost 2002). If this is not the case, a lower order polynomialbasis is chosen to approximate the transform. The resulting displacement thus calculated isthen applied to the segmentation of S to get the segmented version for T. The segmentationresults along with examples for the PSPMT-based detector are shown in section 3.1.
2.5. Tool for manual correction
There are unusual cases where human involvement may be required in the segmentationprocess. An example is when a whole vertical or horizontal line of peaks, or both, aremissing from the flood histogram. For these cases, we have developed a tool for manualcorrection to assist in the segmentation process. Using a graphical user interface (GUI), weallow users to click points where they expected to see peaks in a given flood histogram. TheX and Y information of the clicked points is used to create a pseudo-target for registration, inwhich the points manually chosen are superimposed onto the original flood histogram after2D Gaussian smoothing. All steps outlined to generate the segmentation are then repeatedwith the target replaced by the pseudo-target. The GUI was implemented in MATLAB andthe ginput command is used for reading the locations of the manually clicked points. Thecomplete procedure for segmentation is shown in figure 4.
Crystal identification for PET using nonrigid registration 5019
Figure 4. A flowchart of the flood histogram segmentation process.
2.6. Resolution phantom study
A ‘hot’ rod (inner diameter = 0.3 mm, length = 7 cm) filled with 18FDG was placed in a‘warm’ cylinder (diameter = 4.4 cm, length = 6 cm). The concentration ratio between therod and the background was maintained at 400:1. This phantom was imaged using the UCDavis dedicated breast PET scanner. Flood histograms obtained from each of the two rotatingheads of the scanner were first segmented by an unbiased volunteer who was ‘blind’ to theoutcomes of the automatic method. The manual segmentation scheme involved clicking onceon each of the 2 × 1296 = 2592 spots corresponding to the flood histograms of the two headson a computer screen. After this procedure, a binary file based on the clicked locations wascreated and the watershed method was used for segmentation. The same flood histogramswere segmented automatically using the proposed method. No manual correction was needed.Data were reconstructed using single-slice rebinning (Daube-Witherspoon and Muehllehner1987), followed by 2D-filtered backprojection.
Figure 5. Segmentation results for the 14×14 array; (a) the warped template, (b) an overlay of thesegmentation boundaries on the flood histogram for source depth = 2 mm from the PSPMT usingthe calculated warping transform, (c) estimated segmentation boundaries for the flood histogramgenerated for a source depth of 18 mm overlaid on the underlying map, (d) segmentation boundariesfor a flood histogram in singles mode.
Figure 6. Flood histograms obtained for a (9 × 9) array of (1.5 × 1.5 × 20) mm3 unpolishedLSO crystals; (a) using Anger’s equations, (b) using Zhang’s method and (c) using the proposedadaptive approach with α = 0.7.
3.2. Segmentation for the PSAPD-based PET detector
3.2.1. Preprocessing for distortion correction for PSAPD flood histograms. Flood histogramdata were measured using the setup outlined in section 2.2.2. The formulae shown in section 2.1were used for generating the flood histograms shown in figure 6. The four corner crystals havefewer events than other crystals. This can be attributed partly to their coupling efficiencieswith the PSAPD as they only partially overlap with the active area of the PSAPD, and partlyto low intercrystal scatter since they have only two neighbors. Figures 6(a) and (b) show thepincushion distortion encountered when using Anger’s equations and the barrel distortionsresulting from using Zhang’s formulae respectively. The results from the proposed adaptivemethod with α = 0.7 are shown in figure 6(c). The adaptive scheme, indeed, does produce ahistogram with a reduction in spatial distortions compared to Anger’s and Zhang’s methodsand is suitable for use with the proposed segmentation scheme.
3.2.2. Segmentation results. We repeated the segmentation procedure using figure 6(c) as ourtarget. The target flood histogram was first intensity corrected. A template generated by ourmethod was then registered to figure 6(c). The segmentation obtained is shown in figure 7(a).We observed that there was no ambiguity in the mapping because of the missing or low-efficiency crystals. The total computation time in this case for the (256 × 256) image was20 s. All 81 crystals were accurately segmented as determined from visual inspection.
Crystal identification for PET using nonrigid registration 5021
Figure 7. Segmentation of the PSAPD flood histograms; (a) an overlay of the segmentationboundaries on the distortion-corrected flood histogram, (b) estimated segmentation regionboundaries overlaid on the flood histogram obtained from Anger’s equations (figure 6(a)) aftertransferring labels, (c) estimated segmentation region boundaries overlaid on the flood histogramobtained from Zhang’s method (figure 6(b)).
3.2.3. Segmentation of the flood histograms generated using Anger’s or Zhang’s method.Once the distortion-corrected flood histogram is segmented as outlined above, labels forall events (every (Xc, Yc)) in the flood histogram were looked up. These labels were thentransferred to the coordinate systems of the flood histograms obtained using Anger’s schemeor Zhang’s method by using the corresponding (Xa, Ya) and (Xb, Yb) values respectively.There were pixels in the resultant images where labels were undefined. These were pixelswhere no events were registered. We estimated the labels at these pixels using median filteringwith a (3 × 3) neighborhood (Huang et al 1979) followed by nearest-neighbor interpolationto generate the corresponding segmentation. Our results are indicated in figures 7(b) and (c),where we show the estimated segmentation boundaries overlaid on the flood histograms offigures 6(a) and (b). In each case, all 81 crystals were segmented accurately as determined byvisual inspection.
3.2.4. Segmentation of detectors that use (8 × 8) mm2 PSAPDs. We applied the proposeddistortion correction and segmentation scheme to data measured from these detectors.Analogous to our results from the (14 × 14) mm2 PSAPDs, our adaptive formulae—in thiscase, with α = 0.65—produced flood histograms with reduced distortions. All 49 crystalscould automatically be segmented using the proposed method (results not shown).
3.3. Segmentation of the flood histogram from the PET component of the dedicatedbreast PET/CT
For the segmentation of the flood histogram in this case, we required an additional pre-processing step to segment the 16 individual flood histograms from the assemblage, followingwhich, each segment was processed separately.
3.3.1. Intensity correction and pre-processing. We started with the intensity correction stepfor the flood histogram of the whole detector block (shown in figure 8(a)). The low-pass filteredimage generated for this procedure is shown in figure 8(b). We segmented this image into16 regions using projections along X and Y and our peak-identification method. Figure 8(c)shows the corrected flood histogram with segmented region boundaries. Each region wastreated as a separate flood histogram for further analysis.
5022 A J Chaudhari et al
(a) (b) (c)
Figure 8. Intensity correction and segmentation of the flood histogram from the dedicatedbreast PET/CT scanner; (a) the uncorrected histogram, (b) the low-pass filtered image used forintensity correction and segmentation, (c) intensity-corrected histogram showing the boundariesof segmented regions.
(a) (b) (c)
Figure 9. Segmentation of the dedicated breast PET detector; (a) the segmentation generated,(b) magnified flood histogram with a missing peak with overlaid segmentation, (c) magnified floodhistogram with merged peaks with overlaid segmentation.
3.3.2. Segmentation of individual histograms and merger. All 16 flood histograms wereprocessed and a segmentation for each was generated. Since the warping was diffeomorphic,there was no ambiguity for allotment of segmented regions and for the merger of individualsegmentations generated. Figure 9(a) shows our results. These were generated in 124 s.Figures 9(b) and (c) show commonly encountered problems in PET camera designs. A fewpeaks are missing from the histogram owing to improper coupling or are merged and hence,inseparable. Because we have enforced the requirement that segmented regions must equalthe number of crystals in the arrays, the proposed method not only isolates regions where themissing crystals might be present but also distributes the merged peaks based on the horizontalor vertical information from other peaks in the histogram.
3.4. Tool for manual correction in unusual cases
In this subsection, we show an example of a flood histogram that had a missing horizontal lineof peaks. This histogram was obtained for one of the detectors from the UC Davis dedicatedbreast PET system where the coupling was suboptimal. Data are present in the histogramcorresponding to the decoupled area, except with lower counts. Figure 10(a) shows the map.The manual tool was used to estimate the missing crystal positions and an overlay of the flood
Crystal identification for PET using nonrigid registration 5023
(a) (b) (c)
Figure 10. Target modification using manual correction; (a) the flood histogram obtained froma (9 × 9) array, (b) the pseudo-target obtained by manual correction, (c) region boundaries aftersegmentation of (a).
Table 3. Average spatial resolution obtained from manual segmentation and the proposed method.The numbers in the brackets are standard deviations over the 30 horizontal slices.
histogram with peaks corresponding to the line of occluded crystals is shown in figure 10(b).This, now, was our pseudo-target. The boundaries of the resultant segmentation overlaid onthe flood histogram are shown in figure 10(c). The segmentation generated is able to classifyall 81 peaks in the flood histogram.
3.5. Resolution phantom study
Figure 11 shows the reconstructed images and the corresponding radial and tangential profilesobtained from the line source in the warm background experiment. The measured averageresolutions are indicated in table 3. These values were obtained by averaging the radial ortangential resolutions over 30 horizontal slices with spacing 1.8 mm through the reconstructedimages. No significant variation in spatial resolution as a function of axial position was seen foreither method, indicating that the spatial distortion caused by the geometrical approximationintroduced by single-slice rebinning was not a major contributor to the reconstructed spatialresolution (Sossi et al 1994). The manual segmentation procedure lasted 1 h and 28 min. Thesame flood histograms were segmented automatically using the proposed method in 4 minand 10 s. No statistically significant difference in the reconstructed radial and tangentialresolutions obtained from the two segmentation schemes was seen. Thus, no degradation inspatial resolution is caused by the proposed method.
4. Discussion
Crystal identification for PET scanners is necessary for detailed system characterization andquantitative studies, but this process can be both time consuming and tedious. A genericsolution to the crystal identification problem is proposed in this paper using a template-guidedsegmentation scheme. This scheme is especially efficient because the dependence of crystalidentification accuracy on absolute intensities of spots in the flood histogram is substantially
5024 A J Chaudhari et al
(a) (c)
(d)(b)
Figure 11. Results from the phantom study; (a) a horizontal section from phantom imagesreconstructed using manual segmentation, (b) the same horizontal section reconstructed usingthe automatic segmentation method, (c) radial profiles through a single slice in the reconstructedimage, (d) tangential profiles through a single slice of the reconstructed images.
reduced. Our segmentation approach can broadly be divided into two processes, (i) thegeneration of a Fourier-based template image and (ii) the registration of the template to theflood histogram to be segmented. With a good initial template, the burden on the registrationprocess was reduced with lower order polynomial bases modeling the underlying spatialvariations. Bending energy or elastic energy constraints can potentially be incorporated intoour method, if warranted. However, in our experience, this is not required. We acknowledgethat our choice of a diffeomorphic warping scheme for removing ambiguity in the warpedspace may be considered a matter of convenience and not a necessity. Other methods forregistration can easily be employed with our template. In imaging scenarios where relativelysmall changes occur in detector flood histograms over time, the template image can be storedand reused while only the registration step needs to be repeated.
The template image in this paper was segmented using horizontal and vertical lines drawnbetween adjacent peaks. However, an alternative approach of defining ‘islands’ around thespots in the histogram may be followed (Dahlbom and Hoffman 1988), if desirable. In thiscase, we would generate our initial segmentation by defining circles around the spots inthe template and then transform this segmentation to the target coordinate system using thecalculated warping field. However, while a one-to-one mapping is guaranteed by our proposedmethod, the topology may not be preserved, or in other words, circles need not be circles whentransformed. In this case, one may still be able to track points from the template to the targetand produce a circle around a spot whose radius is a mean of the distances of the points thatwere on the circle and the warped peak location. However, this process will need rigorousevaluation.
A manual tool that allows the user to create a modified pseudo-flood histogram byclicking on position estimates of the missing crystals is proposed. The tool also provides theuser flexibility in aberrant cases where undesirable segmentation is generated by the automatic
Crystal identification for PET using nonrigid registration 5025
method. For commercial scanners, such detectors are likely to be replaced. These faileddetectors may be identified by examining if our peak-finding procedure is able to clearlydelineate all crystals.
A composite method for PSAPDs that leads to significant reduction in spatial distortionwas presented. For a specific application using PSAPDs, α may be varied over the [0, 1]range and an optimal value may be determined for that application. The adaptability of theα parameter is expected to allow for compensating effects arising from the manufacturingvariability and performance differences for individual PSAPDs. An example of this isdescribed in section 3.2, where the adaptive formulae were used for both a (14 × 14) mm2
PSAPD and a (8 × 8) mm2 PSAPD. These two devices have different resistance values betweenthe back contacts due to their different sizes (Shah et al 2002). Furthermore, the junctioncapacitance changes with PSAPD size (Karplus et al 2006). In spite of this design variability,the adaptive formulae with different α values in the two cases yielded flood histograms thatcould be segmented automatically by the proposed method. We also expect better uniformityfor photon counts in individual crystals of the detector array when using the proposed methodcompared to Anger’s method due to reduced distortions (Zhang et al 2007).
Our segmentation results for PSPMT-based detectors indicate that the proposed algorithmwas able to segment the 196 regions automatically and fairly accurately as determined byvisual inspection. Crystal identification at the two depths in a coincidence mode and a singlesmode also indicates that the proposed method would not only be useful for detectors withsingle-ended readouts, but also for detectors with dual-ended readouts capable of measuringDOI where the PSPMT alone performs the task of X-Y crystal identification (Chaudhariet al 2008). The computation time in MATLAB for this case with severe nonlinearitieswas 47 s. In the future, we plan to implement our method in C and expect to achieve asegmentation result in less than 10 s. For PSAPD-based detectors, we have developed aprocedure not only for generating a segmentation of the distortion-corrected flood histogram,but also for segmenting flood histograms generated using either Anger’s or Zhang’s equation.This extension will especially be useful for existing PET scanners based on PSAPDs whichhave already implemented Anger’s or Zhang’s method as a part of their data processingsoftware. For the dedicated breast PET/CT detectors, the results of the proposed methodby visual inspection were accurate. Thus, our segmentation scheme was suitable for variousconfigurations of PET detectors.
For quantitative analysis, a spatial resolution study was performed. The performance ofthe proposed method was evaluated against manual segmentation, which in this case, maybe considered as a gold standard. We did not expect the proposed method to yield higherspatial resolution than manual segmentation, rather that it would be no worse. Our findingsconfirm that this indeed is the case. The major advantage of using the proposed method is inspeed and in the required human effort. The proposed scheme produced a segmentation fullyautomatically and is more than 20 times faster than the manual segmentation method for ourdedicated scanner that consisted of a total of 2592 crystals. This time saving will potentiallybe huge when tens of thousands of crystals need to be segmented in modern PET scanners.Thus, the proposed segmentation scheme provides an efficient and accurate method for routinePET scanner characterization studies and for quality control.
5. Conclusions
The semi-automatic segmentation scheme presented here produced accurate delineation ofcrystals from flood histograms obtained from PMT-based and PSAPD-based PET detectors,including those with stacked detector geometries. While providing manual control necessary
5026 A J Chaudhari et al
for exceptional cases, our scheme attempted to keep human involvement to the bare minimum.The adaptive method proposed in this paper for the generation of PSAPD flood histogramsresulted in reduced spatial distortions and was found to be beneficial for crystal identification.We conclude that the proposed segmentation method can easily be applied to a wide varietyof PET camera designs and potentially should facilitate accurate and accelerated systemcharacterization.
Acknowledgments
The authors would like to thank Dr Yongfeng Yang, Bo Peng and Dr Yibao Wu fromthe Department of Biomedical Engineering at University of California-Davis for help withthe preparation of this manuscript. The authors would also like to thank Dr PurushottamA Dokhale, Richard Farrell and Dr Kanai S Shah of Radiation Monitoring Devices, Inc.,Watertown, MA, USA for providing the PSAPDs used in this work and for discussionsregarding PSAPD flood histogram generation. This work was funded in part by the AmericanCancer Society award IRG-95-125-07, by the National Institutes of Health R44-CA094385,and by the Susan G Komen Foundation award BCTR0707455. This publication was alsomade possible by grant no UL1 RR024146 from the National Center for Research Resources(NCRR), a component of the National Institutes of Health (NIH) and NIH Roadmap forMedical Research.
References
Anger H O 1964 Scintillation camera with multichannel collimators J. Nucl. Med. 5 515–31Armijo L 1966 Minimization of functions having Lipschitz-continuous first partial derivatives Pac. J. Math. 16 1–3Chaudhari A J, Yongfeng Y, Farrell R, Dokhale P A, Shah K S, Cherry S R and Badawi R D 2008 PSPMT/APD
hybrid DOI detectors for the PET component of a dedicated breast PET/CT system—a feasibility study IEEETrans. Nucl. Sci. 55 853–61
Cherry S, Sorenson J and Phelps M 2003 Physics in Nuclear Medicine 3rd edn (Philadelphia, PA: Saunders)Cutler P D and Hoffman E J 1994 Use of digital front-end electronics for optimization of a modular PET detector
IEEE Trans. Med. Imaging 13 408–18Dahlbom M and Hoffman E J 1988 An evaluation of a two-dimensional array detector for high resolution PET IEEE
Trans. Med. Imaging 7 264–72Daube-Witherspoon M E and Muehllehner G 1987 Treatment of axial data in three-dimensional PET J. Nucl. Med.
28 1717–24Del Guerra A, Di Domenico G, Scandola M and Zavattini G A 1998 YAP-PET: first results of a small animal positron
emission tomograph based on YAP:Ce finger crystals IEEE Trans. Nucl. Sci. 45 3105–8Despres P, Barber W C, Funk T, McClish M, Shah K S and Hasegawa B H 2007 Modeling and correction of spatial
distortion in position-sensitive avalanche photodiodes IEEE Trans. Nucl. Sci. 54 23–9Doshi N K, Shao Y, Silverman R W and Cherry S R 2000 Design and evaluation of an LSO PET detector for breast
cancer imaging Med. Phys. 27 1535–43Doshi N, Silverman R, Shao Y and Cherry S 2001 MaxPET, a dedicated mammary and axillary region PET imaging
system for breast cancer IEEE Trans. Nucl. Sci. 48 811–5Hu D, Atkins B, Lenox M, Castleberry B and Siegel S 2006 A neural network based algorithm for building crystal
look-up table of PET block detector Nucl. Sci. Symp. Conf. Rec. 2006 IEEE 4Huang T, Yang G and Tang G 1979 A fast two-dimensional median filtering algorithm IEEE Trans. Acoust. Speech
Signal Process. 27 13–8Humm J L, Rosenfeld A and Del Guerra A 2003 From PET detectors to PET scanners Eur. J. Nucl. Med. Mol.
Imaging 30 1574–97Jain A 1989 Fundamentals of Digital Image Processing (Upper Saddle River, NJ: Prentice-Hall)Jost J 2002 Riemannian Geometry and Geometric Analysis 2nd edn (Berlin: Springer)Karplus E, Farrell R and Shah K 2006 Position sensitive solid state detector with internal gain US Patent Application
Crystal identification for PET using nonrigid registration 5027
Lazzerini B, Marcelloni F and Marola G 2004 Calibration of positron emission tomograph detector modules usingnew neural method Electron. Lett. 40 360–1
Luenberger D 1984 Linear and Nonlinear Programming 2 edn (Reading, MA: Addison-Wesley)Mao A 2000 Positron emission tomograph detector module calibration through morphological algorithms and
interactive correction International Student Technical Writing Competition winners 1999–2000Muehllehner G and Karp J 2006 Positron emission tomography Phys. Med. Biol. 51 R117–37Olcott P, Zhang J, Levin C, Habte F and Foudray A 2005 Finite element model based spatial linearity correction
for scintillation detectors that use position sensitive avalanche photodiodes IEEE Nucl. Sci. Symp. Conf. Rec. 52459–62
Phelps M 2004 PET: Molecular Imaging and Its Biological Applications (Berlin: Springer)Seidel J, Vaquero J J, Barbosa F, Lee I, Cuevas C, Gandler W R and Green M V 1999 Performance characteristics
of position-sensitive photomultiplier tubes combined through common X and Y resistive charge dividers IEEENucl. Sci. Symp. Conf. Rec. 3 1488–9
Shah K S, Farrell R, Grazioso R, Harmon E S and Karplus E A 2002 Position-sensitive avalanche photodiodes forgamma-ray imaging IEEE Trans. Nucl. Sci. 49 1687–92
Siegel S, Silverman R W, Shao Y and Cherry S R 1996 Simple charge division readouts for imaging scintillator arraysusing a multi-channel PMT IEEE Trans. Nucl. Sci. 43 1634–41
Sossi V, Stazyk M, Kinahan P and Ruth T 1994 The performance of the single-slice rebinning technique for imagingthe human striatum as evaluated by phantom studies Phys. Med. Biol. 39 369–80
Vincent L and Soille P 1991 Morphological image compositing IEEE Trans. Pattern Anal. Mach. Intell. 13 583–98Wu Y, Yang K, Packard N, Fu L, Stickel J, Tran V, Qi J, Boone J, Cherry S and Badawi R 2006 Characteristics of the
PET component of a dedicated breast PET/CT scanner prototype IEEE Nucl. Sci. Symp. Conf. Rec. 4 2335–9Yang Y, Dokhale P A, Silverman R W, Shah K S, McClish M A, Farrell R, Entine G and Cherry S R 2006 Depth
of interaction resolution measurements for a high resolution PET detector using position sensitive avalanchephotodiodes Phys. Med. Biol. 51 2131–42
Yang Y, Wu Y and Cherry S R 2007 Investigation of depth of interaction encoding for a pixelated LSO array with asingle multi-channel PMT IEEE Nucl. Sci. Symp. Conf. Rec.
Yang Y, Wu Y, Qi J, St James S, Du H, Dokhale P A, Shah K S, Farrell R and Cherry S R 2008 A prototype PETscanner with DOI-encoding detectors J. Nucl. Med. 49 1132–40
Yoshida E, Kimura Y, Kitamura K and Murayama H A M H 2004 Calibration procedure for a DOI detector of highresolution PET through a Gaussian mixture model IEEE Trans. Nucl. Sci. 51 2543–9
Zhang J, Olcott P D and Levin C S 2007 A new positioning algorithm for position-sensitive avalanche photodiodesIEEE Trans. Nucl. Sci. 54 433–7