Crystal structure refinement and investigation of electrically heterogeneous microstructure of single phased Sr substituted BaTiO 3 ceramics Monica Sindhu, Neetu Ahlawat ⇑ , Sujata Sanghi, Rekha Kumari, Ashish Agarwal Department of Applied Physics, Guru Jambheshwar University of Science and Technology, Hisar 125 001, Haryana, India article info Article history: Received 5 March 2013 Accepted 4 April 2013 Available online 12 April 2013 Keywords: Barium strontium titanate Rietveld refinement Impedance spectroscopy abstract Single phased Sr substituted BaTiO 3 ceramics were synthesized via solid state reaction technique and were found to crystallise in tetragonal symmetry with P4mm space group using Rietveld refinement. With increase in Sr content the tetragonality was reduced and the Curie temperature decreased at rate of 3 K/mol%. The contribution of grain interiors and grain boundaries to conduction and relaxation mech- anisms was discerned on basis of ac conductivity, impedance and modulus formalisms. Three conduction mechanisms were observed in grain interiors; two via conducting electrons from V 0 O and V 00 O and third one via oxygen vacancies itself. The relaxation at grain boundaries was attributed to the defect associate (V 00 o -2Ti 3þ ). Saturated hysteresis loops confirmed the ferroelectric nature of the ceramics. The remnant polarization P r and the coercive fields E c decrease with increase in Sr content. Ó 2013 Elsevier B.V. All rights reserved. 1. Introduction BaTiO 3 has always been a material of high research interest in scientific community as its properties can be widely manipulated by doping at one or both sites and by making its solid solutions with other perovskite materials [1–7]. It is also considered as one of the alternatives to the Pb based materials which are not environ- ment friendly. BaTiO 3 is a typical ferroelectric with three phase transitions: from rhombohedral to orthorhombic around 80 °C; from orthorhombic to tetragonal around 5 °C; and from tetragonal to cubic around 130 °C [8]. Various dopants like Ca 2+ , Sr 2+ ions at A site and/or Zr 4+ , Mn 4+ , Nb 5+ , Fe 2+ ions at B site are known to shift the phase transformation temperature in BaTiO 3 making it apt for high or low temperature suited piezoelectric devices [9]. Ferro- electrics find applications in multilayer capacitors, sensors, actua- tors dynamic random access memories, microwave phase shifters, transducers, positive temperature coefficient resistors [10–12]. Barium strontium titanate (BST) has been among the most promising candidate for these applications due to its high dielectric response and its tunability near the ferroelectric phase transforma- tion temperature. The transition temperature can be controlled by adjusting Sr composition [8]. To exploit these polycrystalline mate- rials efficiently it is essential to comprehend their transport prop- erties that are strongly affected by the material’s microstructure. Impedance spectroscopy (IS) is one such technique which is used to characterize the electrical microstructure of materials compre- hensively. In ceramics the charge carriers are not only blocked at metal–electrode interfaces but also at internal interfaces (grain boundaries/cracks/secondary phases). IS makes it feasible to delin- eate the intrinsic and extrinsic contributions in a material, thus revealing various conduction and relaxation mechanisms operat- ing within the microstructure of the material. In this paper, structural, dielectric and ferroelectric properties for Sr substituted BaTiO 3 ceramics are reported. The contribution of grain interiors and grain boundaries on conduction and relaxa- tion have been successfully distinguished from each other using ac conductivity, impedance and modulus formalisms. The mobility dynamics of charge carriers, ions and oxygen vacancies have also been performed on the basis of the above stated phenomena. In titanates, presence of multivalent cation (Ti) leads to charge carrier hopping thus affecting the electrical behaviour of the material. Dis- cernment of defect carriers and hopping ions depicts a clear picture of their effect on conductivity and dielectric response. 2. Experimental Details Polycrystalline Ba 1x Sr x TiO 3 (BST, x = 0.05, 0.10, 0.15) ceramics were synthe- sized by high temperature solid state reaction technique using high purity analyt- ical grade BaCO 3 , SrCO 3 and TiO 2 (purity P 99.0%) reagents. Powders were calcined at 873 K for 6 h in air at ramp of 5 K/min. Then, the mixture was reground, and fi- nally sintered at 1673 K for 7 h (at a ramp of 3 K/min up to 973 K and then at 7 K/ min up to 1673 K) in alumina crucibles. Crystal structure and phase purity of the BST ceramics were studied from X-ray diffraction patterns using a Rigaku Mini- flex-II diffractometer with Cu Ka radiation in the 2h range (10–80°). The data was further analyzed by the Rietveld refinement using General Structure Analysis 0925-8388/$ - see front matter Ó 2013 Elsevier B.V. All rights reserved. http://dx.doi.org/10.1016/j.jallcom.2013.04.026 ⇑ Corresponding author. E-mail address: [email protected](N. Ahlawat). Journal of Alloys and Compounds 575 (2013) 109–114 Contents lists available at SciVerse ScienceDirect Journal of Alloys and Compounds journal homepage: www.elsevier.com/locate/jalcom
Transcript
Journal of Alloys and Compounds 575 (2013) 109–114
Contents lists available at SciVerse ScienceDirect
Journal of Alloys and Compounds
journal homepage: www.elsevier .com/locate / ja lcom
Crystal structure refinement and investigation of electricallyheterogeneous microstructure of single phased Sr substituted BaTiO3
ceramics
0925-8388/$ - see front matter � 2013 Elsevier B.V. All rights reserved.http://dx.doi.org/10.1016/j.jallcom.2013.04.026
⇑ Corresponding author.E-mail address: [email protected] (N. Ahlawat).
Monica Sindhu, Neetu Ahlawat ⇑, Sujata Sanghi, Rekha Kumari, Ashish AgarwalDepartment of Applied Physics, Guru Jambheshwar University of Science and Technology, Hisar 125 001, Haryana, India
a r t i c l e i n f o
Article history:Received 5 March 2013Accepted 4 April 2013Available online 12 April 2013
Single phased Sr substituted BaTiO3 ceramics were synthesized via solid state reaction technique andwere found to crystallise in tetragonal symmetry with P4mm space group using Rietveld refinement.With increase in Sr content the tetragonality was reduced and the Curie temperature decreased at rateof 3 K/mol%. The contribution of grain interiors and grain boundaries to conduction and relaxation mech-anisms was discerned on basis of ac conductivity, impedance and modulus formalisms. Three conductionmechanisms were observed in grain interiors; two via conducting electrons from V0O and V00O and third onevia oxygen vacancies itself. The relaxation at grain boundaries was attributed to the defect associate(V00o-2Ti3þ). Saturated hysteresis loops confirmed the ferroelectric nature of the ceramics. The remnantpolarization Pr and the coercive fields Ec decrease with increase in Sr content.
� 2013 Elsevier B.V. All rights reserved.
1. Introduction
BaTiO3 has always been a material of high research interest inscientific community as its properties can be widely manipulatedby doping at one or both sites and by making its solid solutionswith other perovskite materials [1–7]. It is also considered as oneof the alternatives to the Pb based materials which are not environ-ment friendly. BaTiO3 is a typical ferroelectric with three phasetransitions: from rhombohedral to orthorhombic around �80 �C;from orthorhombic to tetragonal around 5 �C; and from tetragonalto cubic around 130 �C [8]. Various dopants like Ca2+, Sr2+ ions at Asite and/or Zr4+, Mn4+, Nb5+, Fe2+ ions at B site are known to shiftthe phase transformation temperature in BaTiO3 making it aptfor high or low temperature suited piezoelectric devices [9]. Ferro-electrics find applications in multilayer capacitors, sensors, actua-tors dynamic random access memories, microwave phase shifters,transducers, positive temperature coefficient resistors [10–12].Barium strontium titanate (BST) has been among the mostpromising candidate for these applications due to its high dielectricresponse and its tunability near the ferroelectric phase transforma-tion temperature. The transition temperature can be controlled byadjusting Sr composition [8]. To exploit these polycrystalline mate-rials efficiently it is essential to comprehend their transport prop-erties that are strongly affected by the material’s microstructure.Impedance spectroscopy (IS) is one such technique which is used
to characterize the electrical microstructure of materials compre-hensively. In ceramics the charge carriers are not only blocked atmetal–electrode interfaces but also at internal interfaces (grainboundaries/cracks/secondary phases). IS makes it feasible to delin-eate the intrinsic and extrinsic contributions in a material, thusrevealing various conduction and relaxation mechanisms operat-ing within the microstructure of the material.
In this paper, structural, dielectric and ferroelectric propertiesfor Sr substituted BaTiO3 ceramics are reported. The contributionof grain interiors and grain boundaries on conduction and relaxa-tion have been successfully distinguished from each other usingac conductivity, impedance and modulus formalisms. The mobilitydynamics of charge carriers, ions and oxygen vacancies have alsobeen performed on the basis of the above stated phenomena. Intitanates, presence of multivalent cation (Ti) leads to charge carrierhopping thus affecting the electrical behaviour of the material. Dis-cernment of defect carriers and hopping ions depicts a clear pictureof their effect on conductivity and dielectric response.
2. Experimental Details
Polycrystalline Ba1�xSrxTiO3 (BST, x = 0.05, 0.10, 0.15) ceramics were synthe-sized by high temperature solid state reaction technique using high purity analyt-ical grade BaCO3, SrCO3 and TiO2 (purity P 99.0%) reagents. Powders were calcinedat 873 K for 6 h in air at ramp of 5 K/min. Then, the mixture was reground, and fi-nally sintered at 1673 K for 7 h (at a ramp of 3 K/min up to 973 K and then at 7 K/min up to 1673 K) in alumina crucibles. Crystal structure and phase purity of theBST ceramics were studied from X-ray diffraction patterns using a Rigaku Mini-flex-II diffractometer with Cu Ka radiation in the 2h range (10–80�). The data wasfurther analyzed by the Rietveld refinement using General Structure Analysis
Fig. 2. The Rietveld refined XRD patterns of BST ceramics.
110 M. Sindhu et al. / Journal of Alloys and Compounds 575 (2013) 109–114
System (GSAS).The temperature dependent dielectric data were recorded by animpedance gain/phase analyzer (Newton’s 4th Ltd.) over the frequency range10 Hz–7 MHz and temperature range 300–713 K. Ferroelectric (P–E) hysteresisloops were obtained by using ferroelectric loop tracer.
3. Results and discussion
Fig. 1 shows the X-ray diffraction patterns of BST ceramics.Phase purity and tetragonal crystal structure of the preparedceramics was confirmed using JCPDS No. 05-0626. Fig. 2 depictsthe Rietveld refinement (using GSAS + EXPGUI program [13,14])of all the prepared ceramics. The initial Rietveld refinement wasperformed considering systemic errors into account as zero-pointshift, then the unit cell and background parameters were refined.To further improve the fitting, the peak profile parameters, isotro-pic thermal parameters, lattice parameters, scale factor, occupancyand atomic functional positions were refined. The refinement wasdone with the P4mm space group for the tetragonal perovskitestructure. A good agreement was obtained between the experi-mental relative intensities and the simulated intensities from themodel. The background was corrected using a Chebyschev polyno-mial of the first kind and the diffraction peak profiles were fitted bypseudo-Voigt function. The refined lattice parameters (‘a’, ‘c’), R-factors, bond lengths and bond angles are listed in Table 1. A goodagreement established between experimental relative intensitiesand simulated intensities of the model; and low values of v2
(approaching 1) confirmed an excellent fit of the data. With in-creased Sr content into BST ceramics, the unit cell tetragonality isreduced due to contraction of both ‘a’ and ‘c’ values which leadsto the shifting of the structure towards cubic in nature. This is fur-ther supported by reduced value of tolerance factor (t). The differ-ence in ionic radii of Ba2+ (1.61 Å) and Sr2+ (1.44 Å) ions is found tobe responsible for reduced c/a ratio and shifting of tetragonal sym-metry to ideal perovskite cubic structure. The bond lengths andbond angles also decreased as Sr content increased due to volumecontraction (Table 1). The average particle size was calculated fromXRD peak broadening using the Debye Scherrer equation; D = Kk/bcosh, where K (constant) = 0.89, b is the full width at half maxima(in radian) and h is the Bragg’s angle. The values were found to be28, 30, 32 nm for 0.05, 0.10 and 0.15 samples, respectively. Theparticle size gradually increases with increasing concentration ofSr.
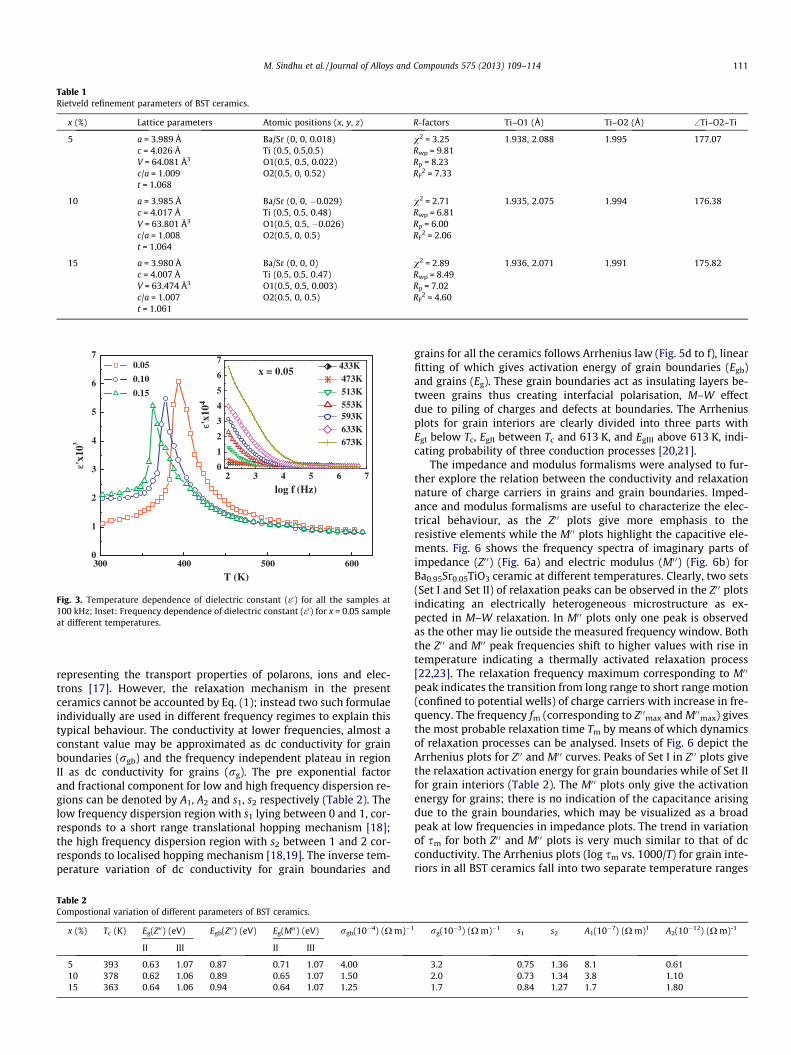
Fig. 3 illustrates the temperature dependence of dielectric con-stant (e0) for BST ceramics at 100 kHz. The dielectric anomaly cor-responds to the ferroelectric transition temperature (Tc) whichdecreases linearly with increase in Sr content at the rate of 3 K/mol% (Table 2). The decrease in Tc is linked to weak tetragonalstructure as the TiO6 octahedra are distorted revealed by volume
10 20 30 40 50 60 70 80
(301
/310
)
(212
)
(202
/220
)
(112
/211
)
(210
)
(002
/200
)
(111
)
(101
/110
)
(001
/100
)
Inte
nsit
y (a
.u.)
2θ (degree)
x = 0.05 x = 0.10 x = 0.15
Fig. 1. XRD patterns of BST ceramics at room temperature.
contraction (Table 1). The e0 exhibits larger dispersion at low fre-quencies with rise in temperature while it decreases to a constantvalue and becomes temperature independent at higher frequencies(Fig. 3, inset). This behaviour is well explained by the Maxwell–Wagner type relaxation, often occurring in the heterogeneous sys-tems with different conductivities [15]. According to this model,polycrystalline ceramics consists of perfectly conducting grainsseparated by insulating grain boundaries. Thus, the large value ofe0 at lower frequency is due to interfacial dislocations, oxygenvacancies, charged defects, grain boundary effect, etc., while thedecrease in e0 with frequency is attributed to the fact that any spe-cies contributing to polarizability is found to lag behind the exter-nal field as frequency is increased. The ac conductivitymeasurements further reveal a better evidence of M–W relaxation.
The ac conductivity (rac) was derived from the complex imped-ance data using the relation, rac = xe0e0tan d, where x is the fre-quency of applied field, e0 is the permittivity of free space andtan d are the dielectric losses. The frequency dependence of con-ductivity of all the BST ceramics was studied at various tempera-tures. The conductivity spectra of Ba0.95Sr0.05TiO3 sample clearlyshow two distinct frequency dependent dispersion regions(Fig. 4). Above 533 K two frequency independent plateaus (in Re-gion I and II) were observed but below 533 K only the plateau inregion II was observed as the other (Region I) may lie outside thestudied frequency window. The crossover frequency for both thedispersion regions (II and III) increases with temperature as shownby solid lines in Fig. 4 (guide to eye). The conductivity spectra be-come more dispersive with frequency and tend to merge at highfrequencies exhibiting weak temperature dependence (RegionIII). As frequency increases conductivity exhibits multiple step-likeincrements which is a characteristic of a potential profile withmultiple activation energies (i.e. potential wells with multiple bar-rier heights) [15].
Fig. 5a to c shows the fitted ac conductivity curves for all BSTceramics at 613 K. Generally, the ac conductivity due to the local-ised states is explained by the well augmented Jonsher power law,
rðxÞ ¼ rþ Axs ð1Þ
where, ‘A’ is pre-exponential factor and ‘s’ is the fractional compo-nent describing the degree of interaction of mobile carriers and lat-tice; both being temperature and material dependent [16]. Eq. (1)describes the conduction mechanism with the first term on rightgiving the frequency independent conductivity and the second term
Table 1Rietveld refinement parameters of BST ceramics.
x (%) Lattice parameters Atomic positions (x, y, z) R-factors Ti–O1 (Å) Ti–O2 (Å) \Ti–O2–Ti
5 a = 3.989 Å Ba/Sr (0, 0, 0.018) v2 = 3.25 1.938, 2.088 1.995 177.07c = 4.026 Å Ti (0.5, 0.5,0.5) Rwp = 9.81V = 64.081 Å3 O1(0.5, 0.5, 0.022) Rp = 8.23c/a = 1.009 O2(0.5, 0, 0.52) RF
2 = 7.33t = 1.068
10 a = 3.985 Å Ba/Sr (0, 0, �0.029) v2 = 2.71 1.935, 2.075 1.994 176.38c = 4.017 Å Ti (0.5, 0.5, 0.48) Rwp = 6.81V = 63.801 Å3 O1(0.5, 0.5, �0.026) Rp = 6.00c/a = 1.008 O2(0.5, 0, 0.5) RF
2 = 2.06t = 1.064
15 a = 3.980 Å Ba/Sr (0, 0, 0) v2 = 2.89 1.936, 2.071 1.991 175.82c = 4.007 Å Ti (0.5, 0.5, 0.47) Rwp = 8.49V = 63.474 Å3 O1(0.5, 0.5, 0.003) Rp = 7.02c/a = 1.007 O2(0.5, 0, 0.5) RF
2 = 4.60t = 1.061
300 400 500 6000
1
2
3
4
5
6
7
2 3 4 5 6 70
1
2
3
4
5
6
7
ε'x1
03
T (K)
0.05
0.10
0.15
433K 473K 513K 553K
ε'x1
04
log f (Hz)
593K 633K 673K
x = 0.05
Fig. 3. Temperature dependence of dielectric constant (e0) for all the samples at100 kHz; Inset: Frequency dependence of dielectric constant (e0) for x = 0.05 sampleat different temperatures.
M. Sindhu et al. / Journal of Alloys and Compounds 575 (2013) 109–114 111
representing the transport properties of polarons, ions and elec-trons [17]. However, the relaxation mechanism in the presentceramics cannot be accounted by Eq. (1); instead two such formulaeindividually are used in different frequency regimes to explain thistypical behaviour. The conductivity at lower frequencies, almost aconstant value may be approximated as dc conductivity for grainboundaries (rgb) and the frequency independent plateau in regionII as dc conductivity for grains (rg). The pre exponential factorand fractional component for low and high frequency dispersion re-gions can be denoted by A1, A2 and s1, s2 respectively (Table 2). Thelow frequency dispersion region with s1 lying between 0 and 1, cor-responds to a short range translational hopping mechanism [18];the high frequency dispersion region with s2 between 1 and 2 cor-responds to localised hopping mechanism [18,19]. The inverse tem-perature variation of dc conductivity for grain boundaries and
Table 2Compostional variation of different parameters of BST ceramics.
grains for all the ceramics follows Arrhenius law (Fig. 5d to f), linearfitting of which gives activation energy of grain boundaries (Egb)and grains (Eg). These grain boundaries act as insulating layers be-tween grains thus creating interfacial polarisation, M–W effectdue to piling of charges and defects at boundaries. The Arrheniusplots for grain interiors are clearly divided into three parts withEgI below Tc, EgII between Tc and 613 K, and EgIII above 613 K, indi-cating probability of three conduction processes [20,21].
The impedance and modulus formalisms were analysed to fur-ther explore the relation between the conductivity and relaxationnature of charge carriers in grains and grain boundaries. Imped-ance and modulus formalisms are useful to characterize the elec-trical behaviour, as the Z0 0 plots give more emphasis to theresistive elements while the M0 0 plots highlight the capacitive ele-ments. Fig. 6 shows the frequency spectra of imaginary parts ofimpedance (Z0 0) (Fig. 6a) and electric modulus (M0 0) (Fig. 6b) forBa0.95Sr0.05TiO3 ceramic at different temperatures. Clearly, two sets(Set I and Set II) of relaxation peaks can be observed in the Z0 0 plotsindicating an electrically heterogeneous microstructure as ex-pected in M–W relaxation. In M0 0 plots only one peak is observedas the other may lie outside the measured frequency window. Boththe Z0 0 and M0 0 peak frequencies shift to higher values with rise intemperature indicating a thermally activated relaxation process[22,23]. The relaxation frequency maximum corresponding to M0 0
peak indicates the transition from long range to short range motion(confined to potential wells) of charge carriers with increase in fre-quency. The frequency fm (corresponding to Z0 0max and M0 0
max) givesthe most probable relaxation time Tm by means of which dynamicsof relaxation processes can be analysed. Insets of Fig. 6 depict theArrhenius plots for Z0 0 and M0 0 curves. Peaks of Set I in Z0 0 plots givethe relaxation activation energy for grain boundaries while of Set IIfor grain interiors (Table 2). The M0 0 plots only give the activationenergy for grains; there is no indication of the capacitance arisingdue to the grain boundaries, which may be visualized as a broadpeak at low frequencies in impedance plots. The trend in variationof sm for both Z0 0 and M0 0 plots is very much similar to that of dcconductivity. The Arrhenius plots (log sm vs. 1000/T) for grain inte-riors in all BST ceramics fall into two separate temperature ranges
Fig. 4. Frequency dependence of ac conductivity (rac) for x = 0.05 sample atdifferent temperatures.
-6
-4
-2
-6
-4
-2
-6
-4
-2
-4
-3
-2
-4
-3
-2
-1
1.5 2.0 2.5 3.01 2 3 4 5 6 7-4
-3
-2
log
σac
(Ωm
)-1
0.26eVEgI=
x = 0.05
(d)
EgII=0.71eV
EgIII=1.02eV
Egb=0.85eV
log
σdc
(Ωm
)-1
0.18eV
x = 0.15
(f)
1000/T (K-1)
Egb=0.87eV
EgIII=1.07eV
EgII=0.71eV
EgI =
0.26eV
x = 0.10
(e)EgI=
EgIII=1.05eV
EgII=0.72eV
Egb=0.86eV
x = 0.05 (a)
expt. fit fit
x = 0.10 (b)
(c)x = 0.15
log f (Hz)
Fig. 5. (a to c) Fitted frequency dependence of ac conductivity (rac) at 613 K; (d to f)Arrhenius plots of dc conductivity (rdc) for BST ceramics.
0
4
80
2
4
2 4 60.00
0.05
0.10
1.4 1.6 1.8 2.0 2.2-7
-6
-5
-4
EgIII=1.07eV
EgII=0.71eV
log
τ m(s
)
1000/T (K-1)
713K
(b)
553K
593K
633K
673K
M" x1
0-4
473K
513K
log f (Hz)
Set II
Z" (1
02 kΩ)
Set I
(a)
1 2 3 4 5 6 7
1.4 1.6 1.8 2.0
-6
-4
-2
Egb=0.87eV
EgIII=1.07eV
EgII=0.63eVlog
τ m(s
)
1000/T (K-1)
Set IIZ"
(102 kΩ
)
log f (Hz)
Set I
Fig. 6. Frequency dependence of imaginary (a) impedance (Z0 0) and (b) electricmodulus (M0 0) at various temperatures for x = 0.05 sample. Insets: Arrhenius plotsfor corresponding conduction and relaxation times (sm) for sample x = 0.05.
1 2 3 4 5 6 70.0
0.5
1.0
1.5
2.0
1 2 3 4 5 6 70.0
0.5
1.0 Z"/Z"max
, M" /M
" max
Z" /Z
" max
log f (Hz)
M"/M"max
x = 0.10
x = 0.15Z
" (10
2 kΩ)
log f (Hz)
x = 0.05 573K
Fig. 7. Composition dependence of imaginary impedance spectra at 573 K. Inset:Normalized imaginary impedance and electric modulus spectra at 573 K for x = 0.05sample.
112 M. Sindhu et al. / Journal of Alloys and Compounds 575 (2013) 109–114
below and above �613 K, indicating two different relaxation pro-cesses for the charge carrier migration. The decreased peak heightof M0 0 (Fig. 6b) with decrease in temperature implies an increase incapacitance (M0 0 / C�1) as the temperature approaches Curie tem-perature [24]. Coinciding peak sites of normalised Z0 0/Z0 0max (Set II)and M0 0/M0 0
max spectra (Fig. 7, inset) revealed that the relaxationwas dominated by nearly long range hopping process [25]. Compo-sition dependence of Z0 0 spectra (Fig. 7) clearly shows a consider-able increase in peak height with Sr content for Set I without anynoticeable change for Set II. Also, the peak height in M0 0 spectra re-mained unaffected with change in Sr content. This result is in orderwith the increased value of Egb (Z0 0) (Table 2) i.e. grain boundariespose more impedance with enhanced relaxation times as Sr substi-tution is increased.
Impedance spectroscopy illustrated electrical heterogeneityand presence of semiconducting grain interiors and insulatinggrain boundaries in all the ceramics. As suggested by the conduc-tivity values (Table 2) the grain interiors and grain boundariesact as two different media inducing high and low frequency con-duction, respectively. Thus, the origin of high dielectric constantat low frequencies could be rationalized using the M–W relaxation
for heterogeneous media (grain and grain boundaries). The activa-tion energies for conduction and relaxation were found to have al-most similar values for a particular ceramic in all the threeformalisms suggesting involvement of same charge carriers. Thethree slopes in the Arrhenius plots for grain interiors revealedthree different conduction processes for the charge carrier migra-tion. In perovskites containing titanate, it is well known that oxy-gen vacancies (Vo) can be easily created by loss of oxygen from thelattice during sintering at high temperatures leading to creation ofsingly/doubly ionised oxygen vacancies (V0O;V
00O), ionisation of
which creates conducting electrons as:
Oo $ Vo þ 1=2O2
Vo $ V0o þ e0
V0o $ V00o þ e0
9>=>;
ð2Þ
The conduction activation energies in grains below �Tc
(EgI � 0.18 and 0.26 eV) are close to activation energy (0.1 eV) ofsingly ionised oxygen vacancies (V0OÞ [26], indicating that conduc-tion in this region originated as a result of motion of electrons fromV0o. Also, coupling of Ti ions with these electrons (valence transfer
M. Sindhu et al. / Journal of Alloys and Compounds 575 (2013) 109–114 113
of Ti4+ + e0 M Ti3+) maintains the charge neutrality in the lattice.The conduction and relaxation energy values between Tc and�613 K (EgII) lie in range 0.62–0.72 eV, not far from activation en-ergy (0.7 eV) of doubly ionised oxygen vacancies ðV00OÞ. The similarvalues of conduction and relaxation energies suggested both thephenomena were of same physical nature. Thus, the dc conductionin this region originated due to electrons from V00O [21,27], whereasthe relaxation may be associated to the trap controlled ac conduc-tion around V00O [28]. The conduction and relaxation activationenergies (EgIII), above �613 K lie in range 1.02–1.07 eV. Waseret al. [29], reported that in temperature range 500–800 K, oxygenvacancies can act as charge carriers under thermal activation. Also,suggested by Ang et al. [21], in the same temperature range oxygenvacancies behave as polarons. Hence, the conduction mechanismin this region may be attributed to the dissociated long range V00Oand relaxation due to short range hopping of oxygen vacancies.The lower values of activation energy for conduction (0.85–0.87 eV) than relaxation (0.87–0.94 eV) in grain boundaries sug-gested that the dc conduction in this region may be attributed toconducting electrons from V00O, while the relaxation may be dueto the motion of dipole (V 00o-2Ti3þ) under an external field [28].
-9
-6
-3
0
3
6
9x = 0.05
P (
μC/c
m2 )
E (kV/cm)
Ec = 1.43 kV/cm
Pr = 2.71 μC/cm2
Emax= 9.24 kV/cm
Ps = 8.24 μC/cm2
(a)
-9
-6
-3
0
3
6
9
(b)
P (
μC/c
m2 )
E (kV/cm)
Ec = 1.25 kV/cm
Pr = 1.70 μC/cm2
Emax= 9.28 kV/cm
Ps = 6.85 μC/cm2
x = 0.10
-10 -5 0 5 10
-10 -5 0 5 10
-10 -5 0 5 10-9
-6
-3
0
3
6
9
(c)
Ec = 0.95 kV/cm
Pr = 1.65 μC/cm2
Emax= 7.10 kV/cm
Ps = 6.36 μC/cm2
P (
μC/c
m2 )
E (kV/cm)
x = 0.15
Fig. 8. P–E hysteresis loops of BST ceramics at room temperature.
Room temperature measurements of the polarization versuselectric field were performed on all the BST ceramics in order todetermine the value of the coercive electric field (Ec) and the rem-anent polarization (Pr), characteristics for ferroelectric materials(Fig. 8). Development and saturation of hysteresis confirms the fer-roelectric nature of the sintered ceramics. The values of Pr and Ec
decreased with increase in Sr content. The low coercive field andlow hysteresis loss (area of loop) is an indication of soft characterof these ceramics [30,31]. The increase in Sr content thus softensthe ferroelectrics making the domain switching easier [31].
4. Conclusions
Single phased Sr substituted BaTiO3 (BST) ceramics were suc-cessfully synthesized using solid state reaction technique. PowderX-ray diffraction investigations performed at room temperaturealong with Rietveld refinement show that the crystal structure istetrahedral for all the compositions. A linear decrease in Curie tem-perature with increase in Sr substitution suggests possibility of tai-loring of Tc to lower temperatures. The high dielectric constant atlow frequencies is attributed to M–W relaxation. The contributionto conduction and relaxation from grain boundaries and grain inte-riors was elucidated. The multi activation energy values in differ-ent temperature ranges confirmed electrically heterogeneousmicrostructure in BST ceramics. The values of Pr and Ec decreasedwith increase in Sr content. This gives an insight that these ceram-ics may be promising lead free materials with low coercive fields atlow Tc values.
Acknowledgements
Authors are thankful to DST, New Delhi (FIST Scheme) for pro-viding XRD facilities. One of the authors (N. Ahlawat) is thankful tothe AICTE (Ref. No. 8023/RID/RPS/006/11/12), New Delhi for pro-viding financial assistance. The author (M.S.) is thankful to HaryanaState Counseling Society, Panchkula, Govt. of Haryana, India forproviding Sir CV Raman Scholarship. Another author (R.K.)acknowledges UGC, New Delhi for providing JRF (No. F-17-11/2008-SA-1).
References
[1] D.C. Sinclair, A.R. West, J. Appl. Phys. 66 (1989) 3850.[2] G.H. Haertling, J. Am. Ceram. Soc. 82 (1999) 797.[3] R. Guo, L.E. Cross, S.-E. Park, B. Noheda, D.E. Cox, G. Shirane, Phys. Rev. Lett. 84
(2000) 5423.[4] W. Liu, X. Ren, Phys. Rev. Lett. 103 (2009) 257602.[5] J. Rodel, W. Jo, K.T.P. Seifert, E.-M. Anton, T. Granzow, D. Damjanovic, J. Am.
Ceram. Soc. 92 (2009) 1153.[6] T. Tsurumi, H. Adachi, H. Kakemoto, S. Wada, Y. Mizuno, H. Chazono, H. Kishi,
Jpn. J. Appl. Phys. 41 (2002) 6929.[7] I. Levin, E. Cockayne, V. Krayzman, J.C. Woicik, S. Lee, C.A. Randall, Phys. Rev. B
83 (2011) 094122.[8] L. Zhou, P.M. Vilarinho, J.L. Baptista, J. Eur. Ceram. Soc. 19 (1999) 2015.[9] B. Jaffe, W.R. Cook, H. Jaffe, Piezoelectric Ceramics, Academic Press, London,
1971.[10] A.K. Tagantsev, V.O. Sherman, K.F. Astafiev, J. Venkatesh, N. Setter, J.
325.[12] Q. Zhang, J. Zhai, L. Kong, X. Yao, J. Appl. Phys. 112 (2012) 124112.[13] A.C. Larson, R.B.V. Dreele, LANL Rep., LAUR, 2000, 86.[14] B.H. Toby, J. Appl. Cryst. 34 (2001) 210.[15] E. Barsoukov, J.R. Macdonald, Impedance Spectroscopy Theory, Experiment
and Applications, Wiley-Interscience Press, New York, 2005.[16] A.P. Almond, A.R. West, R.J. Grant, Solid State Commun. 44 (1982) 277.[17] S.R. Elliot, Adv. Phys. 36 (1987) 135.[18] N. Ortega, A. Kumar, P. Bhattacharya, S.B. Majumder, R.S. Katiyar, Phys. Rev. B
77 (2008) 014111.[19] K. Funke, Prog. Solid State Chem. 22 (1993) 111.[20] O. Bidault, P. Goux, M. Kchikech, M. Belkaoumi, M. Maglione, Phys. Rev. B 49
(1994) 7868.[21] C. Ang, Z. Yu, L.E. Cross, Phys. Rev. B. 62 (2000) 228.
114 M. Sindhu et al. / Journal of Alloys and Compounds 575 (2013) 109–114
[22] S. Hunpratub, P. Thongbai, T. Yamwong, R. Yimnirun, S. Maensiri, Appl. Phys.Lett. 94 (2009) 062904.
[23] Z. Li, H.Q. Fan, J. Appl. Phys. 106 (2009) 054102.[24] D.C. Sinclair, Bol. Soc. Esp. Cerám. Vidrio. 34 (1995) 55.[25] W. Bai, G. Chen, J.Y. Zhu, J. Yang, T. Lin, X.J. Meng, X.D. Tang, C.G. Duan, J.H. Chu
Appl, Phys. Lett. 100 (2012) 082902.[26] J. Daniels, K.H. Hardtl, Philips Res. Rep. 31 (1976) 480.
[27] A. Pelaiz-Barranco, Appl. Phys. Lett. 100 (2012) 212903.[28] S.J. Lee, K.Y. Kang, S.K. Han Appl, Phys. Lett. 75 (1999) 1784.[29] R. Waser, T. Baiatu, K.H. Hardtl, J. Am. Ceram. Soc. 73 (1990) 1645.[30] F. Benabdallah, A. Simon, H. Khemakhem, C. Elissalde, M. Maglione, J. Appl.
Phys. 109 (2011) 124116.[31] W. Liu, W. Chen, L. Yang, L. Zhang, Y. Wang, C. Zhou, S. Li, X. Ren, Appl. Phys.