Section 2. Glass-ceramics and crystallization process Crystallization mechanism and properties of a blast furnace slag glass C. Fredericci a , E.D. Zanotto a, * , E.C. Ziemath b a Vitreous Materials Laboratory – LaMaV, Department of Materials Engineering – DEMa, Federal University of S~ ao Carlos, UFSCar, C.P. 676, 13565-905 S~ ao Carlos, SP, Brazil b Department of Physics, IGCE – UNESP, C.P. 178, 13500-970 Rio Claro, SP, Brazil Abstract The complex crystallization process of a Brazilian blast-furnace slag glass was investigated using dierential scanning calorimetry (DSC), X-ray diraction, optical microscopy, transmission electron microscopy (TEM), selected area diraction (SAD), energy dispersive spectroscopy (EDS) and micro-Raman spectroscopy. Three crystalline phases (merwinite, melilite and larnite) were identified after heat treatment between T g (742°C) and the DSC crystallization peak (T 1000°C). Merwinite was identified as a metastable phase. A small amount (0.004 wt%) of metallic platinum was found in the glass composition. Particles of Pt 3 Fe, detected by EDS and SAD–TEM, were the starting points of crystallization acting, therefore, as heterogeneous nucleating sites. Only melilite and larnite precipitated in a glass sample heat-treated at 1000°C for 1 h. The flexural strength of this crystallized sample was less than that of the glass, probably due the allotropic phase transformation of larnite. Ó 2000 Published by Elsevier Science B.V. All rights reserved. 1. Introduction The volume of slag varies according to the raw materials used to produce pig iron; typically, 300 kg of blast-furnace slag are produced per ton of pig iron. The amount of this waste material pro- duced at CSN (Companhia Siderurgica Nacional, RJ, Brazil), for example, is approximately 1.2 million tons per year. The use of this material is an issue of ongoing concern for both economic and ecological reasons. Little eort has been made in Brazil so far to study the use of blast-furnace slags in glass–ceramics. Although the process to pro- duce slag glass–ceramics has been known for a long time [1], the experiments described in the lit- erature can only serve as a tentative guide for the study of dierent slags [2]. The vast quantity of blast-furnace slags pro- duced in Brazil and the successful conversion of these materials into glass-ceramics in other coun- tries [3,4] were the main reasons this study was undertaken. Properties such as high strength, hardness and wear resistance have allowed slag glass-ceramics to be used successfully in several applications, including the civil construction in- dustry [5]. Obtaining glass-ceramics with improved properties for applications, depends not only on the ease with which the glass can be prepared and crystallized, but also on the microstructure and crystalline phases developed through heat treat- ment. Crystallization starting on the glass surface Journal of Non-Crystalline Solids 273 (2000) 64–75 www.elsevier.com/locate/jnoncrysol * Corresponding author. Tel.: +55-16 274 8250; fax: +55-16 272 7404. E-mail address: [email protected] (E.D. Zanotto). 0022-3093/00/$ - see front matter Ó 2000 Published by Elsevier Science B.V. All rights reserved. PII: S 0 0 2 2 - 3 0 9 3 ( 0 0 ) 0 0 1 4 5 - 9
Transcript
Section 2. Glass-ceramics and crystallization process
Crystallization mechanism and properties of a blast furnaceslag glass
C. Fredericci a, E.D. Zanotto a,*, E.C. Ziemath b
a Vitreous Materials Laboratory ± LaMaV, Department of Materials Engineering ± DEMa, Federal University of S~ao Carlos, UFSCar,
C.P. 676, 13565-905 S~ao Carlos, SP, Brazilb Department of Physics, IGCE ± UNESP, C.P. 178, 13500-970 Rio Claro, SP, Brazil
Abstract
The complex crystallization process of a Brazilian blast-furnace slag glass was investigated using di�erential scanning
calorimetry (DSC), X-ray di�raction, optical microscopy, transmission electron microscopy (TEM), selected area
di�raction (SAD), energy dispersive spectroscopy (EDS) and micro-Raman spectroscopy. Three crystalline phases
(merwinite, melilite and larnite) were identi®ed after heat treatment between Tg (742°C) and the DSC crystallization
peak (T � 1000°C). Merwinite was identi®ed as a metastable phase. A small amount (0.004 wt%) of metallic platinum
was found in the glass composition. Particles of Pt3Fe, detected by EDS and SAD±TEM, were the starting points of
crystallization acting, therefore, as heterogeneous nucleating sites. Only melilite and larnite precipitated in a glass
sample heat-treated at 1000°C for 1 h. The ¯exural strength of this crystallized sample was less than that of the glass,
probably due the allotropic phase transformation of larnite. Ó 2000 Published by Elsevier Science B.V. All rights
reserved.
1. Introduction
The volume of slag varies according to the rawmaterials used to produce pig iron; typically, 300kg of blast-furnace slag are produced per ton ofpig iron. The amount of this waste material pro-duced at CSN (Companhia Sider�urgica Nacional,RJ, Brazil), for example, is approximately 1.2million tons per year. The use of this material is anissue of ongoing concern for both economic andecological reasons. Little e�ort has been made inBrazil so far to study the use of blast-furnace slagsin glass±ceramics. Although the process to pro-
duce slag glass±ceramics has been known for along time [1], the experiments described in the lit-erature can only serve as a tentative guide for thestudy of di�erent slags [2].
The vast quantity of blast-furnace slags pro-duced in Brazil and the successful conversion ofthese materials into glass-ceramics in other coun-tries [3,4] were the main reasons this study wasundertaken. Properties such as high strength,hardness and wear resistance have allowed slagglass-ceramics to be used successfully in severalapplications, including the civil construction in-dustry [5]. Obtaining glass-ceramics with improvedproperties for applications, depends not only onthe ease with which the glass can be prepared andcrystallized, but also on the microstructure andcrystalline phases developed through heat treat-ment. Crystallization starting on the glass surface
Journal of Non-Crystalline Solids 273 (2000) 64±75
0022-3093/00/$ - see front matter Ó 2000 Published by Elsevier Science B.V. All rights reserved.
PII: S 0 0 2 2 - 3 0 9 3 ( 0 0 ) 0 0 1 4 5 - 9
or from a small number of sites in the bulk usuallyresults in low strength materials due to their coarsegrained microstructures. On the other hand, e�-cient nucleation of crystals from numerous sitesproduces ®ner-grained microstructures and, con-sequently, greater strength materials. Normally, anucleating agent must be added to the glass topromote controlled crystallization of a largenumber of microns or even nanometer-sized crys-tals. Among these, TiO2, sul®des and Fe2O3 areparticularly e�ective for slag glasses [6].
This paper considers the crystallization mecha-nism of an unaltered blast-furnace slag composi-tion. We hope that, once the complexcrystallization of this system is known, it will bepossible to optimize the crystallization processthrough compositional adjustments and thermaltreatments to obtain glass-ceramics with usefulproperties.
2. Experimental
2.1. Raw materials, melting and sample preparation
The process consisted of grinding a slag fromCSN for 3 h to minimize its inhomogeneity, fol-lowed by dry magnetic separation of the metalliciron of the ground slag. The glass was prepared bymelting the ÔcleanÕ slag in a platinum crucible at1460°C for 3 h, followed by crushing and remelt-ing it twice for 2 h to increase homogeneity. A Pt-crucible was chosen to minimize corrosion, whoseproducts would change the slag glass composition.The liquid was quenched by pouring it onto a steelplate and then pressing it quickly with anotherstainless steel plate to suppress crystallization.Thermal treatments were performed in an electri-cal furnace having a thermal stability of �2°Cunder various heating schedules. After polishingand etching, the samples were observed by opticalmicroscopy and l-Raman spectra were obtainedfrom di�erent regions. The chemical compositionsof the slag and the glass were determined by in-ductively coupled plasma-atomic emission spec-troscopy (ICP-AES-Thermal Jarrel Ash ± modelAtomscan 25). The results, shown in Table 1, were
evaluated from an average of two measurementsfor each sample.
2.2. Di�erential scanning calorimetry
Di�erential scanning calorimetric (DSC) mea-surements were performed (Netzsch DSC, Model404), using a 20°C/min heating rate. Both ®ne (<74lm) and coarse (177±297 lm) powdered glasses,weighing (20 � 4) mg, were placed in a Pt pan, anempty Pt pan being used as a standard. Data wererecorded using a computer-driven data acquisitionsystem.
2.3. X-ray di�raction
To investigate the crystalline phases corre-sponding to the DSC thermogram peaks, the ®nelyground samples (d < 74 lm) were heat-treated atthe temperatures corresponding to the exothermicpeaks in the DSC curve at 20°C/min. When thechosen temperature was reached, the sample wasremoved immediately and allowed to cool to roomtemperature. The crystalline phases were identi®edin an X-ray powder di�ratometer (Siemens 5000D), using the copper Ka radiation �k � 15; 418 �A�and a nickel ®lter.
2.4. Optical microscopy
The number and size of crystals of the heat-treated samples were characterized by transmitted
Table 1
Chemical composition (wt%) of the slag (after magnetic sepa-
ration) and investigated glass
Components Slag Glass
CaO 43.5 � 0.5 43.7 � 0.4
SiO2 35.8 � 0.4 35.5 � 0.6
Al2O3 11.8 � 0.2 11.5 � 0.2
MgO 6.20 � 0.1 6.0 � 0.1
Fe2O3 0.3 � 0.05 0.30 � 0.03
TiO2 0.8 � 0.1 0.7 � 0.1
MnO 0.7 � 0.1 0.7 � 0.1
P2O5 0.07 � 0.03 0.04 � 0.01
Na2O 0.08 � 0.01 0.07 � 0.02
K2O 0.50 � 0.04 0.40 � 0.04
S 0.80 � 0.05 0.04 � 0.01
C 0.40 � 0.05 0.03 � 0.003
Pt ± 0.004 � 0.0002
C. Fredericci et al. / Journal of Non-Crystalline Solids 273 (2000) 64±75 65
light using a microscope (Jenapol±Carl Zeiss/Jena). The thickness of the sample (about 0.8 mm)was measured by micrometer and a ®xed area(0:8� 0:5) mm2 was selected in the microscope.The number of crystals per unit volume, Nv, wascounted by shifting the focus from one surface tothe other.
2.5. Transmission electron microscopy
Nucleation studies were made using a trans-mission electron microscope (TEM ± BS 540Tesla) with a 200 kV accelerating voltage. Me-chanically thinned samples of crystallized glasseswere dimple-ground, followed by ion-beam thin-ning to electron transparency for TEM analysis.The onset of crystal growth was determinedthrough electron di�raction. The elemental com-position of the particles present at the center of thecrystals and the glass matrix were determined us-ing an EDX Link system coupled to the electronmicroscope.
2.6. Micro-Raman spectroscopy
Identi®cation of the crystalline phases in thebulk and on the crystallized surface layer wascarried out by l-Raman spectroscopy. Ramanspectra were obtained with a Dilor XY spectrom-eter. The microscope lens used (Olympus, MSPlan, 100X, NA � 0.95) allows for the formationof a focal cylinder having an approximate diame-ter of 1.2 lm and a depth of around 2.5 lm. Thefocal cylinder was positioned on the crystal fromwhich the spectrum would be obtained. The 514.5nm (green) line of a Coherent Innova 70-2 Argonion laser, with output power of about 100 mWexciting radiation, was used. An interference ®lterwas used to avoid spurious scattered light from thelaser plasma lines. The spectra were obtained inthe backscattering geometry.
2.7. Flexural strength measurements
The ¯exural strength of the glass and glass-ce-ramics was measured using the room temperature3-point test. Five measurements were taken for
each sample, employing an Instron Machine,Model 1117, with a crosshead speed of 0.5 mm/min.
2.8. Microhardness measurements
Vickers microhardness was measured (FM-Future Tech Corporation). The samples were in-dented with a 50 g load for 10 s. The data wereevaluated from an average of 10 indentations foreach sample.
2.9. Chemical durability
Grained glass and glass-ceramic samples, withsizes ranging from 0.4 to 0.5 mm, were used ac-cording to a standard procedure described in Ref.[7], in which about 2 g samples were heat-treated at95°C for 1 h in a 0.01M HCl.
3. Results
3.1. DSC analysis
Samples having di�erent speci®c surface areawere studied by DSC to determine the crystalli-zation mechanism (surface or volume crystalliza-tion) of the glass. Fig. 1 shows the curves for ®nely(<74 lm) and coarsely (177±297 lm) powderedglass. The related data are listed in Table 2. Theglass-transition temperature, Tg, was determinedas the point of intersection of the straight-linesextending from the tangents of the DSC curves inthe region of the baseline shift. Some similar fea-tures of each thermogram are apparent: (a) a re-versible endothermic peak at about 742°C,corresponding to the glass-transition temperature,Tg; (b) two exothermic events with maxima in therange of 920±1045°C, indicating crystallization,Tc; (c) two endothermic events at about 1280±1315°C, involving the melting of some crystalphases, Tm.
The increase in the speci®c area does not a�ectthe glass-transition temperature, whereas thecrystallization peak maxima shift towards lowertemperatures with decreasing particle size. A dif-ference of about 26°C between the crystallization
66 C. Fredericci et al. / Journal of Non-Crystalline Solids 273 (2000) 64±75
of the coarse and ®ne powders was observed forthe ®rst crystallization peak.
3.2. Crystalline phases
The exothermic peaks in the DSC curves wereidenti®ed using XRD di�raction patterns. Finelypowdered samples (<74 lm) were heat-treated attemperatures corresponding to the maximum peaktemperature of the DSC curves, i.e., 920°C and1000°C, respectively.
Fig. 2(a) shows that the ®rst crystalline phase ismerwinite. Two crystalline phases can be observedin Fig. 2(b), i.e., melilite and larnite (as a minorphase) but no merwinite. These results indicatedthat the ®rst peak observed in the DSC curve isassociated with the crystallization of a metastablephase, namely, merwinite.
According to Kalinina and Filipovich [8],metastable crystalline phases commonly precipi-tate in multicomponent glasses at the initial stagesof low temperature (�Tg) crystallization. Upon
further heating, these metastable phases irrevers-ibly disappear by becoming transformed into thethermodynamically stable phase corresponding tothe phase diagram of the system. The major con-stituents of the slag glass are CaO, SiO2, Al2O3
and MgO and its composition lies around the 10%Al2O3 of the CaO±SiO2±Al2O3±MgO system(Fig. 3) which corresponds to the primary ®eld ofmelilite. A probable interpretation of the forma-tion of larnite (Ca2SiO4) is that the slag composi-tion has more SiO2 and CaO than is necessary toform 2CaO�MgO�2SiO2 (akermanite) and 2CaO�Al2O3�SiO2 (gehlenite), a series known as melilite.The excess of CaO and SiO2 are then su�cient toform a calcium silicate.
As-quenched glass samples heat-treated at893°C for 2 h (i.e. between Tg and Tc) showedradially distributed needle-like crystals forming
Fig. 2. X-ray patterns of the powdered sample heat-treated at:
(a) 1000°C; (b) 926°C.
Fig. 1. DSC curves of the powdered glass samples. Heating
rate: 20°C/min.
Table 2
DCS analysis, where Tg is the glass-transition temperature, Tc1 and Tc2 the maxima crystallization peak temperatures, Tm1 and Tm2 are
C. Fredericci et al. / Journal of Non-Crystalline Solids 273 (2000) 64±75 67
spherulitic crystals and a crystalline surface layer(Fig. 4). Fig. 5 shows the micro-Raman spectraobtained from the glass matrix, from the spheru-
litic crystal, and the crystalline surface layer. Aspectrum of a natural merwinite from Bulgaria isalso presented in Fig. 5 to facilitate the interpre-tation of the results. The Raman spectrum ofmerwinite is consistent with that obtained by Pi-riou and MacMillan [10]. The bands at 852 and817 cmÿ1 correspond to the modes derived fromsymmetric t1 and asymmetric t3 stretching vibra-tions of the SiO4 tetrahedra of the monticellite[10]. This phase was de®ned by XRD to be animpurity in the natural merwinite.
A band at 880 cmÿ1 in the Raman spectrum ofthe glass is observed in Fig. 5(a). This peak is at-tributed to the presence of an appreciable numberof non-bridging SiO4ÿ
4 groups in the glass network[11]. Piriou and McMillan [10] studied the vibra-tional spectra of vitreous CaMgSiO4 and suggest-ed that part of the bands at 530 and 580 cmÿ1
might be due to MgO vibrations; however, theirassumption was not con®rmed. A comparison ofthe 5b, 5c, and 5d spectra reveals that the crys-talline phase, which forms the spherulite, and thecrystalline layer is merwinite. Although, the bands
Fig. 4. Optical micrograph of the slag glass sample heat-treated at 893°C for 30 min.
Fig. 3. Phase Diagram of the CaO±SiO2±Al2O3±MgO system
with 10 wt% Al2O3 [9]. Point A gives an approximate indication
of the composition of the glass.
68 C. Fredericci et al. / Journal of Non-Crystalline Solids 273 (2000) 64±75
of the crystal precipitated from the glass aresmaller and wider than that of the mineral, theirmaxima match closely. In Raman spectroscopy,the width of the bands is determined by structuralordering of the material. The broader bands of thecrystals in the glass compared to the bands of themineral indicate some disorder at Si or Al sites.This feature may be related to the residual glass
between the radially distributed needles formingthe spherulitic crystal.
Orsini et al. [12] studied glass crystallizationin the akermanite±gehlenite system (2CaO �(1)x)MgO � xAl2O3 � (2)x)SiO2) and found merw-inite as a metastable phase when x6 0:6. Theyreport that glasses with melilite compositions areconsidered to be inverted glasses due the largenumber of modifying oxides and have a veryfragmented lattice, stabilized by ionic bonds be-tween the modifying cations and simple SiO4ÿ
4
units. It was suggested that, in glasses with x < 0:6,the fraction of simple tetrahedra and the MgOconcentration were su�cient to form merwinite(Ca3Mg(SiO4)2).
The crystallization of merwinite causes exsolu-tion of Al3�, resulting in a glass rich in Al2O3 be-tween the merwinite needles that is probably moreviscous than the original glass. For the formationof melilite, therefore, longer times and highertemperatures would be necessary for the AlO4
tetrahedra di�usion, since the melilite structureconsists of MgO4, SiO4 and AlO4 tetrahedra sheets[13].
Fig. 6 shows an optical micrograph of a sampleheat-treated at 893°C for 22 h. It is possible thatthe spherulite undergoes a phase transformation
Fig. 6. Optical micrograph of the slag glass sample heat-treated at 893°C for 22 h.
crystalline surface layer and spherulitic crystal, respectively,
shown in Fig. 4; (d) natural merwinite.
C. Fredericci et al. / Journal of Non-Crystalline Solids 273 (2000) 64±75 69
starting at its center. Raman microprobe spectrameasurements were taken on the spherulitic crystalin this region (Fig. 7). Since no Raman spectrumof melilite was found in the literature, a pattern ofone natural melilite from Russia was reproducedand is also shown in Fig. 7. As mentioned earlier,melilite is a solid solution between akermanite andgehlenite. The Raman spectra of the both crys-talline phases can be found in Refs. [11,14], re-spectively. The melilite spectrum is not exactly asum of these spectra. The absence of some char-acteristic crystalline gehlenite and akermanitebands in the melilite spectrum can be explained bymodi®cations of the interatomic distances andbond angles in the melilite solid solution, makingsome Raman vibrational modes inactive. Howev-er, the strongest gehlenite band, at 626 cmÿ1,corresponding to asymmetrical stretching mode (ts
(T±O±T), where T � Al or Si) of the bridgingoxygen and the strongest akermanite band at 661cmÿ1 corresponding to the ts (Si±O±Si) can befound in the melilite spectrum.
Other aspects of Fig. 7(a) that require discus-sion are the presence of a band at 973 cmÿ1, whichwas not observed in the spectrum of the naturalmelilite, and the high intensity of the bands at 855and 842 cmÿ1 in relation to those found in themelilite pattern. Reynard et al. [15] studied thehigh-pressure transformation of larnite. They re-port a Raman spectrum of larnite that corresponds
to a partial transformation of b-Ca2SiO4 toc-Ca2SiO4. Bands at 973, 855 and 842 cmÿ1 werefound in this spectrum that coincide with thosefound in this work. It is known that larnite crys-tallizes as the a- or b-phase at high temperaturesand that the b-phase inverts to c-phase at 675°Cwith increased volume [16]. The sample used forthe Raman spectroscopy study was heat-treated at893°C for 22 h, removed from the furnace andcooled in air. It is possible that cooling occurredfast enough to avoid completion of phase trans-formation.
A comparison of the spectra reveals thatthe crystalline phases developed in the center ofthe spherulites were melilite and larnite, while thephase corresponding to spherulitic crystals ismerwinite. These data con®rm that merwinite is ametastable phase in this system and are consistentwith those found by XRD.
3.3. Kinetics of nucleation
As-quenched glass samples were heat-treated at750°C, 770°C and 790°C for 2, 4, 6 and 8 h fornucleation, followed by heat treatment at 893°Cfor 30 min for crystal growth. The samples werepolished and the number of crystals per unit vol-ume determined, as described in Section 2.4.
Fig. 8 shows the numbers of crystals versus timeof heat treatment of the glass samples at di�erenttemperatures. The related data are shown inTable 3. There is a statistical scatter around amean Nv � 13 crystals/mm3 and Nv does not de-pend on the heat treatment time, indicating thatcrystallization occurs from a ®xed number of sites.This result is typical of heterogeneous nucleation.
3.4. Nucleation mechanism
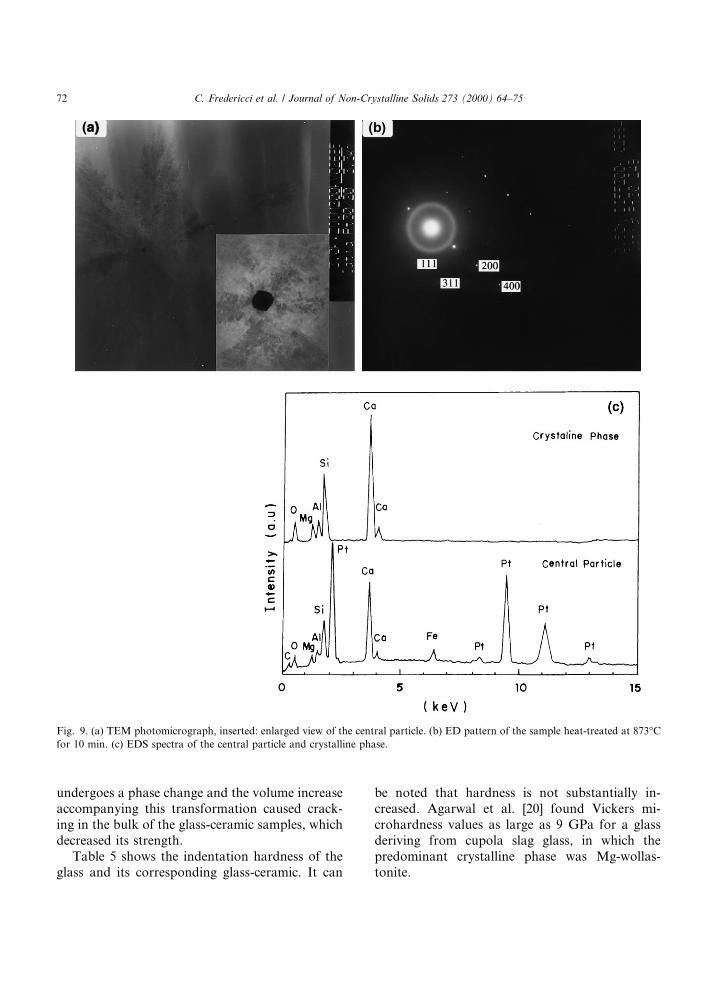
The TEM micrograph of a sample heat treatedat 873°C for 10 min, used in the crystal growthstudy, shows a particle in the crystal center (Fig. 9).This particle was identi®ed as Pt3Fe by EDS andselected area di�raction (SAD-TEM). Fig. 10(c)shows the EDS spectra of the central particle andof the crystalline phase. Although the slag com-position contains iron, this particle containedlarger amounts of Fe as well as Pt that was not
Fig. 7. Raman microprobe spectra of: (a) center of the
spherulitic crystal shown in Fig. 6; (b) natural melilite.
70 C. Fredericci et al. / Journal of Non-Crystalline Solids 273 (2000) 64±75
observed in the EDS spectrum of the crystallinephase. Indexing of the electron di�raction pattern,described by Beenston et al. [17], was comparedwith a simulation performed by our software.Table 4 shows the comparison of d-spacings ofPt3Fe from JCPDS with that obtained from ED inthis work. The d-spacings match. Hence, the Pt3Feparticles were assumed to act as a heterogeneousnucleating agent in the crystallization of the glass.It is known that platinum and iron form alloys athigh temperature [18] and, despite our e�orts toeliminate the slagÕs iron prior to melting, somemetallic iron remained in our samples.
3.5. Crystal growth
Fig. 10 shows merwinite growth velocity, U,determined by measuring the largest diameter ofthe spherulites as a function of time and temper-ature. At large undercoolings, below the maximaof growth rates, crystal growth velocity can bewritten as U � fa0mexp�ÿDGD=RT �, where DGD isthe activation energy for di�usion across theboundary, f the fraction of sites of the crystalsurface available for attachment, a0 the thicknessper molecular layer, m the vibrational frequency, Rthe gas constant, T is the absolute temperature.Neglecting pressure e�ects, DGD � DHDTDSD andexpressing A � fa0mexp�DSD=R), the equation ofcrystal growth rate can be written as:U � A exp�ÿDHD=RT ), where DHD is the activa-tion enthalpy for crystal growth [19]. A plot of lnU versus 1/T, in these conditions, should yield astraight line with slope proportional to DHD. Wedetermined from Fig. 11 that the activation energyfor merwinite growth is 150 kJ/mol. Orsini et al.[12] determined the activation energy for merwi-nite growth, by a DTA method, as being165 kcal/mol in a glass with composition 2CaO �(1)x)MgO � xAl2O3 (2)x)SiO2, where 06 x6 1.
3.6. Mechanical and chemical properties
Flexural strength, Vickers hardness and chem-ical durability were investigated to determine otherproperties of the resulting glass-ceramic. The re-sults for the glass and a glass-ceramic sample heattreated at 1000°C for 1 h are given in Table 5.XRD di�raction data showed that the crystallinephases were melilite and larnite. Crystallizationyielded a material having a smaller ¯exuralstrength than that of the glass samples. Larnite
Table 4
XRD and ED data of Pt3Fe from the slag glass
JCPDS (29±716) This work
hkl d (�A) d (�A)
111 2.23 2.23
311 1.16 1.12
200 1.93 1.90
400 0.97 0.93
Fig. 8. Average number of merwinite crystals per mm3 on the
slag glass sample after heat treatment at di�erent times and
temperatures.
Table 3
Number of crystals per unit volume (Nv) for di�erent thermal
treatments
Temperature (°C) Time (h) Nv (crystals per mm3)
750 2 5 � 3
4 11 � 7
6 4 � 2
8 11 � 5
770 2 16 � 9
4 6 � 3
6 7 � 3
8 15 � 7
790 2 21 � 15
4 8 � 5
6 5 � 3
8 13 � 7
C. Fredericci et al. / Journal of Non-Crystalline Solids 273 (2000) 64±75 71
undergoes a phase change and the volume increaseaccompanying this transformation caused crack-ing in the bulk of the glass-ceramic samples, whichdecreased its strength.
Table 5 shows the indentation hardness of theglass and its corresponding glass-ceramic. It can
be noted that hardness is not substantially in-creased. Agarwal et al. [20] found Vickers mi-crohardness values as large as 9 GPa for a glassderiving from cupola slag glass, in which thepredominant crystalline phase was Mg-wollas-tonite.
Fig. 9. (a) TEM photomicrograph, inserted: enlarged view of the central particle. (b) ED pattern of the sample heat-treated at 873°C
for 10 min. (c) EDS spectra of the central particle and crystalline phase.
72 C. Fredericci et al. / Journal of Non-Crystalline Solids 273 (2000) 64±75
The results of the chemical durability test of theglass and glass-ceramic are also shown in Table 5.The method used in this work was the same as thatused by Karamanov et al. [7] with the purpose ofcomparing the results, particularly as they studiedglass-ceramics from waste raw materials. Theyfound 0.3 wt% loss for one glass-ceramic, in whichthe major crystalline phase was diopside and a 1.4wt% loss from a glass-ceramic containing wollas-tonite as the principal phase. They reported thatthe chemical durability of these materials is high.Kruchnin [21] reported that melilite glass-ceramicsare highly acid resistant. In this research work,values of about 1.2 wt% loss for the glass andglass-ceramic containing melilite and larnite werefound.
4. Discussion of nucleation mechanism
In the DSC curve (Fig. 1) a di�erence of about26°C between the crystallization of the coarse and®ne powders was observed for the ®rst crystalli-zation peak. According to Takur [22], in the caseof high-catalyzed volume crystallization of glass,the di�erence between the exothermic peak tem-perature of a coarse and ®ne particle should besmall or, ideally, nil. Hence, the shift of the exo-thermic peak to a lower temperature with the
decrease of the glass particle size suggests thatcrystallization occurs essentially on the surface andthat volume crystallization is either low or absent.This was con®rmed in the nucleation kineticsstudy (Section 3.3) since the numbers of crystalsper unit volume Nv lay around 13 crystals permm3.
An optical micrograph of one glass sample heattreated at 893°C for 30 min shows a spheruliticcrystal and the crystalline surface layer (Fig. 4).The number of crystals was so small that spheru-lites as large as 480 lm could be observed afterheat treatment at 923°C for 30 min (Fig. 12).Therefore, the results of the kinetics study are inagreement with those of DSC.
TEM study of heat-treated glass samplesshowed the presence of Pt3Fe particles consideredto act as heterogeneous nucleating agent. Agarwalet al. [23] studied the crystallization of a cupolaslag glass with the following approximate com-position: 42% SiO2, 34% CaO, 11% MgO, 8%
Fig. 10. Largest merwinite crystal diameter in the volume of the
slag glass at 873°C, 883°C, 893°C, 923°C.
Fig. 11. Ln U versus 1/T.
Table 5
Glass and glass-ceramic properties
Properties Glass Glass-Ceramic
Flexural strength
(MPa)
100� 20 69� 9
Vickers hardness
(GPa)
5:2� 0:4 5:5� 0:1
Chemical resistance
(wt% loss in 0.01M
HCl)
1:2� 0:1 1:3� 0:05
C. Fredericci et al. / Journal of Non-Crystalline Solids 273 (2000) 64±75 73
Al2O3, 3% MnO and impurities such as iron oxide,titanium oxide, sulfur oxides, etc. They found, byTEM, that the as-quenched glass contained iron,manganese and sulfur droplets and suggested thatcomplex-wollastonite crystals grew from them.These kinds of particles were not found in oursamples.
5. Conclusions
This study shows that the blast-furnace slagfrom CSN can be melted and formed into a glass,undergoing both surface and volume crystalliza-tion upon heating. However, internal crystalliza-tion is only possible due the formation of Pt3Feduring melting in a Pt crucible. Melilite was thepredominant phase, with a small content of larniteand merwinite, which was demonstrated to bemetastable. Based on the variation in the DSCpeak temperature, monitored as a function of theparticle size of the glass, we suggested that mostcrystallization was on surfaces. This suggestionwas con®rmed by the study of nucleation kinetics.
It is possible to produce glass-ceramics withthis slag. However, owing to the phase transfor-mation of larnite, the ¯exural strength is inferiorto that obtained for glass-ceramics used in thecivil construction industry. Further work is re-quired to improve the properties of these glass-ceramics.
Acknowledgements
The authors thank Professor Dr Marcos A.Pimenta and Professor Dr Maria S.S. Dantas(Physics Department±Federal University ofMinas Gerais, Brazil) for the micro-Ramanmeasurements, the Erd and Mensch Museum ofBulgaria and Dr Ralf Keding of Otto SchottInstitut ± Friedrich Schiller Universit�at (FSU)for the donation of natural melilite and merwi-nite, Thomas H�oche of FSU for TEM micro-graphs and the Brazilian institutions CNPq,FAPESP and PRONEX for their ®nancialsupport.
Fig. 12. Optical micrograph of the slag glass sample heat-treated at 923°C for 30 min.
74 C. Fredericci et al. / Journal of Non-Crystalline Solids 273 (2000) 64±75