Crystallization Operations CHARLES G. MOVERS, JR. Union Carbide Corporation South Charleston, West Virginia RONALD W. ROUSSEAU School of Chemical Engineering Georgia Institute of Technology Atlanta, Georgia 11.1 INTRODUCTORYCOMMENTS Crystallization is employed heavily as a separation process in the inorganic chemical industry, particularly where salts are recovered from aqueous media. In production of organic chemicals, crystallization is also used to recover product, to refine intermediate chemicals and to remove undesired salts. The feed to a crystallization system consists of a solution from which solute is crystallized (or precipitated) via one or more of a variety of processes. The solids are normally separated from the crystallizer liquid, washed, and discharged to downstream equipment for additional treatment. High recovery of refined solute is generally the desired design objective, although sometimes the crystalline product is a residue. The process of forming a solid phase from solution is termed crystallization, and the operation occurs in a vessel called a crystallizer. A crystallizer provides residence time for the process streams to approach equilibrium, possibly a capability of selectively removing fines or coarse product, a mixing or contacting regime to give uniform crystal growth, and may include provision for addition or removal of heat. Crystallization is distinguished from other unit operations in that a solid phase is generated. The solid phase is characterized in part by its inherent shape (habit) and size distribution. The natural habit of the solid phase is important since it influences product purity, yield, and capacity of the crystallizer system. 11.1-1 Advantages and Disadvantages Crystallization offers the following advantages: 1. Pure product (solute) can be recovered in one separation stage. With care in design, product purity greater than 99.0% can be attained in a single stage of crystallization, separation, and washing. 2. A solid phase is formed that is subdivided into discrete particles. Generally, conditions are controlled so that the crystals have the desired physical form for direct packaging and sale. The major disadvantages of crystallization are: 1. Purification of more than one component is not normally attainable in one stage. CHAPTER 1 I
Transcript
C r y s t a l l i z a t i o n O p e r a t i o n s
CHARLES G. MOVERS, JR.Union Carbide CorporationSouth Charleston, West Virginia
RONALD W. ROUSSEAUSchool of Chemical EngineeringGeorgia Institute of TechnologyAtlanta, Georgia
11.1 INTRODUCTORYCOMMENTS
Crystallization is employed heavily as a separation process in the inorganic chemical industry, particularlywhere salts are recovered from aqueous media. In production of organic chemicals, crystallization is alsoused to recover product, to refine intermediate chemicals and to remove undesired salts. The feed to acrystallization system consists of a solution from which solute is crystallized (or precipitated) via one ormore of a variety of processes. The solids are normally separated from the crystallizer liquid, washed, anddischarged to downstream equipment for additional treatment. High recovery of refined solute is generallythe desired design objective, although sometimes the crystalline product is a residue.
The process of forming a solid phase from solution is termed crystallization, and the operation occursin a vessel called a crystallizer. A crystallizer provides residence time for the process streams to approachequilibrium, possibly a capability of selectively removing fines or coarse product, a mixing or contactingregime to give uniform crystal growth, and may include provision for addition or removal of heat.
Crystallization is distinguished from other unit operations in that a solid phase is generated. The solidphase is characterized in part by its inherent shape (habit) and size distribution. The natural habit of thesolid phase is important since it influences product purity, yield, and capacity of the crystallizer system.
11.1-1 Advantages and Disadvantages
Crystallization offers the following advantages:
1. Pure product (solute) can be recovered in one separation stage. With care in design, product puritygreater than 99.0% can be attained in a single stage of crystallization, separation, and washing.
2. A solid phase is formed that is subdivided into discrete particles. Generally, conditions are controlledso that the crystals have the desired physical form for direct packaging and sale.
The major disadvantages of crystallization are:
1. Purification of more than one component is not normally attainable in one stage.
C H A P T E R 1 I
2. The phase behavior of crystallizing systems prohibits full solute recovery in one stage; thus, theuse of additional equipment to remove solute completely from the remaining crystallizer solutionis necessary.
Since crystallization involves processing and handling of a solid phase, the operation is normally appliedwhen no alternative separation technique is discernible. The choice of crystallization over, say, distillationas the preferred separation technique may hinge on one or more of the following considerations:
1. Solute is heat sensitive and/or a high boiler and decomposes at temperatures required to conductdistillation.
2. Low or nil relative volatility exists between solute and contaminants and/or azeotropes formedbetween solute and contaminants.
3. Solute (product) is desired in paniculate form. For example, if solute can be purified via distillationthen it must be solidified subsequently by flaking or prilling and crystallization may be a moreconvenient scheme to employ in such cases.
4. Comparative economics favor crystallization. If distillation requires high temperatures and energyusage, crystallization may offer economic incentives.
Crystallization is frequently the initial step in a solids processing sequence, similar to that shown inFig. 11.1-1, that subsequently includes solid-liquid separation and drying equipment. Since product size
and suspended solids concentration are controlled, to a large extent, in the crystallizer, predictable andreliable crystallizer performance is essential for smooth operation of the downstream system.
11.1-2 Crystallization Terminology
Binary eutectic. The location on the phase diagram at which simultaneous crystallization of solvent andsolute occurs.
Brodie purifier. A specific type of continuous melt crystallizer.Crystal habit. The external crystal shape that results from different rates of growth of the various crystal
faces.Crystallization kinetics. Expressions that describe crystal growth and nucleation rates from solution.CSD. Crystal size distribution.Desupersaturation time. The average time that solution in a crystallizer vessel has to deposit solute
before entering the zone where supersaturation is created.Draft tube. A device inserted in a crystallizer to induce a uniform axial flow pattern inside a crystallizer.Drawdown time. The time to empty the contents of a crystallizer if the feed is stopped and product is
removed at the normal rate.DTB. Draft tube baffle—a crystallizer that contains a draft tube and an internal baffle to provide a crystal
settling zone.
Elutriation leg. A settling leg in a crystallizer that classifies and washes the crystals leaving the vessel
by addition of upflow liquid (usually the feed).
Fines removal system. System designed to increase particle size by preferential removal and subsequent
destruction of smaller-size crystals.Forced circulation crystallization. Continuous crystallizer in which agitation inside the vessel is created
by external circulation of large quantities of liquid through a heater or cooler.Heterogeneous nucleation. Nucleation induced by foreign matter in a supersaturated liquid.Homogeneous nucleation. Spontaneous nucleation caused by supersaturation only.ICT. Initial crystallization temperature.Labile zone. Zone on concentration-temperature diagram in which spontaneous homogeneous or heter-
ogeneous nucleation of the solid phase will occur.Metastable zone. Zone on concentration-temperature diagram in which homogeneous or heterogeneous
nucleation will not immediately occur but in which crystal growth will occur.MSMPR. Mixed-suspension mixed-product removal crystallizer.Population density. A number density function frequently described as number of crystals per unit volume
of clear liquor (or slurry) per size increment (number/cm3-/Am).Product classification. Classification device that removes large product crystals and returns smaller crys-
tals to the crystallizer.Secondary nucleation. Nucleation of a supersaturated liquid caused directly or indirectly by the presence
of crystals of the same species as the solute.Solid solution. Mixed crystals formed when isomorphous substances crystallize together out of a solution.Supersaturation. The departure from solution saturation usually caused by cooling of the mixture and/
or by evaporating solvent.Understanding the concept of supersaturation is necessary when discussing crystallization rate processes.
Most liquids sustain a certain level of subcooling depending on the rate of cooling, temperature, and degreeof agitation. Often a clear solution can be slowly subcooled several degrees below its equilibrium temper-ature before a profusion of nuclei appear. A diagram describing this phenomena is shown in Fig. 11.1-2.Feed A is cooled to temperature TD. Thus, feed is subcooled by (TB - TD) degrees or has (TB - TD)degrees of supersaturation. The temperature where nuclei first appear (Tc), defines the metastable limit.Inside the temperature range from Tc to TB crystals grow, but spontaneous nucleation will not occurimmediately. In the labile zone (temperatures less than Tc) crystal growth and secondary nuclei formationoccur simultaneously, and both rate processes are competing for available solute. Crystallizers are designedmost commonly to control supersaturation at low levels to minimize nucleation, especially by homogeneousor heterogeneous mechanisms.
11.2 FUNDAMENTALS
Final design of a crystallizer is the culmination of the design strategy depicted in Fig. 11.2-1. In theconceptual design stage, equilibrium data and operating mode (the method by which supersaturation is
Supersaturatedregion
(Metastablezone)
Feed
Supersaturatedregion
(Labile zone)
Unsaturatedzone
Conc
entra
tion
TemperatureFIGURE 11.1-2 Depiction of supersaturation. The metastable limit is a function of the rate of cooling,temperature, impurities, degree of agitation, and presence of seeds.
PHASE EQUILIBRIUM Solvent selection:Physical and thermal properties
FUNCTIONAL DESIGNDiameter, holding time, materials,auxiliary equipment, circulationrate
FIGURE 11.2-1 Process design strategy.
generated) are surveyed. Solvent choice and processing conditions are determined in this step. The type ofcrystallizer and finally the crystallizer functional design, that is, external and internal construction details,are then established. The discussion in this section is concerned primarily with generation, interpretation,and use of solid-liquid equilibrium data and the selection of operating mode.
11.2-1 Equilibria
Accurate solid-liquid equilibrium data must be obtained to evaluate the process design options for crys-tallization processes. These data are required in the earliest stages of the conceptual design phase and arenecessary for the following reasons:
1. Screening the feasibility of the potential process; that is, determining if pure solute can in fact becrystallized from the feed solution.
2. Determining the best solvent to use in the process if solution crystallization is employed.3. Establishing the temperature and/or pressure ranges of the crystallizer operation and the composition
of the residue liquor exiting the crystallizer.4. Determining the maximum recovery of solute possible. The feed composition and position of the
eutectic fix the maximum attainable solute recovery. Practical limitations such as temperature ofcooling medium, slurry concentration that can be pumped, or impurity level that can be toleratedmay restrict solute recovery.
Phase diagrams occur in many forms. A common type of diagram is the binary eutectic in which apure solid component is formed by cooling an unsaturated solution until solids appear. Continued coolingwill increase the yield of pure component. At the eutectic temperature both components solidify andadditional purification is not normally possible. A typical eutectic-forming system (naphthalene-benzene)is shown in Fig. 11.2-2:
If mixture X is cooled, crystals of benzene will form.If mixture Y is cooled, naphthalene crystals will result.Point Z indicates the position of the binary eutectic. Solid mixtures are formed at temperatures belowthis point.
A few binary systems when cooled do not deposit one of the components in a totally pure state. Instead,behavior resembles that of many vapor-liquid systems and the solid is a true solution. Figure 11.2-3 depicts
Tem
pera
ture
(0C)
m 5 -a
ft
2-Naphthol (mass fraction)FIGURE 11.2-3 Phase diagram for naphthalene-2-naphthol.
a phase diagram of naphthalene and 2-naphthol, which exhibit solid solution behavior. If the liquid mixtureof naphthalene and 2-naphthol of composition X is cooled, a mixed crystal of composition Y is formedrather than a solid containing pure 2-naphthol. This type of behavior is found in only a small fraction ofcrystallizing systems.
Figure 11.2-4 shows typical solubility diagrams for solutions of various salts in water. The curve forsalt (NaCl) is nearly vertical, which indicates little effect of temperature on solubility. The sodium sulfatecurve shows reverse solubility as temperature increases; thus, sodium sulfate has a tendency to coat heat-exchanger surfaces where heat is added to saturated solutions of this system.
Often solid-liquid equilibrium data are not available for the system of interest, and experimental de-termination of the solidus-liquidus curves is required. If the system of interest is simple (i.e., two to threecomponents) and well behaved (ideal), then reliable predictive methods are available. Techniques forpredicting nonideal solid-liquid phase behavior and multicomponent equilibria are emerging.
PREDICTING SOLID-LIQUID EQUILIBRIAThe extent to which solids can dissolve in liquids varies enormously; in some cases a solid solute mayform a highly concentrated solution and in others the solubility is barely detectable. Some of the principles
Tem
pera
ture
(0C)
TEMP
ERAT
URE(
°C)
FIGURE 11.2-4 Solubility data for salt systems.
v1
v1
that govern equilibrium between a solid phase and a liquid phase are discussed in this section. In manysituations reliable predictive techniques are available to estimate binary and multicomponent solubilitybehavior, and several of these approaches also are discussed.
FRAMEWORKThe fundamental relationship for equilibrium to exist between two phases (where the solute is designatedby subscript 2) is
fzipuTc solid) = ^(solute in solution) (11.2-1)
or
/2(pure solid) - 72*2/2 (11.2-2)
where /2 is the fugacity, x2 is the solubility (mole fraction) of the solute in the solvent, y2 is the liquidphase activity coefficient, and/f is the reference-state fugacity to which y2 refers. The solubility can thenbe defined as
(11.2-3)
Thus, the solubility depends on the activity coefficient and the ratio of two fugacities. It is convenientto define the reference-state fugacity (of solute) as the fugacity of pure, subcooled liquid at the temperatureof the solution. As derived elsewhere1 the pure fugacity ratio can be calculated from
where Ahf is the enthalpy of fusion, TM is the melting temperature of pure substance 2, and T is the systemtemperature. Correction terms associated with differences between the heat capacities of the liquid and solidare neglected.
If Eq. (11.2-4) is substituted into (11.2-3) the solubility relationship becomes
(11.2-5)
If the solution is assumed to be ideal, then y2 = 1.0 and Eq. (11.2-5) becomes
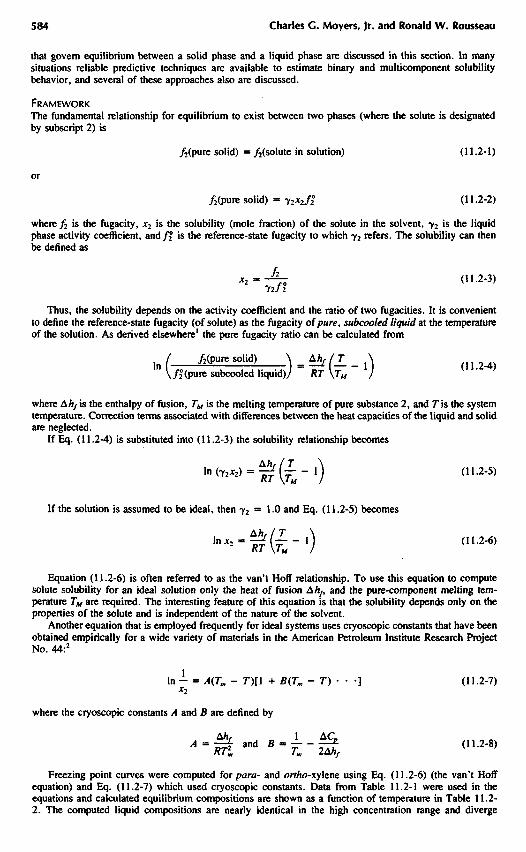
(11.2-6)
Equation (11.2-6) is often referred to as the van't Hoff relationship. To use this equation to computesolute solubility for an ideal solution only the heat of fusion Ahf, and the pure-component melting tem-perature TM are required. The interesting feature of this equation is that the solubility depends only on theproperties of the solute and is independent of the nature of the solvent.
Another equation that is employed frequently for ideal systems uses cryoscopic constants that have beenobtained empirically for a wide variety of materials in the American Petroleum Institute Research ProjectNo. 44:2
(11.2-7)
where the cryoscopic constants A and B are defined by
(11.2-8)
Freezing point curves were computed for para- and <?r//i0-xylene using Eq. (11.2-6) (the van't Hoffequation) and Eq. (11.2-7) which used cryoscopic constants. Data from Table 11.2-1 were used in theequations and calculated equilibrium compositions are shown as a function of temperature in Table 11.2-2. The computed liquid compositions are nearly identical in the high concentration range and diverge
TABLE 11.2-1 Data Used for Freezing-Point CurveCalculations
slightly in the dilute regime. Figure 11.2-5 is a plot of freezing-point depression curves for mixtures ofxylene isomers. The binary eutectic temperature for para and ortho isomers is about 236.3K. This is thetemperature at which both components solidify together. Thus, the mole fraction of ortho-xylzne in solutionplus the mole fraction of para-xylene must equal 1 at the eutectic {xo + xp = 1.0). This condition alsofixes the eutectic temperature for multicomponent systems. The ternary eutectic temperature for a mixtureof xylene isomers is determined by finding the common freezing point at which the sum of the molefractions of mixed isomers in solution equals 1 (JC,, + xp + xm = 1.0). The eutectic conditions for the threexylene isomer binaries are indicated in Fig. 11.2-5. The ternary eutectic is also indicated.
Determination of eutectic points is important since yield of a desired component is limited by theposition of the eutectic. The above procedures give accurate predictions of eutectic points in ideal binaryand multicomponent systems and are frequently sufficient for preliminary evaluation of a crystallizationsystem. For the final design of a commercial system, experimental verification of the eutectic is advisable.
For nonideal systems a number of approaches are available. The method to use in a specific case maydepend on the availability of thermodynamic parameters necessary to perform the specific calculation. Someof the methods are direct and others require iterative techniques best relegated to computers. Activitycoefficients for solid-solubility calculations can often be estimated directly from vapor-liquid equilibriumdata obtained at higher temperatures. Experimental vapor-liquid equilibrium data frequently are easier tofind than solid-liquid equilibrium data; thus, this approach provides a convenient technique for conductingpreliminary design calculations to determine the feasibility of a given process. Data are correlated using asemiempirical equation, such as the Wilson equation, whose characteristic binary parameters are extrapo-lated with respect to temperature. Muir and Howat3 have reported the results of using this technique forseveral ideal and nonideal systems and found good agreement with experimental data. Figures 11.2-6 and11.2-7 compare predicted and experimental equilibrium data for acetic acid-water and caprolactam-waterbinaries. Agreement between predicted and experimental freezing points is good.
For nonpolar systems the activity coefficient can be estimated using the Hildebrand-Scatchard4 theoryof regular solutions. To calculate the activity coefficient of a dissolved solute using regular solution theory,solubility parameters must be available for the components. For many materials these parameters can becalculated and/or are available in standard engineering references.
Free
zing
tem
pera
ture
(0C) Experimental (Pickering, 1893)
Predicted
Experimental (Puffer, 1969)
Predicted
Free
zing
tem
pera
ture
(0C)
HI II
I
O1S O si 3 £
v1
A group-contribution method, called UNIFAC,5 has been developed for estimating activity coefficientsin nonelectrolyte solutions. By using this approach solubilities for several solutes in a variety of solventsmay be calculated. In many cases good agreement is obtained. The activity coefficient consists of twoparts, the combinatorial contribution, arising from differences in molecular size and shape, and the residualcontribution, arising from differences in intermolecular forces of attraction. Group interaction parametersmust be available to use this approach. Parameters are listed by Fredenslund et al.6 for many systems ofinterest.
Other approaches to the computation of solid-liquid equilibria are shown in Table 11.2-3. The Soave-Redlich-Kwong equation of state evaluates fugacities to calculate solid-liquid equilibria,7 while Wenzeland Schmidt8 developed a modified van der Waals equation of state for the representation of phase equilibria.The Wenzel-Schmidt approach generates fugacities, from which the authors developed a trial-and-errorapproach to compute solid-liquid equilibrium. Unno et al.9 recently presented a simplification of the solutionof groups model (ASOG) that allows prediction of solution equilibrium from limited vapor-liquid equilib-rium data.
Often complex liquid-solid equilibria cannot be predicted reliably, nor are data available in the literature.In this case, experimental determination of equilibrium behavior becomes necessary. Experimental datashould be obtained at conditions that allow fitting by a model so that interpolation and extrapolation arepossible.
The ASTM apparatus10 for determining freezing point is shown in Fig. 11.2-8. Freezing point isobtained from freezing or melting temperature versus time curves. Figure 11.2-9 shows a typical temper-ature-time trace from an ASTM apparatus. The freezing point can be determined from the peak of thetemperature rise during slow cooldown or from the break in the temperature-time curve during heating. ADSC (differential scanning calorimeter) can be used for freezing-point determination (as well as heat offusion) if subcooling is low. Inorganic systems usually are handled well in a DSC apparatus. If manycomponents are present, an experimental freezing-point curve can be determined by fixing the temperatureof a well-mixed slurry containing an excess of solids, allowing the system to equilibrate, and analyzingthe composition of the liquid phase. By repeating this process at successively lower temperatures a freezing-point curve can be developed.
11.2-2 Choice of Operational Mode
The technique employed to generate supersaturation in a solution is referred to as the mode of operation.The mode chosen by the designer is strongly influenced by the phase-equilibrium characteristics of thesystem, and it dictates the material and energy balance requirements of the system. The common techniquesfor producing solids (or generating supersaturation) from a solution include:
1. Lowering the temperature of the feed solution by direct or indirect cooling. If solute solubility isstrongly temperature dependent, this is the preferred approach.
2. Adding heat to the system to remove solvent and thus "salt out'* the solute. This technique iseffective if solubility is insensitive to temperature.
3. Vacuum cooling the feed solution without external heating. If solubility is strongly dependent ontemperature, this method is attractive.
4. Combining techniques. Especially common is vacuum cooling supplemented by external heatingfor systems whose solubility has an intermediate dependence on temperature.
5. Adding nonsolvent. This is a common technique for precipitating solute from solution and is usefulas both a laboratory technique and as an industrial process for product recovery.
The methods described above can be employed in single- or multistage crystallization or in batchoperations. Multistage operations are employed where evaporative requirements exceed the capabilities ofa single vessel and/or energy costs dictate staging of the operation. Sometimes, staging is useful to produceuniform and/or larger crystals. Operation of crystallizers in series generates crystal size distributions havinga narrower size spread than the same volume of crystallizers in parallel. Crystal growth kinetics usuallyare favored at higher temperatures, so if the first stage of a two-stage crystallization system is operated ata higher temperature, the overall CSD is enhanced. Batch crystallizers produce a narrower CSD thancontinuous well-mixed units. For capacity requirements less than 500 kg/h, batch crystallization is oftenmore economical. If highly uniform crystals are required, which is the case for sugar, then batch operationoffers advantages. Table 11.2-4 compares the operational characteristics of several common modes ofcrystallization. Both advantages and disadvantages are indicated.
11.2-3 Crystallization Kinetics
The kinetic phenomena that influence crystal size distributions are nucleation and growth. The driving forcefor both these phenomena is supersaturation, and at some levels of supersaturation, both nucleation andgrowth occur and compete for available solute. The purpose of the present discussion is to summarize key
v1
ReferencesParameters RequiredApproachSystem
Prausnitz1
API Project No. 442
Muir and Howat3
Hildebrand and Scott4
Gmehling et al.5
Unno et al.9
Wenzel and Schmidt8
Soave7
Vapor-liquid equilibrium dataSolubility parametersGroup interaction parametersVapor-liquid equilibrium dataEquation of state parameters
TABLE 11.2-3 Predictive Methods for Solid-Liquid Equilibria
FIGURE 11.2-8 Apparatus for freezing-point determination.
aspects regarding the kinetics of crystal nucleation and growth and to indicate the process variables thatare likely to affect each.
It is obvious that supersaturation is a key variable in setting nucleation and growth rates and, as willbe shown in the following discussion, the dependence of these rates on supersaturation is affected by themechanism through which the process is occurring. This is made plain in Fig. 11.2-10, which shows theinfluence of supersaturation on nucleation and growth. The key aspects in this figure are the qualitativerelationships of the two forms of nucleation to growth and to each other: growth rate and secondarynucleation kinetics are low-order (shown as linear) functions of supersaturation, while primary nucleation
DRIVING ARM
DRIVING ROD
STIRRERTEMPERATURE - MEASURING DEVICE
STOPPERED HOLE FOR "SEEDING"
FREEZING TUBE, 200 mL CAPACITY
SAMPLE
COOLING BATH
Meltingpoint
Freezingpoint
Tem
pera
ture
-n m 8 I" I
Operational Characteristics: Feed enters at higher saturation temperature than is maintained in the crys-tallizer and is cooled in shell-and-tube or scraped-surface exchangers to remove sensible heat and heat ofcrystallization. Solids encrustation problems are generally confined to the cooling surfaces.
Advantages: Operation and control is simple. No vacuum equipment is necessary. Slurry density andproduct recovery are fixed by the feed composition and by the temperature maintained in the crystallizerbody.
Disadvantages: Care must be taken to prevent fouling of the cooling surfaces by maintaining low process-to-coolant temperature differences across cooling surfaces. If severe fouling is anticipated, scraped-surfaceheat exchangers may be necessary to assure reliable operation.
Mode 2. Evaporative Cooling Crystallization
TABLE 11.2-4 Features of Crystallization Mode
Mode 1. Indirect Cooling Crystallization
Feed
Coolant
Product
Coolant
Vacuum
Condensate
Feed
Product
Operational Characteristics: Feed enters at higher saturation temperature than is maintained in the crys-tallizer body. Crystallizer temperature, product recovery, and slurry density are regulated by vacuumcontrol. Heat of crystallization and the sensible heat of the feed are removed by evaporation and conden-sation of solvent. The condensate may either be removed or a portion or all returned.
Advantages: No heater is required in this mode of operation, and condensate can be returned to washdown walls to control the formation of encrustations.
TABLE 11.2-4 (Continued)
Disadvantages: Slurry concentration and product yield are fixed by material and energy balance con-straints.
Mode 3. Cooling and Salting Out Crystallization
Coolant
Vacuum
Feed
Steam
Product •
Condensate
Operational Characteristics: The feed stream saturation temperature is higher than that maintained inthe crystallizer body; thus, adiabatic cooling occurs. Also, external heat is added to evaporate solvent andprecipitate additional solute.
Advantages: Slurry density and yield can be controlled to some degree by adjustment of external heatinput.
Disadvantages: An external (or internal) heat exchanger and a vacuum system are required. Fouling atvapor release surfaces is common.
Mode 4. Salting Out Crystallization (Addition of Nonsolvent)
Coolant
Vacuum
CondensateFeed
Nonsolventfeed
Product
Operational Characteristics: Crystallizer temperature is controlled by vacuum level and ratio of nonsol-vent to feed. A reflux condenser normally is used to remove heat by condensing the solvent.
Advantages: System is reliable to operate. Encrustations are minimized since heating and cooling surfacesare eliminated and vaporization is minimal.
Disadvantages: An additional component (nonsolvent) must be separated from all liquid streams andrecycled. The technique is somewhat limited since the nonsolvent must be miscible in solvent.
SupersaturationFIGURE 11.2-10 Influence of supersaturation on growth and nucleation rates.
is shown to follow a high-order dependence on supersaturation. Design of a crystallizer to produce a desiredcrystal size distribution requires kinetic data that quantify the relationships of nucleation and growth toexternally controlled variables and to supersaturation. The following discussion necessarily is brief andsimply outlines some of the major factors that influence nucleation and growth kinetics. More completediscussions of each phenomenon can be found in the references cited.
As with all kinetic phenomena, the first concept to understand is the driving force for the rate processes.While supersaturation was represented above as the driving force for nucleation and growth, no cleardefinition of this quantity was given. In fact, there are various ways in which the driving force or super-saturation can be defined:
1. The difference between the solute concentration and the concentration at equilibrium, C — C*.2. The difference between the system temperature and the temperature at equilibrium, T-T*.3. The ratio of the solute concentration and the equilibrium concentration, CIC*.4. The ratio of the difference between the solute concentration and the equilibrium concentration to
the equilibrium concentration, s = (C - C*)/C*.
Garside11 cites the analyses and restrictions which have led to the conclusion that the most appropriatedriving force for crystal growth is that given by the fourth of the possibilities listed above, s = (C - C*)/C*. This definition of supersaturation will be used throughout the ensuing discussion. Garside also notesthat when dealing with hydrated salts, concentration should not be based on the anhydrous solute.
NUCLEATIONIn crystallization, nucleation is the formation of a solid phase from a liquid phase. The process differs fromgrowth in that a new crystal results from the transfer of solute from the liquid to the solid; in growth, solidis deposited on an existing crystal. Because it is the phenomenon of crystal formation, nucleation sets thecharacter of the crystallization process, and it is therefore the most critical component in relating crystallizerdesign and operation to crystal size distributions.
Mechanisms. Classical nucleation theory is based on homogeneous and heterogeneous mechanisms,both of which call for the formation of crystals through a process of sequentially combining the constituentunits that form a crystal. These mechanisms are referred to as primary nucleation because existing crystalsplay no role in the nucleation. Both homogeneous and heterogeneous mechanisms require relatively high
Growthrate
Metastable region
Secondarynucleation A
rate
Crys
tal g
rowt
h ra
te (
lbm/h
)N
ucle
atio
n ra
te (n
o./h
)
Primarynucleation
rate
supersaturations in order for them to occur and they exhibit a high-order dependence on supersaturation.These factors often lead to production of excessive fines in systems where primary nucleation mechanismsare important.
Mullin12 outlines the classical theoretical treatment of primary nucleation, which results in the expression
(11.2-9)
where k is the Boltzmann constant, a is surface energy per unit area, v is molar volume, and A is a constant.Note that this equation can be simplified by recognizing that 5 is often much less than 1, so that In (s 4-1) approaches s:
(11.2-9a)
The most important variables affecting primary nucleation rates are shown by Eq. (11.2-9) to be interfacialenergy a, temperature 7, and supersaturation 5. The high-order dependence of nucleation rate on super-saturation is especially important as a small variation in supersaturation may produce an enormous changein nucleation rate. This gives rise to the often observed phenomenon of having a clear liquor transformedinto a slurry of very fine crystals with only a slight increase in supersaturation, for example, by decreasingthe solution temperature. The catalytic effect of solid particles (as in heterogeneous nucleation) is to reducethe energy barrier to formation of a new phase. This, in effect, can reduce the interfacial energy o byorders of magnitude.
An empirical approach to modeling primary nucleation requires a knowledge of the metastable limitthat a given solution can withstand before spontaneous nucleation occurs. This limit, which was firstobserved in experiments by Miers and Issac,13 must be determined through experimentation, and nucleationrate is then correlated with the equation
(11.2-10)
where C is solute concentration, Cm is the solute concentration at which spontaneous nucleation occurs,and C* is the solute concentration at saturation. Randolph and Larson14 indicate that Cm is very close toC* for many inorganic systems, and they report satisfactory correlations with C* substituted for Cm in Eq.(11.2-10).
Secondary nucleation is the formation of new crystals as a result of the presence of solute crystals; inother words, crystals of the solute must be present for secondary nucleation to occur. Garside and Daveyl5
and Larson16 give excellent reviews of the subject, so only a brief synopsis is provided here.Several features of secondary nucleation make it more important than primary nucleation in industrial
crystallizers. First, continuous crystallizers and seeded batch crystallizers have crystals in the magma thatcan participate in secondary nucleation mechanisms. Second, the requirements for the mechanisms ofsecondary nucleation to be operative are fulfilled easily in most industrial crystallizers. Finally, mostcrystallizers are operated in a low supersaturation regime so that crystal growth is regular and the resultingproduct is pure and of good habit; low supersaturation can support secondary nucleation but not primarynucleation.
Secondary nucleation can occur as the result of several mechanisms which have been identified andobserved in selected systems. These include initial breeding, contact nucleation (also known as collisionbreeding), and shear breeding. Initial breeding results from immersion of seed crystals in a supersaturatedsolution, and it is thought to be caused by dislodging extremely small crystals that were formed on thesurface of the crystals during drying. Although this mechanism is unimportant in continuous and unseededbatch crystallization, it can have a significant impact on the operation of seeded batch crystallizers. Girolamiand Rousseau17 demonstrate the effects of several process variables on nucleation rates caused by initialbreeding. Contact nucleation results from collisions of crystals with one another, crystallizer internals, orwith an impeller of an agitator or circulation pump. It should be recognized that the collision energy forcontact nucleation is small and does not necessarily result in the macroscopic degradation of the contactedcrystal. Because of the importance of this mechanism it will be discussed in more detail below. Shearbreeding results when supersaturated solution flows by a crystal surface and carries with it crystal precursorsbelieved formed in the region of the growing crystal surface. Sung et al.18 observed nucleation ofMgSO4*7H2O by this mechanism and found that very high levels of supersaturation were required for itto produce significant numbers of nuclei.
Process Variables Affecting Contact Nucleation. As stated above, contact nucleation results from acollision of a crystal with an object, such as an impeller or other crystallizer internals, in a supersaturatedmedium. The pioneering studies that elucidated many factors affecting this nucleation mechanism were
carried out by Strickland-Constable and coworkers19'20 and Clontz and McCabe.21 These and subsequentworks demonstrate that the number of crystals produced by a controlled impact of an object with a seed crystaldepends on the energy of impact, supersaturation at impact, supersaturation at which crystals mature,material of the impacting object, area of impact, angle of impact, and system temperature. Although it isimpossible to account quantitatively for each of these variables, certain generalizations can be drawn fromthe research on this nucleation mechanism.
Tai et al.22 demonstrate that the number of crystals produced under controlled conditions is an expo-nential function of impact energy E. Furthermore, a threshold or minimum collision energy E, is requiredfor some crystalline systems. Also, Shah et al.23 and Evans et al.24 found that the material of constructionof the impacting object greatly affects the number of crystals resulting from the collision. In particular,coating the crystallizer internals or manufacturing them from soft materials reduces contact nucleation rates.This is attributed to a reduction in the energy transmitted from the coated object to the impacted crystal.Based on these two experimental observations, the following expression was proposed for systems atconstant supersaturation:25
(11.2-11)
In a crystallizer with a circulation pump or agitator, it has been shown that collisions between such a deviceand crystals in the circulating magma dominate nucleation resulting from other collisions.26 Consequently,it might be expected that a relationship of impact energy E to crystallizer variables must include the massof the impact crystal Af,., and the rotational velocity of the impeller w. Moreover, the fraction of theavailable energy actually transmitted to the crystal, e, should also be included in the model:
(11. 2-12)
The variables shown in Eq. (11.2-12) can be manipulated to some extent, thereby modifying nucleationrates and the concomitant crystal size distribution. For example, internal classification can be used to keeplarger crystals away from energetic collisions with an impeller, but doing so may create other problemswith stability of the crystal size distribution. The rotational velocity of an impeller can be changed if thereare appropriate controls on the pump or agitator. Caution must be exercised, however, for a reduction incirculation velocity can reduce heat transfer coefficients and increase fouling or encrustation on heat transfersurfaces. Moreover, the crystals in the magma must be kept suspended or else crystal habit and growthrates could be affected adversely. It is suspected that impact energy may have a high-order dependence onrotational velocity, and if that is the case, modest changes in this quantity could alter nucleation ratessubstantially. As already indicated, the fraction of the impact energy transmitted from an impeller to thecrystal can be manipulated by changing the material of construction of the impeller. Tai27 also showed thehardness of the crystal surface to be important in comparing nucleation characteristics of different crystallinematerials. Therefore, the importance of e may vary from one crystalline system to another: those systemsin which the crystal face is soft may be more susceptible to nucleation rate changes due to the variables inEq. (11.2-12) than those crystalline systems where the face is hard.
Correlations of nucleation rate with crystallizer variables have been developed for several systems. Forexample, Bennett et al.28 examined the effect of slurry circulation rate on nucleation and developed acorrelation based on the tip speed of the impeller. Grootscholten et al.29 considered the scale-up of nucleationkinetics for sodium chloride crystallization, and they provide an analysis of the role of mixing and mixercharacteristics in contact nucleation. Garside and Shah30 reviewed published kinetic correlations thoughabout 1979.
Supersaturation has been observed to affect contact nucleation, but the mechanism by which this occursis not clear. There are data22 that infer a direct relationship between contact nucleation and crystal growth.These data show that the number of nuclei produced by an impact is proportional to the linear growth rateof the impacted face. This is true even for citric acid which exhibits an unusual relationship between growthrate and supersaturation. It has been proposed that the known effect of growth rates, which are determinedprimarily by supersaturation, on the surface of the growing crystal provides the link between crystal growthand contact nucleation.
A second perspective is that supersaturation influences the fraction of entities formed by a collision thatsurvive to form large crystals. This concept largely has been rejected based on the observation that suchentities are much larger than the size of a critical nucleus. Recent research31 yy used photographic andelectronic zone-sensing techniques to examine the size distributions of particles formed by impacts withseed crystals in a supersaturated solution. These experiments on potassium alum show that the particlesproduced cover a size range from 50 /xm down to the smallest size capable of being observed by theinstrument. Furthermore, the influence of supersaturation on the number of particles produced in the 20-50 fim range was much greater than it was on the number produced in the smaller size range. Data thatwill be discussed in the section on crystal growth have shown that dissolution of crystals formed by contactnucleation does not occur, but that a fraction of the crystals grow very slowly and some may not grow atall.
Still another possible role of supersaturation is that it affects the solution structure and perhaps causes
the formation of clusters of solute molecules. These clusters may participate in nucleation, although themechanism by which this would occur is not clear. Mullin and Led34 present evidence for the formationof citric acid clusters in aqueous supersaturated solutions, and McMahon et al.35 have examined clusterformation in solutions of KNO3 using Raman spectroscopy.
The ease with which nuclei can be produced by contact nucleation is a clear indication that thismechanism is dominant in many industrial crystallization operations. Research on this nucleation mechanismis continuing with the objective of building an understanding of the phenomenon that will allow its successfulinclusion in models describing commercial systems.
CRYSTAL GROWTHCrystal growth rates may be expressed in a variety of ways: as the linear advance rate of an individualcrystal face, as the change in a characteristic dimension of a crystal, or as the rate of change in mass of acrystal. These different expressions can be related through an understanding of crystal geometry. However,it is often convenient to use the method of measurement as the basis of the growth rate expression. Incertain instances an analysis of the crystallization process will require growth rate to be defined in a specificway; for example, the use of a population balance to describe crystal size distribution requires that growthrate be defined as the rate of change of a characteristic dimension.
Single-crystal studies of growth kinetics often involve the rate of advance of an individual crystal faceor the rate of change in crystal size associated with exposure to a supersaturated solution. The latter typeof study will be dealt with in discussions of multicrystal magmas. The rate of advance of a single crystalface can be quantified by observation of the face through a calibrated eyepiece of an optical microscope.Using this procedure, it is possible to examine the structure of the advancing crystal face and perhaps toisolate surface reaction kinetics from mass transfer kinetics. These phenomena will be discussed later. Anadditional advantage of this system is that it is possible to examine crystal growth kinetics without inter-ference from competing processes such as nucleation.
Multicrystal magma studies usually involve examination of the rate of change of a characteristic crystaldimension or the rate of increase in the mass of crystals in a magma. The characteristic dimension in suchanalyses depends on the method used in the determination of crystal size; for example, the second largestdimension is measured by sieve analyses, while an equivalent spherical diameter is determined by bothelectronic zone-sensing and laser light-scattering instruments. A relationship between these two measureddimensions and between the measured quantity and the actual crystal dimensions can be derived fromappropriate shape factors. Recall that volume and area shape factors are defined by the equations
(11.2-13)
and
(11.2-14)
where Vc and Ac are volume and area of a crystal, kv and ka are volume and area shape factors, and L isthe characteristic dimension of the crystal. Suppose an equivalent spherical diameter L5 is obtained froman electronic zone-sensing instrument and the actual dimensions of the crystal, which is known to have acubic habit, are to be calculated. Let Lc be the edge length of the crystal, and kvs and kvc be the volumeshape factors for a sphere and a cube, respectively. Since the volume of the crystal is the same, regardlessof the characteristic dimension,
(11.2-15)
which means that
(11.2-16)
Since kvs is ir/6 and kvc is 1.0, the numerical relationship between these two dimensions can be determinedfrom Eq. (11.2-16).
If the rate of change of a crystal mass, dMJdt, is measured, the quantity can be related to the rate ofchange in the crystal characteristic dimension by the equation
(11.2-17)
where pc is crystal density. Since ka = AJL2 and G is defined as dL/dt
(11.2-18)
In multicrystal magma systems, growth kinetics become difficult to isolate from other phenomena,although a combined analysis, such as that described in Section 11.2-4 for the perfectly mixed crystallizer,gives a realistic view of the actual process that occurs in a crystallizer; that is, nucleation and growthkinetics are measured simultaneously and therefore at the same process conditions.
Growth Models, At least two resistances contribute to a determination of growth kinetics. The rateprocesses to which these resistances apply are (1) integration or incorporation of the crystalline unit (e.g.,solute molecules) into the crystal surface (lattice) and (2) molecular or bulk transport of the unit from thesurrounding solution to the crystal face. Since bulk transport is addressed elsewhere (see Chapter 2), thisdiscussion will focus only on surface incorporation. Detailed reviews of this topic can be found else-where11*36"39 so this discussion will be brief.
Numerous models have been proposed to describe surface reaction kinetics. Among these are modelsthat assume crystals grow by layers and other models that consider growth to occur by the movement of acontinuous step. Each model results in a specific relationship between growth rate and supersaturation, butnone can be used for a priori predictions of growth kinetics. Such models do provide insights as to theeffects of certain process variables on growth and, with additional research, may lead to predictive capa-bilities. For these reasons and because of the extensive literature on the subject, all that will be pointedout here are the key aspects of the physical models and the resulting relationship between growth andsupersaturation predicted by each theory.
The model used to describe the growth of crystals by layers calls for a two-step process: (1) formationof a two-dimensional nucleus on the surface and (2) spreading of the solute from the two-dimensionalnucleus across the surface. The relative rates at which these two steps occur give rise to the mononucleartwo-dimensional nucleation theory and the poly nuclear two-dimensional nucleation theory. In the mono-nuclear two-dimensional nucleation theory, the surface nucleation step occurs at a finite rate while thespreading across the surface occurs at an infinite rate. The reverse is true for the poly nuclear two-dimen-sional nucleation theory. From the mononuclear two-dimensional nucleation theory, growth is related tosupersaturation by the equation
(11.2-19)
where C, and C2 are system-dependent constants, h is the height of the nucleus, A is surface area, and sand T are as defined earlier. The polynuclear two-dimensional theory produces the equation
(11.2-20)
where C3 is a system-dependent constant. Finally, if both formation of the two-dimensional nucleus andspreading of the surface layer are important in determining growth rate, the following equation can bederived:
(11.2-21)
where C4 is a system-dependent constant.Equations (11.2-19), (11.2-20), and (11.2-21) can be simplified considerably by recognizing that in
many systems the quantity s is much less than 1. In that case, In (1 + 5) is approximately s. Making thissubstitution, the growth rate from the mononuclear two-dimensional theory becomes
(11.2-22)
For the polynuclear two-dimensional nucleation theory
(11.2-23)
For both steps occurring at similar rates
(11.2-24)
The screw dislocation theory, which was formulated by Burton, Cabrera, and Frank40 and is oftenreferred to as the BCF theory, shows that the dependence of growth rate on supersaturation can vary froma parabolic relationship at low supe!-saturations to a linear relationship at high supersaturations. In the BCF
theory, growth rate is given by
(11.2-25)
where e is screw dislocation activity and a [ is a system-dependent quantity that is inversely proportionalto temperature. The dependence of growth rate on supersaturation is linear if the ratio a\/es is small, butthis dependence becomes parabolic as the ratio becomes large. This is because tanh x approaches x as xbecomes small (supersaturation becomes large), and tanh x approaches 1.0 as x becomes large (supersa-turation becomes small). It is possible then to observe variations in the dependence of growth rate onsupersaturation for a given crystal-solvent system.
An empirical approach can also be used to relate growth kinetics to supersaturation. This approachsimply fits the data with a power-law function of the form
(11.2-26)
where kc and g are constants determined by fitting the equation to growth rate data. Such an approachshould be valid over small ranges of supersaturation. In fact, careful analysis of the theories discussedabove will show that the more fundamental equations can be fit by Eq. (11.2-26) over limited ranges ofsupersaturation.
Effects of Impurities and Solvent The presence of impurities can alter substantially the growth ratesof crystalline materials. The alteration that is most common is for the growth rates to be decreased. It isoften thought that impurities must be molecularly similar to the solute to have an impact on crystal growth.However, impurities with few similarities to the crystallizing species have been observed to reduce growthrates. This may be because structurally similar complexes have been formed between the impurity andsolvent or another species in the solution, but such events are difficult to identify. Because additions ofimpurities to a crystallizing system most often result in a reduced crystal growth rate, it is critical that feedsolutions be as free from contamination as possible. This is one way in which the operation of processunits upstream of a crystallizer can affect crystal size distribution. Therefore, it is suggested that a strictprotocol be followed in operating units such as reactors or other separation equipment upstream of thecrystallizer. Equally important is monitoring the composition of recycle streams so as to detect the accu-mulation of impurities. Moreover, crystallization kinetics obtained on small-scale equipment for use indesign or analysis should be obtained using solutions as similar as possible to that expected in the full-scale process.
Another important effect associated with the presence of impurities is that they may change the crystalhabit. Habit alteration is considered to result from unequal changes in the growth rates of different crystalfaces. Davey41 reviews the role of impurities in the general context of habit modification. Surfactants,especially, have been observed to modify growth rates of individual faces and thereby change the habit ofa crystal.42
The mechanism by which an impurity affects crystal growth rate is considered to involve adsorptionof the impurity onto the crystal surface. Once located on the surface, the impurity forms a barrier to solutetransfer from the solution to the crystal. This model has been used to relate the growth rate of a crystal tothe concentration of impurity in solution through an adsorption isotherm.43*44 An alternative theory callsfor the adsorbed impurity to occupy active growth sites, thereby preventing attachment of solute to thesurface. Still another concept of the impact of an impurity on growth rate calls for integration of theimpurity into the crystal structure, which leads to two deleterious effects: reduction of growth rate andproduction of impure product. Few generalities exist in describing the role of impurities in crystallizationphenomena, and it is usual to rely on experimental data that are often correlated empirically. Mullin12 listsseveral systems in which habit modifiers have been used effectively. An interesting prospect raised by thework of McMahon et al.35 is that impurities may have a strong effect on the formation of solute clustersand ultimately crystal growth.
The solvent from which a material is crystallized can influence the crystal habit and growth rate.Bourne45 ascribes the effects of a solvent to two sets of factors: one has to do with the effects of solventon mass transfer of the solute through adjustments in viscosity, density, and diffusivity; the second isconcerned with the structure of the interface between the crystal and solvent. The analysis provided byBourne concludes that a solute-solvent system having a high solubility is likely to produce a rough interfaceand concomitantly large crystal growth rates.
Crystal Growth in Mixed Crystallizers. As described earlier, crystal growth rates in mukicrystalmagmas are defined in terms of the rate of change of a characteristic dimension
(11.2-27)
It will be shown in a later section that the solution of a differential population balance requires a knowledgeof the relationship between growth rate and size of the growing crystals. Moreover, this relationship canoften be deduced from the form of population density data. A special condition, which simplifies suchbalances, results when all crystals in the magma grow at the same constant rate. Crystal-solvent systemsthat show this behavior are said to follow the AL Law proposed by McCabe,46 while systems that do notare said to exhibit anomalous growth.
Anomalous growth is a term used here to indicate that growth rates of crystals in a magma are notidentical or that the growth rate of an individual crystal or mass of crystals is not constant. Two theorieshave been used to explain growth rate anomalies: size-dependent growth and growth rate dispersion. Aswith systems that follow the AL Law, anomalous growth results in characteristic forms of population densitydata. Unfortunately, such data cannot be used to distinguish between size-dependent growth and growthrate dispersion, because both have the same qualitative effects on population density.
Size-Dependent Crystal Growth. A number of empirical expressions that correlate the apparent effectof crystal size on growth rate are summarized by White et al. However, only a few of these meet thefollowing requirements for use in population balances: (1) the expression must be continuous over theentire size range including L = O; (2) the growth rate of zero-size crystals must not be zero; (3) the growthrate expression must allow convergence of moments of the crystal size distribution. The most often usedcorrelation of size-dependent growth kinetic data is the Abegg-Stevens-Larson (ASL) growth rate expres-sion.48 This equation uses three empirical parameters to correlate growth rate with crystal size:
(11.2-28)
where G0, 7 and b are determined from experimental data.There have been attempts to relate the kinetic parameter b to crystallizer variables; Garside and Jancic49
showed a qualitative dependence on crystallizer volume, and Rousseau and Parks correlated b with G° andT. Several theories have been proposed to explain size-dependent growth kinetics, but none has beensubstantiated by direct observation or used to predict the onset of such behavior. One explanation seemsparticularly appealing: larger crystals impact impellers and other crystallizer internals with higher frequencyand energy than smaller crystals; the larger crystals are therefore recipients of more surface breaks andirregularities that lead to higher growth rates.
At the small end of the size range, crystals in mixed magmas have been observed33'51*52 to give theappearance of growing at much reduced rates. Theories proposed to explain these observations are asfollows: (1) it is assumed that smaller crystals have fewer surface defects to enhance crystal growth; (2)smaller crystals are assumed to have an increased solubility; (3) when small crystals are formed they aremore spherical than more-developed crystals and a high surface energy is involved when the crystal shapegoes from spherical to that characteristic of the crystal.
Growth Rate Dispersion. The phenomenon of growth rate dispersion is the exhibition of differentgrowth rates by crystals in a magma, even though they have the same size and are exposed to identicalconditions. Both zero growth and abrupt changes in growth rates of individual crystals can be exhibited.This dispersion in growth rates can have significant effects on crystal population, leading in general to abroadening of the size distribution. As was discussed under size-dependent growth, growth rate dispersionmay lead to population densities with characteristics that are different from those following the AL Law.These characteristics will become more apparent in Section 11.2-4. The phenomenological aspects of growthrate dispersion are discussed in the following paragraphs.
White and Wright53 first characterized the effects of growth rate dispersion on a population of sucrosecrystals by correlating the variance of the population about a mean size L. They correlated the variancewith the extent of growth of the crystals in a seeded batch crystallizer. The original crystals were of uniformsize and the mean of the crystal size distribution was used as a measure of the extent of growth. Therelationship between the variance and extent of growth was linear and had slope p, which was proportionalto the rate of spreading of the distribution. Growth rate dispersion for sucrose was found to be significant(p = 67 fim), but negligible dispersion (p = 1 jim) was observed for aluminum trihydroxide. The slopep did not depend on the initial seed size (10-500 ^m) or the stirring rate in the crystallizer; it decreasedwhen growth rate or impurity concentration increased, or when brief intervals of dissolution occurred.Janse and de Jong5455 found growth rate dispersion important in the growth of large potassium dichromateand potassium alum crystals and demonstrated that this phenomenon could account for anomalous char-acteristics in the population density of crystals obtained from continuous, steady-state crystallizers. Theyconcluded that growth rate dispersion could provide an explanation of what had been considered to be size-dependent growth, but they also indicated that both phenomena could occur simultaneously and cause theaforementioned anomalous behavior, in other words, the occurrence of growth rate dispersion does not ruleout the possibility that single-crystal growth may be size dependent.
Recent microscopic studies of individual secondary nuclei have observed growth rate dispersion andsize-dependent growth directly.31*56 Garside et al.32 report that two types of potassium alum secondary
nuclei form after gentle contact of a seed crystal. Those less than 4 ^m in size were created in largernumbers and were formed even if the solution was undersaturated. The number of such nuclei was relativelyindependent of supersaturation. These nuclei grew more slowly than larger ones and, in some cases, didnot grow at a measurable rate. The number and size of nuclei between 4 and 50 ^m in size increased assupersaturation was increased. Large crystals were not formed in saturated or undersaturated solution andin supersaturated solutions tended to grow more rapidly than small crystals.
Girolami and Rousseau57 analyzed batch data to show that apparent size-dependent growth of potassiumalum crystals is in fact a manifestation of growth rate dispersion. Crystals of citric acid monohydrategenerated by contact nucleation were found by Berglund and Larson58 to exhibit growth rate dispersion butnot size-dependent growth. Very slow or zero growth rates for small secondary nuclei have been reportedfor aqueous solutions of pentaerythritol59 and sodium chloride.60 Several types of nuclei were distinguishedby their size, shape, and individual growth behavior.
Two distinctly different mechanisms that lead to growth rate dispersion have experimental support. Thefirst, which was proposed by Randolph and White,61 assumes that all crystals have the same time-averagedgrowth rate but the growth rates of individual crystals fluctuate about some mean value. Direct evidenceof random fluctuations in growth rates has been reported for magnesium sulfate heptahydrate62 and potas-sium alum.63 The second proposed mechanism for growth rate dispersion assumes that crystals are bornwith a characteristic distribution of growth rates but individual crystals retain a constant growth ratethroughout their residence in a crystallizer. This mechanism is supported by findings on citric acid,58
potassium nitrate,64 and ammonium dihydrogen phosphate.65'66 All these studies found nuclei to have adistribution of growth rates and individual crystals to have constant growth rates.
The surface integration step for crystal growth is thought to be the primary factor in both mechanismsof growth rate dispersion, and the BCF growth theory can be used to provide a qualitative explanation ofthe growth rate dispersion phenomenon. From the BCF theory, the growth rate of a crystal face is dependenton the number, sign, and location of screw dislocations on the surface of a growing crystal. Collisions ofcrystals with each other and crystallizer internals result in changes in the dislocation network of a crystaland lead to the random fluctuations of growth rates. Changes in the dislocation networks also occur simplydue to the imperfect growth of crystal faces. A distribution of growth rates is a result of the varyingdislocation networks and densities among nuclei and seed crystals.
Although evidence for both mechanisms of growth rate dispersion exists, separate mathematical modelshave been developed for incorporating the two mechanisms into descriptions of crystal populations. Randomgrowth rate fluctuations were characterized by Randolph and White61 with a growth rate diffusivity parameterDc which is representative of the magnitude of the growth rate fluctuations. This model is similiar to thatused to describe molecular diffusion and axial dispersion associated with velocity fluctuations. Mathematicalmodels of growth rate dispersion due only to the growth rate distribution mechanism have been developedusing different methods by Janse and de Jong67 and Larson and coworkers.6870 These models characterizethe growth rate distribution mechanism of growth rate dispersion by a distribution function having a meangrowth rate G and a growth rate variance OQ. Zumstein and Rousseau71 have extended such models byshowing how both mechanisms of growth rate dispersion can be included and by illustrating the relativeeffects of the two mechanisms on CSD from batch and continuous crystallizers.
Experimental efforts to determine the importance of the two mechanisms of growth rate dispersion havebeen involved mainly with the measurement of the spread in crystal size distribution during constant-supersaturation, isothermal batch crystallizations. The model for random growth rate fluctuations predictsthe variance of the crystal size distribution will increase linearly with the extent of growth, while the modelfor a distribution of constant crystal growth rates predicts the variance to increase with the extent of growthsquared. The original work by White and Wright on sucrose53 supports the growth rate fluctuation mech-anism, while the mechanism associated with a growth rate distribution is supported by data on contactnuclei of ammonium dihydrogen phosphate66 and citric acid.70 Although there is experimental support forboth mechanisms, it is still unclear how crystallizing conditions affect the relative importance of the twomechanisms.
11.2-4 MODEL OF A WELL-MIXED CRYSTALLIZER
In this section, the principles involved in using a population balance to describe the crystal size distributionin the product from a well-mixed continuous crystallizer are illustrated. The primary objective of thistreatment is to show how nucleation and growth kinetics can be evaluated from data on the crystal sizedistribution produced in such crystallizers. Detailed development of the theory and extensions of theseprinciples to crystallizers that employ selective removal of crystals from the crystallizer internals or to batchor transient continuous crystallizers is provided by Randolph and Larson.14
APPLICATION OF A POPULATION BALANCEThe basis of a population balance is that the number of crystals in a system is a balanceable quantity. Suchbalances are coupled to the usual mass and energy balances describing any system, and the crystals are
assumed to be sufficiently small and numerous so that the crystal size distribution may be considered to bea continuous function of a variable with which individual crystals are to be characterized. In this discussion,the variable is the characteristic dimension (size) of the crystal.
A balance on the number of crystals in any size range—say L, to L2-must account for crystals thatenter and leave that size range by convective flow into and out of the control volume V7- and for crystalsthat enter and leave the size range by growth. Crystal breakage and agglomeration are ignored in thisdiscussion, and it is assumed that crystals are formed by nucleation at or near size zero. Now define aquantity called population density n so that the number of crystals dN(L) in the size range L to L + dL isgiven by
(11.2-29)
It is important to note that either clear liquor volume or slurry volume can be taken as a basis for thedefinition of n. For example, if clear liquor volume is taken as the basis, V7 becomes the volume of clearliquor in the control volume. With this definition of the population density, it can be shown that thepopulation balance on a well-mixed continuous crystallizer is given by
(11.2-30)
where Q1 and Q0 are volumetric flow rates of either clear liquor or slurry into and out of the crystallizer,respectively. Equation (11.2-30) can now be simplified as follows: assume that the feed liquor contains nocrystals (n, = 0); restrict growth to follow the AL Law [d(nG)/dL - Gdn/dL); specify that the magmavolume is constant (3V7Jdt = 0); and operate the crystallizer at steady state (dn/dt = 0).
If all four of these restrictions apply, and if a mean residence time r (often called drawdown time) isdefined as V7JQ0, the population balance can be written
(11.2-31)
which may be integrated, using the boundary condition n(0) = n°, to give
(11.2-32)
If the assumptions that lead to Eq. (11.2-32) are valid, and they often are, a straight line will result ifn is plotted versus L on semilog coordinates. Furthermore, the growth rate of crystals can be determinedfrom the slope of the plot, which is — HGT. The nucleation rate is related to the intercept of the plot, /i°,by the expression
(11.2-33)
Equations (11.2-32) and (11.2-33) can be used to obtain nucleation and growth rates from populationdensity measurements on a crystallizer that conforms to the assumptions stated above. This means that nmust be determined as a function of L. There are various techniques for obtaining particle size distributions,and the procedures for determining n from these data varies according to the device used for the analysis.Although complete coverage of the advantages and disadvantages of available particle size analyzers isbeyond the scope of this chapter, two common techniques are discussed briefly in the following paragraphs.
Sieves. Dry and/or wet sieve analyses provide differential or cumulative weight distributions. Ob-viously, crystals must be in the size range appropriate for a given set of sieves in order for this procedureto be used. The processes of sampling, sample treatment, and sieving can modify the crystal size distributionif care is not taken to prevent agglomeration, crystal abrasion, and crystal breakage. In most sievingtechniques, obtaining representative material for sieving requires that crystals be filtered carefully from themother liquor and dried, and prior to drying it may be necessary to wash the crystals with a nonsolvent toprevent agglomeration. When working the first time with a crystalline material, some experimentation maybe necessary to develop a good sieving practice and to find an appropriate wash liquor.
Once satisfactory sieving has been accomplished, n{L) is determined from the following relationshipderived from the definition of the cumulative weight distribution data:
(11.2-34)
where MT is magma density or mass of crystals per unit volume of clear liquor or slurry, AW(L) is thefraction of the total mass of crystals retained on the sieve having an average size L, AL is the interval insize between the sieve and the next largest sieve in the nest, pc is the density of the crystal, kv is the volumeshape factor, and L is the average of the size of the sieve and the next largest sieve in the nest.
Electronic Particle Size Analyzers. These devices typically measure changes in a property such aslight diffraction, light scattering, light blockage, or electrical conductance to determine the size of a particle.Changes in these measured quantities depend on the volume of the particle being sized, and hence this isthe property actually determined by the instrument. The characteristic dimension assigned to the particleis that of a sphere having a volume equivalent to the measured volume. The output from these instrumentscan be in two forms: a particle volume distribution or a number distribution. The volume distribution datacan be converted to population densities using Eq. (11.2-34) and assigning the particles the shape factorof a sphere, x/6. Several devices give population density data directly, and conversions to other forms areunnecessary.
There is considerable technique required in appropriately interpreting the data from electronic particlesize analyzers. Vendors can be quite helpful in the development of a measurement procedure, but someexperimentation should be expected with each new system.
KINETIC MODELSOnce nucleation and growth kinetics have been obtained using the procedures outlined above, correlationsof them as functions of process variables are required to use the population balance model for predictivepurposes. As discussed in Section 11.2-3, the important variables affecting nucleation and growth kineticsinclude temperature, supersaturation, magma density, and external stimuli that can cause nucleation, suchas agitation or circulation rate of the magma. In Section 11.2-3 some of the important mechanisms bywhich nucleation and growth occur were described. These mechanisms should be the basis of models ofcrystallization kinetics, even though the actual correlations are empirical. Power-law functions are usedmost frequently in correlating nucleation and growth rates, but the choice of the independent variables canbe justified from a mechanistic perspective. For example, systems that are believed to follow secondarynucleation mechanisms should include a variable reflecting the character of crystals in the crystallizer, suchas magma density. The most commonly used power-law functions are
(11.2-35)
and
(11.2-36)
Several methods for expressing supersaturation were described in Section 11.2-3; it is often very difficultto measure this quantity, especially in systems that have high growth rates. In these systems, supersaturationis often so small that it is difficult to measure accurately, and it can be neglected in writing a solute massbalance. However, it is important in setting nucleation and growth rates. A useful technique in suchinstances is to substitute growth rate for supersaturation by combining Eqs. (11.2-35) and (11.2-36). Thisgives
(11.2-37)
The constant kn depends on process variables other than supersaturation and magma density, such astemperature, rate of agitation or circulation, and presence of impurities. If sufficient data are available,these variables may be separated from the constant by adding more terms in a power-law correlation.However, kn is essentially a constant specific to the operating equipment and not transferable from onescale of equipment to another. The solute-solvent-specific constants i andy are obtainable from experimentaldata and may be used in scale-up.
PARAMETER EVALUATIONAs shown above, growth rate G can be obtained from the slope of a plot of the log of population densitydata against crystal size; nucleation rate B ° can be obtained from the same data by using the relationshipB° = n°G% where In n0 is the intercept of the plot with the axis at L = 0. Nucleation rates obtained bythese procedures should be checked by comparison with values obtained from a mass balance. It can beshown that the magma density of a slurry in a perfectly mixed crystallizer is given by
(11.2-38)
Rearranging this equation and substituting n° = B °/G, we obtain
(11.2-39)
TABLE 11.2-5 Typical Kinetic Orders Reported72
Mode of KineticSystem Crystallization Order Comments
Calcium sulfate- Precipitation 2.6-2.8 Indication that homogeneousphosphoric acid nucleation dominates
Ammonium sulfate- Cooling 1.7 No enhancement in crystalwater size with increased
suspension density notedAmmonium alum- Cooling 2.1 Strong secondary nucleation
water effects were notedAmmonium alum- Salting out 1.0 Increased residence time had
water-ethanol no effect on crystal sizedistribution
Ammonium sulfate- Salting out 4.0 Increased residence time hadwater-methanol moderate effect on CSD
Ammonium alum- Salting out 2.0 Used MSMPR theory towater-ethanol analyze data. Secondary
nucleation effects notaccounted for
Cyclonite-water- Precipitation 1.0 Used MSMPR theory tonitric acid obtain kinetic order
Reproduced by permission of the American Institute of Chemical Engineers.
After nucleation and growth rates have been obtained from population density data, the exponents iand j in Eq. (11.2-37) can be determined using graphical techniques or multivariable linear regression. Forexample, i can be obtained from data on several runs of varying residence times. Each run will yield valuesof 5 ° , n°, and G. If slurry concentration (magma density) MT is the same for all runs, the slope of alogarithmic plot of n° versus G will give i. If slurry concentration varies slightly from run to run, then alogarithmic plot of B °/Af7 versus G will smooth the data so that i can be obtained from the slope of theplot. Confidence in the parameters i and j requires that sufficient data be accumulated to make suchcorrelations statistically reliable. Typical values of kinetic orders are given in Table 11.2-5, and a morecomplete list is given by Garside and Shah.30
CHARACTERISTICS OF CRYSTAL SIZE DISTRIBUTIONS FROM MSMPR CRYSTALLIZERSThe preceding discussion centered on the development of expressions for the population density functionin terms of nucleation and growth kinetics. It is also possible to express the properties of a crystal sizedistribution in terms of a mass density function m. The two density functions can be shown to be relatedby the expression
(11.2-40)
The perfectly mixed, continuous, steady-state mixed-suspension mixed-product removal (MSMPR) crys-tallizer is restrictive in the degree to which characteristics of a crystal size distribution can be varied.Indeed, examination of Eqs. (11.2-32) and (11.2-40) shows that once nucleation and growth kinetics arefixed in these systems the crystal size distribution is determined in its entirety. In addition, such distributionshave the following characteristics:
1. The mode or maximum of the mass density function occurs at the dominant crystal size LD, whichis given by
(11.2-41)
2. Moments of the population density are given by the expression
(11.2-42)
3. The coefficient of variation of the mass density function, which is a measure of the spread of thedistribution about the dominant crystal size, is 50%. Such a distribution may be too broad to be acceptablefor certain crystalline products, such as sugar.
System
Calcium sulfate-phosphoric acid
Ammonium sulfate-water
Ammonium alum-water
Ammonium alum-water-ethanol
Ammonium sulfate-water-methanol
Sodium chloride-water-ethanol
Ammonium alum-water-ethanol
Cyclonite-water-nitric acid
Mode ofCrystallization
Precipitation
Cooling
Cooling
Salting out
Salting out
Salting out
Salting out
Precipitation
KineticOrder
2.6-2.8
1.7
2.1
1.0
4.0
9.0
2.0
1.0
Comments
Indication that homogeneousnucleation dominates
No enhancement in crystalsize with increasedsuspension density noted
Strong secondary nucleationeffects were noted
Increased residence time hadno effect on crystal sizedistribution
Increased residence time hadmoderate effect on CSD
Increasing residence timestrongly affected CSD
Used MSMPR theory toanalyze data. Secondarynucleation effects notaccounted for
Used MSMPR theory toobtain kinetic order
4. The magma density Af7- (mass of crystals per unit volume of slurry or liquor) may be obtained fromthe third moment of the population density function. As shown above, this quantity is related to nucleationand growth rates by Eq. (11.2-38). Although magma density is a function of the kinetic parameters n° andG, it can be measured independently of crystal size distribution and, where possible, it should be used, asindicated above, as a constraint in evaluating nucleation and growth rates from measured crystal sizedistributions.
5. A pair of kinetic parameters, one for nucleation rate and another for growth rate, describe thecrystal size distribution for a given set of crystallizer operating conditions. Furthermore, variation in oneof the kinetic parameters without changing the other is not possible.
6. Properties of the distribution may be evaluated explicitly from the moment equations:
N = total number of crystals per unit volume
(11.2-43a)
LT = total length of crystals per unit volume
(11.2-43b)
AT = total area of crystals per unit volume
(11.2-43c)
Vc = total volume of crystals per unit volume
(U.2-43d)
PARAMETERS FROM SYSTEMS EXHIBITING ANOMALOUS GROWTHTwo types of anomalous growth behavior were described in Section 11.2-3: growth rate dispersion andsize-dependent growth. As pointed out, the effects of these mechanistically different phenomena on crystalsize distributions are the same; both cause curvature in semilog plots of population density against size.Moreover, when size-dependent growth rates increase with crystal size, both cause a broadening of thedistribution. In this discussion, methods will be presented that illustrate evaluation of the parameters insystems following size-dependent growth kinetics. Research is in progress on development of similarprocedures for systems deemed to follow growth rate dispersion anomalies, and the current literature shouldbe followed for such cases.
A number of empirical size-dependent growth expressions have been developed. Of these, the ASLmodel given in Eq. (11.2-28) is the most commonly used. Substituting this equation into the differentialpopulation balance given by Eq. (11.2-31), the steady-state population density function can be derived as
(11.2-44)
This equation is often simplified by restricting 7 to be equal to 1/G°T, which reduces the number of modelparameters by one and often results in a fit to data that is nearly as good as the three-parameter model.The reduced ASL model (7 = 1/G°r) leads to the following equation for population density:
(11.2-45)
Garside and Jancic49 noted the relationship of several magma properties to the parameter b in the ASLgrowth model. CTDeIl and Rousseau73*74 derived formulas for estimating the characteristics of crystal sizedistributions in terms of parameters in size-dependent growth kinetic models and for crystallizers withselective removal of fines and/or product. For systems whose growth follows the reduced ASL equation,it was shown that total length of crystals per unit volume of magma or liquor, surface area of crystals perunit volume, mass of crystals per unit volume (magma density), mass average size, coefficient of variation,and dominant size could be calculated from the equations
(11.2-46)
(11.2-47)
TABLE 11.2-6 Constants for Evaluating Magma Properties of Systems that Follow Reduced ASLKinetics
The constants in Eqs. (11.2-46)-(l 1.2-51) are fiinctions of b only, and they are given in Table 11.2-6.The table can be used to estimate the desired property of a crystal size distribution from the model parametersand Eqs. (11.2-46)-(l 1.2-51), or it can be used in evaluating the model parameters from experimental dataas described below.
It should be clear that the form of the population density function given by Eq. (11.2-32) (systems thatfollow the AL Law) is much simpler than those of Eqs. (11.2-44) and (11.2-45). This increase in complexityfor systems that exhibit anomalous growth makes extraction of model parameters more difficult. Not onlydo anomalous growth models have more parameters, but the curvature in plots of the log of the populationdensity against size means that parameters must be determined by using nonlinear least-squares regressions.For example, fitting the reduced form of the ASL equation requires evaluation of the parameters /t°, G ° ,and b in Eq. (11.2-45), and the estimate of n° is extremely sensitive to the few data points frequentlyobtained at very small sizes. Moreover, nonlinearities in the semilogarithmic relationship between popu-lation density and size frequently are most severe at small sizes. Consequently, it is very difficult todetermine n° with any real accuracy.
Rousseau and Parks50 simplified this problem by substituting Eq. (11.2-48) into Eq. (11.2-45) toeliminate n0
(11.2-52)
Experimentally determined population density, measured M7-and the values of C3 in Table 11.2-6 can thenbe used to evaluate the two remaining adjustable parameters b and G °. Interpolation of C3 is assisted bya polynomial fit to b
(11.2-53)
The effects of the two growth rate dispersion mechanisms on the CSD in a mixed-suspension, mixed-product removal (MSMPR) continuous crystallizer are different. Random growth rate fluctuations do notaffect the spread of the CSD from an MSMPR crystallizer and the resulting population density function isindistinguishable from that obtained assuming applicability of the AL Law. However, growth rate fluctua-tions do increase the mean crystal size from that which is expected from the AL Law. On the other hand,CSD from a continuous crystallizer is affected noticeably by assigning a distribution of constant crystalgrowth rates to the nuclei. This mechanism causes the type of curvature in population density plots thattypically has been ascribed to size-dependent growth.
A model that combines growth rate dispersion mechanisms has been derived by Zumstein and Rous-seau.74 The expression for population density derived from their model is
(11.2-54)
where/0(G) is the distribution of nuclei growth rates and 5, which is between 0 and 1, is given by
(11.2-55)
The other terms are as defined earlier. This equation was used to demonstrate that random growth ratefluctuations may damp out the effect of the growth rate distribution function, thereby causing the effectsof growth rate dispersion to be unobservable in a continuous crystallizer.71 Moreover, it is shown that anunderstanding of growth rate dispersion may be a key factor in obtaining realistic models for scale-up.75
PREFERENTIAL REMOVAL OF CRYSTALSCrystal size distributions produced in a perfectly mixed crystallizer are highly constrained, and nucleationand growth kinetics are determined exclusively by the crystalline system and the variables that define thestate of the crystallizer. Accordingly, specification of the feed variables (flow rate, temperature, pressure,and solute concentration), the crystallizer variables (temperature, pressure in an adiabatic cooling process,agitation or magma circulation rate, and solids fraction in an evaporative crystallizer), and crystallizergeometry determines magma density and other characteristics of the crystal size distribution.
Crystallizers are made more flexible by the introduction of selective removal devices that alter theresidence time distribution of materials flowing from the crystallizer. The functions of classified removalare best described in terms of idealized models of clear-liquor advance, classified-fines removal, andclassified-product removal. Clear-liquor advance is the removal of mother liquor from the crystallizerwithout simultaneous removal of crystals. The effects of implementing this removal function are describedin Section 11.5-2. The primary objective of fines removal is preferential withdrawal from the crystallizerof crystals whose size is below some specified value; with the withdrawal, dissolution, and return of thesolution to the crystallizer, the growth of larger crystals is enhanced. Classified-product removal is carriedout to remove preferentially those crystals whose size is larger than some specified value.
The effects of each of the selective removal functions on crystal size distributions can be described interms of the population density function n. If it is assumed that perfect classification of fines and productcrystals is implemented, then the following expression for population density results:
For L <; Lp
(11.2-56)
For Lf < L < Lc
(11.2-57)
For L * z Lc
(11.2-58)
where the fines are below size LF and have a removal rate R times what would exist for perfect mixing,the coarse product is greater than size Lc and has a removal rate Z times that of the perfectly mixedcrystallizer. If fines removal is implemented alone, Z = I , and if classified product removal is implementedwithout fines removal, R = 1. Selection of a crystallizer that has both classified-fines and classified-productremoval functions usually is done so as to combine the best features of each: increased dominant size and
narrower distribution. The model of the crystallizer and selective removal devices that led to Eqs. (11.2-56)-(11.2-58) is referred to as the R-Z crystallizer. It is an obvious idealization of actual crystallizersbecause of the perfect cuts assumed at LF and Lc. However, it is a useful approximation to many systemsand it allows qualitative analyses of complex operations.
Although many commercial crystallizers operate with some form of selective crystal removal, devicesthat implement these functions add to the complexity of the operation. In addition, Randolph et al.76 haveestablished that classified-product removal can lead to cycling of the crystal size distribution. A review ofthe simulation and control of crystal size distributions has been provided by Randolph.77 Properties of thecrystal size distribution have been given in terms of R and Z and the moments of the crystal size distri-bution.74
BATCH CRYSTALLIZATIONAs with continuous crystallizers, the mode by which supersaturation is generated affects the yield andcrystal size distribution, but batch crystallizers are strongly influenced by the rate at which supersaturationis generated. For example, in a cooling mode there are several avenues that can be followed in reducingthe temperature of the batch system: natural cooling in which a batch is simply allowed to release heat toa constant-temperature heat sink, cooling in which the rate of heat transfer is constant, cooling in whichthe supersaturation is maintained constant, and size-optimal cooling whose objective is to vary the coolingrate so that the supersaturation in the crystallizer is adjusted to produce an optimal crystal size distribution.The effects of these and other modes of operation on crystal size distribution are discussed by Tavare etal.78 Other important features of batch crystallizers are reviewed by Wey79 and Randolph and Larson.14
Perhaps the most troublesome aspect of batch crystallizers is the difficulty associated with reproducingcrystal size distributions in going from one batch to the next. This may be overcome through seedingand control of mixing conditions. In general, however, the development of methods for design and analysisof batch crystallizers lags those for continuous systems.
11.3 SOLUTIONCRYSTALLIZATION
Crystallization is a commonly used industrial separation and purification technique. If the desired productis an evaporate (or filtrate) rather than a crystalline phase, then the process emphasis is primarily that ofseparation rather than purification. In either case there is a strong interaction and dependence between bothdegree of separation and purification and the paniculate nature of the solid phase produced. Fundamentalresearch on crystallization has focused mainly on understanding the variables that influence the structureand size of the crystalline phase, recognizing that better knowledge and control of this aspect would permitimprovement of the unit operation of crystallization, both as a separation and purification technique.
11.3-1 State-of-the-Art
Use of mathematical models for designing industrial crystallizers has lagged other chemical processingoperations because of the complexities of rationally describing and interrelating growth and nucleationkinetics with the process configuration and mechanical features of the crystallizer. Crystallizers have tra-ditionally been designed by scale-up of pilot- or bench-scale data, taking care to control supersaturationlevels and to maintain similar crystal residence time, vessel configuration, and hydraulic regimes. Systemkinetics, even though controlling the ultimate crystal size distribution, were thought to be subjects betterrelegated to the laboratory and were rarely used for crystallizer design.
The design and analysis of crystallization processes of the continuous well-mixed suspension type havedeveloped into formal design algorithms which can now be applied in situations of industrial importance.Specific process configurations that can be modeled rigorously include fines destruction, clear-liquor ad-vance, classified-product removal, vessel staging, and seeding. Such process configurations can be modeledrigorously with a population balance CSD algorithm or, in many cases, with an alternative mass-basedformulation. Crystal size distribution transients and stability can also be evaluated as well as the effects ofsize-dependent growth rate and suspension concentration-dependent secondary nucleation. Simulation ca-pabilities have in fact outstripped the ability to monitor appropriate control variables and to manipulate andcontrol liquid and solids residence-time distributions in a crystallizing environment.
A considerable amount of skepticism naturally is expressed by crystallization practitioners concerningthe unbridled use of parameters generated in well-controlled small-scale equipment to predict performanceof industrial-scale crystallizers. Many factors contribute to the nonideal behavior of industrial crystallizers,and not all can be easily explained.
The ability to predict crystal behavior in complex systems is ahead of our ability to manipulate crystaland liquid residence times. Generalizations of the MSMPR equations have been made to predict CSD witharbitrary process configurations and kinetics; however, there is no guarantee that an assumed processresidence-time distribution can be physically implemented to produce a customized product CSD. Sizedistributions in cascaded crystallizers, for example, multiple-effect evaporators, can be computed if kinetic