36
CS102 Classification Machine Learning - Classification CS102 Spring 2018

CS102Classification
Machine Learning - Classification
CS102Spring 2018

CS102Classification
Big Data Tools and Techniques
§ Basic Data Manipulation and AnalysisPerforming well-defined computations or asking well-defined questions (“queries”)
§ Data MiningLooking for patterns in data
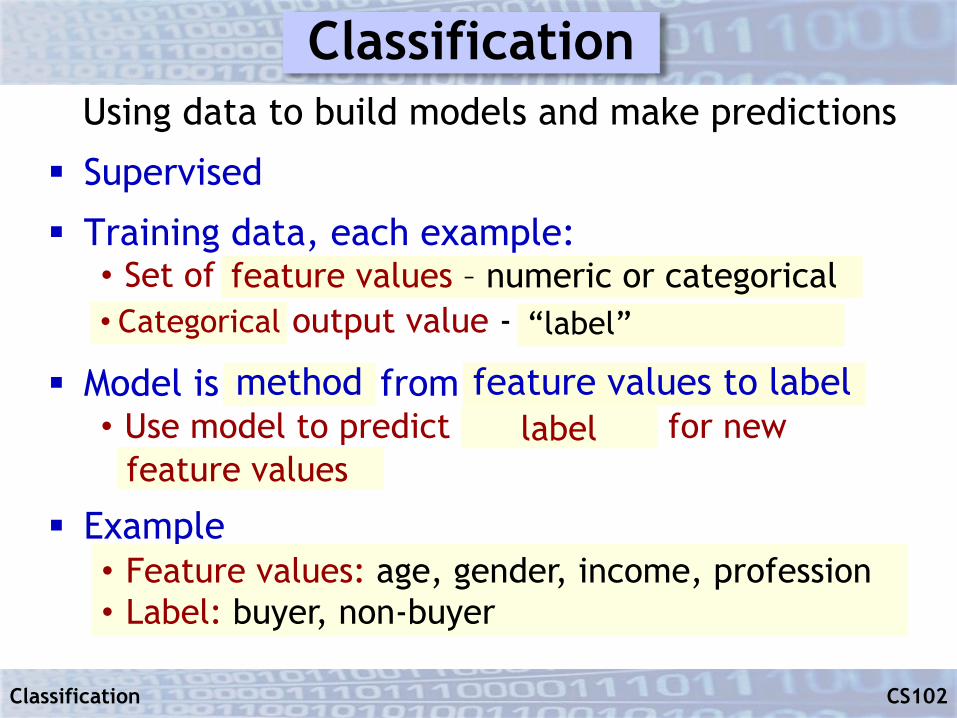
§ Machine LearningUsing data to build models and make predictions
§ Data VisualizationGraphical depiction of data
§ Data Collection and Preparation

CS102Classification
RegressionUsing data to build models and make predictions
§ Supervised
§ Training data, each example:• Set of predictor values - “independent variables”• Numerical output value - “dependent variable”
§ Model is function from predictors to output• Use model to predict output value for new
predictor values
§ Example• Predictors: mother height, father height, current age• Output: height
feature values – numeric or categorical• Categorical
feature values to label
“label”
labelfeature values
Classification
• Feature values: age, gender, income, profession• Label: buyer, non-buyer
method
CS102Classification
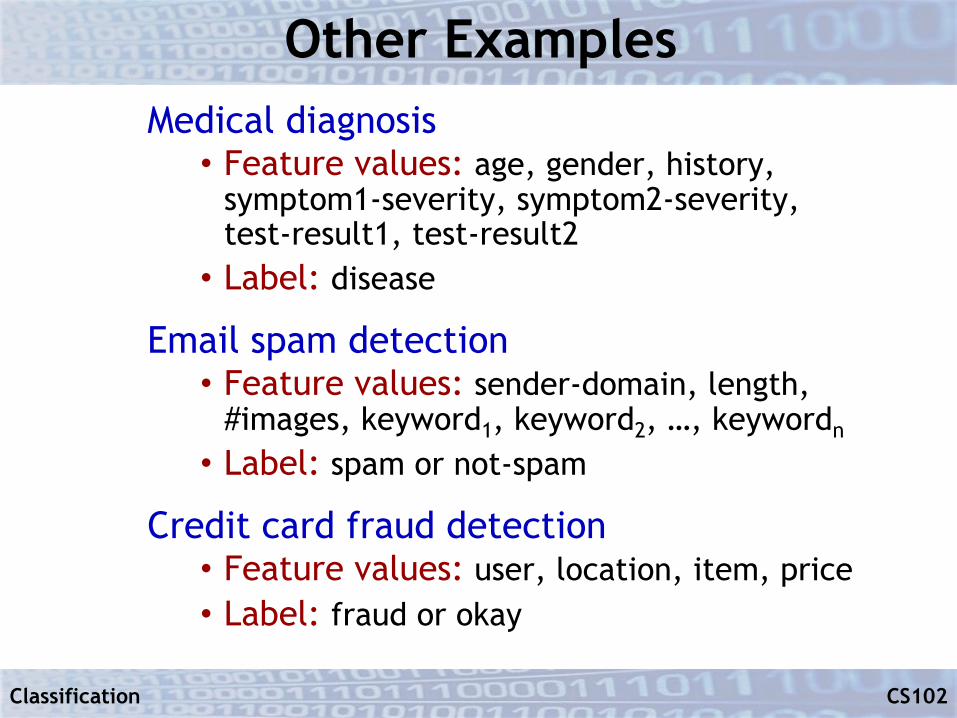
Other ExamplesMedical diagnosis
• Feature values: age, gender, history, symptom1-severity, symptom2-severity, test-result1, test-result2• Label: disease
Email spam detection• Feature values: sender-domain, length,
#images, keyword1, keyword2, …, keywordn
• Label: spam or not-spam
Credit card fraud detection• Feature values: user, location, item, price• Label: fraud or okay

CS102Classification
Algorithms for Classification
Despite similarity of problem statement to regression, non-numerical nature of classification leads to completely different approaches
§ K-nearest neighbors§ Decision trees§ Naïve Bayes§ … and others

CS102Classification
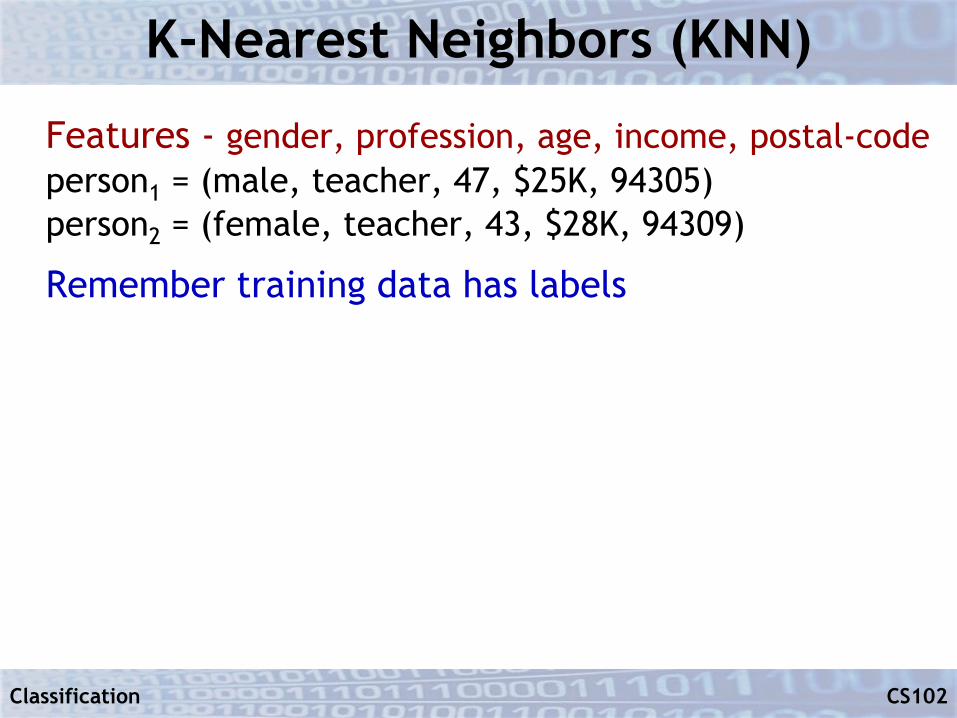
K-Nearest Neighbors (KNN)
For any pair of data items i1 and i2, from their feature values compute distance(i1,i2)
Example:Features - gender, profession, age, income, postal-code
person1 = (male, teacher, 47, $25K, 94305)person2 = (female, teacher, 43, $28K, 94309)
distance(person1, person2)
distance() can be defined as inverse of similarity()
CS102Classification
K-Nearest Neighbors (KNN)
Features - gender, profession, age, income, postal-codeperson1 = (male, teacher, 47, $25K, 94305)person2 = (female, teacher, 43, $28K, 94309)
Remember training data has labels

CS102Classification
K-Nearest Neighbors (KNN)
Features - gender, profession, age, income, postal-codeperson1 = (male, teacher, 47, $25K, 94305) buyerperson2 = (female, teacher, 43, $28K, 94309) non-buyer
Remember training data has labels
To classify a new item i : In the labeled data find the K closest items to i, assign most frequent label
person3 = (female, doctor, 40, $40K, 95123)

CS102Classification
KNN Example
§ City temperatures – France and Germany
§ Features: longitude, latitude
§ Distance is Euclidean distancedistance([o1,a1],[o2,a2]) = sqrt((o1−o2)2 + (a1−a2)2)= actual distance in x-y plane
§ Labels: frigid, cold, cool, warm, hot
Predict temperaturecategory from
longitude and latitude
Nice (7.27, 43.72) coolToulouse (1.45, 43.62) warmFrankfurt (8.68, 50.1) cold
......

CS102Classification
KNN Example

CS102Classification
KNN Summary
To classify a new item i : find K closest items to iin the labeled data, assign most frequent label
§ No hidden complicated math!
§ Once distance function is defined, rest is easy
§ Though not necessarily efficientReal examples often have thousands of features
§ Medical diagnosis: symptoms (yes/no), test results§ Email spam detection: words (frequency)
Database of labeled items might be enormous

CS102Classification
“Regression” Using KNN
Features - gender, profession, age, income, postal-codeperson1 = (male, teacher, 47, $25K, 94305) buyerperson2 = (female, teacher, 43, $28K, 94309) non-buyer
Remember training data has labels
To classify a new item i, find K closest items to iin the labeled data, assign most frequent label
person3 = (female, doctor, 40, $40K, 95123)

CS102Classification
“Regression” Using KNN
Features - gender, profession, age, income, postal-codeperson1 = (male, teacher, 47, $25K, 94305) buyerperson2 = (female, teacher, 43, $28K, 94309) non-buyer
Remember training data has labels
To classify a new item i, find K closest items to iin the labeled data, assign most frequent label
person3 = (female, doctor, 40, $40K, 95123)
average value of labels
$250$100

CS102Classification
Regression Using KNN - Example
Can refine by weightingaverage by distance

CS102Classification
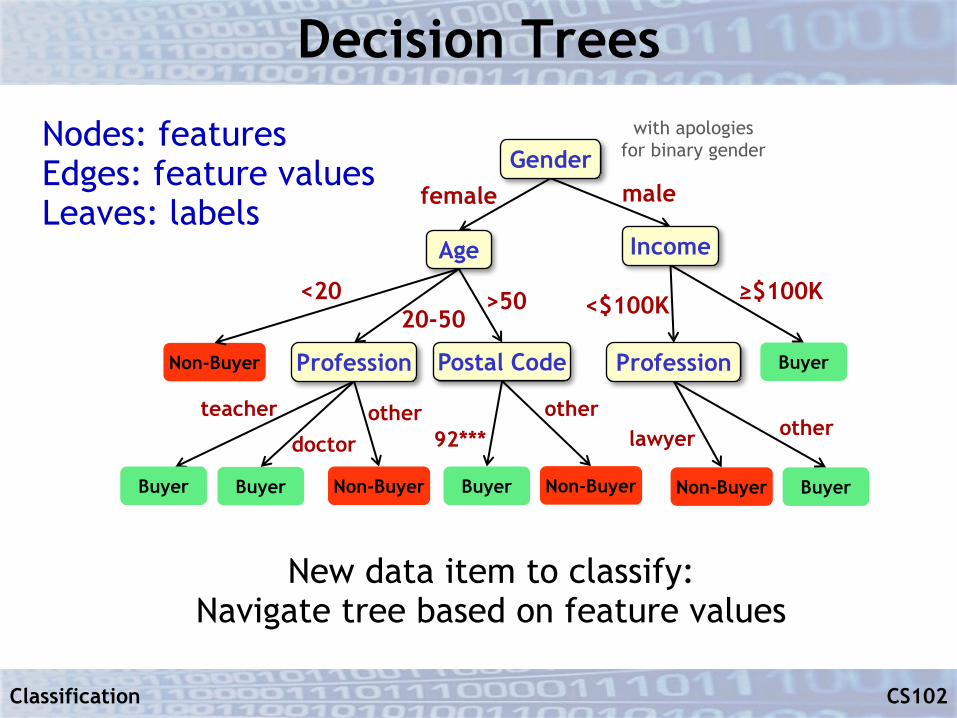
Decision Trees
§ Use the training data to construct a decision tree
§ Use the decision tree to classify new data
CS102Classification
Decision Trees
New data item to classify:Navigate tree based on feature values
Buyer
female male
Non-Buyer
Buyer BuyerNon-BuyerBuyer Non-Buyer BuyerNon-Buyer
<20 >5020-50 <$100K ≥$100K
teacher
doctorother
lawyer other92***other
Nodes: featuresEdges: feature valuesLeaves: labels
Age Income
Profession Postal Code Profession
Genderwith apologies
for binary gender

CS102Classification
Decision Trees
Primary challenge is building good decision trees from training data
• Which features and feature values to use at each choice point
• HUGE number of possible trees even with small number of features and values
Common approach: “forest” of many trees, combine the results
• Still impossible to consider all trees

CS102Classification
Naïve Bayes
Given new data item i, based on i’s feature values and the training data, compute the probability of each possible label. Pick highest one.
Efficiency relies on conditional independence assumption:
Given any two features F1,F2 and a label L, the probability that F1=v1 for an item with label L is independent of the probability that F2=v2 for that item
Examples:gender and age? income and postal code?

CS102Classification
Naïve Bayes
Given new data item i, based on i’s feature values and the training data, compute the probability of each possible label. Pick highest one.
Efficiency relies on conditional independence assumption:
Given any two features F1,F2 and a label L, the probability that F1=v1 for an item with label L is independent of the probability that F2=v2 for that item.
Examples:gender and age? income and postal code?
Conditional independenceassumption often doesn’t hold,
which is why the approach is “naive”
Nevertheless theapproach works very
well in practice

CS102Classification
Naïve Bayes ExamplePredict temperature category for a country based on whether the country has coastline and whether it is in the EU

CS102Classification
Naïve Bayes Preparation
Step 1: Compute fraction (probability) of items in each category
cold .18
cool .38warm .24hot .20

CS102Classification
Naïve Bayes Preparation
Step 2: For each category, compute fraction of items in that category for each feature and value
cold(.18)
coastline=yes .83
coastline=no .17
EU=yes .67
EU=no .33
cool(.38)
coastline=yes .69coastline=no .31EU=yes .77EU=no .23
warm(.24)
coastline=yes .5
coastline=no .5
EU=yes .5
EU=no .5
hot(.20)
coastline=yes 1.0coastline=no .0EU=yes .71EU=no .29

CS102Classification
Naïve Bayes Prediction
New item: France, coastline=yes, EU=yes
For each category: probability of category times product of probabilities of new item’s features in that category. Pick highest.
category prob. coastline=yes EU=yes product
cold .18 .83 .67 .10
cool .38 .69 .77 .20warm .24 .5 .5 .06hot .20 1.0 .71 .14
CS102Classification
Naïve Bayes Prediction
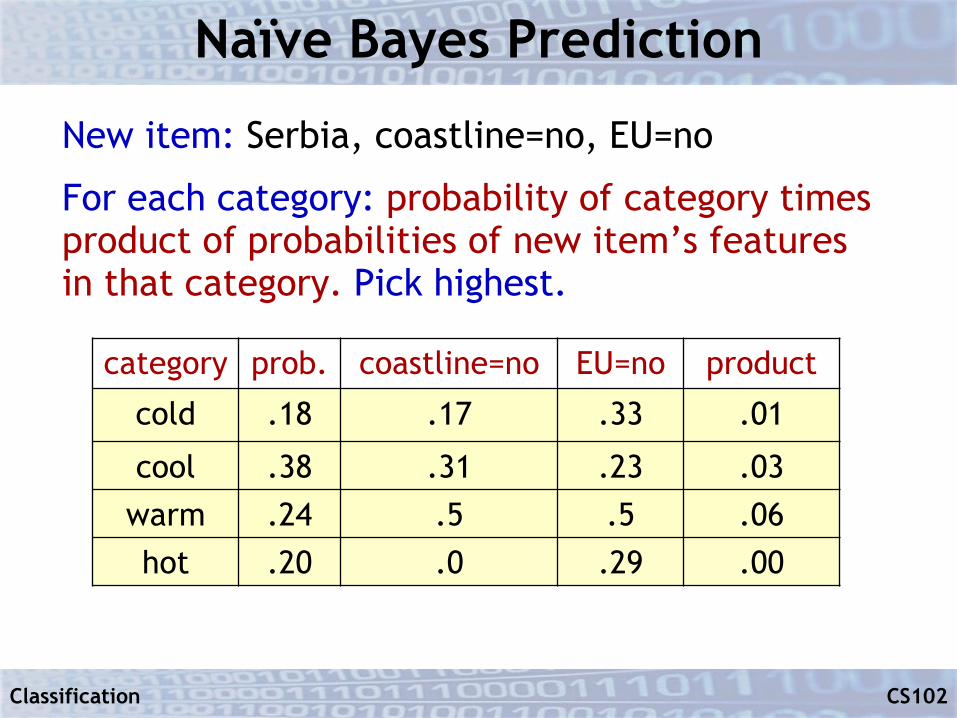
New item: Serbia, coastline=no, EU=no
For each category: probability of category times product of probabilities of new item’s features in that category. Pick highest.
category prob. coastline=no EU=no product
cold .18 .17 .33 .01
cool .38 .31 .23 .03warm .24 .5 .5 .06hot .20 .0 .29 .00
CS102Classification
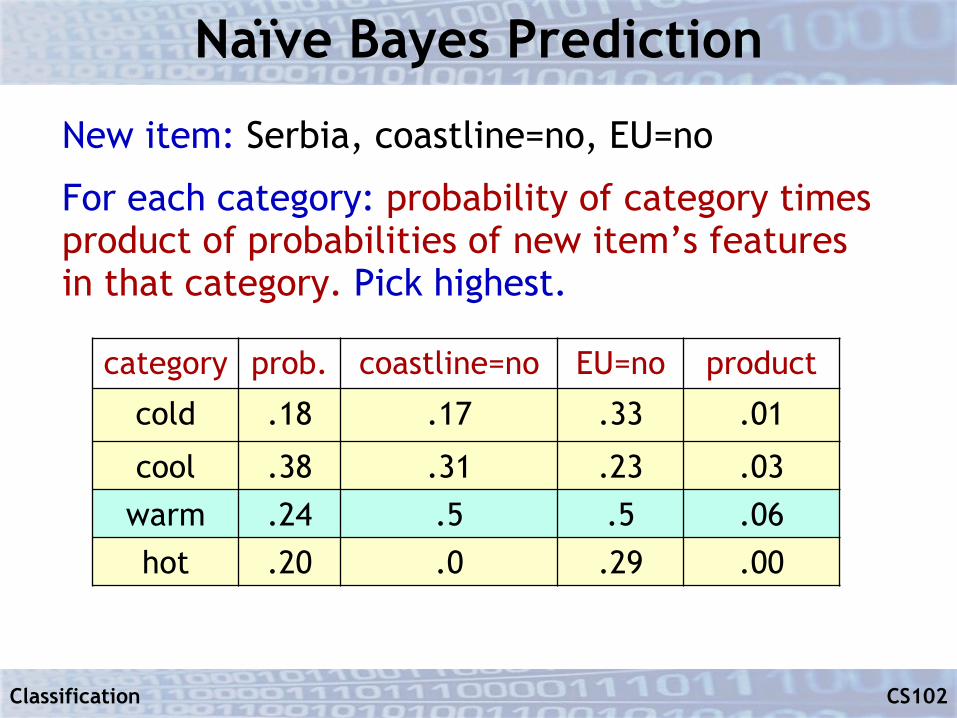
Naïve Bayes Prediction
New item: Serbia, coastline=no, EU=no
For each category: probability of category times product of probabilities of new item’s features in that category. Pick highest.
category prob. coastline=no EU=no product
cold .18 .17 .33 .01
cool .38 .31 .23 .03warm .24 .5 .5 .06hot .20 .0 .29 .00

CS102Classification
Naïve Bayes Prediction
New item: Austria, coastline=no, EU=yes
For each category: probability of category times product of probabilities of new item’s features in that category. Pick highest.
category prob. coastline=no EU=yes product
cold .18 .17 .67 .02
cool .38 .31 .77 .09warm .24 .5 .5 .06hot .20 .0 .71 .0
Many presentations of Naïve Bayesinclude an additional normalizationstep so the final products areprobabilities that sum to 1.0. Thechoice of label is unchanged, so we’veomitted that step for simplicity.

CS102Classification
Feature Selection
Real applications often have thousands of features
§ Naïve Bayes typically uses only some of the features, those most affecting the label
§ Decision trees also rely on choosing features that most affect the label
§ Feature selection is a key part of machine learning – an art and a science

CS102Classification
Training and TestCreated machine learning model from training data.
How do you know whether it’s a good model?ØTry it on known data
Feature Values Labels
TrainingData
Training Data
“Test Data”

CS102Classification
Other Terms You Might Hear
Logistic regression• Recall regression model is function f from
predictor values to numeric output value• For classification: from training data obtain one
regression function fL for each label LfL(feature-values) = probability of item having label L
Support Vector Machine• Two labels only (“binary classifier”)• Features = multidimensional space• From training data SVM finds
hyper-plane that best dividesspace according to labels

CS102Classification
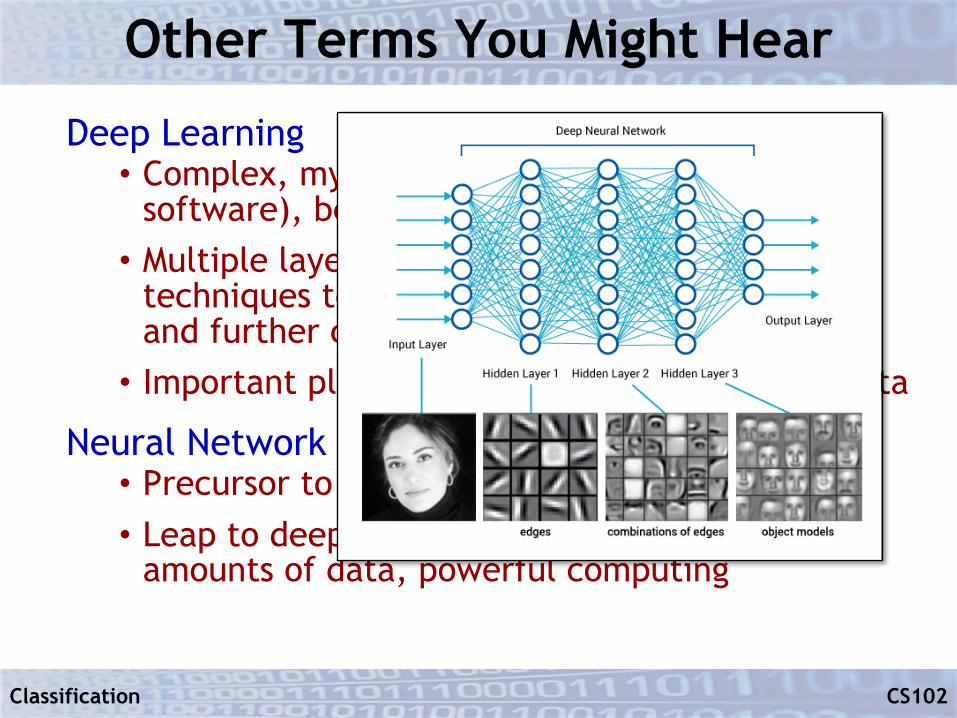
Other Terms You Might Hear
Deep Learning• Complex, mysterious (the ultimate “black box”
software), becoming extremely popular• Multiple layers, each layer uses classification
techniques to reduce complexity for next layer and further classification• Important plus: identifies features from raw data
Neural Network• Precursor to deep learning, typically two layers• Leap to deep learning enabled by massive
amounts of data, powerful computing
CS102Classification
Other Terms You Might Hear
Deep Learning• Complex, mysterious (the ultimate “black box”
software), becoming extremely popular• Multiple layers, each layer uses classification
techniques to reduce complexity for next layer and further classification• Important plus: identifies features from raw data
Neural Network• Precursor to deep learning, typically two layers• Leap to deep learning enabled by massive
amounts of data, powerful computing

CS102Classification
Classification Summary§ Supervised machine learning
§ Training data, each example:• Set of feature values – numeric or categorical• Categorical output value – label
§ Model is “function” from feature values to label• Use model to predict label for new feature values
§ Approaches we covered• K-nearest neighbors – relies on distance (or
similarity) function• Decision trees – relies on finding good trees/forests• Naïve Bayes – relies on conditional independence
assumption


![Pf cs102 programming-10 [structs]](https://static.documents.pub/doc/80x56/58a3269d1a28ab71398b5a3b/pf-cs102-programming-10-structs.jpg)


![Pf cs102 programming-9 [pointers]](https://static.documents.pub/doc/80x56/58a326c21a28ab71398b5a8d/pf-cs102-programming-9-pointers.jpg)


