30
CSIS 3600 Systems Analysis and Design Feasibility Analysis Intellectual Property of Dr. Meg Murray, dated Septem
| Date post: | 17-Dec-2015 |
| Category: |
Documents |
| Upload: | bertha-lawrence |
| View: | 221 times |
| Download: | 1 times |
CSIS 3600 Systems Analysis and Design
Feasibility Analysis
Intellectual Property of Dr. Meg Murray, dated September 2002

Feasibility
Feasibility studies the viability and the ability to successfully complete a proposed projectFeasibility studies often provide justification for the business caseThey answer the question: Is the project worth doing?

Categories of Feasibility
Feasibility is often divided into categories such as: Economic Technical Operational Schedule Legal and Contractual Political
Some areas of feasibility are more important for some projects than for others
Technical Feasibility
Technical feasibility is often viewed in relation to technical risk. Technical risk is contingent on four factors: project size project structure maturity (and standardization) of the
hardware, software, development tools, etc. development group's experience with the
application and technology area user group's experience with development
projects and application area.
Technical Feasibility and Risk
Some rules related to technical contingencies: Large projects are riskier than smaller projects. A system in which the requirements are easily
obtained and highly structured will be less risky than one in which requirement are messy, ill-structured, ill-defined or subject to the judgment of an individual.
The development of a system employing commonly used or standard technology will be less risky than one employing novel or non-standard technology.
Less risky when the user group is familiar with the systems development process and application area.

Degree of Risk
Applegate, McFarlan and McKenny, Corporate Information Systems Management, 2000
Low Structure
High Structure
High Familiarity with Technology/Application Area
Large Project
Low Risk Low Risk
Small Project
Very Low Risk
Very Low Risk
Low Familiarity with Technology/Application Area
Large Project
Very High Risk
Medium Risk
Small Project
High Risk Medium-low Risk
Organizational Feasibility
Organizational feasibility is assessing the likelihood that the project will attain its desired objectives.It addresses whether the problem is worth solving and whether there is 'buy in' from the user community and project champion. It also assesses the impact the proposed system will have on the organization (is it too big a change, is the organizational environment supportive of the impact the system will have....).

Schedule Feasibility
The main objective of scheduling feasibility is to assess whether the project can achieve the specified deadlines? And if not, what will the impact be? Scheduling feasibility also looks at the major factors that might attribute to project delays (loss of development staff, etc.)

Legal and Contractual This area looks at any legal ramifications related to the development of the system. Possible considerations in this area include: copyright infringement intellectual property rights antitrust legislation (which might limit the creation
of systems to share data with other organizations) reporting standards (financial, patient information,
etc.) nondisclosure infringements, etc.
These are all areas that need to be thought about and system developers should be aware of the rules that govern their industry and what types of regulations they must follow.
Political Feasibility Political feasibility assesses how key stakeholders in the organization view the proposed system. This is especially important if the system affects distribution of information which impacts the distribution of power within the institution. Stakeholders not supporting the project may take steps to block, disrupt or change the focus of the project. The word of advice: know what you are dealing with up front to avoid conflict and confrontation later.

Economic Feasibility
Economic feasibility is the financial assessment of the benefits of the project. There are several methods that are used to assess the financial viability of a project. These are covered in introductory finance courses (time value of money, expected return on investment, break-even analysis, etc.). This type of analysis is called a cost-benefit analysis and focuses on the 'bottom line.'

Economic Feasibility - Tangible vs Intangible
In economic feasibility, there are two areas that should be considered: tangible benefits and intangible benefits. Tangible benefits can be measured in dollars. Intangible benefits can't be measured with certainty and are hard to quantify (employee morale, reduction of waste, etc.). Most feasibility studies focus on the tangible but include some form of narrative statement related to intangible benefits.
One Time vs Recurring Costs
One time costs are those costs that are associated with project start-up and initiation. Include hardware, software, development
environments, etc.
Recurring costs are those costs that occur on a regular or recurring basis Includes leases, ISP or other subscription based
services, replacement of worn equipment, software maintenance licenses, etc.
Cost-Benefit Analysis
The best way to start an economic feasibility study is to list all the benefits of the proposed system and then all the costs. Certain costs are known (hardware, etc.), while others are estimated (development costs). Quantifiable benefits are usually estimated (reduced personnel measured by salary and benefit costs). The final goal is to compare the estimated costs to the estimated benefits. The process involves much estimation but you try to use the best educated (or informed) analysis that you can.

Cash Flow Method for Cost Benefit Analysis
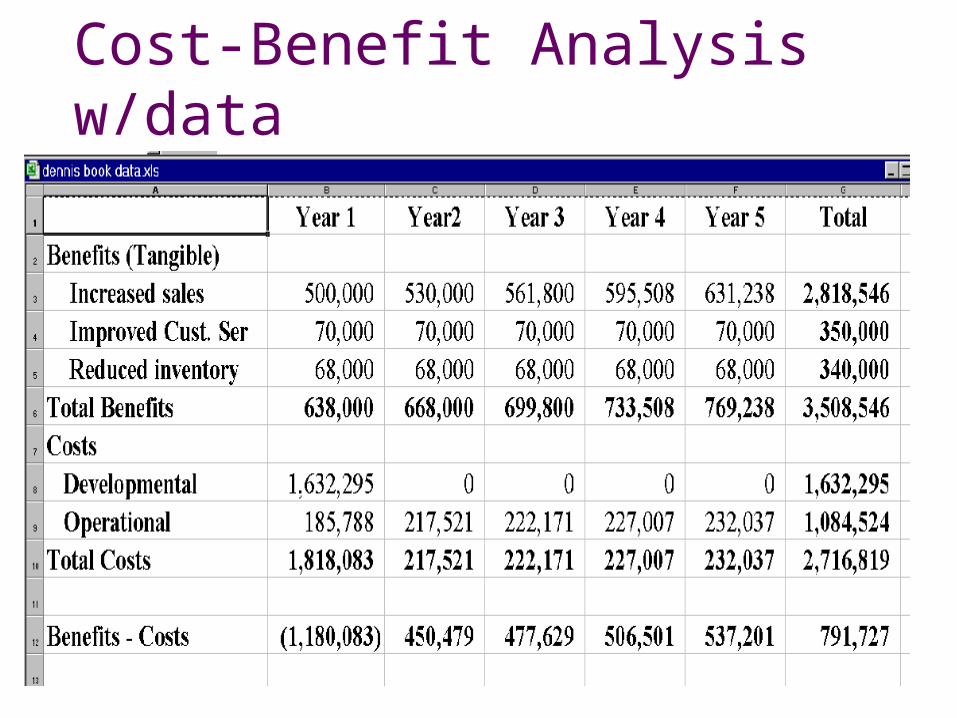
Cost-Benefit Analysis w/data
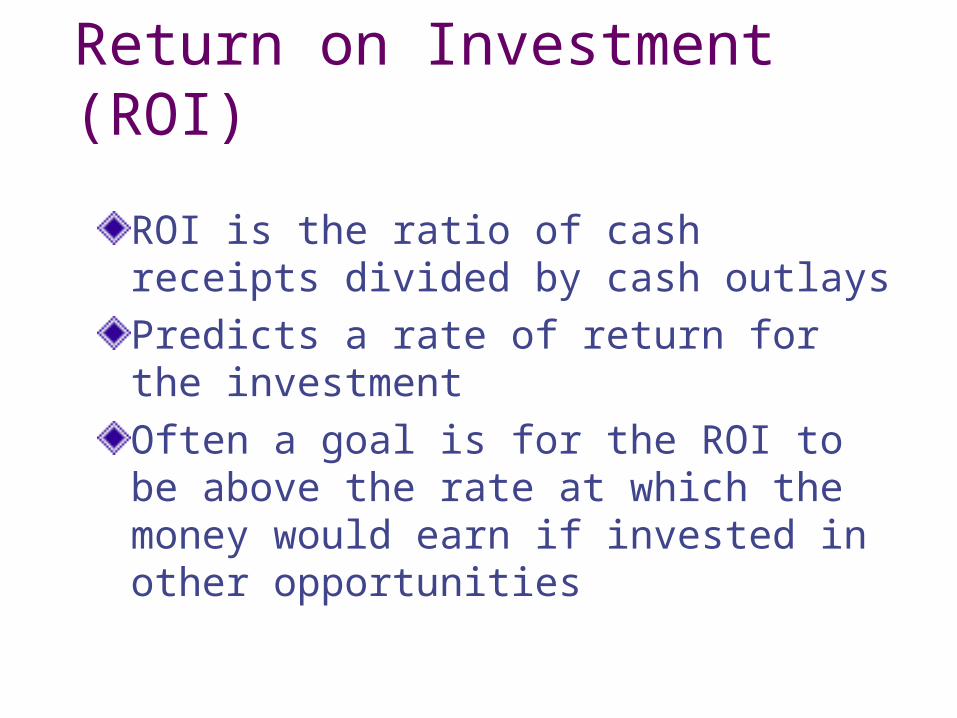
Return on Investment (ROI)
ROI is the ratio of cash receipts divided by cash outlaysPredicts a rate of return for the investmentOften a goal is for the ROI to be above the rate at which the money would earn if invested in other opportunities
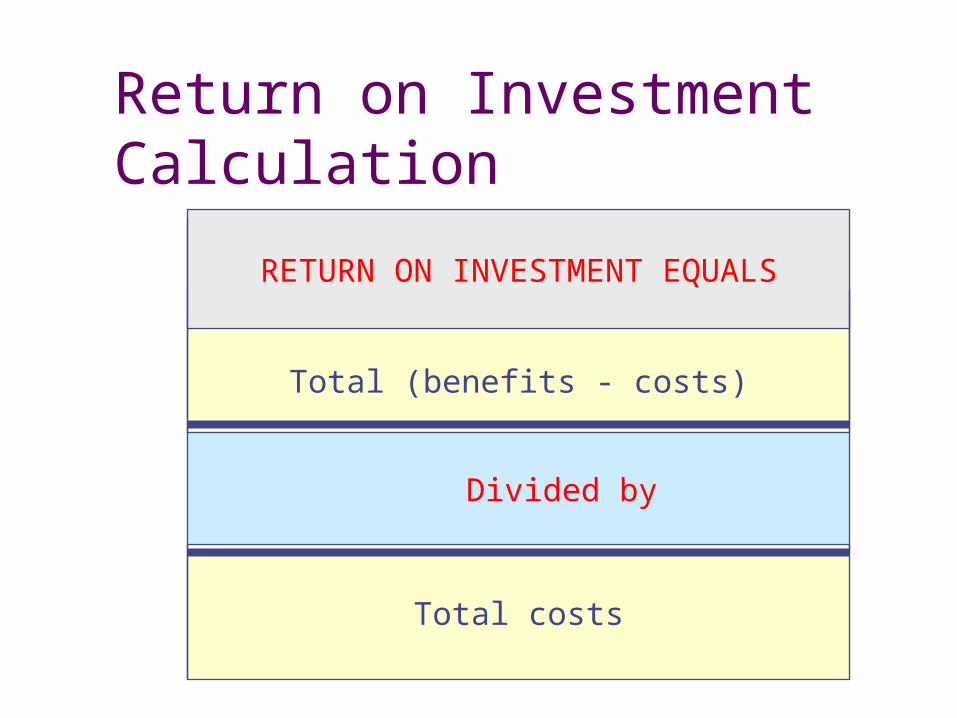
Total (benefits - costs)
Return on Investment Calculation
Total costs
RETURN ON INVESTMENT EQUALS
Divided by

ROI Example

Some Techniques to Assess Economic Feasibility Time Value of Money
Predicated on the principle that the value of money changes over time
Compares present cash outlays to future expected returns
Common measurement - Net Present Value (NPV) Present Value is the value of a dollar in the future
(usually expressed in years) It is calculated based on a discount rate
(percentage for borrowing or investing) The formula for the PV is 1/(1+i)n
i = discount rate; n = year
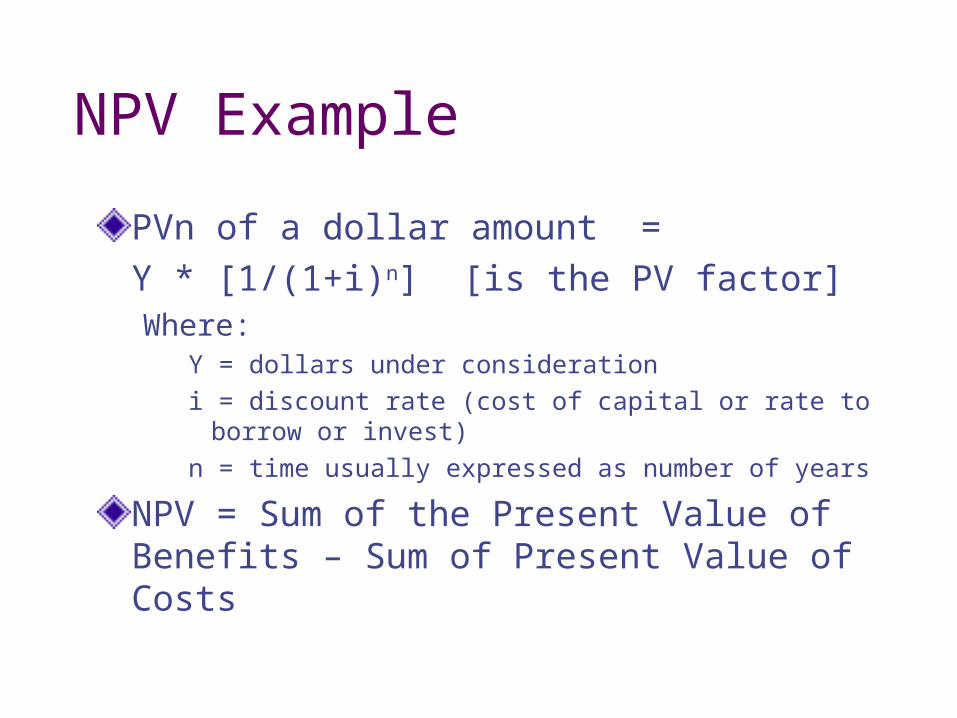
NPV Example
PVn of a dollar amount = Y * [1/(1+i)n] [is the PV factor]
Where:Y = dollars under considerationi = discount rate (cost of capital or rate to borrow or
invest)n = time usually expressed as number of years
NPV = Sum of the Present Value of Benefits – Sum of Present Value of Costs
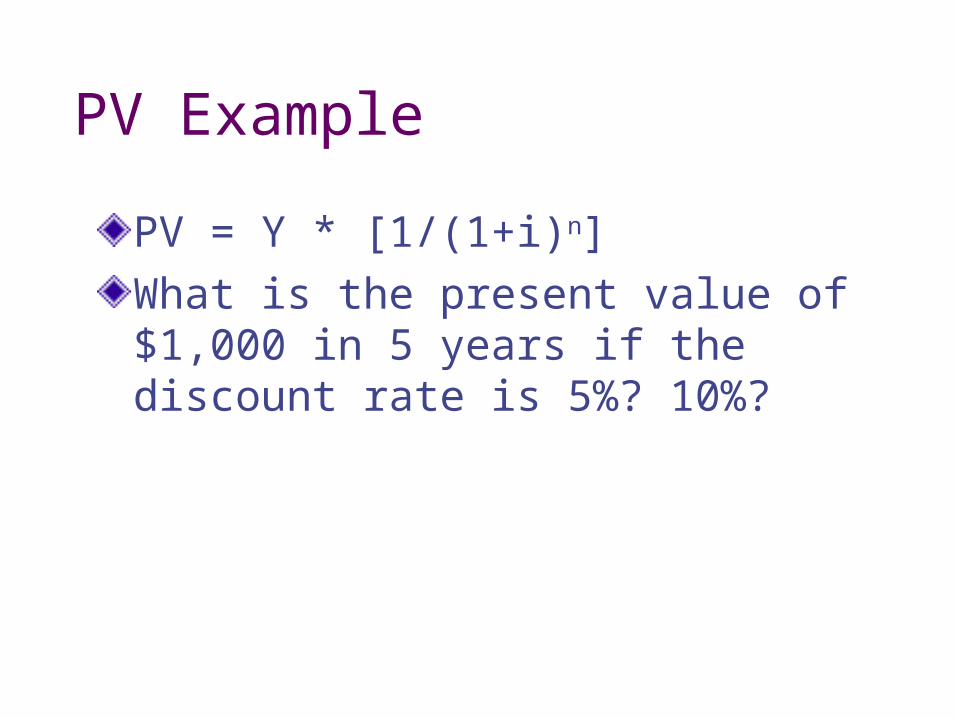
PV Example
PV = Y * [1/(1+i)n] What is the present value of $1,000 in 5 years if the discount rate is 5%? 10%?
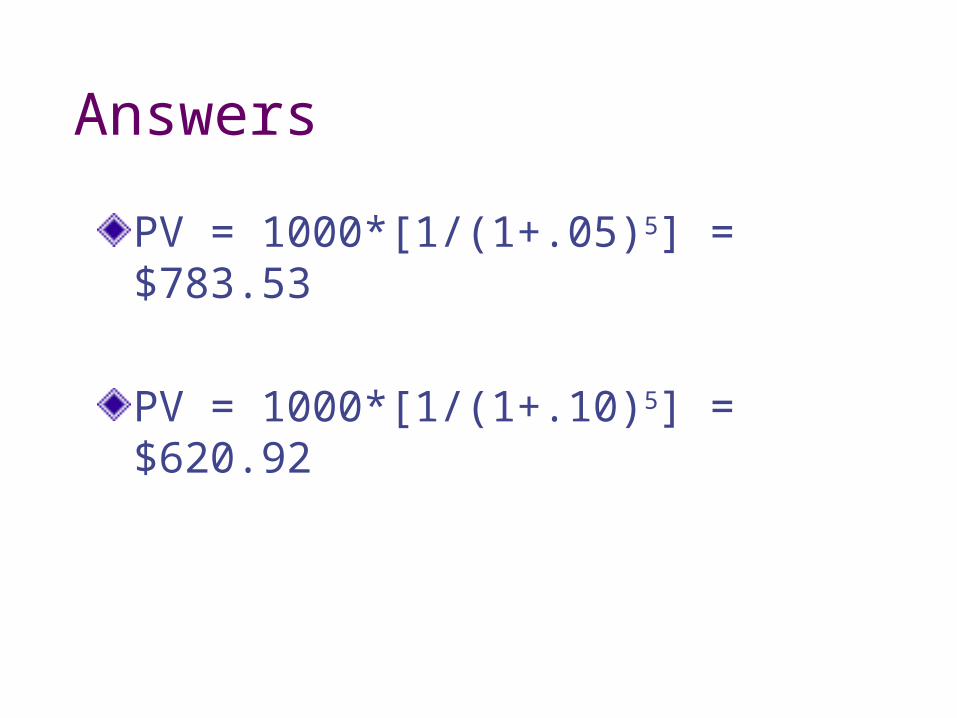
Answers
PV = 1000*[1/(1+.05)5] = $783.53
PV = 1000*[1/(1+.10)5] = $620.92

NPV Example
NPV is the sum of the PVs over a period of time or NPV = Sum of PVs
PV year 1 + PV year2 + PV year3…
Overall NPV = NPV of Benefits – NPV of Costs
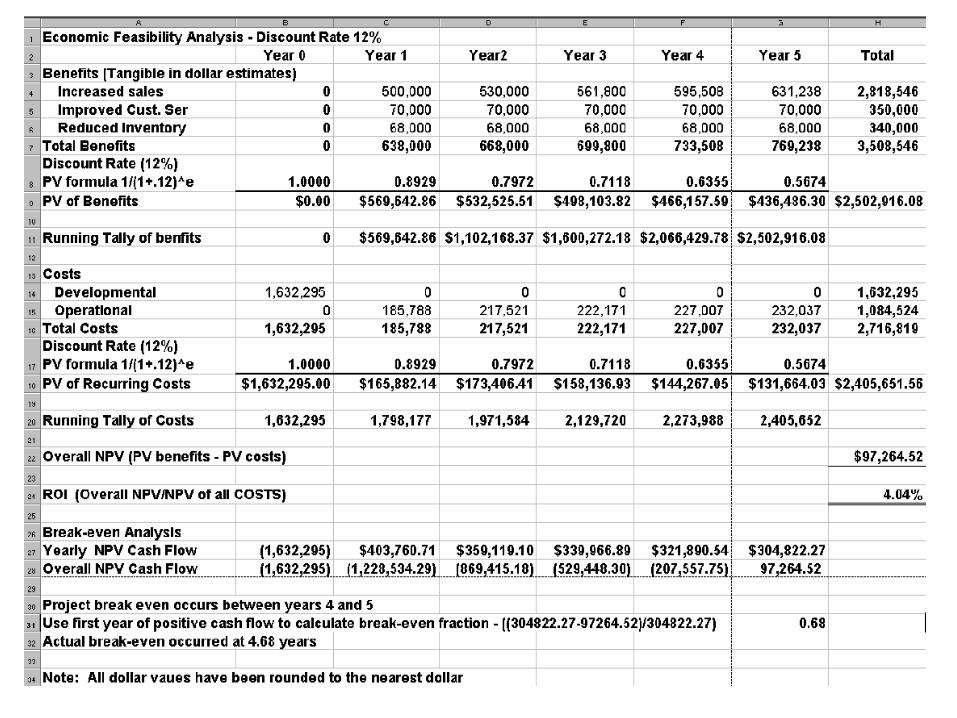
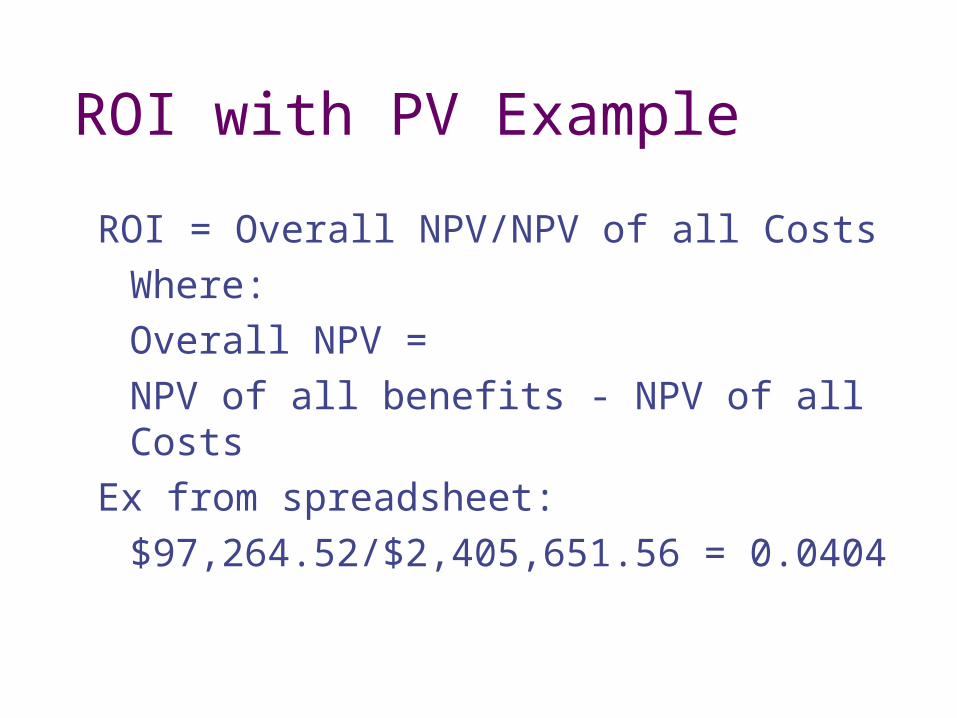
ROI with PV Example
ROI = Overall NPV/NPV of all CostsWhere:
Overall NPV = NPV of all benefits - NPV of all
Costs Ex from spreadsheet:
$97,264.52/$2,405,651.56 = 0.0404

Break-Even Analysis
Projects the time it takes for the cumulative cash flow from a project to equal the investmentThe time at which the system pays for itselfIdentified by the first year of Overall Positive Cash FlowCost = Revenue or Costs = Benefits Example from spreadsheet: Between year 4 (benefits = $304,822.27)
and year 5 (costs = $97,264.52)

BEA Example
Overall cash flow represents cash flows for all preceding yearsUse the figures for the year with first positive overall NPV cash flow (the first year where benefits exceed costs)Ratio results indicate the fractional part of the year at which BE occurs Break-Even Ratio =
Yearly NPV cash flow - Overall NPV cash flow Yearly NPV Cash Flow
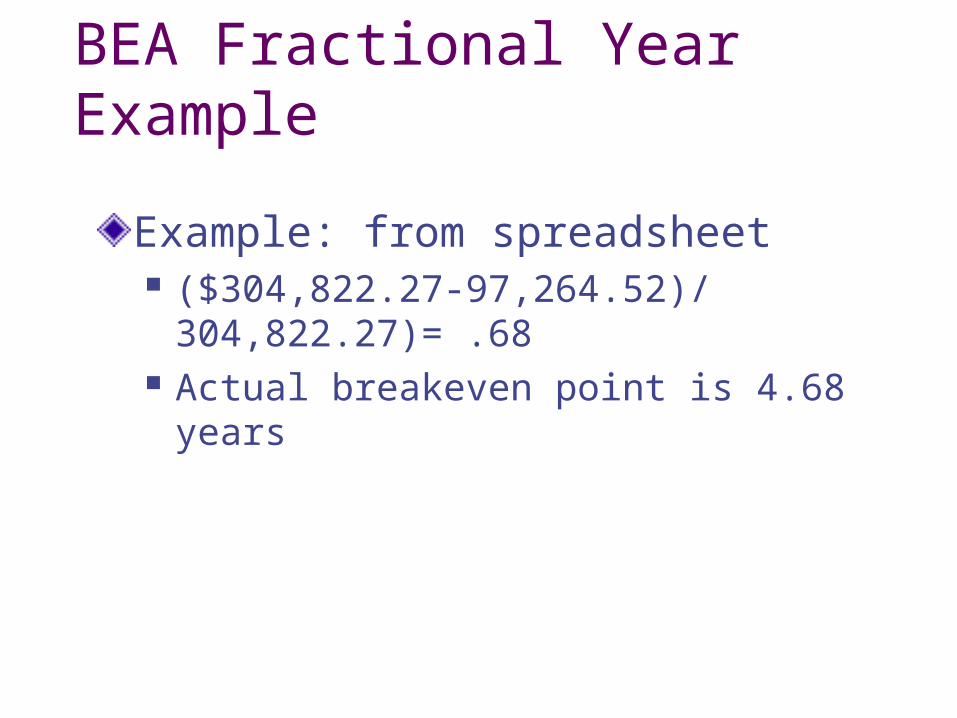
BEA Fractional Year Example
Example: from spreadsheet ($304,822.27-97,264.52)/
304,822.27)= .68 Actual breakeven point is 4.68 years
Quote of the Week
"Far better an approximate answer to the right question than the exact answer to the wrong question, which can always be made precise."
John Tukey, of Princeton University


