DISCLOSURE APPENDIX CONTAINS ANALYST CERTIFICATIONS AND THE STATUS OF NON US ANALYSTS. US Disclosure: Credit Suisse does and seeks to do business with companies covered in its research reports. As a result, investors should be aware that the Firm may have a conflict of interest that could affect the objectivity of this report. Investors should consider this report as only a single factor in making their investment decision. CREDIT SUISSE SECURITIES RESEARCH & ANALYTICS BEYOND INFORMATION ® Client-Driven Solutions, Insights, and Access 14 August 2013 Asia Pacific/Australia Equity Research Biotechnology (Health Care (AU)) CSL (CSL.AX / CSL AU) RESULTS Behring strength to offset flu blues ■ Following CSL’s FY13 result, we have made minor downgrades to earnings over the forecast period (-2-3%) and minimal changes in outer years. Our target price (A$74.55) and Outperform rating remain unchanged. Behring's revenue growth of 11% was strong considering the addition of Broadmeadows sales into the segment as was expansion in group EBIT margin. That said, we do note NPAT quality was impacted by a number of favourable factors including a Swiss pension plan amendment (US$20mn), a provision reversal (~US$8mn) from the Aventis Behring acquisition and a low tax rate (17%). ■ FY14 guidance suggests Behring will power ahead. With BioCSL unlikely to see a near-term turnaround in earnings contribution, and based on 13% group R&D expense growth, company guidance relies on CSL Behring delivering another solid performance. With demand for Hizentra unlikely to abate, recent US Kcentra approval, Berinert label expansion, continue shift to albumin over HES and a raft of internal projects to drive fractionation costs lower – we believe 10%cc NPAT growth is indeed achievable. Looking further ahead the potential value of CSL’s R&D pipeline seems clear and includes: 1) Rise of several specialty products: previous work we have done on fibrinogen and alpha-one highlights the medium-term growth opportunities for this subset of specialty products; 2) Hizentra use in CIDP (currently in Phase 3); and 3) Commercialisation of the next generation recombinant clotting factors. ■ Catalyst: Monthly US PPTA data; additional share buyback program. ■ Valuation: Based on revised CS EPS forecasts CSL is trading on 21.5x 12-mth forward P/E, a 43% premium to the ASX200 ex-financials vs 5 year average of 49%. Total return forecast in perspective Mean^ CS tgt^ Sh Prc -40% -30% -20% -10% 0% 10% 20% 30% 40% 50% 12mth Volatility* 52wk Hi-Lo IBES Consensus target return^ Performance Over 1M 3M 12M Absolute (%) 0.4 6.7 64.1 Relative (%) -3.2 6.8 44.0 Financial and valuation metrics Year 06/13A 06/14E 06/15E 06/16E Revenue (US$mn) 4,950.6 5,403.4 5,785.0 6,135.6 EBITDA (US$mn) 1,687.3 1,930.2 2,099.2 2,288.2 EBIT (US$mn) 1,485.7 1,717.8 1,872.3 2,046.7 Net income (US$mn) 1,216.3 1,350.6 1,487.5 1,647.5 EPS (CS adj.) (USc) 243.10 275.63 302.52 333.41 Change from previous EPS (%) n.a. -3.1 -2.7 -1.9 Consensus EPS (USc) n.a. 281.80 311.70 339.80 EPS growth (%) 23.4 13.4 9.8 10.2 P/E (x) 24.6 21.7 19.8 17.9 Dividend (USc) 102.00 115.83 127.25 140.29 Dividend yield (%) 1.7 1.9 2.1 2.3 P/B (x) 9.7 7.7 6.3 5.2 Net debt/equity (%) 30.5 8.7 net cash net cash Relative performance versus S&P ASX 200.See Reference Appendix for a description of the chart. Source: Credit Suisse estimates, * Consensus, mean range from Thomson Reuters Source: Company data, ASX, Credit Suisse estimates, * Adj. for goodwill, notional interest and unusual items. Relative P/E against ASX/S&P200 based on pre GW in AUD. Company PE calculation is based on displayed EPS Currency Rating OUTPERFORM* Price (14 Aug 13, A$) 65.79 Target price (A$) 74.55¹ Market cap. (A$mn) 32,045.78 Yr avg. mthly trading (A$mn) 1,568 Last month's trading (A$mn) 1,458 Projected return: Capital gain (%) 13.3 Dividend yield (net %) 2.0 Total return (%) 15.3 52-week price range 67.8 - 39.9 * Stock ratings are relative to the relevant country benchmark. ¹Target price is for 12 months. Research Analysts Saul Hadassin 61 2 8205 4679 [email protected]William Dunlop, CFA 61 2 8205 4405 [email protected]
Transcript
DISCLOSURE APPENDIX CONTAINS ANALYST CERTIFICATIONS AND THE STATUS OF NON US ANALYSTS. US Disclosure: Credit Suisse does and seeks to do business with companies covered in its research reports. As a result, investors should be aware that the Firm may have a conflict of interest that could affect the objectivity of this report. Investors should consider this report as only a single factor in making their investment decision.
CREDIT SUISSE SECURITIES RESEARCH & ANALYTICS BEYOND INFORMATION®
Client-Driven Solutions, Insights, and Access
14 August 2013
Asia Pacific/Australia
Equity Research
Biotechnology (Health Care (AU))
CSL
(CSL.AX / CSL AU) RESULTS
Behring strength to offset flu blues
■ Following CSL’s FY13 result, we have made minor downgrades to earnings over the forecast period (-2-3%) and minimal changes in outer years. Our target price (A$74.55) and Outperform rating remain unchanged. Behring's revenue growth of 11% was strong considering the
addition of Broadmeadows sales into the segment as was expansion in group EBIT margin. That said, we do note NPAT quality was impacted by a number of favourable factors including a Swiss pension plan amendment (US$20mn), a provision reversal (~US$8mn) from the Aventis Behring acquisition and a low tax rate (17%).
■ FY14 guidance suggests Behring will power ahead. With BioCSL unlikely to see a near-term turnaround in earnings contribution, and based on 13% group R&D expense growth, company guidance relies on CSL Behring delivering another solid performance. With demand for Hizentra unlikely to abate, recent US Kcentra approval, Berinert label expansion, continue shift to albumin over HES and a raft of internal projects to drive fractionation costs lower – we believe 10%cc NPAT growth is indeed achievable. Looking further ahead the potential value of CSL’s R&D pipeline seems clear and includes: 1) Rise of several specialty products: previous work we have done on fibrinogen and alpha-one highlights the medium-term growth opportunities for this subset of specialty products; 2) Hizentra use in CIDP (currently in Phase 3); and 3) Commercialisation of the next generation recombinant clotting factors.
■ Catalyst: Monthly US PPTA data; additional share buyback program.
■ Valuation: Based on revised CS EPS forecasts CSL is trading on 21.5x 12-mth forward P/E, a 43% premium to the ASX200 ex-financials vs 5 year average of 49%.
■ Flattish recombinant FVIII (Helixate) sales growth was disappointing with management
noting a large number of trials of next generation products (i.e., long acting) resulting
in patients moving off current therapy. In theory as these trials conclude a concomitant
pick up in existing product use should be seen. However, based on assumed Biogen
Idec entry in CY14 of their long acting Fc fusion rFVIII, we assume Helixate sales
continue to fall over the forecast period until CSL introduces their own single chain
rFVIII product.
■ For pd-coags, strong Beriate volume growth into developing regions (Latin America,
Poland) seems to be more than offsetting a lower average sales price for such sales.
That said we do not anticipate material uplift to pd-coag revenue growth over the
forecast period.
Specialty products – perioperative bleeding leads the way
■ Specialty product growth of 17% was a standout driven by the perioperative bleeding
category (fibrinogen/PCC) which registered 26% growth vs pcp.
■ Other specialty product growth (i.e., Berinert/Zemaira) of 14% was also strong
underpinned by label expansion for Berinert. Negative wound healing growth
disappointing although the products only contribute ~13% of the total specialty basket.
■ We continue to see strong medium-to-long-term opportunities for this basket of
products (ex-wound healing) based on favourable clinical results from a number of
trials currently being conducted. Of these, fibrinogen alone appears to have potential
blockbuster (estimates range from US$500mn-US$1bn in terms of theoretical market
size) assuming a true paradigm shift in the way intra-operative bleeding is managed
(this will be determined by the outcome of a number of Phase 2 and 3 clinical trials
that are currently underway).
Underlying CSLB margins hard to analyse but group margin trend highlights
operating leverage
■ CSLB underlying EBIT margin is hard to ascertain and was not disclosed by
management. The reported EBIT margin of 34.7% was up materially on pcp but
slightly below our forecast.
■ Scale benefits in fractionation combined with increased operating efficiencies in
plasma collection likely contributed to margin uplift.
14 August 2013
CSL
(CSL.AX / CSL AU) 7
■ Looking forward we expect incremental organic EBIT margin improvement to be driven
by: 1) scale leverage - as fixed costs in fractionation (shown in Figure 5) and plasma
collection are not insubstantial; 2) small improvements in key product yields
(particularly IG).
Figure 5: Estimated composition of COGS per litre
Bags and filters
25.4%
Resins
5.2%
Buffers and solids
10.3%
Labour and quality control
12.4%
Utilites and Other
5.6%
Plasma collection
40.9%
0% 10% 20% 30% 40% 50% 60% 70% 80% 90% 100%
% of total COGS per litre
Source: ProMetic, Credit Suisse estimates
BioCSL – influenza strain
BioCSL revenues of US$460mn (+8%cc) slightly ahead of our forecast however margins
were significantly below (reported divisional EBIT of US$-1.5mn vs US$18mn forecast).
■ Management noted a high AUD cost base and a 6% decline in flu sales on a constant
currency base as key contributors to lack of operating earnings for the new segment.
ANZ Gardasil sales were strong on the back of AUS boys vaccination program.
■ Looking forward we do not envisage a quick turnaround in terms of earnings
generation from BioCSL. While a sale of the division may seem an obvious solution,
contractual arrangements with Governments regarding supply of flu antigen (e.g., in a
pandemic) could prohibit this occurring in the short-to-medium term.
IP licensing
■ HPV royalties of US$128mn were in line with our forecast although IPL EBIT was
below our forecast due to R&D cost allocation (monoclonal AB development;
recombinant clotting factors). Looking forward we assume HPV royalties only are
captured in this segment. Following significant return to growth in FY13 (Japan rollout,
approval in males) we anticipate HPV royalty growth easing over the forecast period.
14 August 2013
CSL
(CSL.AX / CSL AU) 8
Reference Appendix Our new “Total return forecast in perspective” chart helps visualize Credit Suisse and consensus views of a company’s 12-month return within the
context of forecasting risks and its historical trading pattern:
12mth Volatility is calculated as the annualised standard deviation of weekly total return series over the past 12 months. It illustrates variability of
stock returns; in other words, risk. The way to think about it is that one would rather take 10% forecast return from a stock that has 20% volatility,
than from the stock that has 40% volatility. The shaded area shows the one standard deviation range based on past 12 months volatility. In statistical
terms, once you make a number of brave assumptions, there is a 68% probability that the share price will end up inside that range in 12 months time.
52wk Hi-Lo is maximum and minimum daily closing price over the past 52 weeks. It is often handy to know the price momentum especially when the
stock is trading close to its highs and lows: Is the stock
trading close to its peak? Is the momentum against the stock?
*Consensus is IBES consensus supplied by Thomson Reuters. IBES is a survey of sell side research analysts, collecting a few dozen data
points such as EPS, DPS, Sales, Target Price, ROE and so on. *Mean is the average of target returns, while the shaded area around the mean
represents the range of estimates from the lowest to the highest estimate. This aids visualisation of a number of important factors such as: the range
of analyst estimates; where Credit Suisse’s estimates on this stock sit relative to consensus; and where the share price is relative to consensus
mean and consensus range target.
Target return is calculated as capital gain plus forecast dividend yield (net) over the next 12 months. For “CS tgt” we have used Credit Suisse’s
target price and Credit Suisse forecast for 12-month forward dividend, grossed up for franking. For the consensus mean and range, we have used
consensus target price and consensus dividend forecasts for 12 month forward.
14 August 2013
CSL
(CSL.AX / CSL AU) 9
Companies Mentioned (Price as of 14-Aug-2013)
Baxter International Inc. (BAX.N, $73.83) CSL Ltd (CSL.AX, A$65.79, OUTPERFORM, TP A$74.55) Grifols (GRLS.MC, €32.0)
Disclosure Appendix
Important Global Disclosures
I, Saul Hadassin, certify that (1) the views expressed in this report accurately reflect my personal views about all of the subject companies and securities and (2) no part of my compensation was, is or will be directly or indirectly related to the specific recommendations or views expressed in this report.
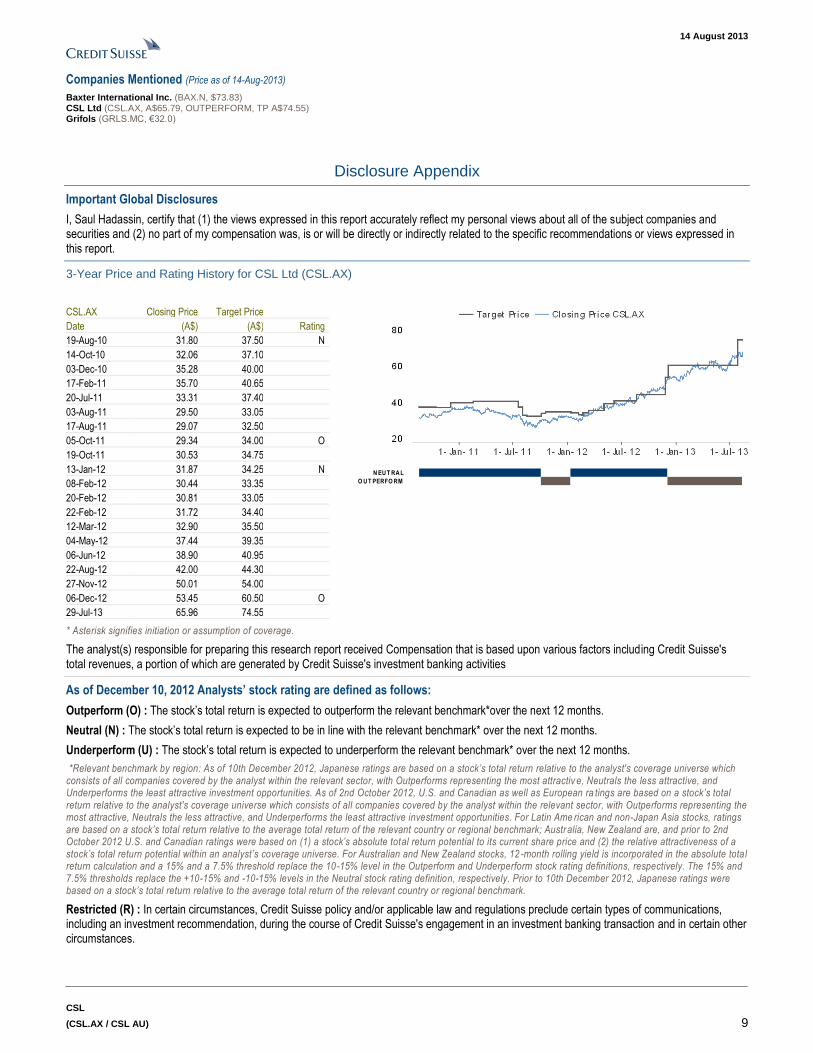
3-Year Price and Rating History for CSL Ltd (CSL.AX)
CSL.AX Closing Price Target Price
Date (A$) (A$) Rating
19-Aug-10 31.80 37.50 N
14-Oct-10 32.06 37.10
03-Dec-10 35.28 40.00
17-Feb-11 35.70 40.65
20-Jul-11 33.31 37.40
03-Aug-11 29.50 33.05
17-Aug-11 29.07 32.50
05-Oct-11 29.34 34.00 O
19-Oct-11 30.53 34.75
13-Jan-12 31.87 34.25 N
08-Feb-12 30.44 33.35
20-Feb-12 30.81 33.05
22-Feb-12 31.72 34.40
12-Mar-12 32.90 35.50
04-May-12 37.44 39.35
06-Jun-12 38.90 40.95
22-Aug-12 42.00 44.30
27-Nov-12 50.01 54.00
06-Dec-12 53.45 60.50 O
29-Jul-13 65.96 74.55
* Asterisk signifies initiation or assumption of coverage.
N EU T RA L
O U T PERFO RM
The analyst(s) responsible for preparing this research report received Compensation that is based upon various factors including Credit Suisse's total revenues, a portion of which are generated by Credit Suisse's investment banking activities
As of December 10, 2012 Analysts’ stock rating are defined as follows:
Outperform (O) : The stock’s total return is expected to outperform the relevant benchmark*over the next 12 months.
Neutral (N) : The stock’s total return is expected to be in line with the relevant benchmark* over the next 12 months.
Underperform (U) : The stock’s total return is expected to underperform the relevant benchmark* over the next 12 months.
*Relevant benchmark by region: As of 10th December 2012, Japanese ratings are based on a stock’s total return relative to the analyst's coverage universe which consists of all companies covered by the analyst within the relevant sector, with Outperforms representing the most attractiv e, Neutrals the less attractive, and Underperforms the least attractive investment opportunities. As of 2nd October 2012, U.S. and Canadian as well as European ra tings are based on a stock’s total return relative to the analyst's coverage universe which consists of all companies covered by the analyst within the relevant sector, with Outperforms representing the most attractive, Neutrals the less attractive, and Underperforms the least attractive investment opportunities. For Latin Ame rican and non-Japan Asia stocks, ratings are based on a stock’s total return relative to the average total return of the relevant country or regional benchmark; Australia, New Zealand are, and prior to 2nd October 2012 U.S. and Canadian ratings were based on (1) a stock’s absolute total return potential to its current share price and (2) the relative attractiveness of a stock’s total return potential within an analyst’s coverage universe. For Australian and New Zealand stocks, 12 -month rolling yield is incorporated in the absolute total return calculation and a 15% and a 7.5% threshold replace the 10-15% level in the Outperform and Underperform stock rating definitions, respectively. The 15% and 7.5% thresholds replace the +10-15% and -10-15% levels in the Neutral stock rating definition, respectively. Prior to 10th December 2012, Japanese ratings were based on a stock’s total return relative to the average total return of the relevant country or regional benchmark.
Restricted (R) : In certain circumstances, Credit Suisse policy and/or applicable law and regulations preclude certain types of communications, including an investment recommendation, during the course of Credit Suisse's engagement in an investment banking transaction and in certain other circumstances.
14 August 2013
CSL
(CSL.AX / CSL AU) 10
Volatility Indicator [V] : A stock is defined as volatile if the stock price has moved up or down by 20% or more in a month in at least 8 of the past 24 months or the analyst expects significant volatility going forward.
Analysts’ sector weightings are distinct from analysts’ stock ratings and are based on the analyst’s expectations for the fundamentals and/or valuation of the sector* relative to the group’s historic fundamentals and/or valuation:
Overweight : The analyst’s expectation for the sector’s fundamentals and/or valuation is favorable over the next 12 months.
Market Weight : The analyst’s expectation for the sector’s fundamentals and/or valuation is neutral over the next 12 months.
Underweight : The analyst’s expectation for the sector’s fundamentals and/or valuation is cautious over the next 12 months.
*An analyst’s coverage sector consists of all companies covered by the analyst within the relevant sector. An analyst may cover multiple sectors.
Credit Suisse's distribution of stock ratings (and banking clients) is:
Global Ratings Distribution
Rating Versus universe (%) Of which banking clients (%)
Outperform/Buy* 42% (53% banking clients)
Neutral/Hold* 40% (50% banking clients)
Underperform/Sell* 15% (39% banking clients)
Restricted 3%
*For purposes of the NYSE and NASD ratings distribution disclosure requirements, our stock ratings of Outperform, Neutral, and Underperform most closely correspond to Buy, Hold, and Sell, respectively; however, the meanings are not the same, as our stock ratings are determined on a relative basis. (Please refer to definitions above.) An investor's decision to buy or sell a security should be based on investment objectives, current holdin gs, and other individual factors.
Credit Suisse’s policy is to update research reports as it deems appropriate, based on developments with the subject company, the sector or the market that may have a material impact on the research views or opinions stated herein.
Credit Suisse's policy is only to publish investment research that is impartial, independent, clear, fair and not misleading. For more detail please refer to Credit Suisse's Policies for Managing Conflicts of Interest in connection with Investment Research: http://www.csfb.com/research and analytics/disclaimer/managing_conflicts_disclaimer.html
Credit Suisse does not provide any tax advice. Any statement herein regarding any US federal tax is not intended or written to be used, and cannot be used, by any taxpayer for the purposes of avoiding any penalties.
Price Target: (12 months) for CSL Ltd (CSL.AX)
Method: Our 12-month forward target price of $74.55 for CSL has been derived with a 10-year forward discounted cash flow (DCF) valuation using an equity beta of 0.8, risk free rate of 4.0%, an equity market risk premium of 6.0% and a nominal terminal growth rate assumption of 2.2%.
Risk: The risks to our target price of $74.55 on CSL include the potential impact of less-than-robust plasma products pricing and volume growth, failure to receive regulatory approval for marketing of new products, increased manufacturing costs, and failure of R&D products to progress through clinical trials to commercialisation.
Please refer to the firm's disclosure website at www.credit-suisse.com/researchdisclosures for the definitions of abbreviations typically used in the target price method and risk sections.
See the Companies Mentioned section for full company names
Credit Suisse expects to receive or intends to seek investment banking related compensation from the subject company (CSL.AX) within the next 3 months.
Important Regional Disclosures
Singapore recipients should contact Credit Suisse AG, Singapore Branch for any matters arising from this research report.
The analyst(s) involved in the preparation of this report have not visited the material operations of the subject company (CSL.AX) within the past 12 months
Restrictions on certain Canadian securities are indicated by the following abbreviations: NVS--Non-Voting shares; RVS--Restricted Voting Shares; SVS--Subordinate Voting Shares.
Individuals receiving this report from a Canadian investment dealer that is not affiliated with Credit Suisse should be advised that this report may not contain regulatory disclosures the non-affiliated Canadian investment dealer would be required to make if this were its own report.
For Credit Suisse Securities (Canada), Inc.'s policies and procedures regarding the dissemination of equity research, please visit http://www.csfb.com/legal_terms/canada_research_policy.shtml.
As of the date of this report, Credit Suisse acts as a market maker or liquidity provider in the equities securities that are the subject of this report.
14 August 2013
CSL
(CSL.AX / CSL AU) 11
Principal is not guaranteed in the case of equities because equity prices are variable.
Commission is the commission rate or the amount agreed with a customer when setting up an account or at any time after that.
To the extent this is a report authored in whole or in part by a non-U.S. analyst and is made available in the U.S., the following are important disclosures regarding any non-U.S. analyst contributors: The non-U.S. research analysts listed below (if any) are not registered/qualified as research analysts with FINRA. The non-U.S. research analysts listed below may not be associated persons of CSSU and therefore may not be subject to the NASD Rule 2711 and NYSE Rule 472 restrictions on communications with a subject company, public appearances and trading securities held by a research analyst account.
Credit Suisse Equities (Australia) Limited .....................................................................................................Saul Hadassin ; William Dunlop, CFA
For Credit Suisse disclosure information on other companies mentioned in this report, please visit the website at www.credit-suisse.com/researchdisclosures or call +1 (877) 291-2683.
14 August 2013
CSL
(CSL.AX / CSL AU) 12
References in this report to Credit Suisse include all of the subsidiaries and affiliates of Credit Suisse operating under its investment banking division. For more information on our structure, please use the following link: https://www.credit-suisse.com/who_we_are/en/This report may contain material that is not directed to, or intended for distribution to or use by, any person or entity who is a citizen or resident of or located in any locality, state, country or other jurisdiction where such distribution, publication, availability or use would be contrary to law or regulation or which would subject Credit Suisse AG or its affiliates ("CS") to any registration or licensing requirement within such jurisdiction. All material presented in this report, unless specifically indicated otherwise, is under copyright to CS. None of the material, nor its content, nor any copy of it, may be altered in any way, transmitted to, copied or distributed to any other party, without the prior express written permission of CS. All trademarks, service marks and logos used in this report are trademarks or service marks or registered trademarks or service marks of CS or its affiliates. The information, tools and material presented in this report are provided to you for information purposes only and are not to be used or considered as an offer or the solicitation of an offer to sell or to buy or subscribe for securities or other financial instruments. CS may not have taken any steps to ensure that the securities referred to in this report are suitable for any particular investor. CS will not treat recipients of this report as its customers by virtue of their receiving this report. The investments and services contained or referred to in this report may not be suitable for you and it is recommended that you consult an independent investment advisor if you are in doubt about such investments or investment services. Nothing in this report constitutes investment, legal, accounting or tax advice, or a representation that any investment or strategy is suitable or appropriate to your individual circumstances, or otherwise constitutes a personal recommendation to you. CS does not advise on the tax consequences of investments and you are advised to contact an independent tax adviser. Please note in particular that the bases and levels of taxation may change. Information and opinions presented in this report have been obtained or derived from sources believed by CS to be reliable, but CS makes no representation as to their accuracy or completeness. CS accepts no liability for loss arising from the use of the material presented in this report, except that this exclusion of liability does not apply to the extent that such liability arises under specific statutes or regulations applicable to CS. This report is not to be relied upon in substitution for the exercise of independent judgment. CS may have issued, and may in the future issue, other communications that are inconsistent with, and reach different conclusions from, the information presented in this report. Those communications reflect the different assumptions, views and analytical methods of the analysts who prepared them and CS is under no obligation to ensure that such other communications are brought to the attention of any recipient of this report. CS may, to the extent permitted by law, participate or invest in financing transactions with the issuer(s) of the securities referred to in this report, perform services for or solicit business from such issuers, and/or have a position or holding, or other material interest, or effect transactions, in such securities or options thereon, or other investments related thereto. In addition, it may make markets in the securities mentioned in the material presented in this report. CS may have, within the last three years, served as manager or co-manager of a public offering of securities for, or currently may make a primary market in issues of, any or all of the entities mentioned in this report or may be providing, or have provided within the previous 12 months, significant advice or investment services in relation to the investment concerned or a related investment. Additional information is, subject to duties of confidentiality, available on request. Some investments referred to in this report will be offered solely by a single entity and in the case of some investments solely by CS, or an associate of CS or CS may be the only market maker in such investments. Past performance should not be taken as an indication or guarantee of future performance, and no representation or warranty, express or implied, is made regarding future performance. Information, opinions and estimates contained in this report reflect a judgment at its original date of publication by CS and are subject to change without notice. The price, value of and income from any of the securities or financial instruments mentioned in this report can fall as well as rise. The value of securities and financial instruments is subject to exchange rate fluctuation that may have a positive or adverse effect on the price or income of such securities or financial instruments. Investors in securities such as ADR's, the values of which are influenced by currency volatility, effectively assume this risk. Structured securities are complex instruments, typically involve a high degree of risk and are intended for sale only to sophisticated investors who are capable of understanding and assuming the risks involved. The market value of any structured security may be affected by changes in economic, financial and political factors (including, but not limited to, spot and forward interest and exchange rates), time to maturity, market conditions and volatility, and the credit quality of any issuer or reference issuer. Any investor interested in purchasing a structured product should conduct their own investigation and analysis of the product and consult with their own professional advisers as to the risks involved in making such a purchase. Some investments discussed in this report may have a high level of volatility. High volatility investments may experience sudden and large falls in their value causing losses when that investment is realised. Those losses may equal your original investment. Indeed, in the case of some investments the potential losses may exceed the amount of initial investment and, in such circumstances, you may be required to pay more money to support those losses. Income yields from investments may fluctuate and, in consequence, initial capital paid to make the investment may be used as part of that income yield. Some investments may not be readily realisable and it may be difficult to sell or realise those investments, similarly it may prove difficult for you to obtain reliable information about the value, or risks, to which such an investment is exposed. This report may provide the addresses of, or contain hyperlinks to, websites. Except to the extent to which the report refers to website material of CS, CS has not reviewed any such site and takes no responsibility for the content contained therein. Such address or hyperlink (including addresses or hyperlinks to CS's own website material) is provided solely for your convenience and information and the content of any such website does not in any way form part of this document. Accessing such website or following such link through this report or CS's website shall be at your own risk. This report is issued and distributed in Europe (except Switzerland) by Credit Suisse Securities (Europe) Limited, One Cabot Square, London E14 4QJ, England, which is authorised by the Prudential Regulation Authority ("PRA") and regulated by the Financial Conduct Authority ("FCA") and the PRA. This report is being distributed in Germany by Credit Suisse Securities (Europe) Limited Niederlassung Frankfurt am Main regulated by the Bundesanstalt fuer Finanzdienstleistungsaufsicht ("BaFin"). This report is being distributed in the United States and Canada by Credit Suisse Securities (USA) LLC; in Switzerland by Credit Suisse AG; in Brazil by Banco de Investimentos Credit Suisse (Brasil) S.A or its affiliates; in Mexico by Banco Credit Suisse (México), S.A. (transactions related to the securities mentioned in this report will only be effected in compliance with applicable regulation); in Japan by Credit Suisse Securities (Japan) Limited, Financial Instruments Firm, Director-General of Kanto Local Finance Bureau (Kinsho) No. 66, a member of Japan Securities Dealers Association, The Financial Futures Association of Japan, Japan Investment Advisers Association, Type II Financial Instruments Firms Association; elsewhere in Asia/ Pacific by whichever of the following is the appropriately authorised entity in the relevant jurisdiction: Credit Suisse (Hong Kong) Limited, Credit Suisse Equities (Australia) Limited, Credit Suisse Securities (Thailand) Limited, having registered address at 990 Abdulrahim Place, 27 Floor, Unit 2701, Rama IV Road, Silom, Bangrak, Bangkok 10500, Thailand, Tel. +66 2614 6000, Credit Suisse Securities (Malaysia) Sdn Bhd, Credit Suisse AG, Singapore Branch, Credit Suisse Securities (India) Private Limited regulated by the Securities and Exchange Board of India (registration Nos. INB230970637; INF230970637; INB010970631; INF010970631), having registered address at 9th Floor, Ceejay House, Dr.A.B. Road, Worli, Mumbai - 18, India, T- +91-22 6777 3777, Credit Suisse Securities (Europe) Limited, Seoul Branch, Credit Suisse AG, Taipei Securities Branch, PT Credit Suisse Securities Indonesia, Credit Suisse Securities (Philippines ) Inc., and elsewhere in the world by the relevant authorised affiliate of the above. Research on Taiwanese securities produced by Credit Suisse AG, Taipei Securities Branch has been prepared by a registered Senior Business Person. Research provided to residents of Malaysia is authorised by the Head of Research for Credit Suisse Securities (Malaysia) Sdn Bhd, to whom they should direct any queries on +603 2723 2020. This report has been prepared and issued for distribution in Singapore to institutional investors, accredited investors and expert investors (each as defined under the Financial Advisers Regulations) only, and is also distributed by Credit Suisse AG, Singapore branch to overseas investors (as defined under the Financial Advisers Regulations). By virtue of your status as an institutional investor, accredited investor, expert investor or overseas investor, Credit Suisse AG, Singapore branch is exempted from complying with certain compliance requirements under the Financial Advisers Act, Chapter 110 of Singapore (the "FAA"), the Financial Advisers Regulations and the relevant Notices and Guidelines issued thereunder, in respect of any financial advisory service which Credit Suisse AG, Singapore branch may provide to you. This research may not conform to Canadian disclosure requirements. In jurisdictions where CS is not already registered or licensed to trade in securities, transactions will only be effected in accordance with applicable securities legislation, which will vary from jurisdiction to jurisdiction and may require that the trade be made in accordance with applicable exemptions from registration or licensing requirements. Non-U.S. customers wishing to effect a transaction should contact a CS entity in their local jurisdiction unless governing law permits otherwise. U.S. customers wishing to effect a transaction should do so only by contacting a representative at Credit Suisse Securities (USA) LLC in the U.S. Please note that this research was originally prepared and issued by CS for distribution to their market professional and institutional investor customers. Recipients who are not market professional or institutional investor customers of CS should seek the advice of their independent financial advisor prior to taking any investment decision based on this report or for any necessary explanation of its contents. This research may relate to investments or services of a person outside of the UK or to other matters which are not authorised by the PRA and regulated by the FCA and the PRA or in respect of which the protections of the PRA and FCA for private customers and/or the UK compensation scheme may not be available, and further details as to where this may be the case are available upon request in respect of this report. CS may provide various services to US municipal entities or obligated persons ("municipalities"), including suggesting individual transactions or trades and entering into such transactions. Any services CS provides to municipalities are not viewed as "advice" within the meaning of Section 975 of the Dodd-Frank Wall Street Reform and Consumer Protection Act. CS is providing any such services and related information solely on an arm's length basis and not as an advisor or fiduciary to the municipality. In connection with the provision of the any such services, there is no agreement, direct or indirect, between any municipality (including the officials, management, employees or agents thereof) and CS for CS to provide advice to the municipality. Municipalities should consult with their financial, accounting and legal advisors regarding any such services provided by CS. In addition, CS is not acting for direct or indirect compensation to solicit the municipality on behalf of an unaffiliated broker, dealer, municipal securities dealer, municipal advisor, or investment adviser for the purpose of obtaining or retaining an engagement by the municipality for or in connection with Municipal Financial Products, the issuance of municipal securities, or of an investment adviser to provide investment advisory services to or on behalf of the municipality. If this report is being distributed by a financial institution other than Credit Suisse AG, or its affiliates, that financial institution is solely responsible for distribution. Clients of that institution should contact that institution to effect a transaction in the securities mentioned in this report or require further information. This report does not constitute investment advice by Credit Suisse to the clients of the distributing financial institution, and neither Credit Suisse AG, its affiliates, and their respective officers, directors and employees accept any liability whatsoever for any direct or consequential loss arising from their use of this report or its content. Principal is not guaranteed. Commission is the commission rate or the amount agreed with a customer when setting up an account or at any time after that.
Investment principal on bonds can be eroded depending on sale price or market price. In addition, there are bonds on which investment principal can be eroded due to changes in redemption amounts. Care is required when investing in such instruments.
When you purchase non-listed Japanese fixed income securities (Japanese government bonds, Japanese municipal bonds, Japanese government guaranteed bonds, Japanese corporate bonds) from CS as a seller, you will be requested to pay the purchase price only.