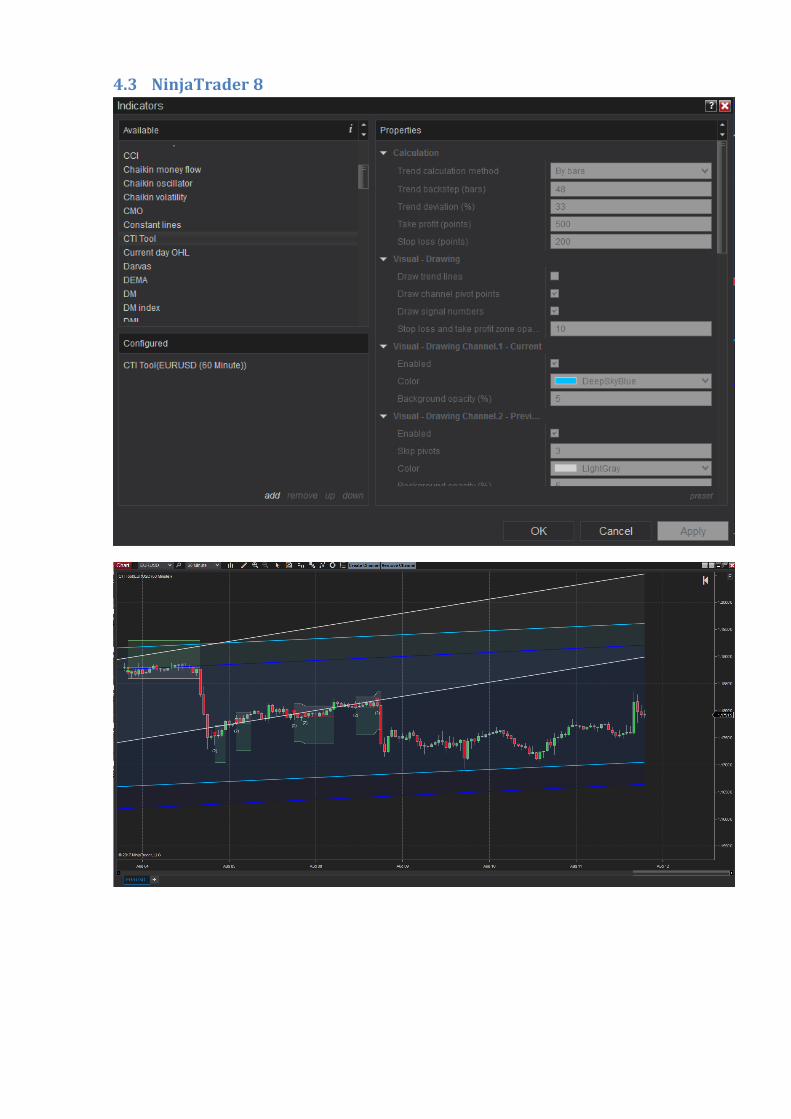
CTI Tool Indicator 1 Introduction CTI Tool indicator is intended to detect price channels and to show the breakout points and emulate possible trade on channel breakout. Figure 1 - Common view of indicator
Transcript
CTI Tool Indicator
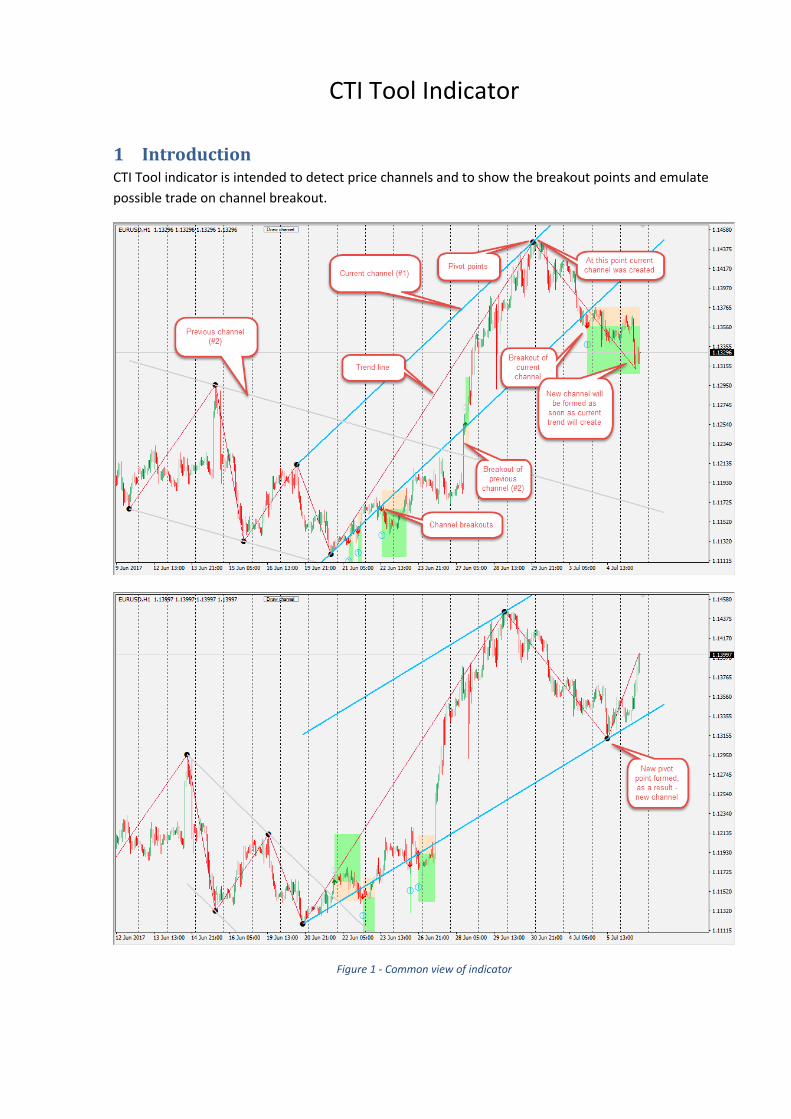
1 Introduction CTI Tool indicator is intended to detect price channels and to show the breakout points and emulate
possible trade on channel breakout.
Figure 1 - Common view of indicator
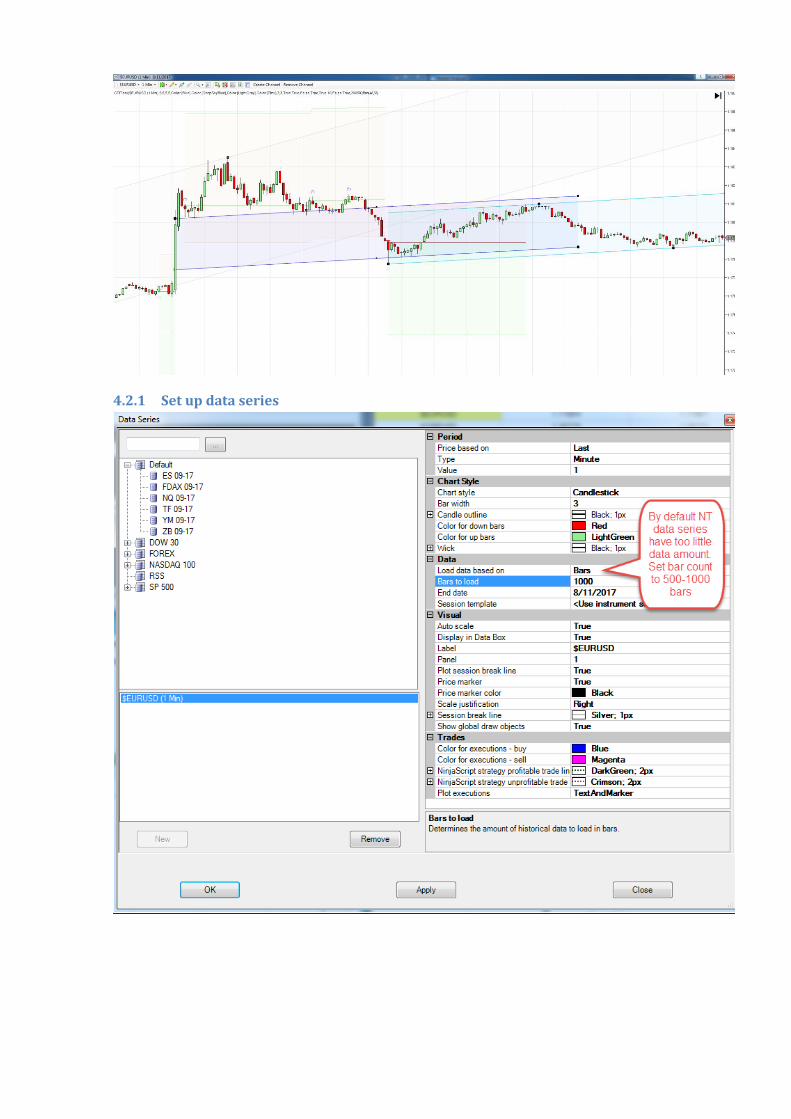
2 Settings
Figure 2 - All settings of indicator
2.1 Timeframe to analyze This parameter allows specifying the timeframe for building channels. By default, it is set to “current”
which means that every time user changes the timeframe of the chart, the indicator rebuilds channels
according to new timeframe. If you set this parameter to some period, for example, D1, the indicator
will build the channels using the period, not matter what current chart timeframe is.
Figure 3 – Building channel on D1 data while current timeframe is H1
2.2 Trend backstep (bars) This value is used for detecting trends. The larger it is, the longer trend is. There 2 trends in the picture
below with default 48 bars backstep (red) and 12 bars backstep (blue):
Figure 4 – Different lengths of trend
2.3 Stop loss/Take profit levels calculation There are 2 models of levels:
constant points
ATR calculation
2.3.1 Levels in points
2.3.1.1 Take profit (points)
If it is set (not equal to 0), the green box will appear beside to signal
2.3.1.2 Stop loss (points)
If it is set (not equal to 0), the bisque color box will appear beside to signal
2.3.2 Levels in ATR
Using this mode of levels brings an opportunity of dynamic calculation of values. Unlike levels defined by
constant points, ATR-based levels can vary according to the current market volatility. Also, using ATR
based levels allows to use the same settings for any instrument and period because they define an
"abstract" coefficient of volatility but not real price points. There is an example of CTI tool using with the
same ATR parameters, but on different timeframes (H1 and D1). Since ATR values are different for H1
and D1 (because they are calculated from average bar height) stop loss and take profit levels are fitted
automatically, and having default ATR settings, real sizes of levels differ.
Figure 5- EURUSD H1 and D1 charts, dynamic stop loss/take profit calculation based on ATR
2.3.2.1 ATR period
Specifies the ATR period. The larger period the slower ATR reacts on market volatility change. Default
value of 20 means twenty last bars are used to calculate average price movement per bar.
2.3.2.2 Take profit, ATR multiplier
Specifies the multiplier for ATR values to calculate take profit in points. Default value is 5.
2.3.2.3 Stop loss, ATR multiplier
Specifies the multiplier for ATR values to calculate stop loss in points. Default value is 2.
2.4 *** Drawing *** section
2.4.1 Draw trend lines
Figure 6 - Drawing trend lines
You can choose the color of the trend line here:
Figure 7 – Colors of the trend line plot (Metatrader 4)
See also "3. Plots configuration" chapter for detailed description of each plot
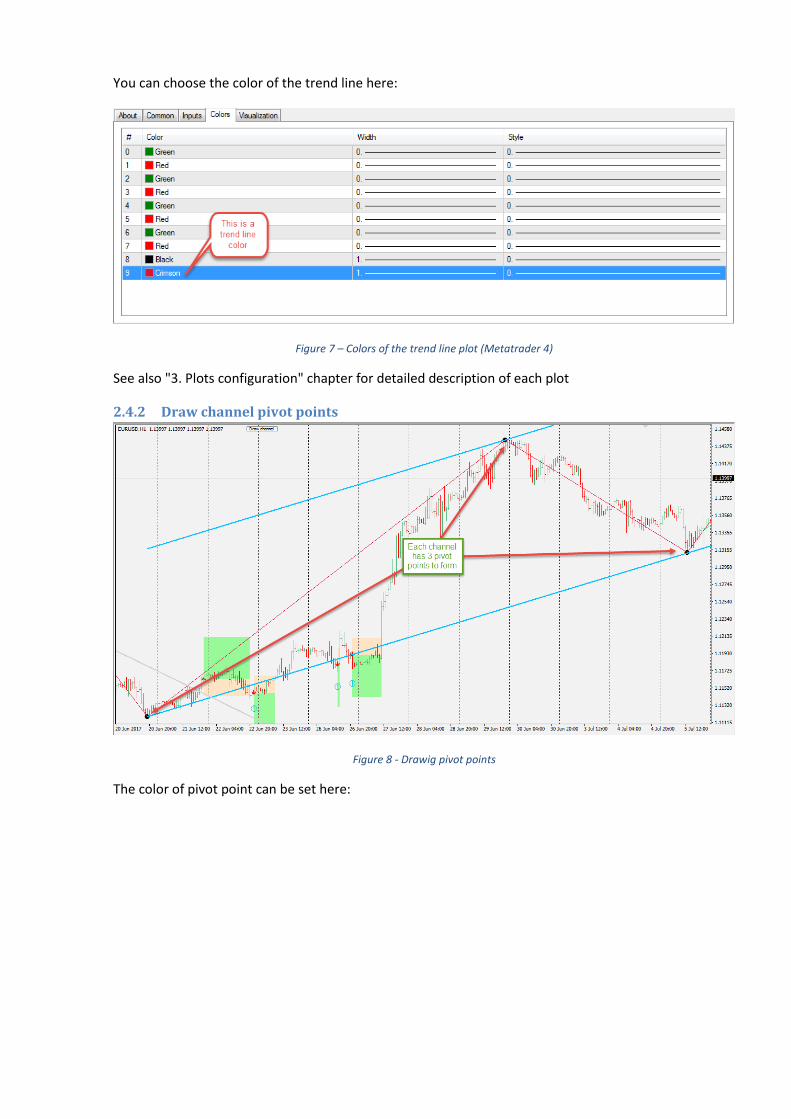
2.4.2 Draw channel pivot points
Figure 8 - Drawig pivot points
The color of pivot point can be set here:
Figure 9 - Colors of the pivot points plot (Metatrader 4)
2.4.3 Draw channel numbers with signals
Figure 10 - Numbering signals
2.4.4 Draw Fibo lines
There are options to choose:
“None”. No any lines are drawn
“Draw 1 middle line”. Only one line, 50% is drawn.
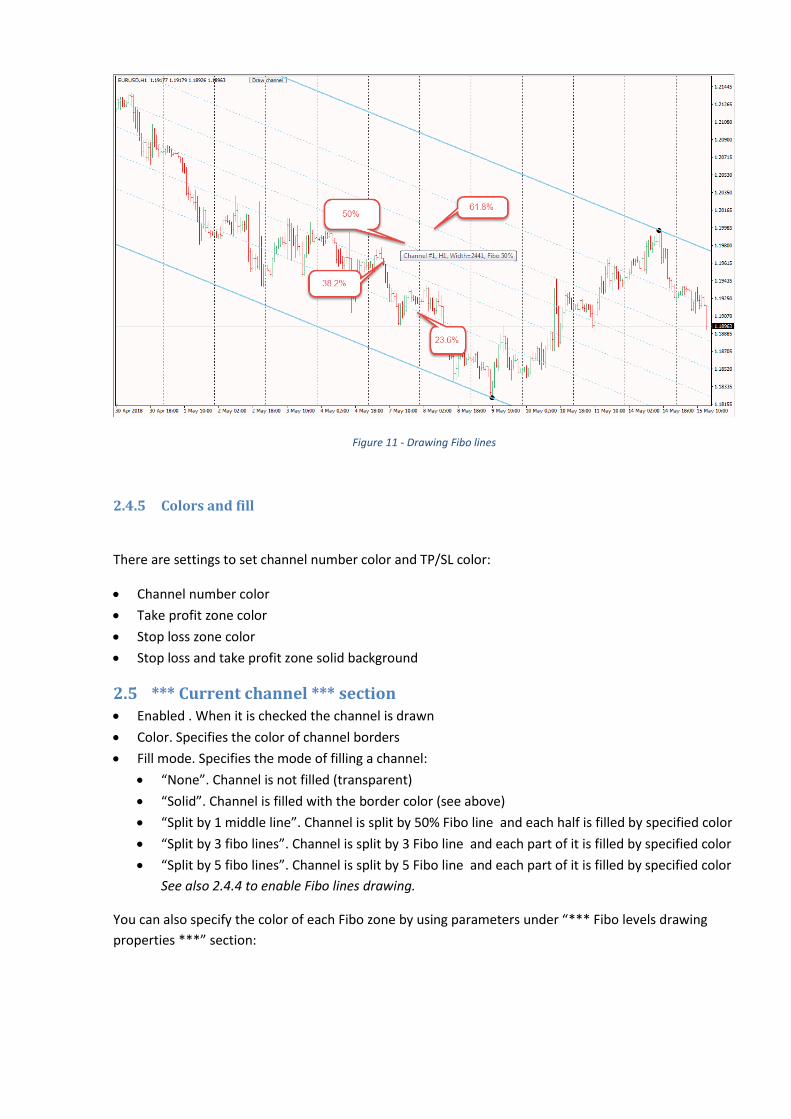
The picture below shows the usage of mode “Draw 5 lines”
Figure 11 - Drawing Fibo lines
2.4.5 Colors and fill
There are settings to set channel number color and TP/SL color:
Channel number color
Take profit zone color
Stop loss zone color
Stop loss and take profit zone solid background
2.5 *** Current channel *** section Enabled . When it is checked the channel is drawn
Color. Specifies the color of channel borders
Fill mode. Specifies the mode of filling a channel:
“None”. Channel is not filled (transparent)
“Solid”. Channel is filled with the border color (see above)
“Split by 1 middle line”. Channel is split by 50% Fibo line and each half is filled by specified color
“Split by 3 fibo lines”. Channel is split by 3 Fibo line and each part of it is filled by specified color
“Split by 5 fibo lines”. Channel is split by 5 Fibo line and each part of it is filled by specified color
See also 2.4.4 to enable Fibo lines drawing.
You can also specify the color of each Fibo zone by using parameters under “*** Fibo levels drawing
properties ***” section:
Figure 12 – Setting up a color of Fibo zones
Here is an example of drawing Blue channel and filling it with 5 Fibo Levels
Figure 13 - Blue channel filled with 5 Fibo zones
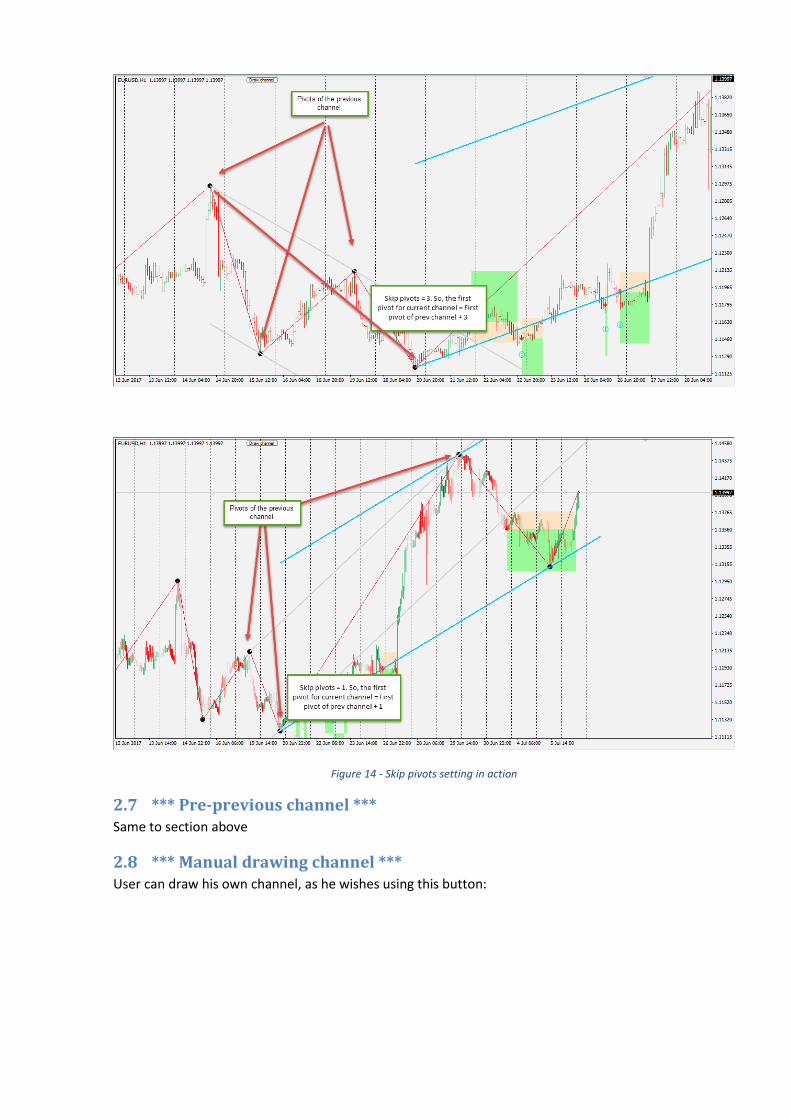
2.6 *** Previous channel *** section The same to current channel section plus one additional parameter:
Skip pivots. How many pivot points must be skipped between current channel and previous channel
Figure 14 - Skip pivots setting in action
2.7 *** Pre-previous channel *** Same to section above
2.8 *** Manual drawing channel *** User can draw his own channel, as he wishes using this button:
The settings are the same to other channels:
Color
Solid background
2.9 *** Notifications *** section
2.9.1 Alert on new channel formed
When the option is enabled, each new created pivot point will rise the alert.
2.9.2 Alert on channel is broken out
When the option is enabled, there will be alerts about the price broken the channel, upwards or
downwards.
2.9.3 Alert on Buy/Sell entry
When the option is enabled, alerts about buy and sell signals will be rising, like this:
2.9.4 Alert on price crosses the middle line of the channel
When the option is enabled, alerts about price crossing the channel's middle will be rising, like this:
Figure 15 - Generating alerts
3 Plots configuration CTI tool has 10 plots that can be configured:
Figure 16 – Plots of the CTI tool (MetaTrader 4 and MetaTrader 5)
Unfortunately, MetaTrader 4 does not show the names of plots, but as a solution, you can use Data
Window (Ctrl+D) to see the names of plots.
So, there are plots:
# Plot name Description
0 Buy mark #1 The plots of Buy/Sell signal marks for each channel. See also chapters: 2.5. *** Current channel *** section 2.6. *** Previous channel *** section 2.7. *** Pre-previous channel ***
1 Sell mark #1
2 Buy mark #2
3 Sell mark #2
4 Buy mark #3
5 Sell mark #3
6 Buy mark #0 The plots of Buy/Sell signal marks for each channel. See also chapter "2.8. *** Manual drawing channel ***" for details
7 Sell mark #0
8 Pivot points The plot for pivot points. See also chapter "2.4.2. Draw channel pivot points"
9 Trend line The plot for trend line. See also chapter "2.4.1 Draw trend lines"