Audio Engineering S ocietyConvention Paper Presented at the 122nd Convention 2007 May 5–8 Vienna, Austria The papers at this Convention have been selected on the basis of a submitted abstract and extended precis that have been peer reviewed by at least two qualified anonymous reviewers. This convention paper has been reproduced from the author's advance manuscript, without editing, corrections, or consideration by the Review Board. The AES takes no responsibility for the contents. Additional papers may be obtained by sending request and remittance to Audio Engineering Society, 60 East 42 ndStreet, New York, New York 10165-2520, USA; also see www.aes.org. All rights reserved. Reproduction of this paper, or any portion thereof, is not permitted without direct permission from theJournal of the Audio Engineering Society. Extraction of Long-term rhythmic structures using the Empirical Mode Decomposition Peyman Heydarian and Joshua D. Reiss Centre for Digital Music, Electronic Engineering Department Queen Mary, University of London, Mile End Road, London E1 4NS, UK {peyman.heydarian, josh.reiss}@ele c.qmul.ac.uk ABSTRACT Long-term musical structures provide information concerning rhythm, melody and the composition. Although highly musically relevant, these structures are difficult to determine using standard signal processing techniques. In this paper, a new technique based on the time-domain empirical mode decomposition is explained. It decomposes a given signal into its constituent oscillations that can be modified to produce a new version of the signal. It enables us to analyse the long-term metrical structures in musical signals and provides insight into perceived rhythms and their relationship to the signal. The technique is explained, and results are reported and discussed. Keywords: Empirical Mode Decomposition, Music Analysis, Long-term Structures, Rhythm, Tempo tracking. 1. INTRODUCTION Extraction of musically relevant structures is an essential task prior to musical content analysis. Analysis of the individual melodies, themes, phrases and notes provide a better perspective of the signal. Different frequency bands carry different levels of information. So it is potentially useful to separate the high frequency noise and transients from the middle frequency harmonics and melodic information and low frequency long-term information. We can then process each part separately. We can also modify or change the content of each part and recombine them to produce a modified version of a given signal. This paper concerns applying a new technique based on the time-domain Empirical Mode Decomposition (EMD) to determine a hierarchical structure of the signal. The signal is decomposed into a summation of zero-mean AM-FM 1 (Amplitude or Frequency Modulated) components, called the Intrinsic Mode Functions (IMF) [1]. The Fourier transform has two severe restrictions: stationarity and linearity. The wavelet transform, which is a multiple-resolution STFT, can be used to analyse the non-stationary signals, but still assumes the linearity 1 The Modes may contain Amplitude or Frequency Modulated components.
Transcript
8/10/2019 ctsdcszaz
http://slidepdf.com/reader/full/ctsdcszaz 1/6
Audio Engineering Society
Convention PaperPresented at the 122nd Convention
2007 May 5–8 Vienna, Austria
The papers at this Convention have been selected on the basis of a submitted abstract and extended precis that have been peerreviewed by at least two qualified anonymous reviewers. This convention paper has been reproduced from the author's advancemanuscript, without editing, corrections, or consideration by the Review Board. The AES takes no responsibility for the contents.
Additional papers may be obtained by sending request and remittance to Audio Engineering Society, 60 East 42nd Street, NewYork, New York 10165-2520, USA; also see www.aes.org. All rights reserved. Reproduction of this paper, or any portion thereof,
is not permitted without direct permission from the Journal of the Audio Engineering Society.
Extraction of Long-term rhythmic structuresusing the Empirical Mode Decomposition
Peyman Heydarian and Joshua D. Reiss
Centre for Digital Music, Electronic Engineering Department
Queen Mary, University of London, Mile End Road, London E1 4NS, UK{peyman.heydarian, josh.reiss}@elec.qmul.ac.uk
ABSTRACT
Long-term musical structures provide information concerning rhythm, melody and the composition. Although
highly musically relevant, these structures are difficult to determine using standard signal processing techniques. Inthis paper, a new technique based on the time-domain empirical mode decomposition is explained. It decomposes agiven signal into its constituent oscillations that can be modified to produce a new version of the signal. It enables us
to analyse the long-term metrical structures in musical signals and provides insight into perceived rhythms and their
relationship to the signal. The technique is explained, and results are reported and discussed.
Keywords: Empirical Mode Decomposition, Music Analysis, Long-term Structures, Rhythm, Tempo tracking.
1. INTRODUCTION
Extraction of musically relevant structures is anessential task prior to musical content analysis. Analysisof the individual melodies, themes, phrases and notes
provide a better perspective of the signal. Differentfrequency bands carry different levels of information.So it is potentially useful to separate the high frequencynoise and transients from the middle frequencyharmonics and melodic information and low frequencylong-term information. We can then process each partseparately. We can also modify or change the content ofeach part and recombine them to produce a modifiedversion of a given signal.
This paper concerns applying a new technique based on
the time-domain Empirical Mode Decomposition
(EMD) to determine a hierarchical structure of thesignal. The signal is decomposed into a summation of
zero-mean AM-FM1 (Amplitude or Frequency
Modulated) components, called the Intrinsic ModeFunctions (IMF) [1].
The Fourier transform has two severe restrictions:
stationarity and linearity. The wavelet transform, whichis a multiple-resolution STFT, can be used to analyse
the non-stationary signals, but still assumes the linearity
1 The Modes may contain Amplitude or Frequency Modulated
components.
8/10/2019 ctsdcszaz
http://slidepdf.com/reader/full/ctsdcszaz 2/6
Heydarian, Reiss Extraction of Rhythmic structures using the EMD
AES 122nd Convention, Vienna, Austria, 2007 May 5–8
Page 2 of 6
condition. Alternatively, EMD can be used as a reliable
means to analyse non-linear and non-stationary signals.
Lerdahl and Jackendoff [2] define four main musical
structures:
• Grouping structure to explain the segmentation ofmusic as motives, phrases, themes, etc…
• Metrical structure, the structure of the strong and the
weak beats.
• Time-span reduction, which is the rhythmic structure
according to which the fundamental frequencies are
heard.
• Prolongational reduction which expresses the sense
of tension and relaxation in music and shows theharmonic and melodic continuity and progression.
Here we show that using the EMD, hierarchic rhythmic
structures can be extracted, where each empirical modeis a reduced version of the preceding modes. EMD can
be used to obtain both short-term features like
fundamental frequency, chord and onset, and long-termstructures like rhythm and tempo contours [3]. One
advantage of directly finding the long-term structures,
rather than calculating them through temporal analysis(e.g. determining tempo through the onsets) is to avoid
the errors in temporal measurements transfer to the
long-term estimations.
Other audio signal processing applications of the
empirical modes may be segregation of polyphonictexture, filtering [4], noise reduction [5] and
compression of the audio signal by omission of the
perceptually unimportant modes.
This paper is organized as follows. Section 2 introduces
the EMD and explains the algorithm. Simulated
experiments on various audio signals are described inSection 3. We demonstrate that these experiments reveal
the long-term structures as described by Lerdahl and
Jackendoff [2]. Section 4 concludes the article with a
discussion of future research.
2. EMPIRICAL MODE DECOMPOSITION
Empirical Mode Decomposition is an adaptive tool toanalyse non-linear or non-stationary signals which
segregates the constituent parts of a signal based on its
local behaviour. No pre-processing is required since it is
able to analyse non-zero mean signals, and is suitable to
analyse the riding waves which may have no zero-
crossing between two consecutive extrema. It can be
used as a filter bank [4], and for signal period analysis
[6].
Unlike the Fourier and wavelet transforms, EMD has no
fixed basis. It is similar to PCA and ICA in that the
basis for the decomposition is signal-dependent. EMD
involves calculating the IMFs for the signal, where the
IMFs must satisfy the following two conditions:
1) The number of extrema and the number of zero-crossings must either be equal or differ at most by one.
That is, there is only one extremum between two zero-
crossings.
2) At any point, the mean value of each IMF must be
zero.
The Intrinsic Mode Functions are calculated by
performing the following sifting process [1]:
1- Through local analysis of the signal, all the minima
and maxima are located. An interpolation function
connects all the maxima; the same is done for the
minima. This gives the upper and lower envelopes.2- The local mean (mean of the upper and lower
envelopes) is calculated: m1
3- The local mean is subtracted from the originalsignal to obtain the local details:
11 )( mt X h −= (1 )
4- h1 then becomes the new signal and the sifting
process, steps 1 through 3, are repeated until themean of the local detail becomes negligible, due to a
stopping criterion. A threshold must be assigned for
this variance between the two consecutive results:
( )2
1( 1) 1
20 1( 1)
( ) ( )
( )
T k k
t k
h t h t Var
h t
−
= −
⎡ ⎤−
⎢ ⎥=
⎢ ⎥⎢ ⎥⎣ ⎦
∑ (2)
Where,1 ( )k h t is the result of the k th iteration on equation
(1) and T is the measurement period. The threshold is
normally set between 0.05 and 0.3 [1, 7].The maximum number of iterations is another stopping
criterion. Its value can be chosen between 4 and 10 toyield meaningful modes [7]. A high value for the
maximum number of iterations causes extra calculations
and may lead to over-decomposition of the signal.
8/10/2019 ctsdcszaz
http://slidepdf.com/reader/full/ctsdcszaz 3/6
Heydarian, Reiss Extraction of Rhythmic structures using the EMD
AES 122nd Convention, Vienna, Austria, 2007 May 5–8
Page 3 of 6
Once a stopping criterion is met, the first residue r 1 is
obtained. It is the first IMF.
5- The residue in step 4 is subtracted from the signal
for the first residue and from the previous mode for
the others. Then steps 1-5 are performed to calculatethe next IMF.
6- The algorithm iterates on step 5, until it becomes a
monotonous function that cannot produce any newIMF.
It has been shown that, for estimation of the signal
envelopes, using cubic spline interpolation yields betterresults than linear or polynomial interpolations [7]. The
resulting curve is sufficient for estimation of the local
mean, while avoiding the ‘over-decomposition’.
The original signal may be re-constructed using the
following summation:
1
( )n
n
i
IMF i r =
+∑ (3)
Where ( ) IMF i is the ith Intrinsic Mode Function; n is
the number of the Modes; and r n is the last residue(residue of the nth mode).
In practice the interpolation in step 1 will not be perfect.
This is due to insufficient data, and the uncertainty in
the end-values of the envelopes. Furthermore, it is
important to have enough samples for the peak detection
step. Otherwise we will face the resulting error in thecalculated modes. The influence of sampling on the
behaviour of EMD is elaborated in [8].
There are 3 main issues with this procedure: how to
define the stopping criteria, how to detect peaks, and
how to deal with end effects in construction of theenvelope.
The end effect has been discussed in several previous
papers on the EMD [1, 4-6]. It pertains to the difficulty
in estimation of the bottom and top envelopes of a
signal near the beginning or end of the signal. Theenvelopes are typically created using cubic spline
interpolation, but at the endpoints there is not enough
data to perform a cubic spline.
Huang [1] suggested adding false peaks such as to yield
typical waveforms at each end, with envelopes starting
from zero to the first peak and from the last peak to
zero. If the peaks occur at 1 2( ), ( )...t P t P , then this may be accomplished by setting a peak at:
0 1 2 1( ) ( ) [ ( ) ( )]t P t P t P t P = - - (4)
And similarly, setting a peak after the last peak. It may
be necessary to add several peaks near each endpoint.
Other methods include setting a peak at the first data
point with amplitude equal to that of the first data point,
this guarantees that the envelope converges onto or near
the data. We have tried both methods and several more,
but none guarantees success.
The accuracy of the peak detection algorithm alsosignificantly affects results. Peaks can be missed, false
peaks can be added, and peak amplitudes can be
miscalculated. These result in a poor envelope. A single
false peak or grossly miscalculated peak amplitude can
result in an error in the envelope which perpetuates, andmay even grow, through subsequent shiftings and
calculation of modes.
Detection of peaks is improved by having a high sample
rate. A sample rate of Fs is sufficient to resolve
frequencies up to Fs/2, but that implies that frequencycontent near Fs/2 will have only 2 points per period.
This makes accurate detection of peaks very difficult.
One possible solution is preprocessing, i.e., perform an
FFT, remove all the high frequency content, and then perform an inverse FFT. This may smooth out the most
difficult peaks.
The stopping criteria for sifting is less significant, in
that different choices of stopping criteria will yield
different results, but not necessarily incorrect results.
The main criteria defined by Huang are that thecomponent has no riding waves and that the mean
envelope is zero [1]. No riding waves simply mean that
there are no maxima below zero and no minima abovezero. This also implies that the number of zero crossings
differ from the total number of maxima and minima by
at most one. The second criterion for stopping thesifting, that the mean envelope is zero, is far moredifficult. Errors in peak detection and end effects may
result in significant deviation of the mean envelope, and
hence lead to more sifting.
The implementation of the EMD that has been
performed here is based on freely available MATLABcode by Rilling, et. al. [4, 7]. Spline interpolation has
been used with false peaks added near the endpoints.
The stopping criterion in Equation (2) was typically set
to 0.1, and no pre-processing was applied.
3. EXPERIMENTS & RESULTS
Using a computer with a sound card, and an ordinary
microphone, samples of 16-bit precision at a sampling
rate of 44.1 kHz were acquired. The samples were performed by the first author on a Persian Santur
8/10/2019 ctsdcszaz
http://slidepdf.com/reader/full/ctsdcszaz 4/6
Heydarian, Reiss Extraction of Rhythmic structures using the EMD
AES 122nd Convention, Vienna, Austria, 2007 May 5–8
Page 4 of 6
instrument. The Santur is a trapezoidal string
instrument, played by a pair of delicate hammer sticks.
It is often referred to as a Hammered Dulcimer in
English [9].
3.1 Experiment 1
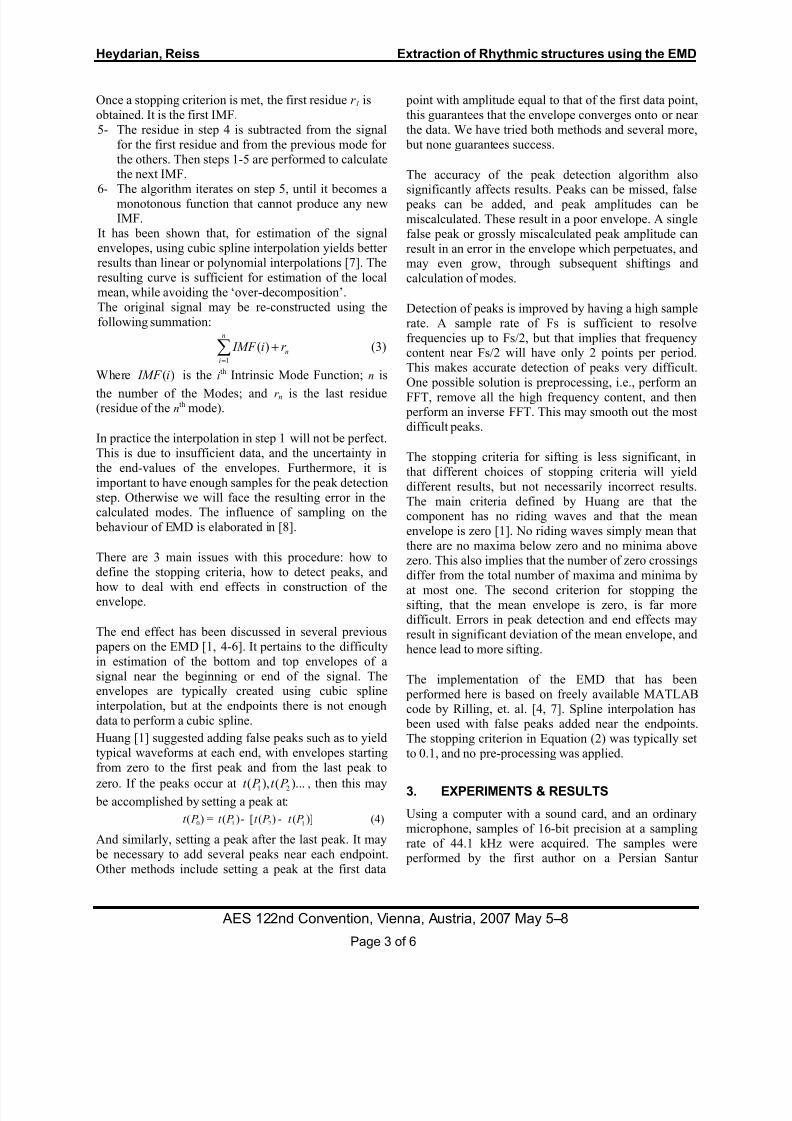
Figure 1 shows the scores for an array of the followingnotes: A3-C4-E4-A4-C5-E5-A5. The fundamentalfrequencies are 220, 261.6, 329.6, 440, 523.25, 659.25
and 880 Hertz respectively [10].
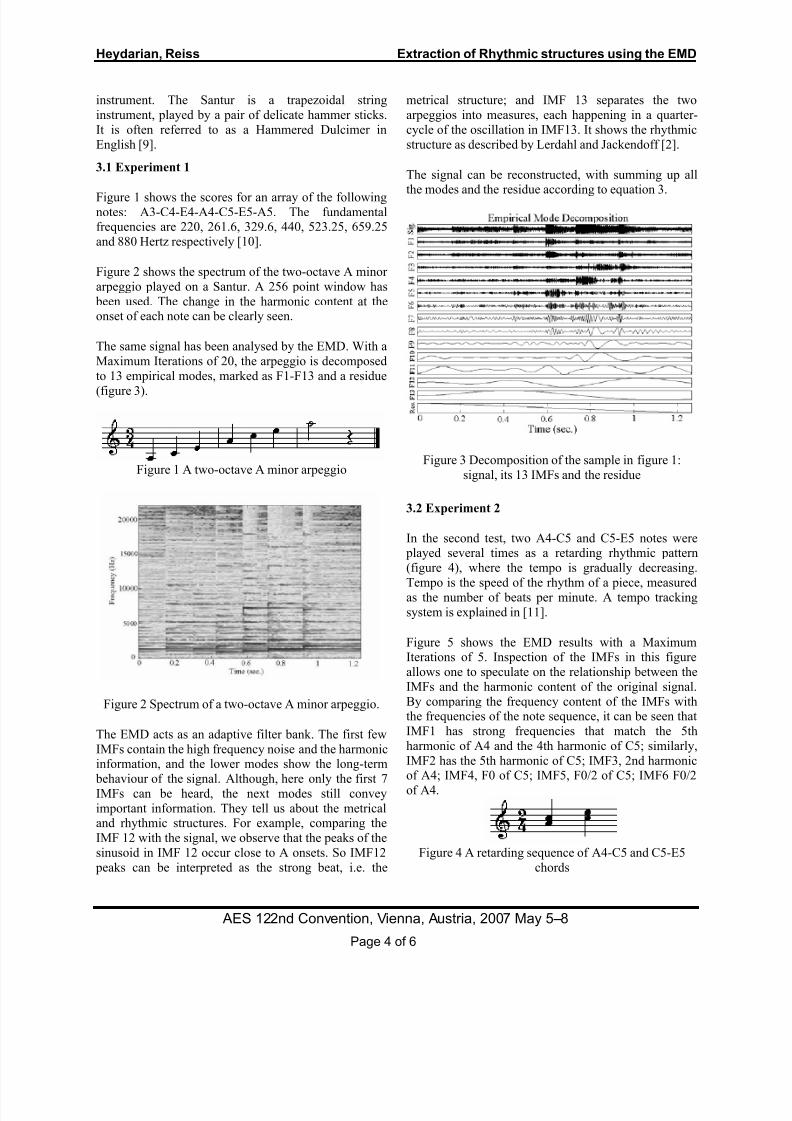
Figure 2 shows the spectrum of the two-octave A minor
arpeggio played on a Santur. A 256 point window has
been used. The change in the harmonic content at theonset of each note can be clearly seen.
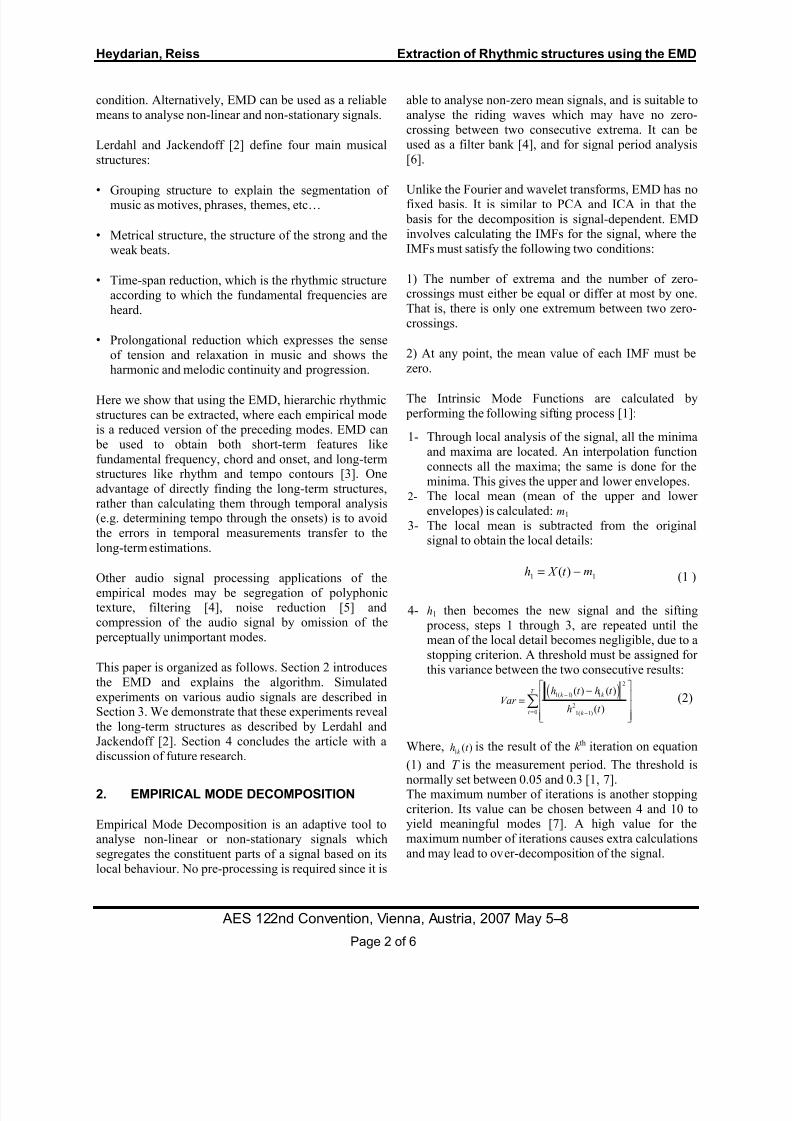
The same signal has been analysed by the EMD. With a
Maximum Iterations of 20, the arpeggio is decomposed
to 13 empirical modes, marked as F1-F13 and a residue
(figure 3).
Figure 1 A two-octave A minor arpeggio
Figure 2 Spectrum of a two-octave A minor arpeggio.
The EMD acts as an adaptive filter bank. The first few
IMFs contain the high frequency noise and the harmonicinformation, and the lower modes show the long-term
behaviour of the signal. Although, here only the first 7
IMFs can be heard, the next modes still convey
important information. They tell us about the metricaland rhythmic structures. For example, comparing the
IMF 12 with the signal, we observe that the peaks of the
sinusoid in IMF 12 occur close to A onsets. So IMF12
peaks can be interpreted as the strong beat, i.e. the
metrical structure; and IMF 13 separates the two
arpeggios into measures, each happening in a quarter-
cycle of the oscillation in IMF13. It shows the rhythmic
structure as described by Lerdahl and Jackendoff [2].
The signal can be reconstructed, with summing up allthe modes and the residue according to equation 3.
Figure 3 Decomposition of the sample in figure 1:
signal, its 13 IMFs and the residue
3.2 Experiment 2
In the second test, two A4-C5 and C5-E5 notes were played several times as a retarding rhythmic pattern
(figure 4), where the tempo is gradually decreasing.
Tempo is the speed of the rhythm of a piece, measuredas the number of beats per minute. A tempo tracking
system is explained in [11].
Figure 5 shows the EMD results with a MaximumIterations of 5. Inspection of the IMFs in this figure
allows one to speculate on the relationship between the
IMFs and the harmonic content of the original signal.
By comparing the frequency content of the IMFs withthe frequencies of the note sequence, it can be seen that
IMF1 has strong frequencies that match the 5th
harmonic of A4 and the 4th harmonic of C5; similarly,
IMF2 has the 5th harmonic of C5; IMF3, 2nd harmonicof A4; IMF4, F0 of C5; IMF5, F0/2 of C5; IMF6 F0/2
of A4.
Figure 4 A retarding sequence of A4-C5 and C5-E5
chords
8/10/2019 ctsdcszaz
http://slidepdf.com/reader/full/ctsdcszaz 5/6
Heydarian, Reiss Extraction of Rhythmic structures using the EMD
AES 122nd Convention, Vienna, Austria, 2007 May 5–8
Page 5 of 6
The half-pitch components in the signal could be
interpreted as the sympathetic vibration of A3 strings.
The sympathetic vibration happens when a string is not
played, but vibrated by another sound of the same F0 ora multiple of that. Further research is required to verify
these conjectured relationships.
Figure 5 A decreasing tempo sequence of A4-C5 and
C5-E5 notes: signal, its 14 IMFs and the residue
The explanation for this phenomenon is given with the
fact that the EMD acts as an adaptive filter bank. With
increasing the mode index, frequencies of the
oscillations become lower. A higher value for themaximum number of iterations would decompose the
signal into more modes, but would significantly increase
the amount of processing required. Too high of amaximum value may also lead to over-decomposition of
the signal.
The period of IMF11, which is changing through time,shows the onset times. And with decreasing the tempo,
the periods of IMF13 & IMF14 increase. So they might
be used for tempo tracking. IMF13 has a period 6 timesthe distance of the first 2 notes, though it is arranging
the notes in groups of 6 similar to the time span
segmentation suggested by Lerdahl and Jackendoff [2].
The same can be said for IMF14 but with a larger period(10 notes). The residue shows a decreasing trend as the
tempo decreases. Figures 6-a through 6-c show IMF4
(C5’s F0), IMF13 and IMF14 in a larger view.
Similarly, other tests were done on increasing and
decreasing tempo patterns of an A4 note and on some
melodic patterns. They reinforce this statement that the
last few modes in an EMD decomposition of a signal
follow the rhythmic and metrical structure.
(6-a)
(6-b)
(6-c)
Figure 6 IMF4, IMF13 and IMF14 of figure 3
a) IMF4 b) IMF13 c) IMF14
8/10/2019 ctsdcszaz
http://slidepdf.com/reader/full/ctsdcszaz 6/6
Heydarian, Reiss Extraction of Rhythmic structures using the EMD
AES 122nd Convention, Vienna, Austria, 2007 May 5–8
Page 6 of 6
Using the EMD, a rhythmic analysis of the signal can be
performed. The obtained modes are hierarchically
ordered and the EMD operates as a filter bank with
noise and higher frequency components in the first few
IMFs, and lower frequency components in the lowermodes.
4. CONCLUSIONS
This work is concerned with applying the EmpiricalMode Decomposition to extract meaningful musical
structures from audio. The EMD is a powerful means
for the analysis of nonlinear non-stationary signals. It
decomposes the signal to a summation of zero-meanAM-FM components, called Intrinsic Mode Functions.
EMD has no analytical representation and is based on
the local behaviour of the signal. It can be used for the
analysis of long-term structures which are difficult todetermine using standard frequency domain or wavelet
techniques.
Using the EMD, the signal is decomposed into a set of
hierarchically ordered modes, where each empirical
mode is a reduced version of the preceding modes
(figures 3 and 4). EMD operates as a filter bank withnoise and higher frequency components in the first few
IMFs, and lower frequency components in the lower
modes. This hierarchical representation of a musical piece can be used for noise reduction, or adaptive
segregation of different frequency bands in an audio
signal. Future work may be on automatic analysis of the
long-term structures like the Scale and the rhythm in a
musical piece. This will assist in automated musiclabeling. Also, the IMFs can be individually modified or
changed, to produce a modified version of the signal.
5. REFERENCES
[1] Huang, N.E., Shen, Z., and Long, S. R., et al. “The
empirical mode decomposition and the Hilbert
spectrum for non-linear and non-stationary timeseries analysis.”, Proc. R. Soc. Lond. A, pp. 903-
995, 1998.
[2] Lerdahl, F., Jackendoff, R., A Generative Theory of
Tonal Music, The MIT Press, 1983.
[3] Heydarian, P., Reiss, J.D., "Extraction of Long-