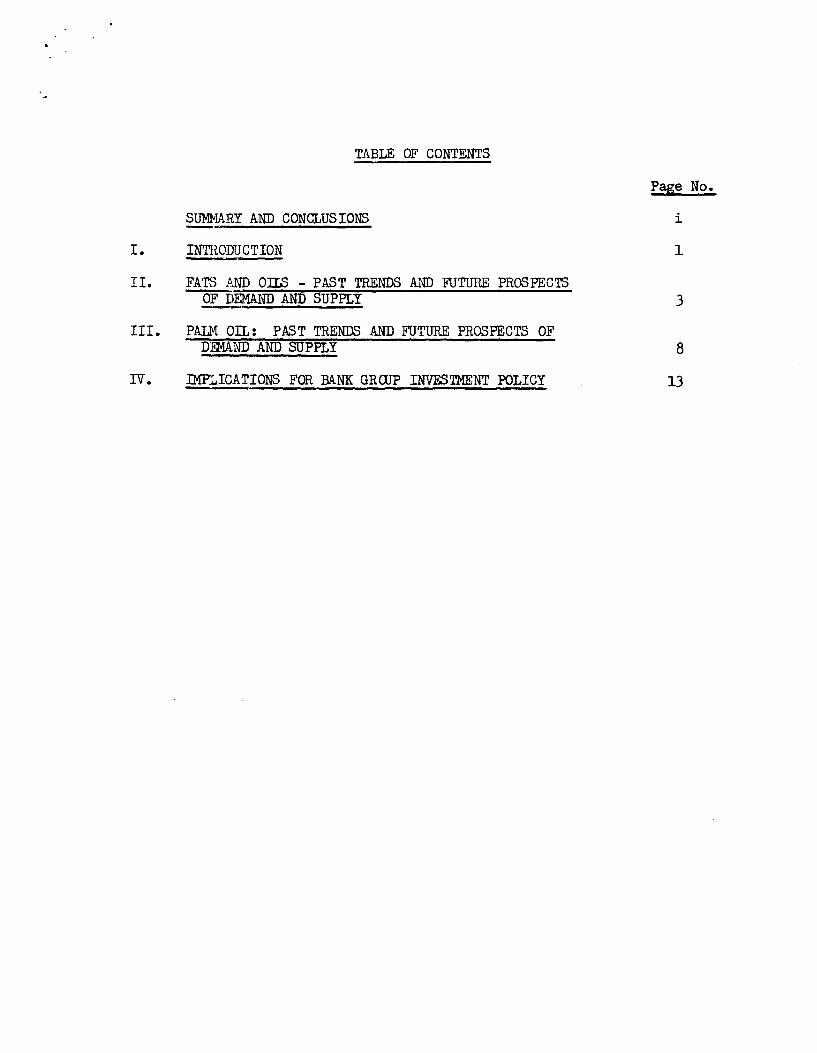
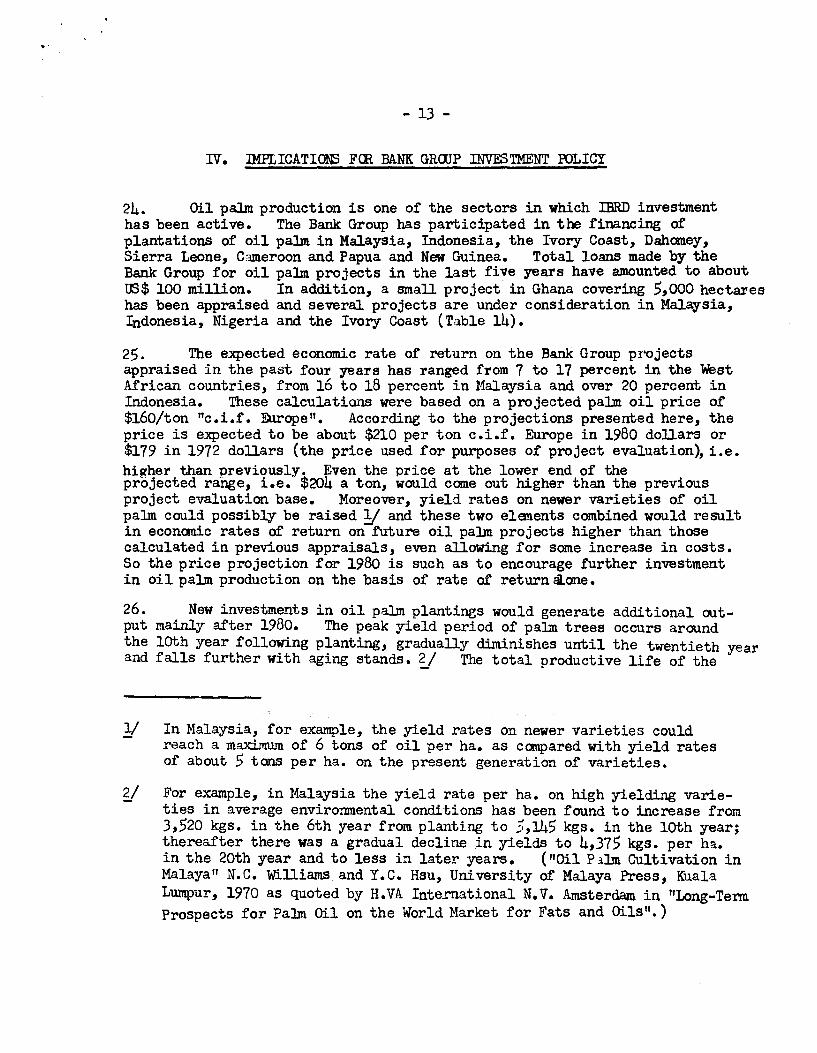
.. BASIC DATA ON PALM OIL PRODUCTION, EXPeRTS AND CONSUMPriON, \ Countries and areas Malaysia /1 Indonesia- Nigeria Zaire Other Countries in Africa World (in thousand metric tons) 1971 568 225 500 200 410 2,008 Production l9d0 projected 1,970-2,125 475 575 235 685 4,080-4,235 1971 19oJ Projected Developed countries -878 2,100 Centrally planned economies 6 50 Developing countries: 1,194 1,980 of which (a) non-producing 90 360 (b) producing l,lOu 1,620 -World 2,078 4,130 I I 1971 572 190 20 112 68 965 Bxnorts 19tl0 projected 1,910-2,o6o 375 -100 75 205 /2 2,565-2,715 price of palm oil, U.S. dollars per metric ton, Malayan c.i.f. Europe 1971 1980 projected $212 $210 (range $204-$216) Share of palm oil in world output of all fats and oils 1971 1980 projected 4.88% . 7.32% ' /1 Alternative output forecasts depending on realization of production plans. /2 Ivory Coast, Dahomey and Cameroon only. Public Disclosure Authorized Public Disclosure Authorized Public Disclosure Authorized Public Disclosure Authorized Public Disclosure Authorized Public Disclosure Authorized Public Disclosure Authorized Public Disclosure Authorized
Transcript
..
BASIC DATA ON PALM OIL PRODUCTION, EXPeRTS AND CONSUMPriON,
~CTUAL A~D F~OJ3CTED \
Countries and areas Malaysia /1 IndonesiaNigeria Zaire
Other Countries in Africa World
(in thousand metric tons)
1971 568 225 500 200 410
2,008
Production l9d0
projected 1,970-2,125
475 575 235 685
4,080-4,235
1971 19oJ Projected Developed countries -878 2,100 Centrally planned economies 6 50 Developing countries: 1,194 1,980 of which (a) non-producing 90 360
(b) producing l,lOu 1,620 -World 2,078 4,130
I I
1971 572 190
20 112
68 965
Bxnorts 19tl0
projected 1,910-2,o6o
375 -100
75 205 /2
2,565-2,715
~-: price of palm oil, U.S. dollars per metric ton, Malayan c.i.f. Europe 1971 1980 projected $212 $210
(range $204-$216)
Share of palm oil in world output of all fats and oils 1971 1980 projected
4.88% . 7.32% '
/1 Alternative output forecasts depending on realization of production plans.
/2 Ivory Coast, Dahomey and Cameroon only.
Pub
lic D
iscl
osur
e A
utho
rized
Pub
lic D
iscl
osur
e A
utho
rized
Pub
lic D
iscl
osur
e A
utho
rized
Pub
lic D
iscl
osur
e A
utho
rized
Pub
lic D
iscl
osur
e A
utho
rized
Pub
lic D
iscl
osur
e A
utho
rized
Pub
lic D
iscl
osur
e A
utho
rized
Pub
lic D
iscl
osur
e A
utho
rized
wb350881
Typewritten Text
77704
TABLE OF CONTENTS
Page No.
StJMI-tiA.RY AND CONCLUSIONS i
I. INTRODUCTION 1
II. FATS AND OILS - PAST TRENDS AND FUTURE PROSPECTS OF DEMAND AND SUPPLY 3
III. PALM OIL: PAST TRENDS AND FUTURE PROSPECTS OF DEMAND AND SUPPLY 8
IV. :rnPLICATIONS FOR BANK GRClJP INVESTMENT POLICY 13
- 2 -
Tables and Charts
Tables
1. Estimated WOrld Consumption of Oils and Fats, by Major Regions
2. Consumption per Head of Selected Edible Oils and Fats, OECD Countries, 1960-1968
3. Consumption of Fats and Oils in Major Consuming Area, 1971 and 1980
4. World Output of Fats and Oils, 1960-1970
5. World Output of Fats and Oils, 1971 and 1980 Projections, Ranked by Percentage Shares
6. Production of Palm Oil by Countries, 1951-62
7. Exports of Palm Oil from the Producing Countries, 1950-72
B. Palm Oil - Present Production, Production in Selected Earlier Years and Projected Output in 1980, by Country
9. P.alm Oil - Actual Consumption in Selected Years and Demand Projections for 1980
10. Exports of Palm Oil and Share of Exports in Output, Actual and Projections to 1980, by Country
11. Relative Price of Palm Oil and Share of Palm Oil in Exports of a Selected Group of Competing Vegetables, 1955-71
12. Prices and Price Ratios of some Vegetable Oils, Past and Projected
13. IBRD Participation in Financing of Palm Oil and Palm Kernel Production
14. IBRD/IDA: Palm Oil Projects and Projects with a Palm Oil
Charts
l.
? •
Component Scheduled for Approval in FY74
WOrld Production of Fats and Oils, 1951-1971
Relative Prices of Palm Oil and Soybean Oil and Share of Palm Oil in Exports of Competing Vegetable Oils
PALM OIL - REVIEW AND OUTLOOK FOR BANK LENDING
SUMMARY AND CONCLUSIONS
1. The world supply of palm oil has increased rapidly since the end of the 1960s, following a long period of slow growth. World exports of palm oil practically stagnated throughout the 1950s and the early 1960s; the share of palm oil in exports of all oils and fats declined from 9.1 percent in 1950-52 to 5.7 percent in 1967-69. The world supply of palm oil which increased by 12 percent per annum from 1967-69 to 1971 is expected to increase less rapidly in the period to 1980, but still at a rate upwards of ~nt~_a__year_._ This raises the question of future prospects for the price of palm oil and of whether the producing countries should be encouraged and helped to continue to invest in increases of production.
2. The outlook for palm oil in the remainder of the decade to 1980 must be viewed in the context of world demand and supply of all fats and oils because of the possibilities for substitution which exist between different fats and oils in their end-uses. WOrld demand for fats and oils in general is expected to grow rapidly enough to absorb the prospective increase in output of these commodities as a group in the decade ahead without significant downward pressure on their market prices. Demand for all vegetable oils will grow faster than for other fats and oils; a larger share of this demand than in the past may have to be met from palm oil and soybean oil as a result of the slower expected growth in supply of most competing oils. Some downward adjustment of the price of palm oil may be needed to facilitate substitution for ether oils. As the overall world supply and demand situation for fats and oils in 1980 is expected to be in balance, the fall in the price of palm oil relative to other oils will be moderate, particularly since palm oil accounts for a relatively small share of world production of fats and oils (3.8 percent in 1967-69). The price of palm oil, expressed in current 1980 dollars, is expected to be $?10 per metric ton, (probable prices lie between $?0h and $?16 per metric ton).
3. On the whole, due to the gradual shift of consumption in the devel-oped countries away from animaJ. oils and fats and toward products based on vegetable oils, including palm oil, the export demand prospects remain favorable in the period to 1980 and also in the next decade. Moreover, palm oil consumption is projected to incrEase rapidly in developing countries due to rising incomes and high income elasticities of demand for vegetable oils in these countries. For instance, as a result of the projected slow growth of production in the hitherto main producing countries of Africa, some of these countries may become major importers of palm oil unless efforts are made to raise production potential through an extension of plantings and replantings and other forms of rehabilitation of existing production and processing facilities. Although physical yields are highest in the major producing countries of Asia (Malaysia and Indonesia), investment
- ii -
in palm oil production still remains attractive in some other countries, notably ir.. Africa, given the alternative investment opportunities available to these countries. By investing in palm oil production, the Bank would therefore make a positive contribution to their economic development.
4. The Food and Agriculture Organization of the United Nations (FAO) generally concurs with the views expressed in this paper. FAO is of the view that there is scope for investment in palm oil projects both to produce limited additional supplies for export and, particularly, to increase supplies for domestic consumption.
INrRODUCT ION
1. Palm oil is substitutable with other oils and fats in many end-uses. As a result, the analysis of the market prospects for palm oil must teke into account the supply and demand prospects for oils and fats in general. Given prospective demand for all oils and fats the future price of palm oil depends very much on the extent to which the supplies of competing products will grow to meet this demand. The shares of both palm oil and soybean oil in total supplies of oils and fats are expected to increase substantially from now to 1980. In order to assess the significance of these developments for the future price of palm oil, attention is devoted in this paper to the market outlook for the entire sector. Supply prospects of individual competing oils md fats are also discussed.
2. From 1950-52 to 1967-69, world production of palm oil rose at an annual average rate of 1.2 percent, while from 1967-69 to 1971 the annual growth rate has averaged more than . ercent (Tab 6 In the earlier period, output stagnated and in parts of t e period decreased in the main African producing countries and in Indonesia, while increased production was recorded in Malay8ia and in the smaller producing countries of Africa and Latin America. In the period after 1967-69 output rose in all the producing areas. The major development was the rapid growth of production in South East Asia. The planting program started in West Malaysia in the early 1960s began to show results from the mid-sixties onwards and by 1971 Malaysia became the main producing country. Acceleration of planting there in the second part of the decade will lead to further increases of production in the 1970s. In Indonesia, the growth of output resumed around 1968 following a long period of stagnation. Exten~ive plantings in the smaller African producing countries also led to production increases since the turn of the decade, while in Nigeria and Zaire production started to recover following the end of civil disorders. 11
;>. World exports of p.c.:Jn oil also showed little change throughout the 1950s and early 1960s but began to increase at a 15 percent average annual rate after 1967-69 (Table 7). By 1972 the share of palm oil in exports of all fats and oils had moved closer to the level at which it stood in the early 1950s. However, of the major producing countries only Malaysia and Indonesia recorded rising exports in the 1967-72 period. In the main producing countries of ll'est Africa most of the increase in output was absorbed domestically. This was particularly evident in Nigeria, which became a marginal exporter after 1967, whereas previously it accounted for a major share of African exports of palm oil. During the civil war
11 Production was disrupted in 1964-67 in Zaire and 1967-69 in Nigeria, due to civil disorders.
- 2 -
years Nigerian production fell considerably and it has not yet reached its previous level. Cver 90 percent of Nigerian output of palm oil originates in the subsistence sector and little surplus production has been available from this sector for commercial sales and export.
4. World output of palm oil is expected to continue to increase rapidly in the coming decade as a result of new plantings coming to maturity and improved yields, partly contributed by Bank projects presently implemented. Oil palm projects financed by the Bank Group will account for an estimated 15 to 16 percent of the total increment in output from 1970 to 1980 (Table 13 ). World exports of palm oil are expecte.d to grow faster than output. Consumption is also expected to grow rapidly in the 1970s, both in developing countries and in developed countries; this will be reflected in increased domestic absorption of output in the producing countries and in the higher import requirements elsewhere.
5. The projections to 1980 given in Section III indicate that the share of palm oil in the total output of all fats and oils will rise from 4.9 percent in 1971 to 7.3 percent in 1980 and that the increase in the share of soybean oil will be even larger (from 16.5 to 19.6 percent). The growth of demand for all fats and oils from now to 1980 is expected to be sufficient to absorb the increased supplies of these commodities. Thus the projected faster growth of output of palm oil relative to that of other fats and oils will probably not result in excessive downward pressure on the future price of palm oil compared with other fats and oils. (Section II deals with demand and supply prospects for all fats and oils, and Section III with the outlook for palm oil in particular,) However, the price projections presented in Section III are conditional on the accuracy of projected demand, supply and inflation. If the forecast for palm oil output proves to be too low, the increment over the projected level of output may depress the price, particularly if higher than projected level of output and exports of competing vegetable oils make the absorption of palm oil supplies somewhat more difficult. These possibilities raise the issue (discussed in Section IV) of the impact which Bank lending can have on economic growth and the balance of payments in developing countries by supporting plans for further expansion of palm oil output in these countries.
- 3 -
II. FATS AND OILS - PAST TRENDS AND FUTURE PROSPECTS OF DEMAND AND SUPPLY
6. Total estimated consumption of fats and oils expanded steadily at a trend rate of 2.9 percent from 1960 to 1970 (Table 1}, but both the geographic an~ the product composition of demand changed during this period. 'While total consumption in both the developed and the developing groups of countries rose at a trend rate of 3.2 percent, in centrally planned econ-omies the trend rate of growth was only 1.8 percent. Within the developed group- which in 1970 accounted for one-half of total world consumption and which is the main export market for fats and oils produced in developing countries- the most rapid increase in demand was recorded in Oceania, Japan and South Africa combined (7.0 percent per annum}, followed by Western Europe (3.0 percent per annum) and the United States and Canada (2.6 percent per annum). Among the developing regions, Latin America recorded the greatest trend rate gf growth in cons~tiQn (4.3 percent) followed by Africa and Asia lJ.l and 2.~ percent respect1velyJ. 1. The product. composition of supply and use also changed substan-tially during the past decade or so. Consumption of animal fat' and marine oils rose much more slowly than consumption of vegetable oils.! Within the vegetable Qils group the composition of usage also changed in response to availabili~ies of the different oils and to a number of economic and noneconomic factors.
8. The rise in consumption of vegetable oils mainly reflected some countries' growing demand for them as substitutes for animal fats in food uses. Higher food consumption of vegetable oils (in the form of margarine, shortening and other cooking oils) compared with animal fats seems to reflect, at least in some major cons~ing countries, the concern of consumers with excessive cholesterol intake.gj Other factors have played a role, however, such as the increased consumption of convenience foods. In North America, concern over cholesterol and the development of convenience foods both seem reasonable explanations for the fact that consumption per head of vegetable oils in margarine and shortening has risen rapidly during the last decade, while consumption of butter fell (Table 2). In other major developed consuming areas the evidence points in different directions. Thus in the enlarged EEC, consumption per head of butter rose more slowly than consumption of vegetable oils, but margarine consumption per head fell on average from 1960 to 1968. In the EEC
!( Data on world consumption by types of fats and oils is not readily available. In a recent USDA study, "World Supply and Demand Prospects for Oilseeds and Oilseed Products in 1980", Report No. 71, USDA, Washington, March 1971, total availability of animal fats and marine oils is shown to have increased by 1.9 percent per annum from 1955-57 to 1963-65, against 3.7 percent per annum for total availability of vegetable oils (oil equivalent basis).
£1 Most vegetable oils have a low cholesterol content compared with animal oils and fats. The cholesterol content of palm oil is higher than that of most other vegetable oils, however, so that this explanation of the shift in consumer preferences is less relevant in the case of palm oil.
- 4-
countries the evidence of a change in consumer preferences is thus less marked. The replacement of butter by vegetable oil substitutes may be partly due to the maintenance of arti.ficially high support prices for the dairy product, particularly in the countries constituting the old EEC. In Japan, consumption of animal as well as'vegetable oils and fats rose rapidly in the last decade, mainly reflecting income growth.!/
9. The shift of demand away from animal fats and oils and to vegetable oils opens opportunities for virtually any of these oils in view of the high degree of substitution between them. For each individual oil the rate of growth of supplies compared with that of competing oils does have an influence on its relative price, but this influence is smaller the closer the balance between total supply and total demand of all vegetable oils.
10. According to Bank staff projections, world demand for all fats and oils will rise to 56 million tons in 1980 if prices in current dollars remain at their 1972 level of $212 per ton. This is 31.5 percent more than in 1970 (42 .6 million tons) and represents a slightly lower rate of increase than in the pre-ceding decade (?.8 percent per annum against 2.9 percent in 1960-70). The difference between the Bank staff's and the FA0 1 s demand projections (the latter is 53.6 million tons) is mainly due to a stronger expected rise of demand in developed countries. If the increase in the share of vegetable oils in total demand for fats and oils for food uses implied by recent FAO projections~/ is applied to the above figure, world consumption of vegetable oils in 1980 would amount to about 39 million tons (69.5 percent of the total), an increase of 3.5 percent per annum from 1970 to 1980. 3/ In this paper it is assumed that the factors which in the last decade have stimulated a more rapid growth of food uses of vegetable oils compared with other fats and oils will continue to operate in the period to 1980. The impact of these factors is likely to be felt more in developed than in developing countries. However, future demand for vegetable oils in developing countries is also expected to increase considerably faster in the period to 1980 than in the previous decade, reflecting the rise in incomes in these countri~s and the fact that the income elasticity of demand for the oils tend to be relatively high at low income levels. The assumed rate of increase of demand in developing countries is about 3.8 percent per annum from 1970 to 1980 against 3.3 percent per annum
y
The income elasticity of demand for fats and oils is relatively high at low income levels, implying a certain degree of "saturation" at higher income levels.
See FAO, "Agricultural Commodity Projections, 1970-1980 11 , Rome 1971. The FAO projects a total increase in consumption of fats and oils to 53.6 million by 1980, and an increase in the share of vegetable oils in demand for food uses from 66.6 percent in 1970 to 69.5 percent in 1980 (FAO•s "high" projection which assumes the grm~th of income in developing countries will be in line with the targets of the UN Second Development Decade.).
2/ Note, however, that a considerable part of consumption of vegetable oilseeds takes place in the form of oilcakes and meal used as animal feed. The figures given here are on an "oil-equivalent" basis. Moreover, they include industrial oils.
- 5 -
from 1960 to 1970. Assuming that the growth rate of consumption in centrally planned economies will remain at around 1.8 percent per annum a& in 1960-1970, total consumption of fats and oils in developing countries and centrally planned economies combined would reach 29 million tons in 1980. Table 3 presents the estimated 1980 consumption for major consuming areas ar.~ compares them with actual consumption in 1971; data for 1950 to 1970 are shown in TAble 1.
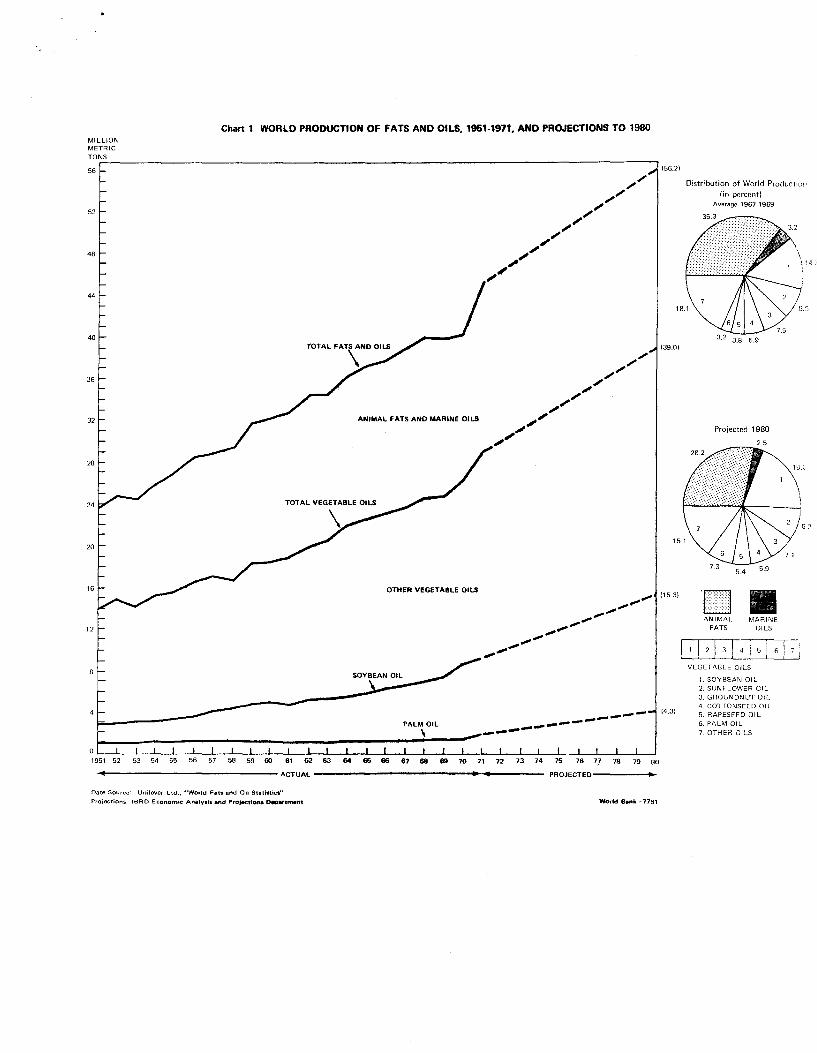
11. The changing distribution of world demand between different fats and oils over the last decade has been accompanied by autonomous changes in the supply availabilities of the different commodities. World production of animal fats and oil has increased slowly compared to vegetable oils (Table 4 and Chart I). On the whole the production of butter has remained almost stagnant, though there were increases in particular areas such as the EEC under the stimulus of high support prices which merely led to stock accumulation and the need to subsidize consumption. The growth of lard also has been very slow partly as a result of production practices characterized by the emphasis on high-protein meal in feeding, which has led to a decline in fat per animal. The output of marine products increased rapidly in recent years, but these are mainly consumed as animal feeds. The rise in production of marine products and animal fats and oils is expected to be slow in the decade to 1980. 1/ For butter, lard and marine oils combined, production is exPected to grow at the rate of 1.9 percent per year,g/ against 3.5 percent a year for vegetable oils. Consequently, these products are not likely to exert considerable pressure on the prices of the vegetable oils with which they compete. On the basis of past production trends, world supply of all fats and oils combined in 1980 is expected to be roughly in balance with world demand at the level of 56 million tons oil or fat equivalent. This in turn implies that the expected increase of supplies of fats and oils will be absorbed in the market without persistent downward pressure on the prices of these commodities as a group.
12. Within the vegetable oil group, production has grown comparatively slowly except for sunflowerseed oil, rapeseed oil, soybean oil and palm oil (Table 7). WOrld output of groundnuts increased at a diminishing rate in the last decade, particularly after 1967. WOrld exports of groundnut oil have been stagnant since 1955, except for an increase during 1966-68. Production is not expected to rise again at rates comparable to those of the 1950s in the coming decade, unless vigorous expansion plans are undertaken. WOrld coconut production remained stagnant from the mid 1950s to 1970, and the improvement noted
1/ Significant increases in the availability and catch of fish in the coming years are discounted by most fishery experts.
gj See USDA, op. cit. p. 98, where a summary of projections made by FAO and OLCD is presented.
- 6 -
in the last two years, which was attributable to favorable weather conditions, is expected to be short-lived. The development and use of high-yield hybrid varieties could increase production but the effect will not be felt until after 1980. The production of cottonseed oil has grown slowly in the past decade at the rate of less than 1 percent a year. A rise in supply occurred in 1972 and is expected to continue into 1973 due to favorable weather conditions and to the diversion of cottonseed from direct feeding to oil extraction in some countries. However, the long-term growth, which is linked to the growth of output of cotton, is not expected to exceed 1.7 percent per annum. Sunflowerseed is produced mainly in centrally planned economies and the rate of growth of outputhas tended to level off towards the end of the last decade. The reverse tendency was shown by output of rapeseed, which originates mainly in Canada,western and Eastern Europe, th~ USSR, and centrally planned economies in Asia and Southeast Asia. The recent trekd in output of sunflowerseed oil is expected to continue in the period to 1980 as yields stabilize and the area under sunflower in the USSR will probably not be greatly expanded beyond present levels. The possibility of a large scale introduction of sunflower plantings in the United States still seems remote. Wlth regard to rapeseed, most of the future expansion of output is expected in Canada, western Europe, the USSR and Eastern Europe and this may provide competition for other vegetable oils in developed markets. However, even at recent growth rates the increase in output of rapeseed will not be sufficient to capture a large share of the growing market for oils.
13. In contrast, the output of both palm oil and soybean oil, which has grown rapidly in the 1960s is expected to follow a strong upward trend in the coming decade. As will be shown in Section III, the important producing countries planted large areas to oil palm in the 1960s and have currently on hand plans supported in most ca.ses by the necessary financial arrangements -to plant more areas in the next few years. This planting is in addition to other forms of rP-hahilitation of the oil palm industry. World soybean output has risen from 26.5 million tons in 1956-60 to 43 million tons in 1966-70, a rise of 65 percent. The largest quantity increase was recorded in the United States where production doubled, rising from 14.2 million tons in 1956-60 to 28.7 million tons in 1966-70. Brazil's output of soybean rose fastest in percentage terms during the same period (+521 percent), but this country's total output in 1966-70 was still less than a million tons. The United States' soybean output is expected to rise to about 48 million tons!/ in 1980; Brazilian output is also expected to continue rising sharply, to about 10 million tons in 1980. These increases are mainly in response to demand for animal feeds both in the producing countries and abroad, but much output of soybean oil will also result as a byproduct of bean crushing for cake manufacture. The production of soybeans in China has remained at about the same level of 9 to 10 million tons throughout
See George W. Kromer, "An Economic View of Soybeans and Food Fats in the 1980 1 s 11 , Speech delivered before the Institute of Shortening and Edible Oils, Inc., Scottsdale, Arizona, March 16, 1973. Figures given in bushels were converted into metric tons at the rate of 36.7 bushels = 1 metric ton.
- 7 -
the last two decades and future output is likely to be tailored to domestic needs. If this is so, China will become neither a net exporter nor a net importer c·f soybeans or soybean cake and oil in the next decade. Total world out~·ut, including that of China, is forecast to reach roughly 70 to 75 million tons of soybeans by 1980, or 11 million tons oil equivalent.
14. Therefore, most of the increase in world demand for vegetable oils in the next decade will be met by increased supplies of palm oil and soybean oil. The 1971 and the projected 1980 shares of the different oils in world output of fats and oils are shown in Table 5 and Chart I. To a large extent, the outlook for palm oil prices on the world market depends on the relationship between the expansion of the market on the one hand and the growth of supplies of palm oil and soybean oil onthe other.
- 8 -
III. PALM OIL: PAST TRENDS AND FUTURE PROSPECTS OF DEMAND AND SUPPLY
15. The demand for palm oil and for other vegetable oils in major consuming countries grew rapidly in recent years.!( Demand increased particularly in the United States, where total consumption rose sixfold in the last five years after stagnating at a very low level during the preceding two decades. In other major developed countries consumption of palm oil increased less rapidly on the whole, though there was also a marked upswing in demand in the three main consuming countries: the United Kingdom, Germany and the Netherlands. The rise in demand for palm oil reflected both the general trend towards greater use of vegetable oils in consumer products and the fall in the price of palm oil relative to that of competing vegetable oils.
16. The price of palm oil relative to a weighted average of the prices of competing vegetable oils has fallen markedly since 1967, after increasing fairly steadily during the preceding ten years (Table 11, column 1). Given that the price elasticities of dema.nd are close to 1 or higher in the main export markets for the oil, the recent price behavior appears to be resP9~sible for a large part of the rapid rise in consumption in recent years.£/
17. As stated above, world demand for fats and oils is projected to continue growing steadily in the decade to 1980. The gradual shift of consumption in the developed countries away from animal fats and oils and towards vegetable oils is also expected to continue.The foreign demand context thus appears a priori favorable to palm oil. To this should be added the general expectation of rising incomes in developing countries which would entail a proportionally greater rise in demand for vegetable oils in view of
!/ In this paper there is no separate discussion of palm kernel oil, which is a by-product of the extraction of palm oil. Palm oil is extracted from the fleshy oleaginous pulp of the fruit (the mesocarp) which surrounds a nut containing the kernel. The nut is cracked and the kernel crushed in a separate process to obtain palm kernel oil. About nine-tenths palm oil and one-tenth palm kernel oil are extracted from the fruit in Malaysia and Indonesia, and four-fifths and one-fifth respectively in Africa.Differences are due to the different types of oil palm cultivated in these areas (mainly ten-nera in Southea.st Asia, mainly dura in West Africa). Palm kernel oil usually commands a higher price than palm oil. Its characteristics are more akin to those of coconut oil and its uses differ to that extent from the uses of palm oil.
~ Roughly speaking, the price elasticity is higher than 1 in the United States, C,-,nada and the United Kingdom, around 1 in Japan, Italy and the Netherlands and below one in other major developed importing countries.
- 9 -
the high income elasticities involved.l/ Projections for consumption of palm oil in 1980 have been calculated by the Bank staff for the four major consuming areas, namely developed countries as a group, centrally planned economies, non-producing developing countries and producing countries (all LDC's) (Table 9). Total demand for palm oil will reach 4,130 thousand tons in 1980 compared with 2,078 thousand tons in 1971, assuming the price in current dollars reiTains at its 1972 level of $?12 per metric ton. A little more than half of total palm oil consumption is expected to take place in developed countries, against 42 percent in 1971 and 35 percent in 1967. Total exports of palm oil will be in the range of 2,560 to 2,710 thousand tons (depending on alternative production forecasts for Malaysia), or 63 to 64 percent of total output compared with 48 percent in 1971 and 49 percent in 1967-69. Malaysia will be the dominant exporter and Indonesia will take second place; the Ivory Coast and possibly Zaire 2/ will be the only important exporters in Africa, although Dahomey will expand its markets further (Table 10). The share of LDC's in total consumption will fall from 57 percent in 1971 to 48 percent in 1980, but the share of intra-LDC trade in total exports will increase from 10 to 18 percent (low Malaysian output assumption).
18. The rapid increase in palm oil supply since the mid 1960s essenttally resulted from the intensive development programs implemented in Malaysia. These programs comprised extensive plantings and considerable improvements in yields. Malaysia accounted for only 7 percent of world output of palm oil in 1959-61 but its share rose to 13.8 percent in 1965-67 and 24 percent in 1969-71. Of the total increase in world output of 788 thousand tons between 1960 and 1971, 496 thousand tons, or 63 percent, took place in Malaysia. The long productive life of the plantings carried out in Malaysia and elsewhere leads one to expect that total world output of palm oil will, in the coming decade, continue to rise at a rate close to the one realized in recent years rather than along the lower long-term trend. A major part of the future increase in output is, in fact, expected to take place in Malaysia, because of its extensive new plantings under high-yielding varieties, covering 290 thousand hectares of land between 1961 and 71, and its plans to t::: ~ <g 140 thou"'ano h~r-t:.:rres tTt' more under oil palm in 1972-76. These plans
!/ Both the FAO in "Agriculture Comm.odi ty Projections, 1970-1980" Rome 1971 a~d the USDA, op • cit., pr eject a rapid growth of demand for v;getable ' o1ls in the LDC's on grounds of income elasticity.
~I The output and export forecasts for Zaire presented in Tables 11 and 12 appear, ?n rec?nt indications, to be on the optimistic side. According to certa1n est1ma~es Zaire's output may be lower by some 30,000 _ 50,000 tons th~n the proJected 235,000 tons in 1980. Exports may fall well below the ~roJected 75,000 tons. Failing detailed background information the ear~1er, more o~timistic official estimates have been used in this paper. It ~s worth not1ng, however, that the disappearance of Zaire as a main Afr1can.exporte~ would substantially alter the supply/demand outlook for the Afr1can reg1on as a whole.
- 10 -
may cover a planting area. as large as ?00 thousand hectares, depending how far they are realized. Malaysian output may thus increase to between 1,970 thousand and 2,125 thousand metric tons by 1980. A smaller yet significant increase in output is expected in Indonesia, where new plantings amounted to 25 thousand hectares in 1961-71, and in addition there are plans for extension to another 25 thousand hectares during 1972-76, with an equally important contribution to additional output from replantings and other forms of rehabilitation of old stands. In West Africa, the Ivory Coast has planted 60 thousand hectares in 1961-71 and has plans covering another 10 thousand hectares in 1972-76, thereby increasing its relative importance as a producer by 1980. 1/ Nigeria, on the other hand, is not expected to achieve progress in output, Which by 1980 probably will just reach the pre-civil war, 1966 level. The Nigerian Government plans for planting andreplantings thus far have not been realized and it is not expected that sufficient progress can be made from now to 1975 to project any sizable.increase in output from this source by 1980. Output from wild groves, which in Nigeria accounts for over 90 percent of total production, is projected to decline due to aging trees and increasing difficulties in finding the necessary labor to ensure maximum exploitation of the groves. As a result, Nigeria is expected to become a net importer of palm oil by 1980.
19. On the whole, Southeast Asia is thus expected to increase its total share of world output on account of more extensive plantings and higher yields, while the share of the traditional African producers will fall. The expected outputs of individual countries in 1980 are shown in Table 8, together with present and past production. 2/ Total output in 1980 is projected at 4.1 to 4.3 million tons, representing a growth rate of 8 to 8.5 percent in 1971-80, as against 12 percent a year between 1967-69 and 1971. Of this total, about 2.6 to 2.7 million tons would be exportable output representing an increase of 1? percent per year in the 1971-80 period compared with 15 percent in 1967-69 to 1971. The proportion of total palm oil output to the expected production of all fats and oils (by weight, oil or fat equivalent basis), which declined from 4.6 percent in 1950 to 3.2 percent in 1967 and recovered fully ·':Jy 1972, would increase to 7. 3 percent by 1980.
!/ The estimate for the Ivory Coast may turn out to be conservative if plans for further expansion presently envisaged are realized before 1975.
~ The 1980 forecast figure for many countries like Malaysia, Indonesia, the Ivory Coast, Dahomey and Cameroon are arrived at by estimating the oil palm areas by age distribution and multiplying them with yields for the corresponding ages. The yields used are mostly those available from selected areas, which could be higher than the average yields for the general run of the stands. Consequently, the 1::180 output estimates tend to vary according to the source of information. The figures in Tables 12 and 13 are those that appear most likely. A range of estimates is only given for Malaysia because o:' its importance as a producing country and the possible effects of changes in Malaysian output on the world supply/ demand situation.
- 11 -
20. Since palm oil and soybean oil are expected to compete closely in the period ahead to meet the demand for vegetable oils, !( the different conditions surrounding the supply of these oils must be given particular attention in evaluating the likely impact of this competition on their projected prices. A certain degree of inflexibility characterizes the supply of both oils, though for different reasons. In the case of palm oil the low supply elasticity is due to the perennial nature of the crop. Soybean oil, on the other hand, is a by-product of soybean crushings for meal so that, contrary to what could be expected for an annual crop, the supply of soybean in the form of oil cannot be· readily adjusted to the demand for oil; demand for meal is the main determinant of supply and it is growing at a more rapid rate. The forms in which the two competing commodities are tzaded also differ. While palm products are mainly exported in the form of oil, soybean trade takes place mainly in the form of beans for crushings into oilcakes in the importing countries.
21. In recent years, U.S. exports of soybean have increased rapidly to Europe and to newly emerging markets in the Soviet Union, Japan and Taiwan, partly in response to growing needs for high-protein animal feeds linked to the growth of livestock production. One aspect of this development has been the rapid expansion of crushing capacity in Europe. According to USDA estimates, 2/ U.S. exports of soybean will increase by about 1 million metric tons-a year in the next twelve to fifteen years, reaching about 22 million tons in 1980. In the United States itself, soybean crushings are projected to rise on average by 750,000 tons per year, to reach about ?6 million tons by 1980. U.S. exports of soybean oil are expected to increase relatively slowly, i.e. to 900,000 tons (1971: 800,000), in view of rising domestic demand for the oil. But the expansion of crushing capacity in Brazil and especially in Western Europe is expected to result in large soybean oil supplies to the world market from these sources. European countries have recently become important net exporters of soybean oil, 3/ indicating the possibility of saturation of the soybean oil market In these countries if the trend in soybean crushings continues.
y
Of the total increase in consumption of fats and oils (oil or fat equivalent) in the period to 1980, palm oil will account for about 17 percent and soybean oil for 30 percent.
See George W. Kromer, op. cit.
1/ Net exports of soybean oil by OECD-Europe have increased from 17,000 tons in 1968 to 74,000 tons in 1971.
- 12 -
22. <liven increased supplies of both palm oil and soybean oil in the coming decade and the fact that, though highly substitutable, these oils are not perfect substitutes either for each other or for other vegetable oils, some pressure on their market prices will be exerted. 1/ However, this pressure is likely to be moderate. Supplies of other vegetable oils are not expected to react to any great extent to a favorable price differential in the period to 1980 and, as stated earlier, world demand and supply for all fats and oils are projected to be in balance by 1980 without any serious fall of the current dollar prices of fats and oils in general. The projected price of palm oil and the projected price of soybean oil are shown in Table 12, where prices of other competing oils and corresponding price ratios are also given.
23. With regard to the future price of palm oil the following factors are relevant. Of a projected world palm oil consumption of 4,130 thousand metric tons in 1980, 1,520 thousand metric tons would be locally consumed in the producing countries. This leaves a total import requirement of 2,610 thousand metric tons in other countries, of which 14 percent would arise in nonproducing developing countries and 4 percent in Nigeria, which will become a net importer of palm oil in the amount of 100 thousand tons. World exports are projected at 2,560 to 2,710 thousand tons depending on developments in Malaysia. The difference of 150,000 tons between the low and the high projection for Malaysia is not expected to have any sizable effect on the price of palm oil. Only a small price adjustment at the margin may be required in a situation of overall balance between demand for and supply of fats and oils in the world market. Consequently, the current price of palm oil is expected to be in the range of $204 to $216 per metric ton in 1980. Taking the middle of this range as the most probable outcome, gives a 1980 price of $210 per ton, i.e. approximately equal to the average price in 1972. This price forecast does not take into account the effects of general inflation which may be reflected in the future price of palm oil.2/ If these effects are included the price range is $?37 to $?52 per metric tonin current 1980 dollars and the most probable ("average") price is $?45 per metric ton.
Chart 2 shows that there is a fairly close relationship between the relative price of palm oil and the share of palm oil in exports of competing vegetable oils. The correlation coefficient between the two series is -.704 in the 1955-67 period and -.491 in the 1955-71 period. The fall in the correlation is an indication that the pressure on the price of palm oil is less in periods of greater scarcity of competing vegetable oils (In this case, 1968-71 was such a period.).
On this issue, see IBRD document SecM73-265, op. cit., paragraphs 9 and 10.
- 13 -
IV. 1MPLICATION3 FCR BANK GRCUP INVESTMENT POLICY
24. Oil palm production is one of the sectors in which IBRD investment has been active. The Bank Group has participated in the financing of plantations of oil palm in Malaysia, Indonesia, the Ivory Coast, Dahomey, Sierra Leone, C~eroon and Papua and New Guinea. Total loans made by the Bank Group for oil palm projects in the last fiye years have amounted to about US$ 100 million. In addition, a small project in Ghana covering 5,000 hectares has been appraised and several projects are under consideration in Mal~sia, Indonesia, Nigeria and the Ivory Coast (Table 14).
25. The expected economic rate of return on the Bank Group projects appraised in the past four years has ranged from 7 to 17 percent in the west African countries, from 16 to 18 percent in Malaysia and over 20 percent in Indonesia. These calculations were based on a projected palm oil price of $160/ton "c.i.f. Europe". According to the projections presented here, the price is expected to be about $210 per ton c.i.f. Europe in 1980 dollars or $179 in 1972 dollars (the price used for purposes of project evaluation1 i.e. higher than previously. Even the price at the lower end of the projected range, i.e. $204 a ton, would come out higher than the previous project evaluation base. Moreover, yield rates on newer varieties of oil palm could possibly be raised 1/ and these two elE!Ilents combined would result in economic rates of return on-future oil palm projects higher than those calculated in previous appraisals, even allowing for same increase in costs. So the price projection far 1980 is such as to encourage further investment in oil palm production on the basis of rate of return alone.
26. New investments in oil palm plantings would generate additional out-put mainly after 1980. The peak yield period of paL~ trees occurs around the lOth year following planting, gradually diminishes until the twentieth year and falls further with aging stands. 2_/ The total productive life of the
In Malaysia, for example, the yield rates on newer varieties could reach a maximum of 6 tons of oil per ha. as compared with yield rates of about 5 tans per ha. on the present generation of varieties.
For example, in Malaysia the yield rate per ha. on high yielding varieties in average environmental conditions has been found to increase from 3,520 kgs. in the 6th year from planting to 5,145 kgs. in the loth year; thereafter there was a gradual decline in yields to 4,375 kgs. per ha. in the 20th year and to less in later years. ("Oil P .3.lm Cultivation in Malaya" N.C. Williams and Y.C. Hsu, University of Malaya Press, Kuala Lumpur, 1970 as quoted by H. VA Inte..rnational N. V. Amsterdam in "Long-Term Prospects for Palm Oil on the World Market for Fats and Oils".)
.-- 14 -
tree is about thirty years. A large proportion of the increase in world output from new plantings would come after 1980.
27. Though prospects of demand for palm oil after 1980 have not been analyzed in detail, if the trends projected to 1980 continue in the first. half of the next decade, world demand for vegetable oils will rise faster than demand for all fats and oils combined until 1985. However, same recovery of output of vegetable oilseeds competing with palm oil, notably groundnuts, may take place in the major producing regions if prices remain for some time at tre ir presently high level. This would mean that pressure would be exerted in the medium term on the world market prices of vegetable oils in general and therefore also on the market price of palm oil, though there seems to be no reason to expect the appearance of a serious excess of total supply over total demand.
28. The expectation of rising demand for palm oil in the developing world may involve a greater rate of absorption of output in the producing countries, but also greater import needs in some countries where the production potential appears to be lower than prospective demand. Thus Bank investment in palm oil production, notably in certain African countries, might alleviate possible foreign exchange problems arising from the need for import outlays for consumption purposes. Although investment in palm oil production for the domestic market in same of these countries may entail the use of Bank funds in areas where physical yields on palm oil investments are relatively low, y such investment may still appear advarr!iageous from the point of view of general development needs of the countries concerned and by comparison with alternative investment opportunities available to them.
29. The Food and Agriculture Organization of the United Nations (FAO) was consulted on the subject and have offered us valuable comments. Generally, the FAO staff concurs with the views expressed in this paper concerning the prospective growth of world supply and demand for fats and oils. Whereas, investment in palm oil for export should not be continued at the fast rate of the sixties and early seventies, there seems to be continuing scope for same investment in replanting and new planting for export. FAO also agrees that greater attention needs to be paid to increasing output for domestic production in producing countries. In order to get quick results, rehabilitation and more efficient processing of palm fruit is being stressed in current project proposals of both the UNDP and FAO. But futiure consumption requirements in cou...-.tries such as l'Ugeria are so large that investments in new commercial plantings and appropriate processing plants seem necessary.
For instance, in Malaysia and Indonesia, the yield of modern stands at full bearing is about 5 tons of palm oil per ha. In the African countries, yields from plantations under modern varieties range from over 3 tons per ha. in Ivory Coast and certain parts of Zaire (upper reaches of the Zaire river in Equator and Haut-Zaire Provinces) to about 1.8 tons per ha. in the remai."ling p.:1rts of Zaire, ~rigeria, Dahomey, ~~eroon and other countries (yields may of course vary considerably within each country). Lower yields in Africa are due to inadequate rainfall and its uneven distribution over the year, inadequate sunlight, and type of trees.
Table 1.: ESTIMATED IDRLD <XJNSUMPriON OF OILS AND FATS, BY MAJOR RIDIONS
(million metric tons - oil equivalent)
--I'eve"lo£cd Group Developin~ Grou) Centr·al1y Plarmcd G~oup
\D \.~) --r3 (!:) 15) (1':;) (7 (8) (9) I =rr£L (ll) .J.Bl u.s. & \'J'ostern Latin Canada E:.:rrope Others Total Asia Africa America Total u.s.s.R. Others Total HORLD
( l) Actual consumption figures for the United States arxl apparent estimated consumption for Canada. (2) Actual consumption figures for Western Europe, including France, Federal Republic of' Germaey, Netherlands, Itazy, Belgium/Luxembourg, Denmark, Norway, Sweden, Switzerland, Austria,
Portugal, Finland, Republic of Ireland, Greece arrl Spain. Yugoslavia is included from 1965 only. I (3) Others include apparent consumption for total Oceania, actual consi.unption for Japan arrl apparent consumption for the Republic of' South Africa. (5) Apparent consumption figures for Asia, excluding Japan and Mainland China. (6) Apparent consumption figures for Africa, excluding Republic of' South Africa. (7) Apparent consumption figures for area. (9) Actual consumption figures. (10) Others include Eastern Europe and Mainland China; all the figures are estimated apparent consumption.
Sources: Fats and Oil Situation, April 1971, USDA; various issues of' World Oila and Fats Statistics, Unilever Ltd., London and Oil World WeekJ.y, Hamburg; Pilot Stu~on Fats arxl Oils, second progress report prepared by the Food arxl Agriculture Organization of' the United Nations, Commission on International Commodity Trade, E/CN.l3/L. 6, 25 March 1958.
~: CONSUMPTION PER HEAD OF SElECTED EDIBLE OILS AND FATS, OECD COUNTRIES, 1960-1968
/1 Two-year average 1960-1961 to 1967-1968. 72 Average 1968-1969. a Weighted average consumption per head, using 1967-1968 for last year for countries where data is in two-year average. For
Ireland consumption of "other oils and fats" was used as proxy for margarine. For the UK "oils and fats, refined" was used as proxy for vegetable oils and fats.
Table 3: CONSUMPTION OF FATS AND OILS IN MAJOR CONSUMnll AREAS, 1971 AND 1980
(1,000 metric tons)
1971 Percentage (Partly 1980 Change Change
Estimated) Projected 1971 to 1980 1980L!971
United States 7,410 9,500 2,090
'W:lstern Europe 10,870 13,800 2, 930
Japan 1,600 3,000 1,400
Canada 400 620 220
Total OECD Countries 20,280 26,925 6,665
All Other Countries 24,120 29,130 5,010
Total World 44,400 56,050 11,650
Sources: 1971: United States, Japan and Canada - IBRD Staff estimates Western Europe - Unilever Ltd., "World Oils and Fats Statistics" World Total - world production (43 million tons) plus changes in stocks (1.4 million tons) All other countries - residual.
Source: 1971 Production: FAO; CCP:OF/73/7 and IBRD Staff estimates for Ghee (purified butter).
% of Total
6.5.71 19.64
8.93 7.32 7.14 .5.89 .5.36 .5.18 3.39 1.61 1.2.5
28.21 9.64 8.04
10 • .54
3 • .57 2.32 0.89 0.36
2 • .5o
100.0
1980 Projections: The estimates for oils marked with asterisks are those made by FAO and published in their study, "Agricultural Commodity Projections, 1970-80 11 , Rome 1971. Others are Bank Staff estimates.
Figures in brackets in the 1980 output column take into account alternative projections for Malaysia.
Table 6: PRODUCTION OF PALM OI4 BY COUNTRIES, 1951-72
(1,000 metric tons)
Proauct1o11 oi Paliii 01I Year --:vest Ea;;;t Ivory Sierra Total Total Total World
1-hla:rsia .t-lalay-sia Indonesia Nigeria Zaire Coast Dahomey Cameroon Leone Ghana Asia Africa Latin Total /1 /1 America a
* ThP figures are in~1uoeo in the rPgional totals.
/1 An adjustment has been made to the figures for Nigeria before 1961 to make them comparable with the figures from 1961 --- onwards. This adjustment has been carried into the regional and world totals.
/2 Provisional.
Source: FAO, Production Yearbook (Annual); National Statistics.
~
Table 7 : EXPORTS OF PALM OTI.. FROM THE PRODUCING COUNTRIES, 1950-72
(1,000 metric tons)
Expprt:S o_! 1:>?1 m oil from Eroducin~ countries Share of paJm Ivory Total Total Total l..forld oj_J in >>orJ d
Year Malaysia Indonesia Nigeria Zaire Coast Dahomey Cameroon Angola Asia Africa Latin Total exports of America [a:ts ancl oils
~!: PALM Oil. -PRESENT PRODUCTION, PRODUCTION IN SELECTED EARLIER YEARS AND PROJECTED OOTPUT IN 1980l BY COUNTRY
(1,000 metric tons)
Actual Production/1 Country 1951-55 1956-60 1961-65 1967-69 1971 1980 Forecast Shares in 1980 Output
Main Producers
1. Malaysia West East TarAL
2. Indonesia 3. Nigeria 4. Zaire 5. Ivory Coast 6. Dahomey 7. Cameroon 8. Colombia 9. Sierra Leone
TarAt
Other Producers
10. A.frica 11. Latin America 12. Others
TarAL
WORLD TarAL
51 153
187
75 150
232
..
125 151 521 210 25 39 43
37 1,151
174
1,325
287 184 358 216
33 39 32 15 41
1,205
187 35
222
1,427
589 225 500 230 77/2 4772 56-34 60
1,818
155 59 1
215
1,700 270
1,970 (2,125) 475 575 235 220 105 100
50* 60*
3,790 (3,945)
2,033/2 4,080 (4,235)
48.3 (50.2) 11.6 14.1 5.8 5.4 2.6 2.5
92.9 (93.2)
7.1 (6.8)
100 (100)
* FAO estimates, as given in the article "Prospects for Supplies of Palm Oil and Palln Kernels in 1980", FAO Monthly Bulletin of Agricultural Economics and Statistics, April 1972. This sign implies that figures are not separately shown but are included in the world total.
Source: FAO Production Yearbook; "West African Production and Elcport Prospects for Palm Oil and Palm Kernel Oil to 1980"1 FAS, USDA, Washington, ')eptember 1972. These figures differ somewhat from those given in FAO Production Yearbook, because of differences in estimates of production from world groves.
Table 9· . PAIM on. - ACTUAL COOUMPTION/1 IN SEL:EX:;TED YEARS AND DEMAND PROJECTIONS F'ffi 1980
(1,000 metric tons)
Actual Co~tion?l 1980 Count:z or GrouE :r~sr-ss !9So-~ -os !~7 !~7! ProJections
I. Developed Countries 492 .508 447 4.50 878 2,100
II. Centrally Planned Economies 4 4 6 6f1. .50
III. Developing Countries
A. Non-producing 18 .57 74 80 90 36o
B. Producing 667 688 770 767 1,104 1,620
IV. WORLD 1,181 1,2.57 1,296 1,303 2,078 4,130
/1 Consumption for the developed countries, non-producing developing countries and centrally planned economies represents net imports.
/2 1970 data.
Data Sources: FAO Production Yearbook; FAO Trade Yearbook; Unilever, Ltd., ''World Oils and Fats Statistics"; Projections, IBRD, Economic Analysis & Projections Department.
Country
Malaysia
Indonesia
Nigeria
Zaire
Ivory Coast
Dahomey
Cameroon
World Total
Table 10 : EXPeRTS OF PALM OIL AND SHARE OF EXPORTS IN OUTPUT, ACTUAL AND PROJECTIONS TO 1980, BY COUN'IRY
13 12 11 11 17 (n. a.) (n.a.) (?8.2) (28.2) (36. 2)
2 9 8 10 (n. a.) (n. a.) (?0.9) (25.0) (17.9)
~ 578 555 ~) 965 ) ~4~. 7) (41. 9) O:iB.l')
Projected/l 1980
1,910 (2,060) (97.0)
375 (78.9)
·100 (-)
75 (31. 9)
lt>O (54. 5)
65 (61.9)
20 (?0. 0)
2,565 (2,71.5) ~ti2.ID C64.2~
11 In brackets: share of exports in output, in percent. Percentages are calculated on the basis of average exports and average output in calendar years 1956-1960 and crop years 1956/57-1960/61.
Sources: Actual Exports: Unilever, Ltd., "World Fats and Oils Statistics" and FAO Trade Yearbooks.
Projections IBRD: Commodities and Export Projections Division, Economic Analysis and Projections Department.
Figures in brackets take into account alternative output projections for Malaysia.
Sources: 1960-1972: FAO, Document CCP:OF/ST 72/CRS. 3 dated February, 1972 as amended and supplemented. Earlier years: Van Doorn and Co. N.V. - Rotterdam and USDA.
Table 13' IBRD PARTIGJ:PATION IN FINANCINO OF PALM Oil AND PAlM KERNEL PROWCTION
Projects_ Fi=ncial Date Technical DataLg_ Total cost AmoJunt Period over Area-=. Pal.""' Oil Palm Kernels share of Production Ecanomi c rate
ProjectQ, Loan/CreditQ. Purpose which plantings Plantings at Estimated Max. Esti..~ted Max. available for exnort o~ return Qo\!!lt:ey carried out Total en:! 1971 Estimated Production Annual Production :stinated Production Annual Production Palm Palm
1970 1>75 19oo Year Thousand ~>70 1975 19oo Year Thousand oil kernels metric tons metric tons
1_1 The set of "competing oils" includes palm, soybean, palm kernel, rapeseed, sunflower, groundnut and cottonseed. Relative prices are the ratio of individual oil prices to a weighted average price for the competing set, using current export shares as weights.
Source: Table 9
Palm Oil relative price index 1959-61 = 100 (left scale)