Understanding the Lattice Nitrogen Stability and Deactivation Pathways of
Cubic CrN Nanoparticles in Electrochemical Nitrogen Reduction Reaction
Wenhan Guo, a Zibin Liang, a Yanqun Tang, a Kunting Cai, a Tianjie Qiu, a Yingxiao
Wu, a Kexin Zhang, a Song Gao a, b and Ruqiang Zou*a, b
a. Beijing Key Laboratory for Theory and Technology of Advanced Battery Materials,
Department of Materials Science and Engineering, College of Engineering, Peking
University, Beijing 100871, P. R. China
E-mail: [email protected]
b. Institute of Clean Energy, Peking University, Beijing 100871, P. R. China
Electronic Supplementary Material (ESI) for Journal of Materials Chemistry A.This journal is © The Royal Society of Chemistry 2021
1. Chemicals and Materials
Chromium chloride (CrCl3·6H2O, Ar, Shanghai Maclin Biochemical), urea (98%,
Beijing Ouhe Technology), absolute ethanol (C2H5OH, ≥99.7%, Beijing Tong Guang
Fine Chemicals), sulphuric acid (H2SO4, GR, XiLong Scientific), ultrapure ammonia
(NH3, ≥99.999%, Beijing HuaTong JingKe Gas Chemical Industry) were used as
received.
2. Materials Synthesis
2.1. Synthesis of Cr-Urea Xerogel
Chromium-urea (Cr[OC(NH2)2]6Cl3) coordination compound xerogel was
synthesized using a modified method from previous report[1]. 10.6580 g (0.040 mol)
CrCl3∙6H2O was dissolved in absolute ethanol to get concentrated solution. 14.4144 g
(0.240 mol) urea was dissolved in 20 ml absolute ethanol to get saturated solution. The
concentrated CrCl3/ethanol solution was added dropwise into saturated urea/ethanol
solution at 60-80 °C under constant magnetic stirring. After mixing, the mixture
solution was refluxed for 1-2 h, then heated at 80 °C to evaporate all the solvents. The
dried sample was grey-green xerogel of Cr-urea coordination compound. The xerogel
was soluble to water but not soluble to ethanol. The bulk xerogel was grounded into
fine powders and stored in vacuum dryer for further use.
2.2. Synthesis of Chromium Nitride Nanoparticles
Chromium nitride nanoparticles (CrN NPs) were synthesized by calcination of the
Cr-urea xerogel powders in NH3 atmosphere. Grounded Cr-urea xerogel fine powders
were loaded in an alumina crucible and placed in a tube furnace, heated to 600 °C at
1°C min-1 and kept for 2 h under NH3 flow, then naturally cooled down to room
temperature. The as-prepared CrN NPs dark-grey powders were cleansed at 200 °C for
12 h in vacuum oven to remove weakly adsorbed ammonia on the surface, then stored
in vacuum dryer.
2.3. Preparation of Working Electrodes
Typically, 10 mg CrN NPs catalyst and 20 μL 5% Nafion solution were added into
1980 μL absolute ethanol, and then dispersed by sonication for 2 h to form a
homogeneous ink. Then 100 μL of the catalyst ink was loaded onto a carbon fiber paper
(CFP) electrode with area of 1 × 1 cm2 and dried with the assistance of an infrared
heating lamp to achieve the mass loading of ~0.5 mg cm-2. As-prepared CrN/CFP
working electrodes were heated at 100 °C for 6 h in vacuum oven to remove residue
solvent and possible nitrogen contaminants, then stored in vacuum dryer.
3. Materials Characterization
Powder X-ray diffraction (PXRD) patterns of all the synthesized samples were
recorded by a Rigaku SmartLab X-ray diffractometer operating at 45 kV and 200 mA
with Cu Kα radiation (λ=1.5406 Å). Scanning electron microscopy (SEM) and
corresponding energy-dispersive spectroscopy (EDS) elemental mapping images were
taken using Hitachi Regulus 8220. Transmission electron microscopy (TEM) images,
high-resolution TEM (HRTEM) images and selected area electron diffraction (SAED)
patterns were taken using FEI Tecnai F30. X-ray photoelectron spectroscopy (XPS)
was measured by a Kratos Axis Ultra Imaging Photoelectron Spectrometer equipped
with a monochromatic Al-Kα X-ray source (hν=1468.7 eV) and calibrated at C 1s =
284.8 eV. The C, N, H conents of samples were analyzed by a vario EL CHN elemental
analyzer (Elementar Analysensysteme, Germany). Inductively coupled plasma optical
emission spectroscopy (ICP-OES) measurements were performed by Thermo IRIS
INTREPID with sensitivity up to ppm level. Inductively coupled plasma mass
spectrometry (ICP-MS) measurements were performed by PerkinElmer NexION 350X
with sensitivity up to ppt level. UV-Vis-NIR spectra were collected by an Agilent Cary
5000 UV-Vis-NIR spectrophotometer. Ammonia temperature-programmed desorption
(NH3-TPD) measurements were performed using a Quantachrome Pulsar TPR/TPD
automatic chemisoption analyzer with TCD detector and He carrier gas, using 50 mg
sample for each test, and the desorption ramping rate was 10 °C min-1. All the water
used in this work is ultra-pure (UP) deionized water (18.2 MΩ) produced by a Master-
S15 Ultra Pure Water Purification System.
4. Electrochemical Measurements
4.1. Pretreatment of Nafion Membranes
The Nafion 117 membranes were pretreated in 5 wt% H2O2 aqueous solution at
80°C for 1 h and soaked in deionized water for 1 h, followed by boiling in 5 wt% H2SO4
at 80°C for 1 h and soaked in deionized water for another 1 h.
4.2. Experimental Setup
Electrochemical NRR reactions were carried out in a standard gas-tight H-typed
two-compartment electrolysis cell with temperature-controlled circulating water bath
on both sides. 0.05 M H2SO4 aqueous solution (pH = 1) was used as electrolyte. Nafion
117 membrane was used to separate the cathodic and anodic compartments. As-
pretreated Nafion membranes were soaked in electrolyte for several minutes before use.
Before reaction, 15 mL of 0.05 M H2SO4 solution was added into the cathode and
anodic compartments, respectively. A 10 mm magnetic stirrer was added in the cathodic
chamber. Dry ultra-pure nitrogen gas (>99.999%) (or ultra-pure Ar, in the case of
reference experiments) was firstly passed through an 100 mL adsorption bottle filled
with 80 mL 0.5 M H2SO4 to remove any possible ammonia and soluble nitrogen
contaminants, then bubbled into the catholyte by a mass flow controller (D07-9E,
Beijing Sevenstar Electronics, calibrated by ultra-pure nitrogen, full scale 100 sccm).
The outlet gas tube was connected with an ammonia trap filled with 20 mL of 0.05 M
H2SO4 aqueous solution as adsorbent liquid to collect any ammonia escaped from the
electrolyte. Before each test, N2 or Ar gas was bubbled into the catholyte at a flow rate
of 50 sccm and inlet pressure of 1 bar for 30 min, then remained constantly purged at
low flow rate of 10 sccm during the whole electrolysis process. Magnetic sitrring was
applied to the cathodic chamber constantly during testing to improve diffusion and mass
transfer. PTFE tubes with diameter of 3 mm were used to connect all the equipment
used. All containers and equipment used in the experiments were rinsed with 0.05 M
H2SO4 solution and washed with excess amount of UP water before use. No ir-
compensation was applied for all the electrochemical tests in this work. All the current
densities were normalized to the geometric surface area. Reaction temperatures of all
the experiments were controlled at 25 °C by circulating water bath to exclude influence
from enrivonmental temperature variation.
4.3. Electrochemical NRR measurements
Electrochemical NRR measurements were performed on a CHI-760E
electrochemical workstation using a three-electrode configuration. Working electrode
loaded with electrocatalyst and Ag/AgCl/KCl(sat.) reference electrode were placed in
the cathode compartment; Pt foil counter electrode was placed in the anode
compartment. All potentials were measured against the Ag/AgCl reference electrode
and converted to the reversible hydrogen electrode (RHE) reference scale using the
following equation:
E (vs. RHE) = E (vs. Ag/AgCl) + 0.1989 + 0.0591 × pH (Eq. S1)
Cyclic voltammetry (CV) curves were collected at a scanning speed of 50 mV/s
between -0.8 V and +0.1 V at a scanning speed of 50 mV s-1.
Chrnoamperometric (I-t) tests were carried out at fixed potentials under constant
nitrogen stream (10 sccm) and magnetic stirring. Before each testing, the working
electrodes were emersed in fresh 0.05 M H2SO4 solution for 30 min to remove possible
adsorbed nitrogen contaminants, then washed with large amount of UP water. To
maintain the original initial activity of the CrN catalyst, no additional electrochemical
treatment was applied to the working electrodes before I-t tests. After reaction,
catholyte, anolyte and adsorbent solution in the downstream ammonia trap bottle were
collected separately for product quantification. New working electrodes and fresh
electrolytes were used for each test.
Electrochemical accelerated aging (EAA) was performed for electrodes to study
the long-term stability. Electrodes were cycled by CV from +0.1 V to target potential
at a scan rate of 100 mV s-1 for 50 cycles under 50 sccm Ar flow, followed by washing
with excess amount of UP water. The EAA-treated electrodes were then tested under
N2 or Ar for two consecutive 1 h-electrolysis with replenished electrolytes.
Cycling tests were performed using the same electrodes. Electrolytes and
adsorbents were collected and refreshed each hour to quantify the ammonia produced.
Catholytes after the first 1 h-electrolysis were collected for ICP-MS tests.
5. NRR Performance Evaluation
5.1. Quanfitication of Ammonia
Concentration of the ammonia produced was tested by spectrophotometric
indophenol blue method. Typically, 2.000 mL of the testing solution (electrolyte or
adsorbent) was mixed with 2.000 mL of 0.5 M NaOH aqueous solution containing 5
wt% salicylic acid and 5 wt% sodium citrate, followed by 1.000 mL of 0.05 M
NaClO/2.0 M NaOH aqueous solution and 200 μL of 1 wt% C5FeN6Na2O (sodium
nitroferricyanide) aqueous solution, and left standing under room temperature for 2 h.
The UV-Vis absorbance was then measured by an Agilent Cary5000 UV-Vis-NIR
spectrophotometer using deionzed water as reference. Concentration of ammonia was
determined by the absorption peak of indophenol blue around the wavelength of 655
nm. The concentration-absorption standard curves were calibrated using cooresponding
standard ammonia solutions every time before testing products. Standard ammonia
solutions of different concentrations were prepared by dilution of standard ammonia
solution (GBW(E)083341-2, TMRM®, 1000 ppm NH+ 4 in H2O) by 0.05 M H2SO4
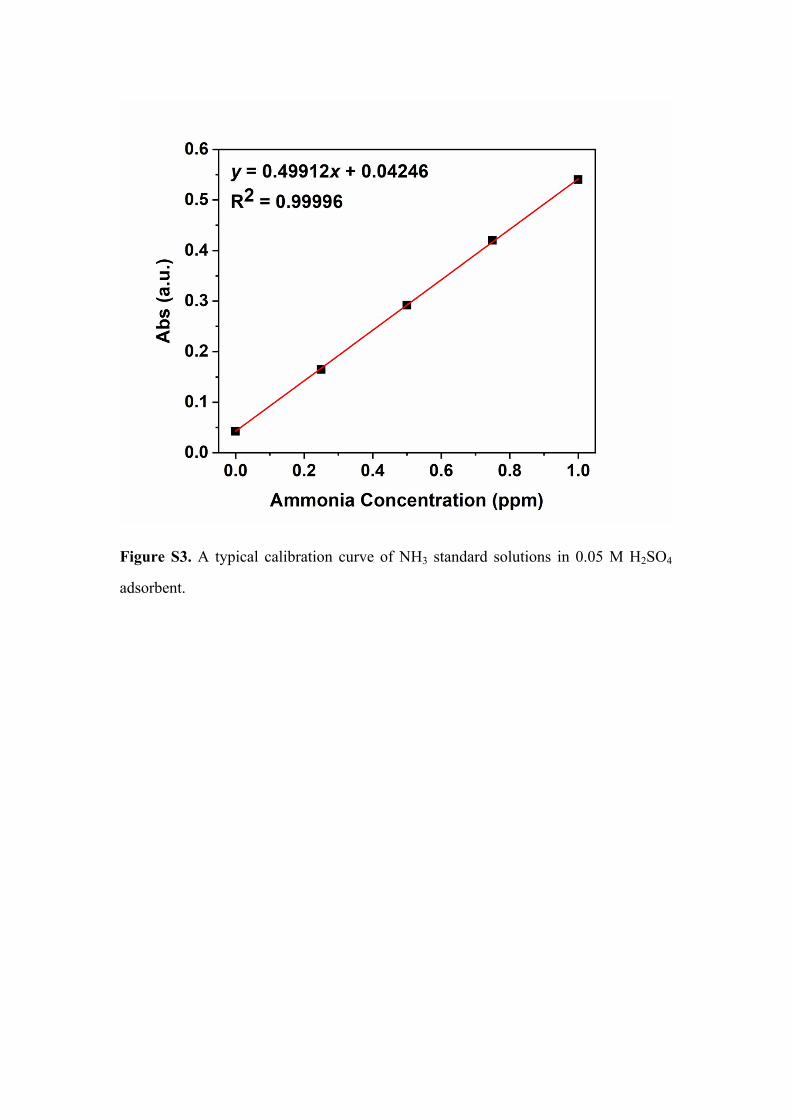
solution. Fig S shows the standard curve of ammonia in 0.05M H2SO4 solution.
5.2. Quantification of Hydrazine
Concentration of hydrazine in the electrolyte was determined by a
spectrophotometric method reported by Watt and Chrisp[2]. A mixture of para-
(dimethylamino) benzaldehyde (3.99 g), HCl (concentrated, 20 mL) and ethanol (200
mL) was used as a color reagent. For testing, 2 mL of reacted electrolyte was mixed
with 2 mL of color reagent and stirred for 10 min, then tested for absorption at a
wavelength of 463 nm. Standard solutions of different concentrations were prepared by
dilution of standard hydrazine solution (GNM-SN2H4-003-2013, GBTC®, 1000 ppm
N2H4 in 1.0 mol L-1 HCl) by 0.05 M H2SO4 solution. Fig S11 shows a typical standard
curve of hydrazine at 463 nm. Since no hydrazine was detected in the electrolytes,
adsorbents were not tested.
5.3. Calculation of Faraday efficiency and ammonia formation rate
Faraday efficiency is calculated using the following equation:
FE = 3 × n(NH+ 4) × F / Q (Eq. S2)
Where n(NH+ 4) is the total measured amount of ammonia (mol), F is the Faraday
Constant, Q is the total charge consumed (C), 3 is the electron transfer number per
ammonia molecule.
n(NH+ 4) = (Vc × c(NH+ 4)c + Va × c(NH+ 4)a + Vads × c(NH+ 4)ads) / 1000 (Eq.
S3)
c(NH+ 4)c is the concentration of ammonia in catholyte (mol L-1), c(NH+ 4)a is the
concentration of ammonia in anolyte (mol L-1), c(NH+ 4)ads is the concentration of
ammonia in adsorbent (mol L-1). Vc is the volume of catholyte (15.0 mL), Va is the
volume of anolyte (15.0 mL), and Vads is the volume of adsorbent (20.0 mL)
Ammonia production rate is calculated using the following equation:
r(NH3) = 17.043 × n(NH+ 4) / (t × m) (Eq. S4)
17.034 is the molecular weight of ammonia, r(NH3) is the average ammonia
production rate (μg h-1 m-1 cat), t is the reaction time (h), m is catalyst weight (mg).
The present ammonia production rates are normalized to the weight of catalyst for
easier comparison, considering that the areal mass loading of catalysts in literature
reports are not consistant.
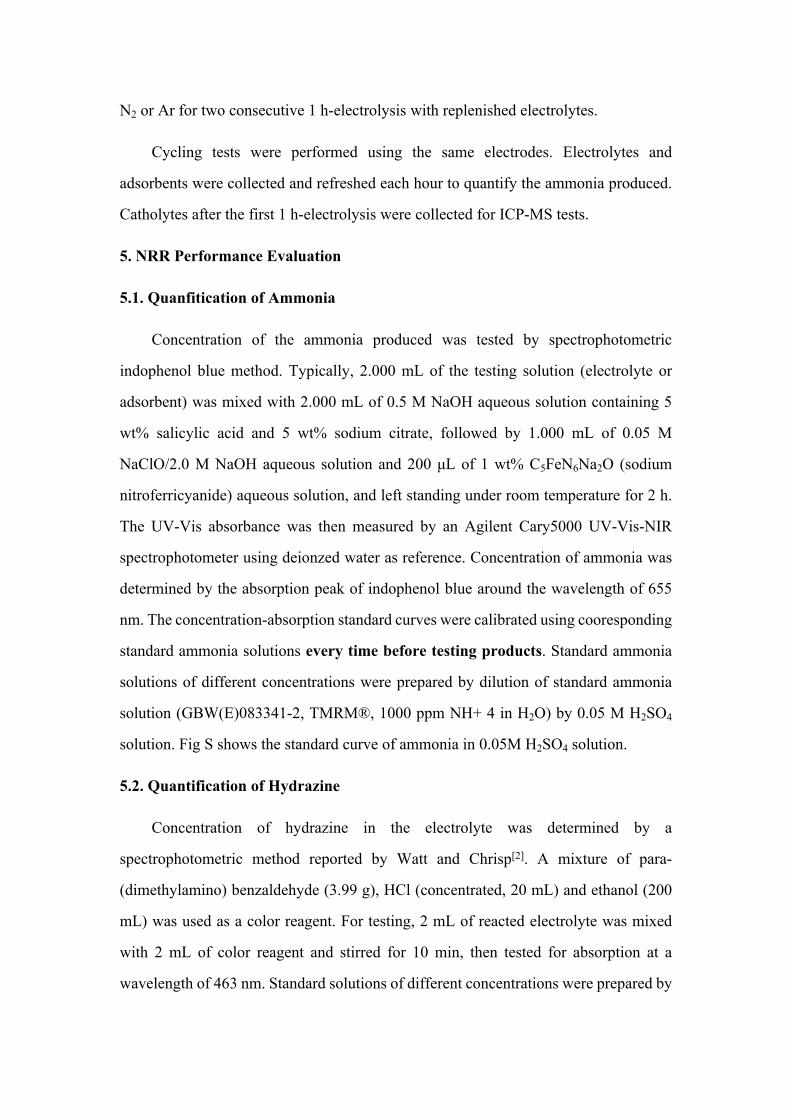
Figure S1. a) Illustration of the Cr[OC(NH2)2]3+ 6 octahedral coordination ion in the
Cr-urea xerogel; b) PXRD pattern of Cr-urea xerogel
Figure S2. a) SEM image of CrN NPs, and corresponding EDS mapping: b)
overlapped, c) Cr, d) N, e) O, f) C.
Table S1. Elemental composition of CrN NPs catalyst
SampleCr content
(wt%)a
N content
(wt%)b
C content
(wt%)b
H content
(wt%)b
CrN NPs 75.9 19.08 1.49 0.36
a: from ICP-OES
b: from CHN elemental analysis
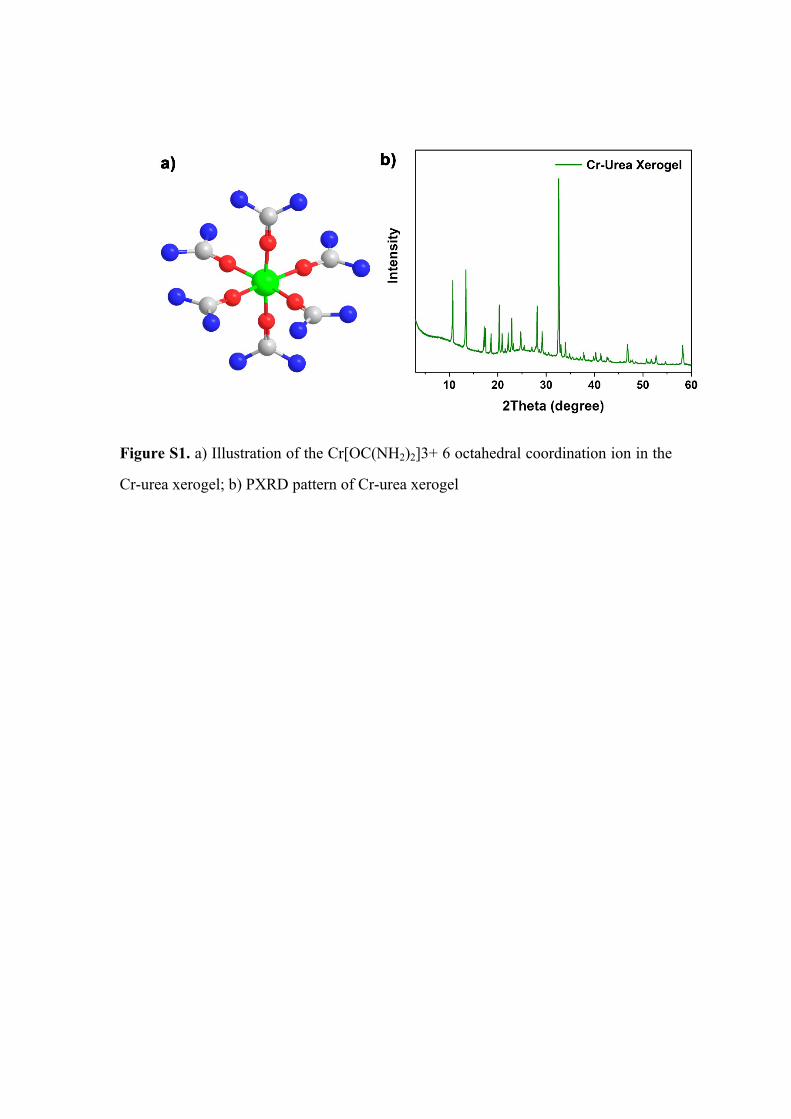
Table S2. Elemental composition comparison between surface and bulk phase of CrN
Cr content
(at%)
N content
(at%)
C content
(at%)
O content
(at%)
Surfacea 33.26 35.09 9.56 20.6
Bulk 41.69b 38.90c 3.54c 5.66d
a: from XPS survey spectra
b: from ICP-OES
c: from CHN elemental analysis
d: 100% subtracting contents from other elements (Cr, C, N, H)
Figure S3. A typical calibration curve of NH3 standard solutions in 0.05 M H2SO4
adsorbent.
Figure S4. NH3 yield rate of CrN NPs catalyst at different potentials for the initial 1 h
tests in N2/Ar atmosphere.
Figure S5. NH3 yield rate of CrN NPs catalyst during cycling tests.
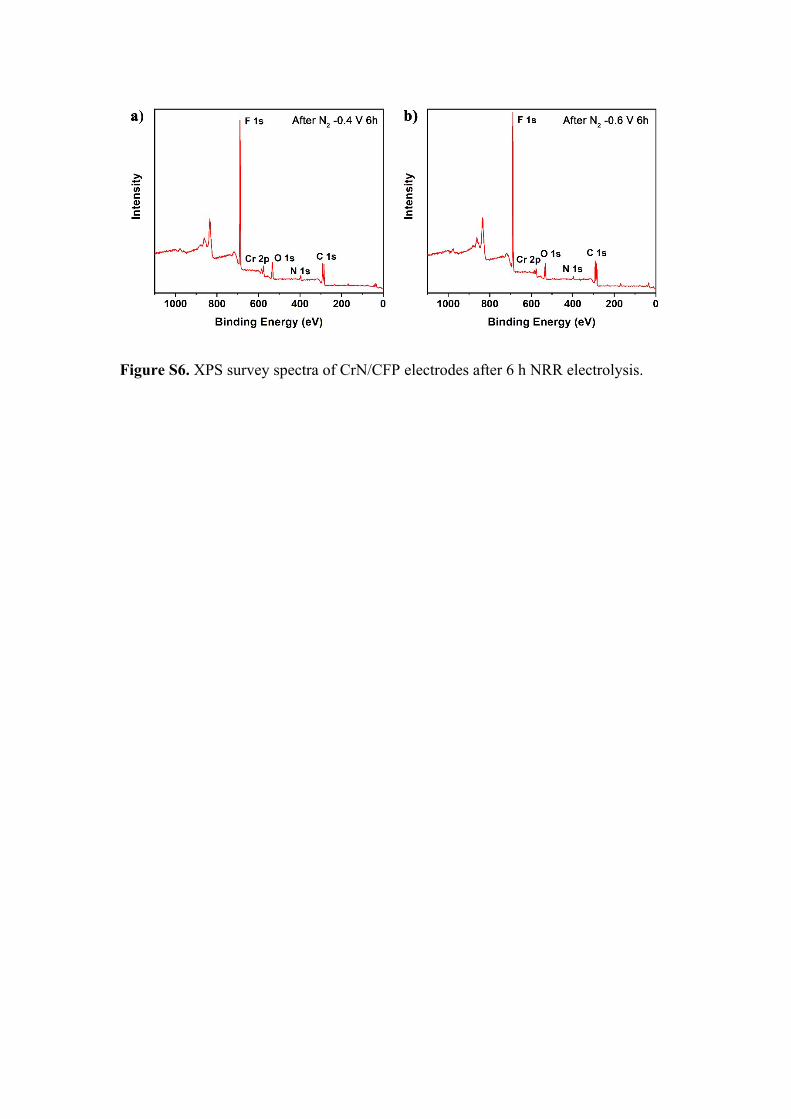
Figure S6. XPS survey spectra of CrN/CFP electrodes after 6 h NRR electrolysis.
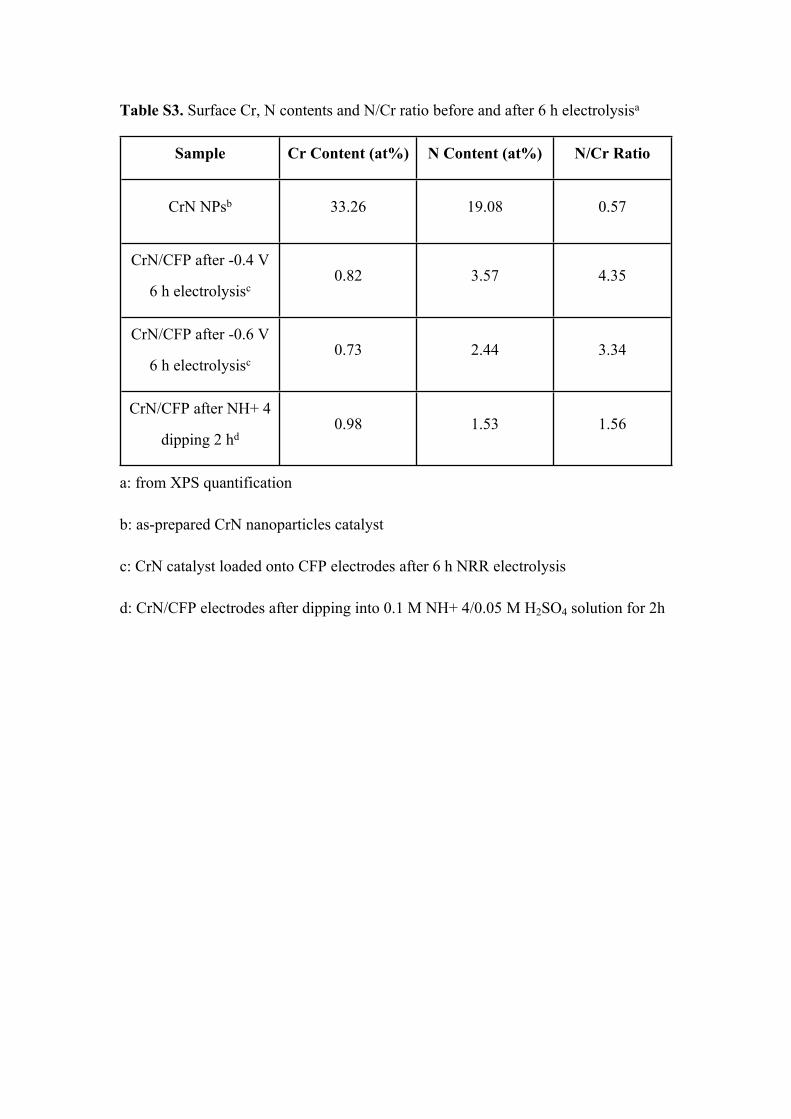
Table S3. Surface Cr, N contents and N/Cr ratio before and after 6 h electrolysisa
Sample Cr Content (at%) N Content (at%) N/Cr Ratio
CrN NPsb 33.26 19.08 0.57
CrN/CFP after -0.4 V
6 h electrolysisc0.82 3.57 4.35
CrN/CFP after -0.6 V
6 h electrolysisc0.73 2.44 3.34
CrN/CFP after NH+ 4
dipping 2 hd0.98 1.53 1.56
a: from XPS quantification
b: as-prepared CrN nanoparticles catalyst
c: CrN catalyst loaded onto CFP electrodes after 6 h NRR electrolysis
d: CrN/CFP electrodes after dipping into 0.1 M NH+ 4/0.05 M H2SO4 solution for 2h
Table S4. High-resolution Cr 2p3/2 XPS results for CrN NPs
Sample
Peak
Position
(eV)
Ratio
(%)
Peak
Position
(eV)
Ratio
(%)
Peak
Position
(eV)
Ratio
(%)
CrN NPs 574.531 9.47 575.472 47.64 576.464 47.64
CrN/CFP after
-0.4 V 6 h
electrolysis
574.744 9.78 575.684 41.97 576.695 48.25
CrN/CFP after
-0.6 V 6 h
electrolysis
574.804 8.66 575.786 49.33 576.96 42.01
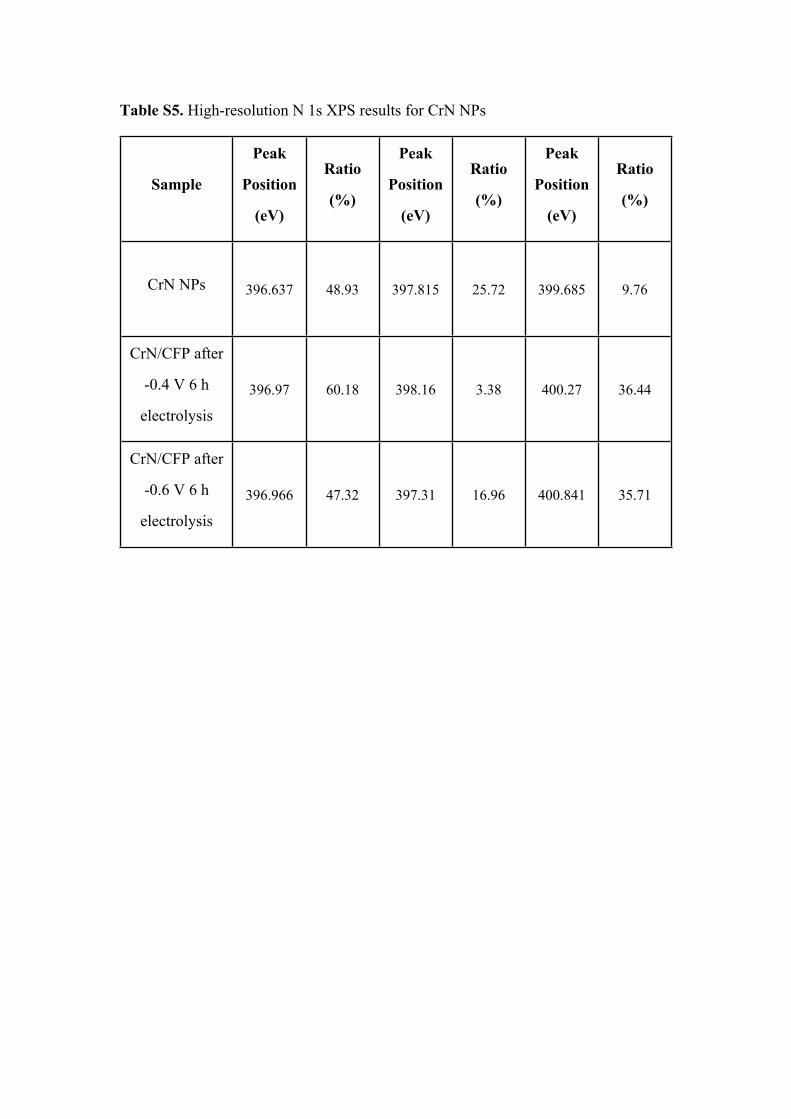
Table S5. High-resolution N 1s XPS results for CrN NPs
Sample
Peak
Position
(eV)
Ratio
(%)
Peak
Position
(eV)
Ratio
(%)
Peak
Position
(eV)
Ratio
(%)
CrN NPs 396.637 48.93 397.815 25.72 399.685 9.76
CrN/CFP after
-0.4 V 6 h
electrolysis
396.97 60.18 398.16 3.38 400.27 36.44
CrN/CFP after
-0.6 V 6 h
electrolysis
396.966 47.32 397.31 16.96 400.841 35.71
Figure S7. NH3-TPD curve for CrN NPs
Figure S8. XPS results of CrN/CFP electrodes after dipping into 0.1 M NH+ 4/0.05 M
H2SO4 solution for 2 h, a) survey spectra, b) N 1s.
The peaks at 401.03 and 402.94 eV correspond to adsorbed ammonia molecules
and ammonium cations. The bias of peaks compared with that after electrolysis
indicates the difference of nitrogen states at CrN surface, where the electrochemically
generated poisoning species might not be the completely protonated NH3 or NH+ 4
groups, but instead partially protonated surface nitrogen sites, which could not be
desorbed.
References
[1] Y. Qiu, L. Gao, Mater. Res. Bull. 2003, 38, 1551-1557.
[2] G. W. Watt, J. D. Chrisp, Anal. Chem. 1952, 24, 2006-2008.


![3. Performance range · CR 32 CR 45 CR 64 CR 90 CRI 1s CRN 1s CRI 10 CRN 10 CRI 15 CRN 15 CRI 20 CRN 20 CRN 120 CRN 150 1 2 4 6 8 10 20 40 60 80 100 200 400 600 800 Q [US GPM] 0 20](https://static.documents.pub/doc/80x56/6128df56106c4c14be437383/3-performance-range-cr-32-cr-45-cr-64-cr-90-cri-1s-crn-1s-cri-10-crn-10-cri-15.jpg)


