Citation: Cui, Y. and Wilcox, A. (2008) Development and application of numerical models of sediment transport associated with dam removal. Chapter 23 in “Sedimentation Engineering: Theory, Measurements, Modeling, and Practice, ASCE Manual 110,” Garcia, M.H., ed., 995-1020, ASCE, Reston, VA, ISBN 978-0784408149
Transcript
Citation:
Cui, Y. and Wilcox, A. (2008) Development and application of numerical models of sediment transport associated with dam removal. Chapter 23 in “Sedimentation Engineering: Theory, Measurements, Modeling, and Practice, ASCE Manual 110,” Garcia, M.H., ed., 995-1020, ASCE, Reston, VA, ISBN 978-0784408149
CHAPTER 23
Development and Application of Numerical Models of Sediment Transport Associated with Dam Removal
Yantao Cui and Andrew Wilcox
23.1 INTRODUCTION
Numerous dams have been removed in recent decades in the United States for reasons including economics, safety, and ecological restoration. For example, Edwards Dam, on the Kennebec River, Maine, was removed in 1999 to assist Atlantic salmon recovery efforts. In the Pacific Northwest, proposals to remove or breach dams on the Elwha River, Washington, and the Snake River, Idaho. to resuscitate declining stocks of anadromous salmonids have received national attention.
A key concern in many dam removal proposals is the routing of sediment stored behind reservoirs, including downstream channel response and release of contaminated sediments (e.g., Randle 2003). No studies have been com- pleted to document and quantify channel response to the removal of large dams (Graf 1996), although field observa- tions following the removal of small dams have intensified in recent years (e.g., Pizzuto 2002; Doyle et al. 2003). In addition, development of predictive models to estimate the effects of sediment release following dam removal has been limited until very recently. Decomnlissioning processes for dams, especially those with relatively large sediment depos- its. have been hindered by shortcomings in our capacity to quantitatively predict sediment-transport dynamics fol- lowing dam removal. and in the face of such uncertainties, costly dredging operations are often proposed before dam removal.
In this chapter we will discuss several issues in developing sediment-transport models following dam removal, including previous numerical modeling efforts relevant to dam removal, coupled modeling of reaches upstream and downstream of dams. reservoir sediment erosion, selection of sediment trans- port equations, and modeling of pre-dam-removal baseline conditions. We then present the development and application of numerical models for sediment transport following removal of Marmot Dam, a hydroelectric facility on the Sandy River,
Oregon, that is scheduled for decommissioning. The Marmot Dam removal modeling example is uscd to demonstrate the development and application of numerical mode!ing of sedi- ment transport following dam removal, thereby illustrating many of the general issues related to dam-removal modeling discussed in the following section.
23.2 DAM REMOVAL AND SEDIMENT-TRANSPORT MODELING
Many of the principles developed for modeling the trans- port of fluvial sediment are applicable to modeling sediment transport associated with dam removal. Effective numeiical models of sediment transport following dam reinoval should have the capability to route both fine and coarse sediment downstream, account for abrasion of gravel, and simulate transient flows. In developing and applying sediment- transport models for dam removal, modelers must address severaI unique issues, including the difficulties of coupled modeling of reaches upstream and downstrean of dain sites, uncertainties surrounding the channel morphology that will develop within the eroding reservoir sediments, selection of sediment-transport equations that account for the complex nature of reservoir sediment deposits, and the large spatial and temporal scales required for modeling the downstream transport of large volumes of reservoir sediment following dam removal. In the following section, we describe previous numerical modeling efforts relevant to dain removal and dis- cuss special considerations in developing sediment-transport models for dam removal.
23.2.1 Previous Numerical Modeling Efforts Relevant to Dam Removal
Because reservoir sediment deposits behave as large sedi- ment pulses once dams are removed, previous simulations of the evolution of sediment pulses in rivers have provided
996 DEVELOPMENT AND APPLICATION OF NUMERICAL MODELS
a basis for modeling sediment transport associated with dam removal. In the sediment pulse model of Cui and Parker (2005), multiple lithology heterogeneous sediment pulses were routed downstream with full consideration of particle abrasion. The model has been applied successfully to simu- late the evolution of a large landslide in the Navarro River, California (Hansler 1999; Sutherland et al. 2002). A simpli- fied version of the Cui and Parker (2005) model has also been used to simulate evolution of gravel pulses in a labora- tory flume (Cui et al. 2003).
The first adaptations of the Cui and Parker (2005) model to dam removal projects were applied to the potential removal of two dams in Oregon, Soda Springs Dam on the North Umpqua River and Marmot Dam on the Sandy River. This chapter presents the Marmot Dam removal modeling effort as a case study of the application of sediment-transport modeling to dam removal. Cui et al. (2006a; 2006b) further developed the Dam Removal Express Assessment Models (DREAM): DREAM-1 for simulation of dam rcmoval with the reservoir sediment composed of primarily fine sediment, and DREAM-2 for simulation of dam removal with the top layer of the reservoir sediment composed of primarily coarse sediment (gravel and coarser).
Off-the-shelf sediment-transport models have also been applied to dam removal evaluations. For example, the U.S. Army Corps of Engineers' HEC-6 model was used to simulate sediment release associated with pro- posed dam removals on the Elwha River, Washington (Bureau of Reclamation 1996a; 1996b). Such models are usually not capable of simulating the upstream and downstream reaches of a dam simultaneously, however,
deposited downstream of the dam, as will normally be the case in dam removal modeling, such a technique will usu- ally result in erroneous predictions, because the assump- tion that sediment transport upstream of the dam site is independent of that in the downstream reach becomes invalid. Using a critical cross section further downstream of the dam to meter out sediment may provide useful back- of-the-envelope estimates of suspended-sediment concen- tration in certain cases. Overall, however, this technique is problematic because sediment deposition following dam removal will inevitably alter the sediment-transport capac- ity, potentially by orders of magnitude.
Sediment-transport modeling following dam removal is as yet limited to one-dimensional models. One-dimensional models cannot simulate multidimensional effects such as lat- eral distribution of sediment deposition. This is true even if channel cross sections are used in simulations or if modeling rules are used to distribute sediment deposition and erosion across the cross section. One-dimensional models also can- not simulate local features such as topography generated by alternate bars and pool-riffle sequences and associated fine- scale effects on sediment deposition. As a result of the latter limitation, the best spatial resolution in the results of a one- dimensional model is on the order of several channel widths, i.e., the length of an alternate bar or pool-riffle sequence. Because of the coarse spatial resolution of one-dimensional models, professional judgment and general knowledge of sediment-transport dynamics should be applied to interpre- tation of one-dimensional model results in order to provide insight into finer-scale effects.
because the models were not originally written for dam 23.2.2 Coupled Modeling of Upstream removal applications, and the code of the models may and Downstream Reaches not be accessible to users for modification. Modelers may overcome these obstacles without access to and modifi- cation of the code in certain cases using two approaches: (1) modeling the upstream and downstream reaches of the dam separately, with the results of the upstream simulation providing input to the downstream reach; and (2) assuming that sediment-transport capacity is controlled at a criti- cal cross section somewhere downstream of the dam, and assuming unlimited sediment supply to that location until all the reservoir sediment is exhausted. Simulating upstream and downstream reaches of the dam separately can be an effective solution in certain cases in which some physical separation between reaches upstream and down- stream of the dam site is maintained during or after dam removal. Examples of such cases include dam removal methods in which sediment is metered out by an outlet structure with the dam still in place; early stages of a staged removal, where the remaining portion of the dam sepa- rates the two reaches; and a cohesive reservoir sediment deposit with limited potential for deposition immediately downstream of the dam. When the upstream and down- stream reaches of the dam are connected and sediment is
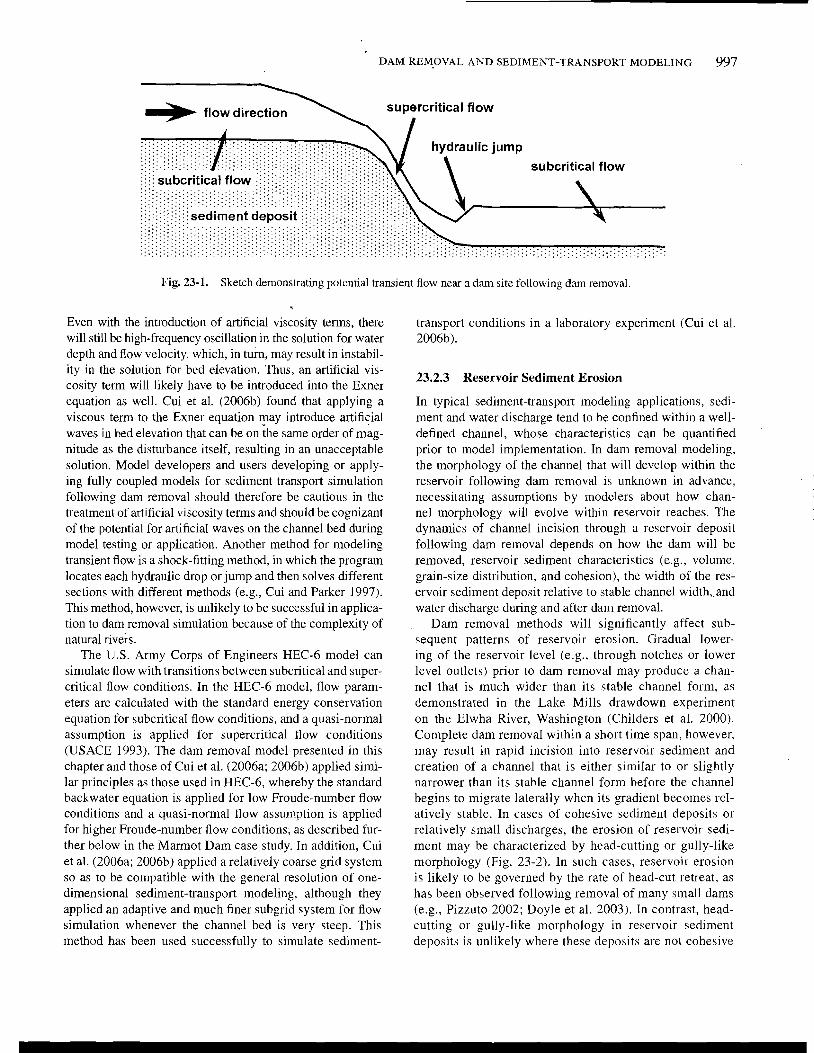
A key challenge in any dam removal modeling exercise is the simultaneous modeling of sediment-transport processes upstream of the dam, in the reservoir-influenced reach froin which sediment is eroded, and downstream of the dam, in the river reach to which the reservoir sediment is delivered. Simultaneous modeling of reaches upstream and down- stream of the dam must addrcss the difficulties in simulating flow over v e ~ y steep bed slopes. such as would be expected, to characterize the downstream portion of the reservoir sedi- ment wedge immediately following dam removal. In this important transition area between reaches upstream and downstream of the dam, very steep slopes can produce tran- sient flow conditions (Fig. 23-1). potentially resulting in numerical instabilities.
Several techniques can be used in coupled modeling of upstream and downstream river reaches. For exanlple, flow near the dam site can be simulated using a fully coupled model that retains the unsteady terms in the St. Venant shallow-water equations (Eq. (14- 1)). Apply~ng a fully couplcd model to simu- late the transient flow will involve the application of artificial viscosity terms in seeking a solution (e.g., Chaudhry 1993).
DAM REMOVAL AND SEDIMENT-TRANSPORT MODELING 997
supercritical flow
subcritical flow
Fig. 23-1. Sketch demonstrating potential tranc
Even with the introduction of artificial viscosity terms, there will still be high-frequency oscillation in the solution for water depth and flow velocity, which, in turn, may result in instabil- ity in the solution for bed elevation. Thus, an artificial vis- cosity term will likely have to be introduced into the Exner equation as well. Cui et al. (2006b) found that applying a viscous term to the Exner equation may introduce artificial waves in bed elevation that can be on the same order of mag- nitude as the disturbance itself, resulting in an unacceptable solution. Model developers and users developing or apply- ing fully coupled models for sediment-transport simulation following dam removal should therefore be cautious in the treatment of artificial viscosity terms and should be cognizant of the potential for artificial waves on the channel bed during model testing or application. Another method for modeling transient flow is a shock-fitting method, in which the program locates each hydraulic drop or jump and then solves different sections with different methods (e.g., Cui and Parker 1997). This method, however, is unlikely to be successful in appl~ca- tion to dam removal simulation because of the complexity of natural rivers.
The U.S. Army Corps of Engineers HEC-6 model can simulate flow with transitions between subcritical and super- critical flow conditions. In the HEC-6 model, flow param- eters are calculated with the standard energy conservation equation for subcritical flow conditions, and a quasi-normal assumption is applied for supercritical flow conditions (USACE 1993). The dam removal model presented in this chapter and those of Cui et al. (2006a; 2006b) applied simi- lar principles as those used in HEC-6, whereby the standard backwater equation is applied for low Froude-number flow conditions and a quasi-normal flow assumption is applied for higher Froude-number flow conditions, as described fur- ther below in the Marmot Dam case study. In addition, Cui et al. (2006a; 2006b) applied a relatively coarse grid system so as to be compatible with the general resolution of one- dimensional sediment-transport modeling, although they applied an adaptive and much finer subgrid system for flow simulation whenever the channel bed is very steep. This method has been used successfully to simulate sediment-
;ient flow near a dam site following dam removal.
transport conditions in a laboratory experiment (Cui et al. 2006b).
23.2.3 Reservoir Sediment Erosion
In typical sediment-transport modeling applications, sedi- ment and water discharge tend to be confined within a well- defined channel, whose characteristics can be quantified prior to model implementation. In dam removal modeling, the morphology of the channel that will develop within the reservoir following dam removal is unknown in advance, necessitating assumptions by modelers about how chan- nel morphology will evolve within reservoir reaches. The dynamics of channel incision through a reservoir deposit following dam removal depends on how the dam will be removed, reservoir sediment characteristics (e.g., volume. grain-size distribution, and cohesion), the width of the res- ervoir sediment deposit relative to stable channel width,,and water discharge during and after dam removal.
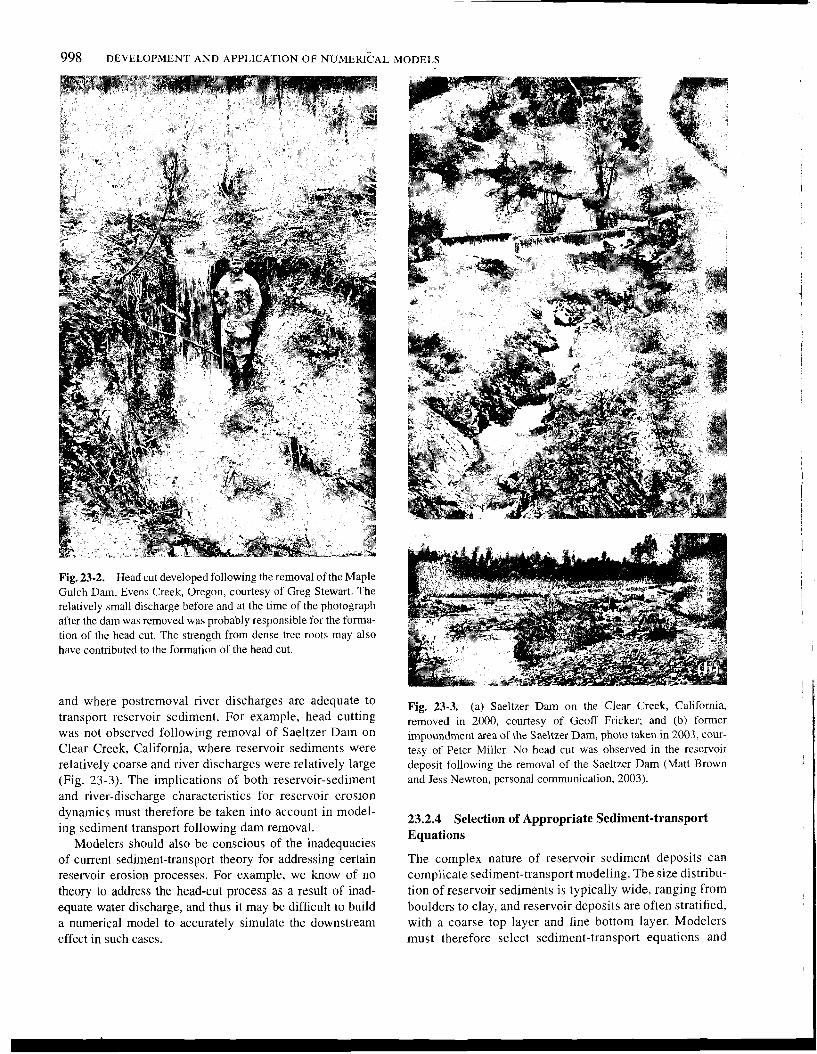
Dam removal methods will significantly affect sub- sequent patterns of reservoir erosion. Gradual lower- ing of the reservoir level (e.g., through notches or lower level outlets) prior to dam removal may produce a chan- nel that is much wider than its stable channel form, as demonstrated in the Lake Mills drawdown experiment on the Elwha River, Washington (Childers et al. 2000). Con~plete dam removal within a short time span, however, may result in rapid incision into reservoir sediment and creation of a channel that is either similar to or slightly narrower than its stable channel form before the channel begins to migrate laterally when its gradient becomes rel- atively stable. In cases of cohesive sediment deposits or relatively small discharges, the erosion of reservoir sedi- ment may be characterized by head-cutting or gully-like morphology (Fig. 23-2). In such cases, reservoir erosion is likely to be governed by the rate of head-cut retreat, as has been observed following removal of many small dams (e.g., Pizzuto 2002; Doyle et al. 2003). In contrast, head- cutting or gully-like morphology in reservoir sediment deposits is unlikely where these deposits are not cohesive
998 DEVELOPMENT AND APPLlCATlON OF N U M E K I ~ A L MODELS
Fig. 23-2. Head cut developed following the removal of the Maple Gulch Dam, Evens Creek, Oregon, courtesy of Greg Stewart. The relatively small discharge before and at the time of the photograph after the dam was removed was probably responsible for the forma- tion of the head cut. The strength from dense tree roots may also have contributed to the formation of the head cut.
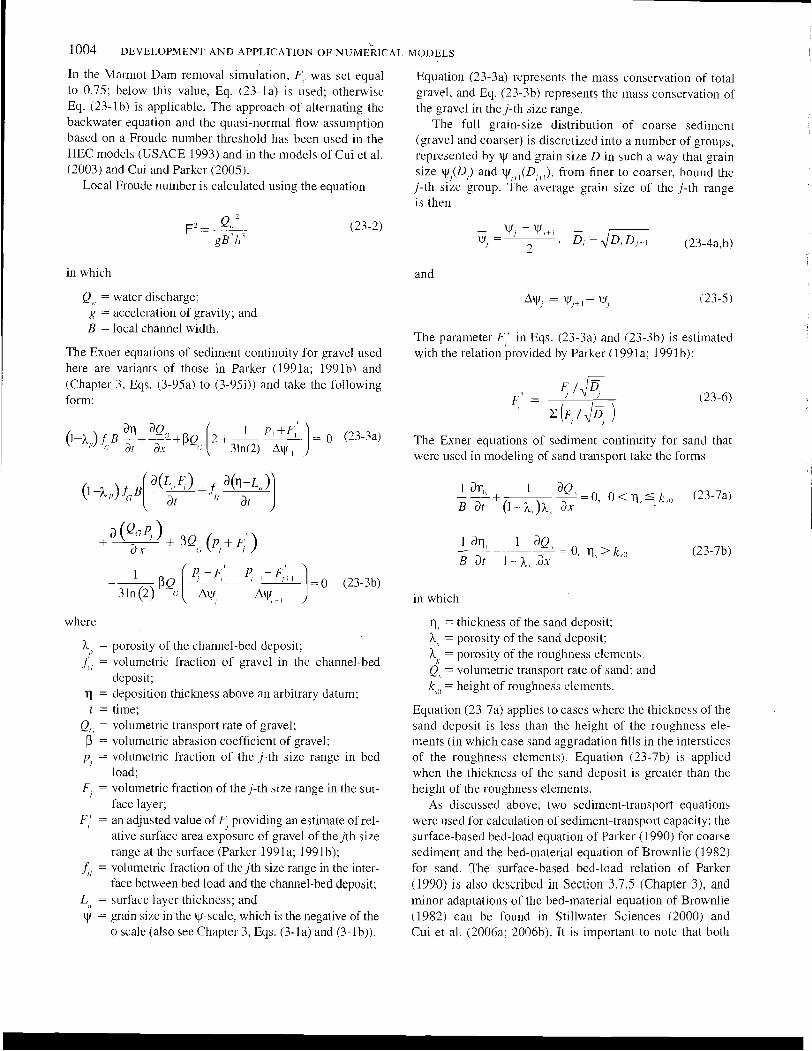
and where postremoval river discharges are adequate to transport reservoir sediment. For example, head cutting was not observed following removal of Saeltzer Dam on Clear Creek, California, where reservoir sediments were relatively coarse and river discharges were relatively large (Fig. 23-3). The implications of both reservoir-sediment and river-discharge characteristics for reservoir erosion dynamics must therefore be taken into account in model- ing sediment transport following dam removal.
Modelers should also be conscious of the inadequacies of current sediment-transport theory for addressing certain reservoir erosion processes. For example, we know of no theory to address the head-cut process as a result of inad- equate water discharge, and thus it may be difficult to build a numerical model to accurately simulate the downstream effect in such cases.
Fig. 23-3. (a) Saeltzer Dam on the Clear Creek, California, removed in 2000, courtesy of Geoff Fricker; and (b) former impoundment area of the Saeltzer Dam, photo taken in 2003, cour- tesy of Peter Miller No head cut was observed in the reservoir deposit following the removal of the Saeltzer Dam (Matt Brown \ and Jess Newton, personal communication, 2003).
23.2.4 Selection of Appropriate Sediment-transport Equations
The complex nature of reservoir sediment deposits can complicate sediment-transport modeling. The size distribu- tion of reservoir sediments is typically wide, ranging from boulders to clay, and reservoir deposits are often stratified, with a coarse top layer and fine bottom layer. Modelers must therefore select sediment-transport equations and
DAM
make other assumptions that are appropriate to the particu- lar reservoir sediment characteristics of the case in ques- tion. Until recently, no sediment-transport equations were available to handle mixtures of coarse sediment (gravel and coarser) and fine sediment (sand and finer), such as are typical of reservoir sediment deposits; this compli- cates efforts to model transport of such sediments. The sediment-transport equation of Wilcock and Crowe (2003) provides the first attempt to calculate transport of coarse and fine sediment simultaneously while accounting for the grain-size distribution of the coarse sediment. The equa- tion calculates gravel-transport rate by size fractions and sand transport rate based on known shear stress and sur- face grain-size distribution, including the fraction of sand on the bed surface. Development of a relation that links the grain-size distribution, including the fraction of fine sediment. in the subsurface to that on the channel surface and to the sediment load would facilitate incorporation of the Wilcock and Crowe (2003) equation into a secliment- transport model.
In lieu of using a sediment-transport equation that simul- taneously calculates coarse- and fine-sediment transport, one approach to modeling a widesize range of sediments is to employ separate models of fne- and coarse-sediment transport that calculate coarse- and fine-sediment trans- port independently. This approach, which was adopted for the Marmot Dam removal study presented below, is based on the assumptions that (1) coarse sediment is transported prin;arily as bed load during high-flow events, when fine sediment is transported primarily as suspended load, and (2) most fine sediment is transported during the intermedi- ate-flow events, when coarse sediment transport is limited. Observations that suggest that coarse- and fine-sediment transport may be only weakly correlated, and that modeling using independent equations for coarse- and fine-sediment transport is therefore defensible, are suggested by Cui et al. (2006b). These include the observations that (1) the fraction of fine sediment in gravel-bed sediment samples is rela- tively stable and insensitive to the amount of fine-sediment transport, and (2) the fraction of fine sediment in a clast- supported sediment deposit seems to be inversely corre- lated with the standard deviation of the particle grain-size distribution of the coarse sediment (Fig. 23-4), indicating that the fraction of fine sediment is dependent on the avail- able space of the coarse-sediment deposit (Cui et al. 2006b). Although applying separate equations for coarse and fine sediment is not a perfect solution because gravel and sand transport likely affect each other, this approach may provide an acceptable approximation.
If the approach of using separate models of coarse- and fine-sediment transport is adopted, modelers must select from the array of published transport equations for sand and gravel. For example. in the modeling of the Marmot Dam removal, we used Parker's surface-based bed-load equa- tion (Parker 1990) to model coarse-sediment transport and
REMOVAL AND SEDIMENT-TRANSPORT MODELING 999
O - -
- --
LL 1 ----. Linear regression 0 1 -C- I - - i - + - + - 4
1 1 1 2 1 3 1 4 1 5 1 6
Standard Deviation of Gravel Deposit
Fig. 23-4. Fraction of sand in graveusand deposit as a function of standard deviation of the gravel grain-size distribution in the secli- nlent deposit. Data were derived from a large-scale Rume experi- ment (SAFL downstream fining RUII 3) by Toro-Escoba et al. (1996), and the diagram was presented in Cui and Parker (1998).
Brownlie's (1982) bed-material equation for modeling trans- port of fine sediment, as discussed further in Section 23.3.2.
23.2.5 Reproducing the Pre-dam-removal Longitudinal Profile and Other Background Conditions
Because large volumes of sediment may be released down- stream following dam removal, downstream sediment impacts may be spatially and temporally extensive. To predict the nature of these impacts, numerical models therefore must be capable of simulating long river reaches for multiple years, and mod- elers should be conscious of the potential for propagation of elTors for such simulations. For example, the simulation of the Mamlot Dam removal presented below was applied to a 50-km river reach for a I O-yr duration following dam ren~oval.
Accurate simulation of a river reach over a long period of time requires that the model be capable of reproducing background conditions in the system of interest. Although reproduction of background conditions is a key task in sediment-transport modeling, this can be difficult to achieve because of a lack of sediment-transport theory, a lack of understanding of the system in question, and/or a lack of field data. In most cases the background condition can be treated as a quasi-equilibrium state, under which the channel bed experiences very limited amounts of aggradation and degradation over time. The process of trying to reproduce this quasi-equilibrium state, which we term the "zero process," provides a frame of reference from which subsequent changes predicted by modeling can be attributed to changes in input or boundary conditions, such as the removal of a dam. The zero process itself also provides model developers and users with an opportunity to test and adjust certain assumptions and input parameters used in modeling.
1000 DEVELOPMENT A N D APPLICATION OF NUMERICAL MODELS-
23.3 NUMERICAL SIMULATION OF SEDIMENT TRANSPORT FOLLOWING THE REMOVAL OF MARMOT DAM, SANDY RIVER, OREGON
The remainder of this chapter will present an application of one-dimensional numerical modeling simulation of sedi- ment transport following dam removal. Our treatment of the issues detailed above, including selection of sediment- transport equations, modeling of reservoir erosion. and reproduction of background conditions (the zero process), will be described, and modeling results from tht: example application will be presented. The following sections pro- vide background information on Marmot Dam and on the physical setting of the Sandy River basin, descriptions of the numerical models and their governing equations, discussion of the input data used in application of the models to the Sandy River, and results and discussion of the modeling.
23.3.1 Project Background
Marmot Dam is located on the Sandy River approximately 48 km upstream of its confluence with the Columbia River. The dam was originally completed in 1913 as a wood crib rock-filled structure, and it was replaced in 1989 with a 14-m-high, 104-m-wide concrete dam (Fig. 23-5). Approx- imately 750,000 m' of sediment is stored behind Marmot Dam, about two-thlrds of which is primarily gravelipebble and one-third of which is primarily sand (Squier Associates 2000). The Sandy River originates Irom Mt. Hood on the
Fig. 23-5. Marmot Dam, Sandy River, Oregon, scheduled for removal in 2007 (photo courtesy of Portland General Electric).
western slopes of the Cascade Range and has a drainage area of 1,3 16 kn12, about half of which is upstream of Marmot Dan1 (Fig. 23-6). A detailed description of the geology, hydrology, and geomorphology of the Sandy River basin is provided in Stillwater Sciences (2000).
Marmot Dam is scheduled to be voluntarily removed by Portland General Electric (PGE), the holder of the Federal Energy Regulatory Commission (FERC) license for this project. Removal of Marmot Dam will provide unrestricted upstream and downstream passage for anadromous salmo- nids and other aquatic organisms, restore natural flows ill the
Fig. 23-6. Map of the Sandy River basin
Sandy River from Marmot Dam to the Bull Run River conflu- ence, and, under some removal alternatives, release sediment stored behind Marmot Dam. Several alternative methods for removal of Marmot Dam have been developed, which differ in the amount of sediment accumulated behind the dam that would be released downstream. These removal alternatives are described in detail in Portland General Electric (3000) and are summarized as follows:
Single-season dam removal with minimal sediment removal; Removal of top of dam in year 1, followed by cornplete
I
dam renloval in year 2 with sand-layer excavation; Single-season dam removal after dredging or sediment to 830 m upstream of the dam: Single-season dam removal after dredging of 95,600 m3 of sediment; Single-season dam removal after dredging of 229,100 in' of sediment.
NUMERICAL SIMULATION OF SEDIMENT TRANSPORT 1001
The portion of the Sandy River likely to be affected by removal of Marmot Dam extends from the reservoir- influenced reach upstream of Marmot Dam downstream to the Sandy River's confluence with the Columbia River. For purposcs of studying the pote~~tial geomoi-phic effects of removing Marmot Dam. the pert~nent river reach was delineated into six subreaches (Fig. 23-7) according to their distinctive geomo~phic characteristics, as described below and in Table 23-1 :
The impoundment formed by the dam has filled to thc dam's crest with sediment and now functions as an allu- vial river reach. Compared to upstream and downstream reaches, this reach currently has a lower gradient and finer bed substrates as a result of the grade control pro- vided by the dam and the backwater effect of the dam's impoundment. The reservoir is believed to have filled with sediment in the early years following dam closure. Marmot Dam may continue to pxtially trap coarse sediment, although coarse- and fine-sediment transport over the dam do occur during high-flow events. Reach I: Reach 1 extends from Marmot Dam to the mouth of the Sandy River gorge and has moderately pronounced lorced pool-riffle morphology. This reach has an armored cobble/boulder bed surface with lim- ited gravel, possibly due to supply reductions c a ~ ~ s e d by Marmot Dam. Rench 2: Reach 2 is ~ h c Sandy River gorge, a steep (0.01 gradient) section of the river that is confined by 20- to 30-m-high bedrock strath terraces with sleep hillslopes above. The steep gradient and high confinement in this reach create very high shear stresses, resulting in high sediment-transport capacity. Few deposition areas are therefore present in this reach, and bedrock exposure in the channcl bcd is common. The reach is character- ized by long, deep bedrock pools that are separated by coarse-bedded riffles and boulder rapids, and large (house-sized) boulders are common in the channel. Rench 3: Reach 3 extends from the downstream end of the Sandy River gorge to the Bull Run River confluence. . . - Reach 0 (rsser-voir UI-eu): The Sandy River upstream This reach is considerably wider and lower-gradient than
of the Marmot Dam is affected by the backwater effect Reaches 1 and 2. reducing sediment-transport capacity of the dam for a distance of approximately 2 to 4 l a . and increasing the potential for sediment deposit~on.
300
Reach ", Reach 5
250
' I
I / Revenue Brldge
., .
' Dodge Park
-5 0 5 10 15 20 25 30 35 40 45 50
Distance f r o m Marmot D m (km)
Fig. 23-7. Sandy River longitudinal profile, based on PGE 1999 pl~otogrammetric data.
1002 DEVELOPMENT AND APPLICATION OF NUMERICAL MODELS
* Reaclz 4: Reach 4 extends from the Bull Run River confluence to Dabney State Park. In Reach 4, channel confinement, gradient, and bed particle size decrease further compared to upstream reaches, with these ten- dencies particularly evident in the lower half of the reach. Large cobble/gravel bars, side channels, and islands are cominon in Reach 4, which is bounded by high (mostly alluvial) terraces. Sand content in the bed subsurface, on the active bed, and on bars is high in the lower portion of the reach. Reach 5: Reach 5 extends from Dabney State Park to the confluence with the Columbia River. This reach is characterized by a highly mobile sand and gravel bed surface with large graveltsand alternate and medial bars. In the Sandy River delta, which forms the downstream- most portion of Reach 5, the channel is sand-bedded and depositional dynamics are strongly inf uenced by the backwater effect of the Columbia River.
23.3.2 Numerical Model Development for Application to Marmot Dam Removal
One-dimensional numerical models of fine- and coarse- sediment transport were developed to predict the routing of sediment froin behind Marmot Dam downstrealn through the Sandy River. Numerical models were completed to exanline a variety of alternatives for removing Marmot Dam. Model results provide estimates of the time required for sediment to be cleared from the reservoir area. time required for sedi- ment to travel out of the Sandy River (including various subreaches), thickness of downstream sediment deposits in various reaches (on a reach-averaged and cross-section- averaged basis), changes in deposition thickness through
time, and total suspended-sediment concentrations through time along the river's longitudinal profile following dam removal. Questions explored with the numerical models for different dam removal alternatives include the following:
* Will substantial bed aggradation occur following dam removal. or is the sediment-transport capacity downstream of the Marmot Dam high enough to mini- inize aggradation? How long will any aggradational cffect persist and in what reaches will it be most prominent? How much will suspended-sediment concentrations downstream of Marnlot Dam increase following dam removal, and how long will any such increases persist? How does transport distance from the dam affect suspended-sediment concentration and coarse- and fine-sediment accumulations following dam removal? Is there a distance downstream of which no detectable changes are expected? How will dredging of varying amounts of sediment horn Marmot Reservoir prior to dam removal affect downstream sediment deposition and suspended- sediment dynanlics? How will discharge conditions during and following dam reinoval affect downstream sediment transport and deposition characteristics?
Because unified theory and haspor t equations for gravel1 sand mixtures are still in a developing stage, as discussed above, two separate inodels were developed for application to the removal of Mar~not Dam: a gravel model for simulation of
Table 22-1 Summary of Geomorphic Characteristic; of Sandy River Reaches That Will Be Affecteri, by Removal of Marmot Dam
Reach Length Average Average Dominant grain (km) width (in) gradient Confinement Morphology size
Upstream of Marmot dain 2 4 (Reach 0)
Marmot Dam to gorge 2.4 (Reach 1)
Sandy River gorge 6.4 (Reach 2)
Downstream end of 9.6 Sandy River gorge to Bull Run River (Reach 3)
Bull Run River to 20 Dabney Park (Reach 4.)
Dabney Park to mouth 9.6 (Reach 5)
- -
50 0.0024 High Pool-riffle Gravel-sand
45 0.008 Medium Forced pool Cobble-boulder riffle/plane bed
30 0.01 High Step pool/ Bedrock-boulder forced pool riffle
50 0.006 Medium Forced pool Cob ble-gravel riffletplane bed
70 0.0025 Medium/low Pool riffle/ Gravel-cobble-sand plane bed
100 0.0007 Mecliuin/low Pool riffle Sand-gravel
the erosion of the reservoir deposit and downstream deposi- tion of coarse sediment (diameter > 2 rnm), and a sand model for simulation of suspended-sediment concentration and downstream deposition of fine sediment (diameter < 2 mm). The use of separate models assumes that (1) as the sediment is released from the reservoir deposit, gravel particles will be transported as bed load and sand will be transported mostly as suspended load because of the steep slope of the Sandy River, and (2) gravel and sand transport occur over differ- ent time scales (years versus days; i.e., a gravel particle may take years to travel the same distance that a sand particle travels in several days). In reality, use of separate models may create errors because transport of gravel and sand will each influence the transport rate of the other.
The gravel-transport model was developed based on Parker's surface-based bed load equation (Parker 1990) and is similar to the model of Cui and Parker (2005), with adjust- ments to accommodate the specific conditions of the Sandy River and Marmot Dam. The Parker equation calc~~lates gravel-transport rate and bed-load grain-size distribution based on the grain-size distribution of the surface layer and the boundaly shear stress. The Parker equation was devel- oped to apply to gravel-bed streams (particles larger than 2 mm in diameter) and was not intended for application to sand or for suspended material of ally size. Application of the Parker equation to a mixture with a relatively large amount of sand, such as the sediment accumulation behind Marmot Dam, may therefore create some error in predictions of the gravel-transport rate.
The one-dimensional model of sand transport was devel- oped based on Brownlie's (1982) bed-material equation. Brownlie's equation was developed for sand-bedded rivers but is used here because no sediment-transport equations exist to calculate sand transport in a bedrock- or coarse- sediment-dominated river such as the Sandy River. In apply- ing Brownlie's equation of sediment transport and fric- tion, we modified the roughness height to account for the bedrock, boulders, and gravel present along the bed of the Sandy River. Calibration and validation of this approach are required, however, and the error associated with applying Brownlie's equation to a gravel-bed river, even with rough- ness adjustments, is not known. Our model of sand transport assumesthe following: (1) sand transport can be represented as transport over a rough bedrock surface (i.e., the existing gravel bed of the Sandy River remains immobile with respect to sand transport); (2) silt is transported as throughput load that is carried in suspension and cannot be deposited in the channel bed; (3) reservoir sediment is not cohesive; and (4) sand transport is not affected by the amount of coarse- sediment aggradation and degradation downstream of the dam (i.e., the changes in channel gradient resulting from gravel deposition or scour are not accounted for in model- ing sand transport). This last assumption may create some errors in reaches where significant coarse-sediment deposi- tion occurs, such as immediately downstream of the dam.
As discussed in Section 23.2.3, simulation of reservoir erosion is a key challenge in dam removal modeling. In the Sandy River model, a number of simplifying assump- tions were made to simulate sediment release from Marmot Reservoir. The model assumes laterally uniform sediment transport out of the reservoir, with sediment mobilization and transport derived by the gravel model from Parker's (1990) sediment-transport equation. In the reservoir area, the model assumes that erosion is exclusively dependent on the trans- port capacity of gravel and the amount of gravel that can be provided through erosion of reservoir sediment deposit. As the gravels within a layer are mobilized, the sand volume within that layer is also mobilized and transported down- stream; it is assumed that sand is not available for transport until the gravel within the same layer as the sand is mobi- lized. Volumetric estimates of sand release from the reser- voir deposit that are generated by the gravel model using this method are subsequently used as the upstream boundary con- dition for the sand model. The model further assumes that, because the reservoir-influenced reach upstream of Marmot Dam (Reach 0) is relatively narrow, all the sediment will be eroded downstream following dam removal (i.e., there will be no long-term storage of reservoir sediment in Reach 0 following dain removal). Sensitivity tests were performed to address uncertainties in modeling of sediment transport from the reservoir and to qualitatively assess the potential effccts of incision, as described in Section 23.3.4 below.
The numerical models of fine- and coarse-sediment trans- port entail equations for calculating downstream changes in flow depth, Exner equations of sediment continuity for sand and gravel, transport-capacity equations, and flow-friction relations. The governing equations used in these models are introduced below; additional details are presented in Stillwater Sciences (2000; 2002).
To calculate downstream changes in flow depth, the stan- dard backwater equation is used for low-Froude-number flows and a quasi-normal assumption is applied for high- Froude-number flows:
where
h = water depth; x = downstream distance;
So = slope of the channel bed; S, = friction slope; F = local Froude number; and
F( = a user-defined Froude number that is smaller than and close to unity and that is used to differentiate between low- and high-Froude-number conditions in the application of Eqs. (23-1 a) and (23-lb) (see also Cui and Parker 2005).
In the hilarnlot Dam removal simulation, F( was set equal to 0.75; below thir value, Eq. (23-la) is used; otherwise Eq. (23-lb) is applicable. The approach of alternating the backwater equation and the quasi-normal flow assumption based on a Froude number threshold has been used in the HEC models (USACE 1993) and in the models of Cui et al. (2003) and Cui and Parker (2005).
Local Froude number is calculated using the equation
Equation (23-34 represents the mass conservation of total gravel, and Eq. (23-3b) represents the mass conservation of the gravel in the j-th size range.
The full grain-size distribution of coarse seclimcnt (gravel and coarser) is discretized into a number of groups, represented by y~ and grain size D in such a way that grain size w,(D,) and y,+I(Di+,), from finer to coarser, bound the j-th size group. The average grain size of the j-th range is then
in which and
Q,,, = water discharge; Awl = V,,,- W, i23-5) g = acceleration of gravity; and B = local channel width.
The parameter F,' in Eqs. (23-3a) and (23-3b) is estimated The Exner equations of sediment continuity for gravel used with the relation provided by Parker ( l99la ; 1991b): here are variants of those in Parker (1991a; 1991b) and (Chapter 3, Eqs. (3-95a) to (3-951)) and take the following form: F ' =
7 /E (23-6)
arl JQ (1-1 ) f R P + ~ + P Q = 0 (23-3a) The Exner equations of sediment continuity for sand that
" ' ( 1 3t 3x (1
were used in modeling of sand transport take the forms
where
h,, = porosity of the channel-bed deposit; S,; = volumetric fraction of gravel in the channel-bed
deposit; q = deposition thickness above an arbitrary datum; t = time;
Q,; = volunletric transport rate of gravel; 13 = volumetric abrasion coefficient of gravel:
pi = volumetric fraction of the j-th size range in bed load;
F, = volumetric fraction of the j-th size range in the sur- face layer;
F,' = an adjusted value of F, providing an estimate of rel- ative surface area exposure of gravel of the jth size range at the surface (Parker 1991a; 1991b);
,f;/ = volumetric fraction of the jth size range in the inter- face between bed load and the channel-bed deposit;
L', = surface layer thickness; and w = grain size in the y-scale. which is the negative of the
$ scale (also see Chapter 3, Eqs. (3-la) and (3- Ib)).
in which
r \$ = thickness of the sand deposit; h, = porosity of the sand deposit; hg = porosity of the roughness elements, Q, = volumetric transport rate of sand; and k,,, = height of roughness elements.
Equation (23-7a) applies to cases where the thickness of the sand deposit is less than the height of the roughness ele- ments (in which case sand aggradation fills in the interstices of the roughness elements). Equation (23-7b) is applied when the thickness of the sand deposit is greater than the height of the roughness elements.
As discussed above, two sediment-transport equations were used for calculation of sediment-transport capacity: the surface-based bed-load equation of Parker (1990) for coarse sediment and the bed-material equation of Brownlie (1982) for sand. The surface-based bed-load relation of Parker (1990) is also described in Section 3.7.5 (Chapter 3), and minor adaptations of the bed-material equation of Brownlie (1982) can be found in Stillwater Sciences (2000) and Cui et al. (2006a; 2006b). It is important to note that both
equations are used to calculate sediment-transport capacities rather than sediment-transport rates. Actual sediment-transport rates at any location were evaluated based on upstream sedi- ment supply, local sediment-transport capacity, erodibility of the channel bed, and sediment mass conservation. The application of the sediment-transport equations of Parker (19901, for gravel transport, and Brownlie (1982), for sand transport, requires the use of different friction relations. A Keulegan-type resistance relation (modified from Keulegan 1938) is used for gravel and Brownlie's (1982) friction for- mulation is used for sand, as detailed in Stillwater Sciences (2000) and Cui et al. (2006a; 2006b).
In addition to evaluating coarse and fine sediment- transport rates, this modeling effort includes estimates of total suspended-sediment (TSS) concentration following dam removal, to assist evaluation of biological impacts. The suspended-sediment concentration is calculated by combin- ing the portion of sand that is transported in suspension with the entire silt and clay load (sediment finer than 62.5 pm) in transport. All of the silt and clay from the reservoir deposit is treated as throughput ioad that is cai~ied in suspension once it has been mobilized from the reservoir. The criterion set for suspension of sand is given as follows (e.g., van Rijn 1984):
in which
v, = particle settling velocity calculated with the proce- dure given by Dietrich (1982);
u . = shear velocity; and K = von Karman constant, with a value of approximately
0.4.
TSS therefore is composed of all the part~cles finer than 62.5 ,urn from the reservoir deposit and those satisfying Eq. (23-8).
23.3.3 Input Data and Zero Process
The sediment-transport models developed for the simulation of the removal of Marmot Dam use input data on channel gradients, channel widths, water discharge at each section of the river for the duration of the simulation, grain-size dis- tribution of the sediment deposit in the reservoir and in the downstream channel, and the sediment supply and associ- ated grain-size distribution upstream of the Marmot reser- voir. The modeling of total suspended sediment following dam removal also requires an order-of-magnitude estimate of the background average sediment concentration in the Sandy River. These input parameters and their sources are described in the following sections.
23.3.3.1 Channel Gradient and Width Data on chan- nel gradients, and an associated longitudinal profile of the Sandy River from 4.8 lun upstream of Marmot Dam
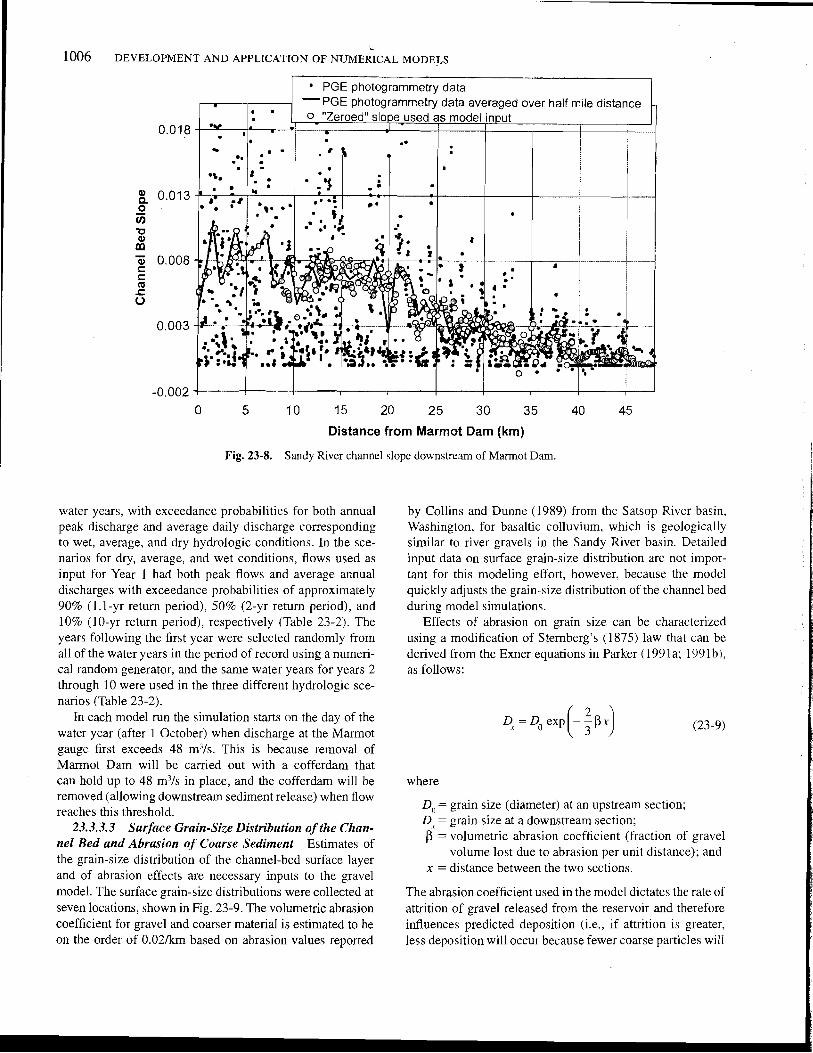
downstream to the Columbia River, were derived from 1999 photogrammetric measurements of the Sandy River. The photogrammetric data measure water-surface eleva- tion with an accuracy of k0.6 nl and were averaged over a 0.8-km distance to further smooth the longitudinal profile (Figs. 23-7 and 23-8).
Channel widths were measured from 1 :6,000-scale aer- ial photographs of the Sandy River corridor. Field checking of randomly selected cross sections with a laser distance finder found that channel widths measured from aerial pho- tographs were generally within 10% accuracy. One excep- tion is in Reach 2 (the Sandy River gorge), where widths cannot be measured from aerial photographs due to the nar- row channel and valley in this reach. A channel width of 30 m was applied to all of Reach 2 in the model, based on the average of field-measured widths in the Sandy River gorge. In all other reaches of the Sandy River, channel width was varied in the model according to the aerial photographic measurements.
23.3.3.2 Discharge Data and Hydrologic Scenarios Used in Numerical Modeling A daily discharge series spanning the length of model runs was also required as input. Daily discharge data used as input for the modeling are from the USGS Sandy River near the Marmot gauge (Station 1413700), which was assumed to represent the reach from Marmot Dam downstream to the Bull Run River confluence, and the Sandy River below the Bull Run River gauge (Station 14142500), which was assumed to represent discharge from the Bull Run River to the mouth (Fig. 23-6). The Bull Run River is the largest tributary that enters the Sandy River downstream of the Ma-mot Dam. Other tribu- taries have small drainage areas, and therefore are likely to create only small increases in water discharge in the Sandy River.
Numerical modeling was performed for three different hydrologic scenarios to evaluate the effects of various flow regimes following dam removal on sediment transport and deposition dynamics. The flows occurring following dam removal, particularly in the first year after removal, will have an important influence on the time required for downstream transport of reservoir sediment, on subsequent deposition patterns, and on the duration of impacts on aquatic organ- isms. Scenarios for wet, average, and dry hydrologic condi- tions were developed for input into the numerical modeling, with the flows in the first year after ren~oval varying in each scenario (i.e., hydrologic scenarios were defined according to the discharge conditions in the first year of the model run). The hydrologic scenarios account for both peak flow magnitude and overall water yield, both of which influence sediment-transport dynamics. The pealc and annual daily average discharges from the Marmot gauge were fit to a log Pearson 111 distribution and a normal distribution, respec- tively, to predict the return period of future discharges. Based on this analysis, daily discharge records were selected as input for Year 1 of model runs froin three representative
- 1006 DEVELOPMENT AND APPLICATION OF NUMERICAL MODELS
PGE photogrammetry data -1 -PGE photogrammetry data averaged over half mile distance A
a . [ 0 "Zeroed" slope used as model input 0.018 1
Distance from Marmot Dam (km)
Fig. 23-8. Sandy River channel slope downstream of Marmot Dam.
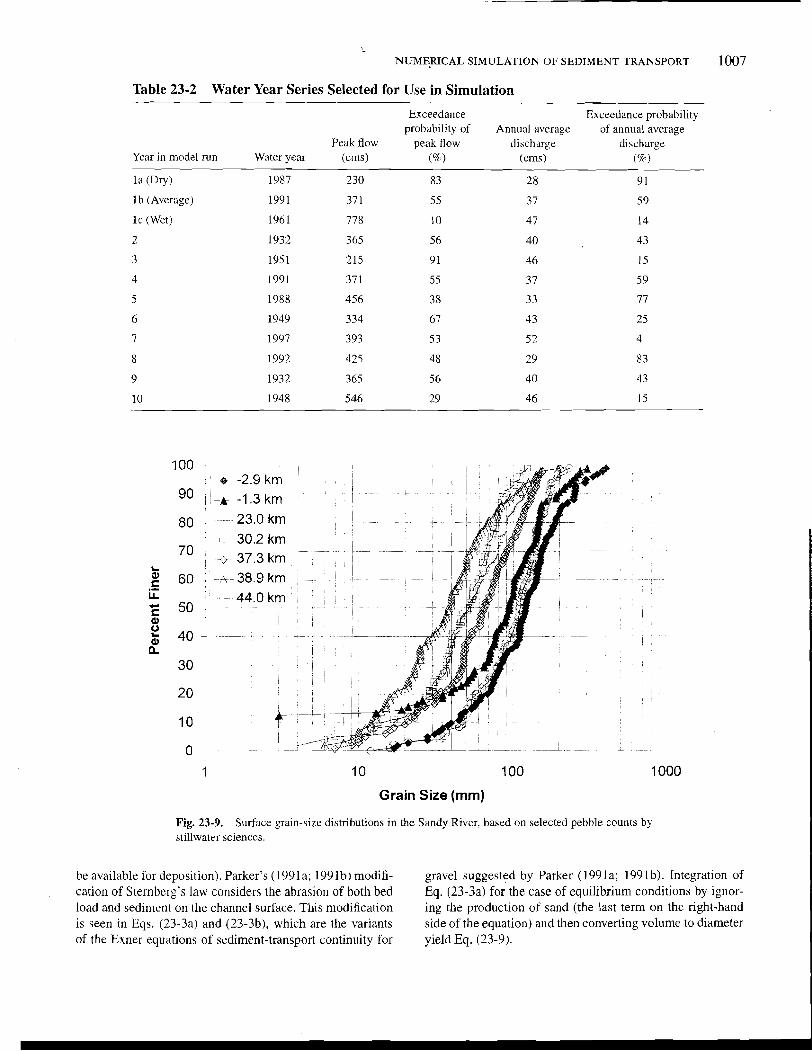
water years, with exceedance probabilities for both annual peak discharge and average daily discharge corresponding to wet, average, and dry hydrologic conditions. In the sce- narios for dry, average, and wet conditions, flows used as input for Year 1 had both peak flows and average annual discharges with exceedance probabilities of approximalely 90% (1.1-yr return period), 50% (2-yr return period), and 10% ( I 0-yr return period), respectively (Table 23-2). The years following the first year were selected randomly from all of the water years in the period of record using a numeri- cal random generator, and the same water years for years 2 through 10 were used in the three diffcrent hydrologic sce- narios (Table 23-2).
In each model run the simulation starts on the day of the water year (after 1 October) when discharge at the Marmot gauge first exceeds 48 m3/s. This is because removal of Marmot Dam will be carried out with a cofferdam that can hold up to 48 m3/s in place, and the cofferdam will be removed (allowing downstream sediment release) when flow reaches this threshold.
23.3.3.3 Surface Grain-Size Distribution of the Chan- nel Bed and Abrasion of Coarse Sediment Estimates of the grain-size distribution of the channel-bed surface layer and of abrasion effects are necessary inputs to the gravel
by Collins and Dunne (1989) from the Satsop River basin, Washington, for basaltic colluvium, which is geologically similar to river gravels in the Sandy River basin. Detailed input data on surface grain-size distribution are not impor- tant for this modeling effort, however, because the model quickly adjusts the grain-size distribution of the channel bed during model simulations.
Effects of abrasion on grain size can be characterized using a modification of Sternberg's (1875) law that can be derived from the Exner equations in Parker (1 991 a; 199 1 b ), as follows:
Dl =Do exp - -Px ( : 1 where
D, = grain size (diameter) at an upstream section; DL = grain size at a downstream section; p = volumetric abrasion coefficient (fraction of gravel
volume lost due to abrasion per unit distance); and x = distance between the two sections.
model. The surface grain-size distributions were collected at The abrasion coefficient used in the model dictates the rate of seven locations, shown in Fig. 23-9. The volumetric abrasion attrition of gravel released from the reservoir and therefore coefficient for gravel and coarser material is estimated to be influences predicted deposition (i.e., if attrition is greater, on the order of 0 . 0 2 h based on abrasion values reported less deposition will occur because fewer coarse particles will
Table 23-2 Water Year Series Selected for Use in Simulation
Exceedance Exceedance probability probability of Annual average of annual average
Peak flow peak flow discharge discharge Year in model run Water year (cms) (%I (cms) (%>)
la (Dry)
I b (Average)
l c (Wet)
2
3
4
5
6
7
8
9
10
Grain Size (rnrn)
Fig. 23-9. Surface grain-size distributions in the Sandy River, based on selected pebble counts by stillwater sciences.
be available for deposition). Parker's (1991 a; 1991 b) modifi- gravel suggested by Parker ( 199 la; 1991 b). Integration of cation of Sternberg's law considers the abrasion of both bed Eq. (23-3a) for the case of equilibrium conditions by ignor- load and sediment on the channel surface. This modification ing the production of sand (the last term on the right-hand is seen in Eqs. (23-3a) and (23-3b), which are the variants side of the equation) and then converting volume to diameter of the Exner equations of sediment-transport continuity for yield Eq. (7-3-9).
1008 DEVELOPMENT AND APPLICATION OF N U M ~ R I C A L MODELS
Because this modeling effort focuses on evaluation of channel aggradation following sediment release from the reservoir deposit (rather than degradationlincision in the downstream channel bed), results are not sensitive to subsur- face grain-size distribution in the channel bed downstream of the dam. For simplicity, it is assumed that downstream of the reservoir area, the subsurface grain-size distribution is the same as that of the surface layer.
23.3.3.4 Grain-Size Distributioiz of the Reservoir Sedimerlt The grain-size distribution of the sediment accu- mulation stored behind Marmot Dam, which will influence downstream sediment-transport and deposition patterns, was determined based on sampling conducted in October 1999. Sampling of the reservoir sediment consisted of drill- ing a series of cores within 1 km upstream of the dam and manual and mechanical excavation further upstream (Squier Associates 2000). A summary of the resulting interpretation of grain-size distribution in the reservoir deposit is given in Fig. 23-10. The reservoir sediment consists of two main units, with the predam channel bed representing a third distinct unit (Squier Associates 2000). The uppermost uilit (Unit 1) ranges froin approximately 2 to 5.5 m in thickness and is composed of sandy gravel with a small amount of cobbles and boulders, becoming thicker toward the dam. The next unit (Unit 2) is predominantly fine sediment (silty sand to sand with a small amount of gravel, ranging from 4 to 11 m thick). Unit 3, the
predam channel, consists primarily of coarse sediment and is 0.8 to 3 m thick. Approxin~ately 750,000 d of sediment is stored behind the dam, of which 490,000 m3 is primar- ily gravellpebble and 260,000 in3 is primarily sand (Squier Associates 2000).
The grain-size distribution of upstream sediment supply is also required as model input. The grain-size distribution of gravel in upstream sediment supply is assunled to be the same as that of the gravel portion of Unit 1 of the reservoir deposit. This assumption was based on the likelihood that as the res- ervoir filled in, all or most of the upstream bed load was cap- tured in the reservoir. The grain-size distribution of the sand in sediment supply is assumed to be the same as that of the sand portion of Unit 2 of the reservoir deposit (Fig. 23-10).
The roughness height without sand coverage (k, , , in Eqs. (23-7a) and (23-7b)) is assumed to be 0.4 mat Marmot Dan1 and to decrease exponentially to 0.25 rn at the Columbia River con- fluence. These values are estimates based on field observation and correspond to roughly 4 to 10 times the geometric mean grain size. A model run in which the roughness heights were doubled (i.e., 0.8 mat Marmot Dam and 0.5 m at the Columbia River confluence) was also performed to test the sensitivity of model results to the assumed roughness height. Doubling the roughness heights results in an increased likelihood that sand deposition will be initialized but has only a limited effect on the overall thickness of predicted sand deposition.
Unit 1 (gravel layer) Grain Size (mm)
Unit 2 (sand layer)
h
E - 225 c 0 .- CI
$ 220 pre-dam channel Q)
iii
Distance (km)
Fig. 23-10. Sediment deposit in Marmot Reservoir. Three grain-size distributions are shown for each unit, representing upper and lower bounds and their average values. Diagram developed based on information provided by Squier Associates (2000).
23.3.3.5 Backgrourzd Gravel and Sand Transport Rates Background rates of gravel and sand transport in the Sandy River upstream of Marmot Dam are required inputs to the gravel and sand models. but no data are avail- able for reference. To derive a gravel-transport rate, we assumed that the Sandy River's gravel-transport capacity upstream of Marmot Dam exceeds the supply, based on the abundance of bedrock outcrops and boulders in the chan- nel. Thus it is possible to assume that the actual sediment- transport rate upstream of Marmot Dam is some fraction of the transport capacity. This fraction was determined by the model using trial and error as part of the "zero process," whereby various gravel-transport rates were plugged into reference-condition runs so that downstream aggradation and degradation are minimized over the entire river reach. This zero process is discussed in more detail below.
Aroughestiinate of background suspended-sediment con- centration was developed based on an estimate of the long- term average sediment-transport rate and water discharge. For input to the model, the long-term average sediment- transport rate in the Sandy River at Marmot Dam is esti- mated to be about 250,000 tnlyr (roughly 350 tn/km?/yr), of which the majority is fine sediment. This is a rough estimate based on review of sediment-yield data from other rivers in Oregon's western Cascade Range, which suggest average sediment yields that range from 100 to 500 tn/lun2/yr for undisturbed and disturbed basins (Curtiss 1975; Swanson and Dyrness 1975; Larsen and Sidle 1980; Swanson et al. 1982: McBain and Trush 1998). In the Sandy River basin, sediment yields may be substantially higher on average than elsewhere in the western Cascades due to Mt. Hood glaciers, the presence of semiconsolidated lahar deposits, steep topography, and land uses. The estimated sediment yield of 350 tnlkm21yr translates to an average suspended- sediment concentration of about 200 nlgll, which was used as the background suspended-sediment concentration at Marmot Dam in this modeling effort. If the sediment flux from reservoir erosion following removal of Marmot Dam is much higher than the background value, as it is expected to be, model output is not sensitive to the accuracy of the background concentration assumed for model input.
23.3.3.6 Zero Process A "zero process" is gener- ally required for long-term, large-scale sediment-transport simulation. The purpose of the zero process used in this modeling effort is to generate a starting point for the mod- eling and to evaluate certain input parameters. In the zero process, the model is run repeatedly under a reference con- dition, in which input data such as discharge are the same as for the simulation of dain removal, but neither Marmot Dam nor any sediment pulse from the reservoir deposit is considered. If the model is fed with raw input data (e.g.. channel gradient, width) without modification, it typically will not produce quasi-equilibrium results under reference conditions. The goal of the zero process is to run the model, modifying certain input parameters if necessary, until the model produces quasi-equilibrium results, whereby
the river experiences aggradation and degradation in differ- ent reaches over different periods of time and hydrological events, but overall. long-term aggradation or degradation is limited. If a quasi-equilibrium condition is established as the baseline for modeling, changes in the system can be interpreted as a direct result of the introduced disturbances, in this case the release of the sediment pulse from Marmot Dam. Boundary conditions in the model are given by (1) discharge at the upstream end of the modeled reach (4 km upstream of Marmot Dam) and along the Sandy River in a downstream direction, (2) background gravel transport at the upstream end (given as a fraction of the potential gravel-transport rate, as described above), (3) the assumed grain-size distribution of the background gravel load, and (4) a fixed bed elevation at the downstream end of the mod- eled reach (the confluence of the Sandy River with the Col~unbia River). The water-surface elevation at the down- stream end is acquired by the normal flow assumption.
In the zero process for this modeling effort, channel width is modified in such a way that certain extremely wide sec- tions are reduced to no less than 80% of the original value. The model is then run repeatedly, with the output of the channel bed elevation (slope) as the input of the subsequent run, until the channel bed reaches quasi-equilibrium. The zero process is also used to estimate the background gravel- transport rate upstreain of Marmot Dam (which is needed as input to the model). Large-scale deposition (aggradation) will occur if the input sediment-transport rate is too high and large-scale erosion (incisionldegradation) will occur if the input sediment-transport rate is too low. The input gravel- transport rates selected for modeling, based on trial and error in the zero process, vary with hydrology and, for the hydrologic conditions shown in Table 23-2, vary from about 7,000 to 72,000 tnlyr at Marmot Dam. These results suggest an average long-term gravel-transport rate of about 25,000 to 30.000 tnlyr (roughly 10% of the total sediment yield estimated above). Assuming a bulk sediment density of 1.7 tnlm?, this average annual gravel-transport rate would have completely filled Marmot reservoir in about 30 yr fol- lowing dam closure. The actual length of time required for the reservoir to fill is unknown but 30 yr appears to be a rea- sonable estimate, based on regional sediment-yield data and on the rapid sedimentation of an area of the reservoir that was excavated to facilitate reconstruction of the dam in 1989.
The "zeroed" bed slope is given in Fig. 23-8 along with the original photogrammetric data. This figure shows that the zero process retains the general overall channel slope but modifies local gradients to convey the background sedi- ment load through all reaches of the Sandy River.
23.3.4 Model Results
Nunlerical modeling was used to simulate sediment-transport processes both for background conditions in the Sandy River and for the dam removal alternatives listed in Section 23.3.1. Results are presented for background conditions and for the
10 10 DEVELOPMENT AND APPLICATION OF N U M ~ C A L MODELS
alternative entailing single-season dam removal with mini- mal sediment removal. SensiLivity tests to evaluate certain model assumptions and approaches are also summarized. Results for modeling of other removal alternatives, as well as additional details on sensitivity testing, are presented in Stillwater Sciences (2000; 2002).
23.3.4.1 Reference Runs of Nunterical Models For both the gravel and sand models, model runs were performed for reference conditions assuming that no dam exists and downstream sediment transport is equivalent to estimated background (natural) conditions, with no release of reservoir sediment. Reference runs of the model are a component of the
Vertical Scale: each grid = 0.3 mlyr
Reach 1
zero process described above and depict aggradation and deg- radation in the Sandy River in the absence of sediment release from Marmot Dam. Reference runs therefore provide a basis of comparison for interpretation of model predictions of depo- sition patteins following various dam removal alternatives.
For the gravel model, a 10-yr simulation was performed for reference conditions. In the reference run of the gravel model, a small amount of coarse sediment aggradation (and degradation) is indicated in Reaches 3 and 4, even without sediment release from Marmot reservoir (Figs. 23-11 and 23-12). The reference run iildicates that up to about 1 m of aggradation would periodically occur in certain reaches.
Horizontal Scale: 10 km
Reach 2 Reach 3 Reach 4 Reach 5
-- --
-dqt4& -- 2nd year ~-p$n44k//~-{'~k~4~~8~~4$-+~~~------
-- -- -
. - . ~
L Avh+d 42 d- -
3rd year
~~. .~
4th year -
.--- 5th year n 6th year
P-~
- -
8th year .
9th year
-- -- - - -- -- 10th year
- - -- - -
Fig. 23-11. Annual change in bed elevation from gravel erosion and deposition: reference run of the gravel model.
NUMERIC4L SIMULATION OF SEDIMENT TRANSPORT 101 1
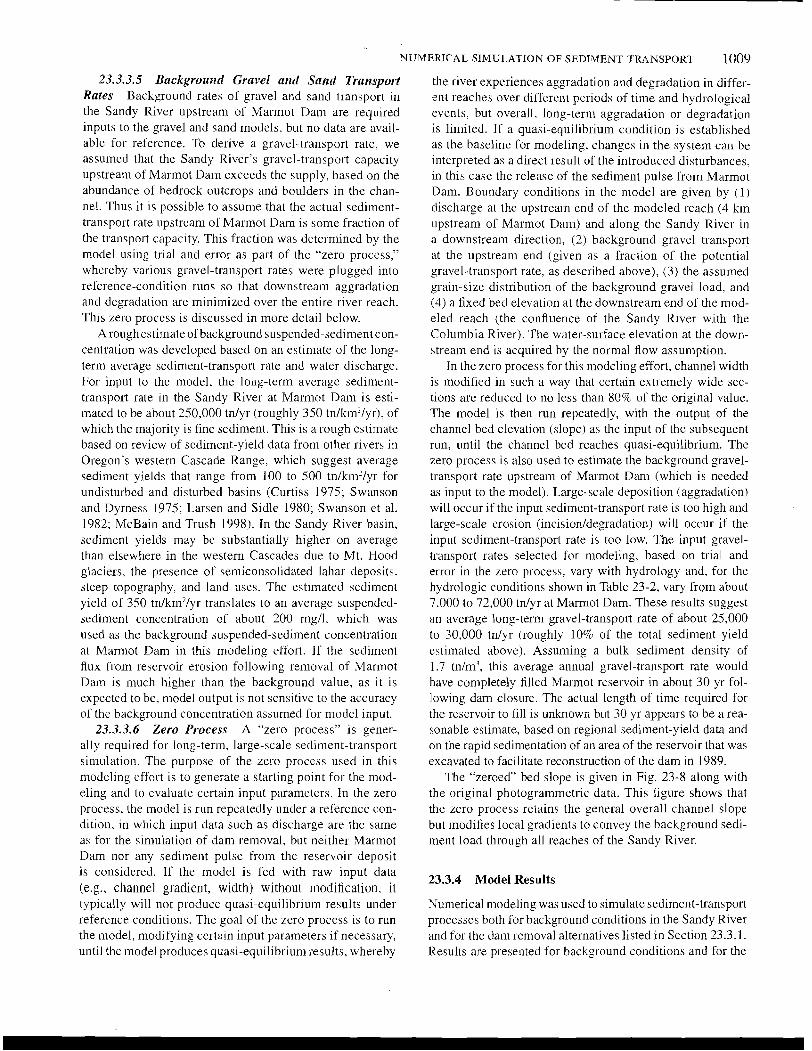
In particular, about 1 m of deposition is observed downstream could occur in certain reaches undcr reference conditions in of the gorge outlet in Year 6 of the model run (which uses the Sandy River. water year 1949, a wet year with only moderate peak flow, Reference runs of the sand model indicate background as input flow data). This result indicates that ~inder certain suspended-sediment concentrations fluctuating between hydrological conditions, local aggradation or degradation approximately 90 and 150 ppm at the site of Marmot Dam,
Pig. 23-12. Cumulative change i n bed elevation from gravel erosion and deposition: reference run of the gravel model.
- -
Marmot Dam (0 km) a Sandy below Bull R u n R~erconfluence (20 krn)
- Downstream of Dabney Park (40 km)
Time (days)
Fig. 23-13. Simulated suspended-sediment concentration downstream of Marmot Darn under reference conditions.
with lower concentrations further downstream (Fig. 23- 13), based on the assumed background sediment concentration. Reference runs also show sand aggradation occurring in Reach 5, which is in agreement with field observations of the sand-bedded nature of this reach.
23.3.4.2 Modeliizg of Sediment Traitsport Associated with Single-Seasoiz Dam Reinoval and Minimal Sediment Excavation Under one of the alternatives being considered for removal of Marmot Dam, only a minimal amount of sedi- ment (i.e., enough to facilitate dam removal activities) would be excavated from the reservoir prior to dam removal, which would be accomplished in one season. All of the remaining reservoir sediment would be released downstream following dam removal. Model runs for this alternative assumed that a slightly greater amount of sediment was in the reservoir and would be released downstream (800,000 m3) than the sediment volume of 750,000 m3 suggested by the Marmot reservoir coring study (Squier Associates 2000). This vol- ume difference was arrived at based on review of PGE photogrammetric data (Fig. 23-7), which suggests that the reservoir deposit may extend further upstream than indicated by the coring study (Squier Associates 2000).
Figures 23-14 and 23-15 illustrate model predictions of the downstream movement of coarse sediment out of the reservoir and resulting increases in bed elevation (aggrada- tion) downstream of Marmot Dam, under average hydro- logic conditions and over a 10-yr period. These model results indicate that, in the first year following removal, coarse sediment would move downstream into the portion of Reach 1 immediately downstream of the dam, creating
a depositional wedge up to a maximum of about 4 m thick, with small amounts of deposition predicted further down- strean1 in Reach 1 and in Reach 3. In subsequent years, addi- tional sediment would move out of the reservoir, resulting in a gradual increase in deposition thiclcness in the downstream portion of Reach 1. reaching a maximum of about 1 rn on a reach-averaged basis. The aggradational wave is predicted to travel quickly through most of the gorge (Reach 2). with aggradation increasing at the downstream end of the gorge and the upstream end of Reach 3 from Years 1 through 10. Aggradation is predicted to gradually build to a maximum predicted thickness of about 1.5 to 2 m in the upper portion of Reach 3 (9-13 km downstream of the dam), where the chan- nel widens and decreases in gradient (Fig. 23-15). In Reach 1, the greatest amount of aggradation would be expected in the early years following dam removal, whereas in Reach 3, aggradation would be expected to show gradual increases through the first 7 yr. After the first 7 yr, deposition thiclcness in Reach 3 would gradually decrease as the sediment wave is transported downstream. The model predicts small amounts of aggradation (typically <0.5 m) downstream of the Bill1 Run River confluence, although this aggradation is similar in magnitude to aggradation predicted in a reference run of the inodel and is not likely to be distinguishable from natural depositional processes.
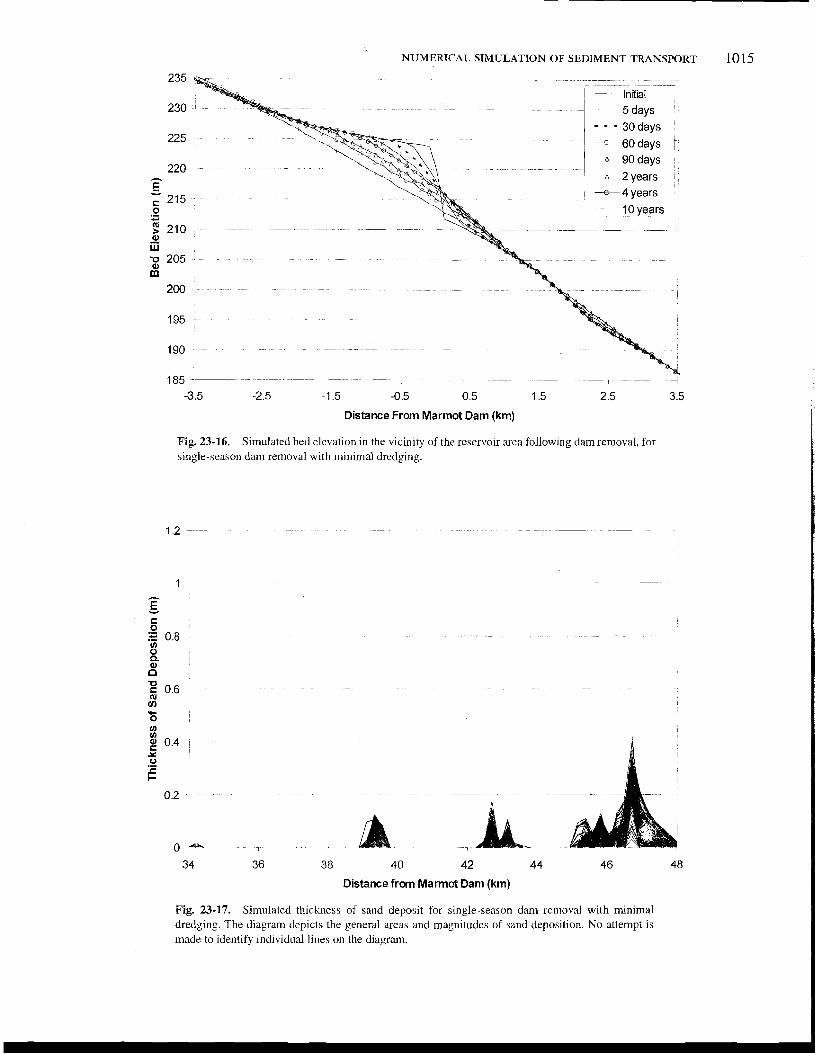
Figure 23-16 shows the predicted change in bed elevation in a longitudinal profile view in the reservoir reach and in Reach 1 following dam removal. This figure shows how, fol- lowing dam removal, the slope in the reservoir reach would gradually flatten out and return to that of the predam channel
Vertical Scale: each grid = 0.3 mlyr Horizontal Scale:
'lo krn
-- . - - - . - - - -- - - --
2nd year ~/h~~*----------
- year --
-
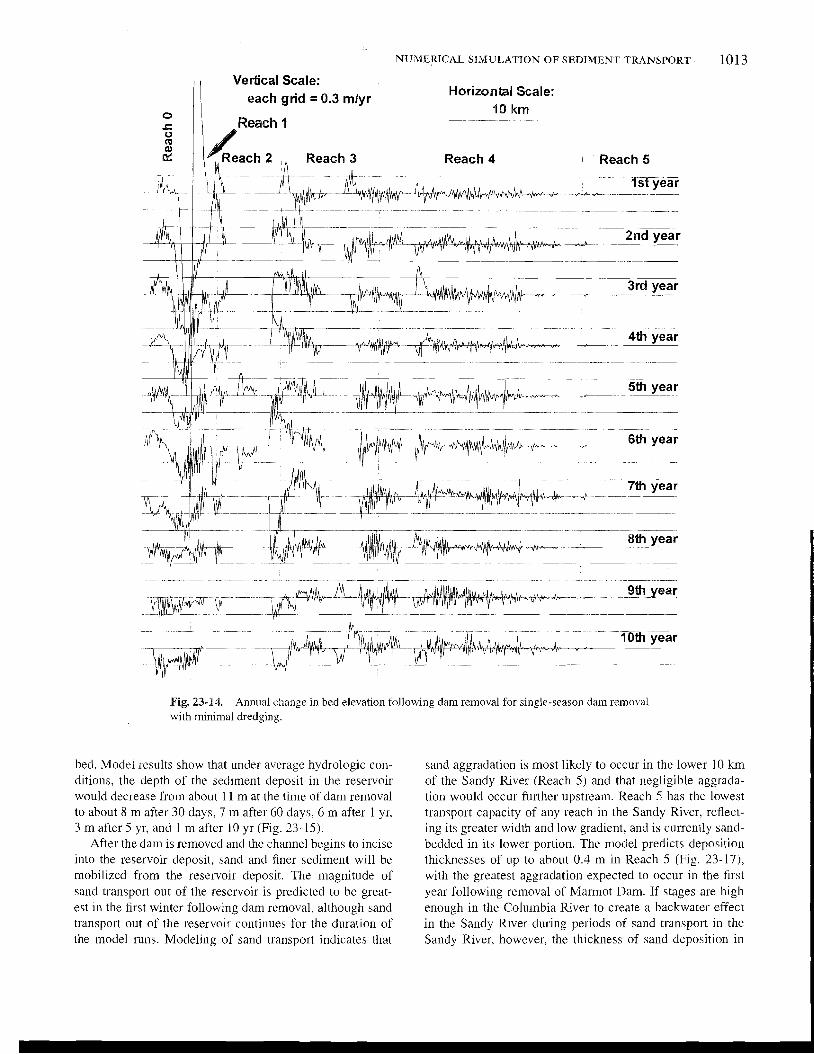
Fig. 23-14. Annual change in bed elevation following dam removal for single-season dam removal with minimal dredging.
bed. Modei results show that under average hydrologic con- ditions, the depth of the sediment deposit in the reservoir would decrease from about 11 m at the time of dam removal to about 8 m after 30 days, 7 m after 60 days, 6 m after 1 yr, 3 m after 5 yr, and 1 m after 10 yr (Fig. 73- 15).
After the dam is removed and the channel begins to incise into the reservoir deposit, sand and finer sediment will be mobilized from the reservoir deposit. The magnitude of sand transport out of the reservoir is predicted to be great- est in the first winter following dam removal, although sand transport out of the reservoir continues for the duration of the model runs. Modeling of sand transport indicates that
sand aggradation is most likely to occur in the lower 10 lun of the Sandy River (Reach 5) and that negligible aggrada- tion would occur further upstream. Reach 5 has the lowest transport capacity of any reach in the Sandy River, reflect- ing its greater width and low gradient, and is currently sand- bedded in its lower portion. The model predicts deposition thicknesses of up to about 0.4 m in Reach 5 (Fig. 23-17), with the greatest aggradation expected to occur in the first year following removal of Marmot Dam. If stages are high enough in the Columbia River to create a backwater effect in the Sandy River during periods of sand transport in the Sandy River, however, the thickness of sand deposition in
Vertical Scale: each grid = 1 m
Horizontal Scale: 10 km
Reach 4
- Initial
/ \ I - - 1st year h- - - -..-.--.--- - -
- _ 2nd year
i flh"b 3rd year hl
I
J 4th year unHC- --- - --- ~
9 5th year
I
I?\. I 6th year
TS A
- 7th year - -
_ _ 8th year
- -
9th year . I
10th year
Fig. 23-15. Cumulative change in bed elevation following dam removal for single-season dam removal with minimal dredging.
the lower Sandy River could be much greater than predicted following removal of Marmot Dam and indicate that the mag- here. Because the nlodcl does not account for this backwater nitude of sand aggradation would fluctuate both seasonally effect, there is considerable uncertainty in model predctions and between years. Aggradation in Reach 5 is predicted to of deposition thickness in Reach 5. occur mainly in the lower 3 km of the Sandy River (with less
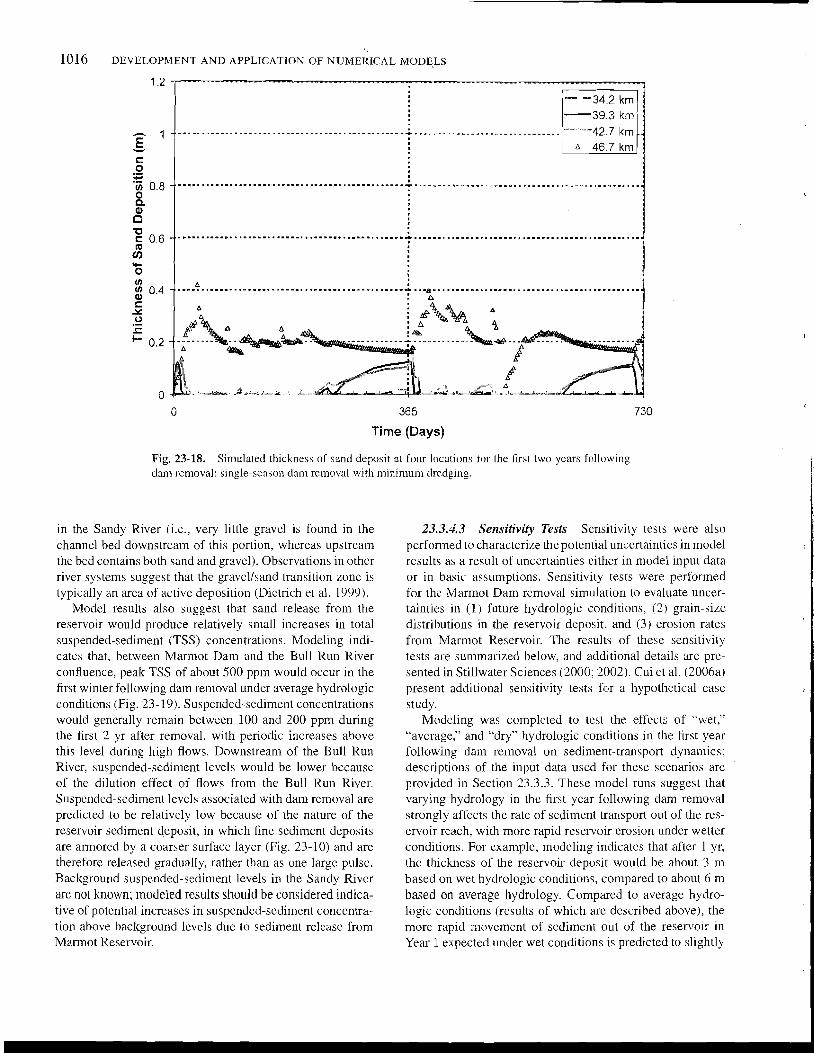
Figures 23-17 and 23-18 show the pattern of sand depo- aggradation in the upper part of the reach), which roughly sition at selected locations in Reach 5 during the first 2 yr corresponds to the location of the gravelhand transition area
235
230
225
A
220
E 215
0 .- * 2 210 0 iii
205 m
200
195
190
185 - - - 7 - -7-
-3.5 -2 5 -1 5 -0 5 0 5 1 5 2 5 3 5
Distance F r m Marmot Dam (km)
Fig. 23-16. Simulated bed elevation in the vicinity of the reservoir area following dam removal, for single-season dam ren~oval with minimal dredging.
34 36 38 40 42 44 46 48
Distance from Marmot Dam (km)
Fig. 23-17. Simulated thickness of sand deposit for single-season dam renioval with minimal dredging. The diagram depicts the general areas and magnitudes of sand deposition. No attempt is made to identify individual lines on the diagram.
Time (Days)
Fig. 23-18. Simulated thickness of sand deposit at four locations for the first two years following dam removal: single-season dam removal with minimum dredging.
in the Sandy River (i.c., very little gravel is found in the channel bed downstream of this portion, whereas upstream the bed contains both sand and gravel). Observations in other river systems suggest that the gravel/sand transition zone is typically an area of active deposition (Dietrich et al. 1999).
Model results also suggest that sand release from the reservoir would produce relatively small increases in total suspended-sediment (TSS) concentrations. Modeling indi- cates that, between Marmot Dan1 and the Bull Run River confluence, peak TSS of about 500 ppin would occur in the first winter following dam removal ~ ~ n d e r average hydrologic conditions (Fig. 23-19). Suspended-sediment concentrations would generally remain between 100 and 200 ppm during the first 2 yr after removal, with periodic increases above this level during high flows. Downstream of the Bull Run River, suspended-sediment levels would be lower because of the dilution effect of flows from the Bull Run River. Suspended-sediment levels associated with dam removal are predicted to be relatively low because of the nature of the reservoir sediment deposit, in which fine sediment deposits are armored by a coarser surface layer (Fig. 23-10) and are therefore released gradually, rather than as one large pulse. Background suspended-sediment levels in the Sandy River are not known; modeled results should be considered indica- tive of potential increases in suspended-sediment concentra- tion above background levels due to sediment release from Marmot Reservoir.
23.3.4.3 Sensitivity Tests Sensitivity tests were also performed to characterize the potential uncertainties in model results as a result of uncertainties either in model input data or in basic assumptions. Sensitivity tests were performed for the Marmot Dam removal simulation to evaluate uncer- tainties in (1) future hydrologic conditions, (2) grain-size distributions in the reservoir deposit, and (3) erosion rates from Marmot Reservoir. The results of these sensitivity tests are summarized below, and additional details are pre- sented in Stillwater Sciences (2000; 2002). Cui et al. (2006a) present additional sensitivity tests for a hypothetical case study.
Modeling was completed to test the effects of "wet," "average," and "dry" hydrologic conditions in the first year following darn removal on sediment-transport dynamics; descriptions of the input data used for these scenarios are provided in Section 23.3.3. These model runs suggest that varying hydrology in thc first year following dam removal strongly affects the rate of sediment transport out of the res- ervoir reach, with more rapid reservoir erosion under wetter conditions. For example, modeling indicates that after 1 yr, the thickness of the reservoir deposit would be about 3 m based on wet hydrologic conditions, compared to about 6 m based on average hydrology. Compared to average hydro- logic conditions (results of which are described above), the more rapid inovement of sediment out of the reservoir in Year 1 expected under wet conditions is predicted to slightly
Marmot Dam (0 km)
qp Sandy below Bull Run R~ver confluence (20 km)
- Downstream of Dabney Park (40 km)
365
Time (days)
Fig. 23-19. Simulated suspended-sediment concentration at three locations tor the tirst two years following dam removal: single-season dain removal with miniinum dredging.
reduce overall gravel aggradation in Reach 1 in the years fol- lowing removal, to alter the temporal pattern of aggradation in Reach 3 (with thicker deposition in the first several years after removal, but with similar magnitude of aggradation over a 10-yr scale), and to slightly increase aggradation in Reach 4. Model runs based on dry hydrologic conditions in Year 1 suggest that sediment would initially move more slowly out of the reservoir area compared to average hydrologic con- ditions, but that after 5 yr, the thickness of the deposit at the dam site would be the same as for average hydrologic conditions. Downstream palterns of predicted aggrada- tion are similar for dry and average hydrologic scenarios. with aggradation concentrated in Reach 1 and Reach 3. The sensitivity of TSS levels to hydrologic conditions was also evaluated: predicted TSS levels are lowest for dry hydrologic conditions in Year 1, generally ren~aining below 200 ppm, and are similar in average and wet conditions.
In addition to varying the hydrologic input data. we also conducted model runs with different assumed grain- size distributions for the reservoir deposit. The model runs described above assumed an "average" grain-size distribu- tion (Fig. 23-10). Using the "upper bound" (i.e., coarser) and "lower bound" (i.e., finer) grain-size distributions shown in Fig. 23-10 causes only very small changes in the predicted pattern of coarse sediment deposition. Predictions of TSS concentration are somewhat sensitive to the assumed grain- size distribution: TSS levels are highest for the assumed lower-bound distribution and lowest for the assumed upper- bound distribution.
Sensitivity tests were also used to evaluate sin~plifying assumptions used to simulate reservoir erosion, which is a key uncertainty in this modeling effort. As discussed in Section 23.3.7, basic model runs assume laterally uniform erosion of reservoir sediment from Marmot Reservoir. In reality, however, incision of a channel through the reser- voir reach will likely occur to some extent following dani removal. A sensitivity analysis was performed to assess how an increase in the rate of gravel transport out of the reservoir resulting from channel incision could affect down- stream deposition patterns. It was assumed that channel inci- sion in the reservoir reach would be most likely when the local channel bed slope was high, as would be the case at the downstream end of the reservoir deposit iinmediately fol- lowing dam removal, and that this could result in a gravel- transport rate that was greater than predicted by Parker's bed load transport equation. The increase in sediment-transport rate resulting from downcutting is therefore hypothesized to be an incremental function of bed slope. To simulate this, we applied a multiplier that varied with bed slope to the gravel- transport rate calculated by the Parker equation for channel bed slopes above 0.01. The transport rate out of the reservoir calculated by the Parker equation is thereby increased by a factor of up to 10 in this sensitivity test, depending on local bed slope. The results of this sensitivity test indicate that, if the down-cutting process affects the gravel-transport rate as is assumed in this sensitivity test, there will be only a short term effect on the pattern of gravel erosion from the reservoir and downstream deposition. This is because slopes
:AL MODELS
will be steepest immediately following dam removal at the downstream end of the sediment deposit, but downstream transport of this material would result in reduced bed slopes (and scdiment-transport rates) within a short time, even if channel incision does occur. This sensitivity test does not fully simulate the effects of channel incision on sediment- transport patterns out of the reservoir reach. but it does cap- ture one potential effect of incision (i.e., transport rates that are higher than calculated by thc Parker equation when chan- nel incision occurs).
The model also employs simplifying assumptions with respect to the mechanism of sand release from the reser- voir, assuming that sand will be metered out of the reser- voir in association with transport of gravel, as described in Section 23.3.2. To address the considerable uncertainties in this method, we completed sensitivity tests in which the rate of sand release from the reservoir was increased 5-fold and 10-fold over the rates of sand release predicted by the model based on predicted shear stresses and laterally uni- form transport in the reservoir reach. Increasing the rate of sand release by a factor of 5 or 10 would result in com- plete sand evacuation from the reservoir in about 4 or 2 yr, respectively. The sensitivity analysis for the 10-fold increase indicates that sand release from thc reservoir at 10 times the expected rate would result in a peak TSS concentration of approximately 4,000 ppm in the first winter following dam removal (compared with a maximum of about 500 ppm for basic model runs), with other spikes in TSS above 500 ppm during storm events. Otherwise TSS would generally remain between 100 and 400 ppm between Marmot Dam and the Bull Run River confluence, resembling assumed background conditions during late summer and early fall low-flow condi- tions. Increasing the rate of sand release 10-fold would also result in additional deposition downstream, including sand aggradation of approximately 0.2 to 0.4 m at the downstream end of Reach 4 (where no deposition is predicted for basic model runs), and aggradation prcdicted throughout Reach 5 , with a maximum of about 1 m in this reach (compared to about 0.4 m in basic model runs).
23.3.5 Discussion
The case study presented in this chapter illustrates key con- siderations in the development of sediment-transport models for dam removal simulations. The model presented here and those of Cui et al. (2006a; 2006b) provide a framework for development of future models, either as a reference or as a starting point for modifications.
Numerical modeling of a process as complex as transport of a large volume of coarse and fine sediment following dam removal contains a number of uncertainties. The modeling approach presented here includes both uncertainties that are specific to the Marmot Dam removal application and those that would likely affect any dam removal modeling effort. Many hypotheses are incorporated in the models, in temls
of both theoretical development (i.e., reflecting uncertainties in current scientific understanding about the mechanics of sediment transport) and input data. Key areas of uncertainty in this modeling effort, each of which is discussed further below, include modeling of reservoir erosion processes, selection of appropriate sediment-transport equations, uncertainty arising from the use of one-dimensional model- ing, and uncertainty in input parameters.
A key source of uncertainty in this modeling approach arises from simplifying assumptions used to model reservoir erosion. Whereas the model assumes that transport out of the reservoir would be laterally uniform, erosion of reservoir sediment would in fact likely result in incision of a channel within the valley walls, potentially accelerating exposure of the underlying sand layer in the incised area and increas- ing the time (compared to modcl predictions) required for sediment on the margins of the reservoir deposit to be eroded downstream. Uncertainties also arise from the use of the Parker equation to model erosion of the mixed sand and gravel layers in the reservoir. The Parker equation is used to predict mobilization of the coarse fraction of various sedi- ment layers in the reservoir, treating those layers as if fine sediments were not present. In fact, although the overall stratification of the reservoir results in a largcr proportion of fine sediment in the lower layers of the reservoir and more coarse sediment in the upper layers, each layer in the deposit typically contains a range of grain sizes. The presence of a large amount of fines may create error in the use of the Parker equation because it is not intended for application to particles smaller than 2 mm. The model also assumes that fine sediments within each layer of the reservoir deposit are not transported out of the reservoir until shear stresses are sufficient to mobilize the gravel (>2-mm) colnponent of the layer, as indicated by the Parker equation. Some fraction of the fine sediments in the reservoir, however, will likely be mobilized and transported at discharges lower than those that transport the coarse sediments found in the same layer as the fine sediments, resulting in more rapid transport of sand from a given layer in the reservoir deposit than of the gravel in that layer. In addition, sand following the gravel leaving the reservoir could smooth the bed and increase the mobility of the leading gravel front downstream (T. Lisle, personal communication. 2000). Sensitivity tests to address uncer- tainties related to reservoir erosion processes are descnbed in Section 23.3.4.
Selection of appropriate sediment-transport equations is an important consideration in sediment-transport modeling of dam removal and, because of the complexities of dam removal modeling and incomplete knowledge of sediment- transport mechanics, the transport equations selected can be a potential source of uncertainty. The Marmot Dam removal case study involves simulation of transport of a mixture of coarse and fine sediment over a primarily coarse existing river bed. Because of the relatively undeveloped nature of transport equations for sandlgravel mixtures, we developed
separate transport models for sand and gravel components in the Marmot case study, rather than simultaneously model- ing a sandfgravel mixture. Although sand and gravel trans- port are treated separately, they do likely affect each other, creating some uncertainty in model results. Moreover, the transport equation used here to model the downstream trans- port of fine sediment (Brownlie 1982) was developed for sand-bedded channels, and we know of no equations for sand transport ovcr a coarse bed. Because most of the Sandy River has coarse bed materials downstream of Marmot Dam, use of the Brownlie equation (or of a comparable equation for sand transport) creates additional model uncertainty.
One-dimensional numerical modeling, such as the Marmot Dam removal model, provides results that are most appli- cable on a reach-scale and time-averaged basis. including estimates of sediment-transport rates and cross-section and reach-averaged depths of sediment deposits over the exist- ing channel bed. Current state-of-the-art modeling, however, typically cannot predict complex three-dimensional geo- morphic responses over long river reaches and time scales, such as depositional patterns in channel cross section, local changes in sedimcnt particle size distribution, infiltration of sand into the channel bed, or changes in the mobility of the existing channel bed. The Marmot Dam removal model assumes a simplified, rectangular channel, and model pre- dictions do not account for local variations in shear stress caused by features such as deep pools, bedrock outcrops, or large boulders. The modeling of fine sediment transport also does not account for the production of sand and silt from gravel abrasion (i.e., suspended load estimates do not include products of gravel abrasion). The amount of sediment act~i- ally deposited may therefore be substantially higher or lower .
than predicted by the model in localizcd areas of the channel. Because of the one-dimensional nature of modeling results, professional judgment and field observations of the system being evaluated should be used to interpret model results in terms of expected geomorphic effects.
Numerical models of dam removal, such as the model pre- sented here for the Marmot Dam removal application, require input parameters on a range of physical characteristics that influence sedimcnt transport. Modeling results typically will have varying levels of sensitivity to different types of input data, and input data typically contain varying levels of uncer- tainty. Modeling accuracy and efficiency will therefore be enhanced if the effort devoted to quantifying input parameters is conmensurate with model sensitivity to these parameters. For the Marmot Dam removal application, data were collected specifically for this project or were already available for those input parameters to which the model is most sensitive (i.e., channel gradient, channel width, grain-size distribution of res- ervoir sediment, and water discharge). In addition, sensitivity analyses were performed to examine the effects of varying cer- tain input data (hydrologic conditions, grain-size distribution of reservoir sediment) on model results. as described above. For other input parameters, such as background gravel- and
sand-transport rates, size distribution of bed load, and abra- sion rates in the Sandy River, existing data were not available and new data were not collected for this project. For many of these input parameters, only order-of-magnitude estimates are required for the models, and rough assninptions based on field obscrvatioils of the Sandy River and on published data from elsewhere in the region were therefore used.
Despite the uncertainties in the modeling effort described here, this numerical modeling approach does provide pre- dictions of sediment transport and deposition following dam removal over large temporal and spatial scales and can be used to compare sedimentation impacts associated with vari- ous dam-removal alternatives. Modeling efforts such as this one can be improved if field data describing the phenom- ena being modeled are collected and compared to modeling results. Monitoring of processes such as reservoir erosion, sand and gravel aggradation, and total suspended-sediment concentrations following dam removal is critical to improv- ing upon nascent efforts to simulate sediment-transport dynamics following dam removal.
ACKNOWLEDGMENTS
We would like to thank the following reviewers for conments on this work: Jirn Pizzuto (liniversity of Delaware), Tom Lisle (U.S. Forest Service), Steve Wiele (U.S. Geological Survey), Bill Dietrich (University of California, Berkeley). and Marcelo Garcia (University of Illinois). Suggestions from Brian Cluer on this manuscript are gratefully appre- ciated. Discussions and helps from Stillwater Sciences employees. Christian Braudrick, Frank Ligon, Bruce On, Martin Trso, Jennifer Vick, and many others, too many to mention individually, are gratefully acknowledged. Funding for the Marmot Dam removal sediment-transport study was provided by Portland General Electric (PGE).
REFERENCES
Brownlie, W. R. (1982). "Prediction of flow depth and sediment discharge in open channels." PhD thesis, California Institute of Technology, Pasadena. Calif.
Bureau of Reclamation. (1996a). "Removal of Elwha and Glines Canyon Dams." Elwlza Technical Series PN-95-7, Elwha River Ecosystem and Fisheries Restoration Project, Washington, Pacific Northwest Region, Boise, Idaho, <http:llww.nps.govlolynli eIwha/reclamition/removal.htm>(accessed on Sept. 26, 2005).
Bureau of Reclamation. (1996b). "Sediment analysis and model- ing of the river erosion alternative." Elwha Techniccll Series PN-95-9, Elwha River Ecosystem and Fisheries Restoration Project, Washington. Pacific Northwest Region, Boise, Idaho, <http://ww,nps.govlolydelwhalreclamation/sediment. tm>(accessed on Sept. 26, 2005).
Chaudhry, M. H. (1993). Open-channel flow. Prentice-Hall. Englewood Cliffs, N.J.
Childers, D., Kresch, D. L., Gustafson. S. A,, Randle, T. J.. Melena, J. T.. and Cluer, B. (2000). "Hydrologic data collected during the 1993 Lake Mills drawdown experiment, Elwha River: Washington." LVatel--Resolrlres h~vesrigarions Rel~ol-t 99-4215, U.S. Geological Survey, Tacoma, Wash.
Collins, B. D., and Dunne, T. (1989). "Gravel transport, gravel harvesting, and channel-bed degradation in rivers drain- ing the southern Olympic Mountains, Washington, USA." E~ivironme~ital Geology nlid Wnter Scielices, 13,113 -124.
Cui, Y., Braud~ick. C., Diet~ich, W. E.: Cluer, B., and Parker, G. (2006a). "Darn Rernoval Express Assessment Models (DREAM). 2: Sample runs I sensitivity tests." Jo~~nznl of'Hydrc~ulic Researclz, 44(3), 291-307.
Cui, Y., and Parker, G. (1997). "A quasi-normal simulation of aggra- dation and downstream fining with shock fitting." htematio~znl Joirr-lzal qfSedilner~t Research, 12(2), 68-82,
Cui, Y., and Parker, G. (1998). "The arrested gravel front: Stable gravel-sand transitions in rivers. 11: General numerical solu- tion." Joanzal oJ'Hj'rl1-arrlic Research 36(2). 159-182.
Cui, Y., and Parker, G. (2005). "Numerical model of sediment pulses and sediment supply disturbances in mountain riv- ers." Jo~lr~zal u f ' H y d m ~ ~ l i c Engineering. 13 1 (8), 646-656, doi: 10.1061/(ASCE)0733-9429(2005)131:8(646).
Cui, Y.: Parker, G.. Braud~ick, C.; Dietrich, W. E., and Cluir. B. (2006b). "Dam Removal Express Assessment Models (DREAM). 1: Model development and validation." Jorrn7crl of Hytlirrrllic Resetrrclz, 44(3), 308-323.
Cui, Y., Parker, G., Pizzuto, J.. and Lisle, T. E. (2003). "Sediment pulses in niountain rivcrs. 2: Comparison between experiments and numerical predictions." Iliuter Re.so~1rr.e.s Researclz, 39(9), 1240, tloi: 10.I02912002WR001805.
Curtiss, D. A. (1975). "Sediment yields of streams in the Umpqua River basin. Oregon." Open-File Report, U.S. Geological Survey, Portland, Ore.
Dietrich, W. E. (1982). "Settling velocities of natural particles.'' Water Rcsou\.ces Resen~.ch, 15(6), 1615-1626.
Dietrich, W. E., Day, G., and Parker, G. (1999). "The Fly River, Papua New Guinea: Inferences about river dynamics, floodplain sedimentation and fate of sedi~nent." Var.ietie.s c!fprrr.ial , / i~wn, A. J . Miller and A. Gupta, cds., Wiley. New York.
Doyle, M. W.: Stanley. E. H.? and Harbor, J . M. (2003). "Channel adjustments following two dam emov ovals in Wisconsin." Water Resources Research, 39(1), 101 1, doi: 10.102912002WR001714.
Graf, W. L. (1996). "Geomo~pholopy and policy for restoration of impounded American rivers: What is nntural'!" Tlze scierltijc nutlire of geot1lorl7/1olofi!.: Proceerlin,~~ of the 27/11 Bir~ghnirlton syrnposi~lrn in geo~iior~~hology, B. L. Rhoads and C. E. Thorn. eds.. Wiley, New York. 443-473.
Hansler, M. E. (1999). "Sediment wave evolution and analy- sis of a one-dimensional sediment routing model, N a v a ~ ~ o River. Northwestern Califo~nia." MS thesis, Humboldt Slate University, Arcata, Calif.
Keulegan, G. H. (1938). "Laws of t~~rbulent flow in open channels." Joirrlzul qf' rhe hkltiontrl Blrrea~ o f Standrrrds, 21, Research Paper 1 15 1 , 707-741.
Larsm, K. R.. and Sidle. R. C . (1980). "Erosion and sedinlen- tation data catalog of the Pacific Norlhwest." Rep. R6-WM- 050-1981, U.S. Forest Service, Pacific Northwest Region, Portland. Ore.
McBain and Trush. (1998). "Tuolumne h v e r corridor restoration plan. Stanislaus County, CA." Drc$ repor?p~-e~~n~-ed,fo~~Tt~nlunzr~c River Ttcl~rzictrl Adviso~-)* Co~lrr~iiftee (Don PetIw Project, FERC Licelise No. 2 2 9 ) , McBain ant1 Tiush, Arcata, Calif.
Parker, G. (1990). "Surface-based bedload transport relation for gravel rivers.'' Jolrr-~ial oJ'Hydru~ulic Research. 28(4), 417436.
Parker: Ci. (1991a). "Selective sorting and abrasion of river gravel. 1: Theory." Joul.ricr1 of H y d r c / ~ ~ l i ~ E~zgi~zeerirzg, 117(2), 131-149.
Parker, G. (1991b). "Selective sorting and abrasion of river gravel. 11: Application." .loilrnnl qf Hyclr-trltlic. Engir~eering, 117(2), 150-171.
Pizzuto. J. (2002). "Effects of dam removal on river form and pro- cess." BioScience, 52(8), 683-691.
Randle, T. (1003). "Dam removal and sediment management." Dam r~emor.al rcseor.ch: Stotlis ulirl pl-ospects, W. L. Graf. ed., H.J. Heinz 111 Center for Science, Economics and the Environment, pp. 81-104.
Squier Associates. (2000). "Sandy River sediment study, Bull Run Hydroelectric Project." Drafr report prepared ,for Portland General Electric, Squier Associates, Lake Oswego, Ore.
Stillwater Sciences. (2000). "Evaluation of geomorphic effects of ernov oval of Ma-inot andLittle Sandy dams and potential impacts on anadromous salmonids." Teclzriical ~.epoi-t preparetl ,fiw Por?lcrr?d Gelzerwl Electric, Stillwater Sciences, Portland, Ore., <http://www. stillwatersci.con~/whatwedo/sedtranspubs>(accessed on Sept. 26, 2005).
StillwaterSciences, (2002). "Sediment transportn~odeling following the removal of Manlot Dam wilh 125,000 and 300.000 cubic yard of dredgingprior to darnremoval." Technical Mernornndunz to poi-tlatlcl
Swanson, F. J., and Dymess. C. T. (1975). "lmnpact of clear-cutting and road construction on soil erosion by landslides in the west- ern Cascade Range, Oregon." Geology, I , 393-396.
Swanson. F. J.. Janda. R. J.. ancl Dunne: T. (1982). "Sunlmary: sediment budget and routing stutlies." Work.rhop or1 sedinze~it 6~lclget.s oilrl rorrtiizg in forested drt~irzrrfie 11rr.sI'rz~: P~,oceedillgs, F. J. Swanson, R. J. Janda, T. Dunne, and D. N. Swanston, eds., Gerzer-rrl ~~clzriicnl Report P W - 1 4 1 , U.S. Forest Service, Pacific Northwest Forest and Range Experiment Station, Portland, Ore., pp. 157-165.
Toro-Escobar, C. M.. Parker, G., and Paola. C. (1996). "Transfer function for the deposition of poorly sorted gravel in response to streambed aggradation." Jourritrl oj'H~-i)dra~~lic Resenrcll, 34(1), 35-54.
U.S. Army Corps of Engineers (USACE). (1993). "HEC-6: Scour and deposition in livers and reservoirs." User's Mtmrrul. Hydrologic Engineering Center, <http://www.hec.usace.army.rnil/software/ lcgacysoftware/hec6~I~ec6-docu11it:ntaLion.htm>(Sept. 26, 2005).
Van Rijn, L. C. (1984). "Sediment transport. 11: Suspended load transport." JOLLI-IZUI qf H J ' L ~ I ~ U L ~ ~ C E~~gilzf'erilzg, I I 0(1 1 ), 1613-1641.
Wilcock, P. R.. and Crowe, J. C. (2003). "A surface-based transport model for sand and gravel.'' Jortr-rial qf'Hydmrtlic Engineering, 129(2), 120-128.