Page 1
Cultivation and characterization of E. coli protein –secretion strains
Jurić, Laura
Master's thesis / Diplomski rad
2018
Degree Grantor / Ustanova koja je dodijelila akademski / stručni stupanj: University of Zagreb, Faculty of Food Technology and Biotechnology / Sveučilište u Zagrebu, Prehrambeno-biotehnološki fakultet
Permanent link / Trajna poveznica: https://urn.nsk.hr/urn:nbn:hr:159:400382
Rights / Prava: In copyright
Download date / Datum preuzimanja: 2022-02-13
Repository / Repozitorij:
Repository of the Faculty of Food Technology and Biotechnology
Page 2
UNIVERSITY OF ZAGREB
FACULTY OF FOOD TECHNOLOGY AND BIOTECHNOLOGY
GRADUATE THESIS
Zagreb, July 2018. Laura Jurić
677 / BPI
Page 3
CULTIVATION AND
CHARACTERIZATION OF E. coli
PROTEIN – SECRETION STRAINS
Page 4
This Thesis was made at the University of Bielefeld, Faculty of Technology, The Chair of
Fermentation Engineering under the guidance of Apl. Prof. Dr. techn. Karl Friehs and with
the help of M. Sc. Gabriele Kleiner-Grote.
Page 5
ACKNOWLEDGEMENTS
I thank to prof. dr. sc. Karl Friehs for accepting me as one of his students, for numerous
suggestions and all the help with my Thesis. I also thank to M. Sc. Gabriele Kleiner-Grote for
technical support and assistance.
I would also like to thank the stuff of the Laboratory of Fermentation technology for the
pleasant work environment, especially many thanks to Eberhard Wünsch, the sunshine of the
lab, for guiding me with such patience, for all the encouragement and for making me, so
many times, to cry out of laughter together, and dipl. ing. Thomas Schäffer for patience and
advices during cultivations in bioreactors. I had the biggest luck to share the office with a
philanthropist dr.sc. Dominik Cholewa, who unselfishly shared his knowledge with me, who
had given me numerous advices and encouragement.
Zahvaljujem mentoru prof. dr. sc. Božidaru Šanteku na savjetima i pomoći.
Hvala i jedinstvenoj teti Vesni Deković iz referade.
Zahvaljujem obitelji Schagun na bezbroj predivnih uspomena i ogromnoj količini ljubavi
uživane tijekom mog boravka u Njemačkoj.
Najviše hvala mojoj obitelji na ljubavi, strpljenju i ohrabrenju. Posebno hvala mome tati čiji
je životni put meni poslužio kao nepresušno vrelo motivacije za postizanje ovog akademskog
uspjeha.
Posebno hvala članovima moje obitelji koji su nas napustili prilikom izrade diplomskog rada,
didu i Wolfgangu.
Hvala svim mojim prijateljima koji su mi uljepšali studiranje.
Page 6
TEMELJNA DOKUMENTACIJSKA KARTICA
Diplomski rad
Sveučilište u Zagrebu
Prehrambeno-biotehnološki fakultet
Zavod za biokemijsko inženjerstvo
Laboratorij za biokemijsko inženjerstvo, industrijsku mikrobiologiju i tehnologiju slada i piva
Znanstveno područje: Biotehničke znanosti
Znanstveno polje: Biotehnologija
UZGOJ I KARAKTERIZACIJA E. coli PROTEIN – SEKRECIJSKIH SOJEVA
Laura Jurić, 677 / BPI
Sažetak: Escherichia coli je jedan od najčešće korištenih mikroorganizama za proizvodnju
rekombinantnih proteina. Veliku većinu proteina proizvodi intracelularno, bilo u citoplazmi ili u
periplazmi, tako da dobivanje biološki aktivnih proteina predstavlja izazov. Ekstracelularnom
proizvodnjom proteina izbjeglo bi se mehaničko razbijanje stanica, olakšala izolacija i pročišćavanje
proteina. Jedan od pristupa, primjenjen i istražen u ovome radu, je upotreba takozvanih leaky
mutanata. Zbog mutacija u genima koji kodiraju za proteine stanične stijenke, ovi mutanti bi trebali
pokazivati povećanu sposobnost izlučivanja proteina iz periplazme u hranjivu podlogu nakon
translokacije proteina prirodno prisutnim bakterijskim translokacijskim mehanizmima. Dva knock-out
soja bakterije E. coli su kultivirani najprije u tikvicama (bez i s pAppA plazmidom) a zatim i u
bioreaktorima. Kultivirani sojevi su karakterizirani obzirom na rast, koncentraciju proizvedenog
proteina i sposobnost sekrecije koristeći fitazu kao reporter protein.
Ključne riječi: E. coli, stanična stijenka, sekrecija proteina, leaky mutanti, fitaza
Rad sadrži: 79 stranica, 40 slika, 17 tablica, 38 literaturnih navoda, 2 priloga
Jezik izvornika: engleski
Rad je u tiskanom i elektroničkom (pdf format) obliku pohranjen u: Knjižnica Prehrambeno-
biotehnološkog fakulteta, Kačićeva 23, Zagreb
Mentor na Prehrambeno-biotehnološkom fakultetu: prof. dr. sc. Božidar Šantek
Neposredni voditelj: prof. dr. sc. Karl Friehs
Pomoć pri izradi: Gabriele Kleiner-Grote, mag. ing.
Stručno povjerenstvo za ocjenu i obranu:
1. Prof.dr.sc. Blaženka Kos
2. Prof.dr.sc. Božidar Šantek
3. Izv.prof.dr.sc. Tonči Rezić
4. Doc.dr.sc. Andreja Leboš - Pavunc (zamjena)
Datum obrane: 13. srpnja 2018.
Page 7
BASIC DOCUMENTATION CARD
Graduate Thesis
University of Zagreb
Faculty of Food Technology and Biotechnology
Department of Biochemical Engineering
Laboratory for Biochemical Engineering, Industrial Microbiology and Malting and Brewing
Technology
Scientific area: Biotechnical Sciences
Scientific field: Biotechnology
CULTIVATION AND CHARACTERIZATION OF E. coli PROTEIN – SECRETION
STRAINS
Laura Jurić, 677 / BPI
Abstract: Escherichia coli is one of the most commonly used microorganisms for production of
recombinant proteins. The vast majority of proteins are produced intracellular, either in cytoplasm or
periplasm, so that obtaining a biologically active proteins represents a challenge. With extracellular
production of proteins, would be avoided cell disruption, ease protein yielding and purification. One
of the approaches, applied and investigated in this thesis, is using so-called leaky mutants. Due to
mutations in genes encoding for proteins of the cell membrane, these mutants show an increased
protein release from periplasm to nutrient medium after protein has been translocated by using natural
bacterial translocation systems. Two E. coli knock-out strains have been cultivated first in flasks
(without and with pAppA plasmid) and then in bioreactors. Strains have been characterized regarding
to their growth, protein production and secretion ability, using phytase as reporter protein.
Keywords: E. coli, cell wall, secretion, leaky mutants, phytase
Thesis contains: 79 pages, 40 figures, 17 tables, 38 references, 2 supplements
Original in: English
Graduate Thesis in printed and electronic (pdf format) version is deposited in: Library of the
Faculty of Food Technology and Biotechnology, Kačićeva 23, Zagreb.
Mentor at Faculty of Food Technology and Biotechnology: Božidar Šantek, PhD, Full professor
Principal investigator: Karl Friehs, PhD, Prof.
Technical support and assistance: Gabriele Kleiner-Grote, M. Sc.
Reviewers:
1. Blaženka Kos, PhD., Full professor
2. Božidar Šantek, PhD., Full professor
3. Tonči Rezić, PhD., Associate professor
4. Andreja Leboš - Pavunc, PhD., Assistant professor (substitute)
Thesis defended: 13 July 2018
Page 8
TABLE OF CONTENTS
1. INTRODUCTION ...................................................................................................................... 1
2. THEORETICAL BACKGROUND ........................................................................................... 2
2.1. Composition of cell wall of Escherichia coli ............................................................................... 2
2.2. Recombinant proteins .................................................................................................................. 3
2.2.1. Recombinant protein production in E. coli ........................................................................... 4
2.3. Type II secretion mechanism ....................................................................................................... 6
2.3.1. Sec translocation ................................................................................................................... 6
2.3.2. TAT pathway ...................................................................................................................... 10
2.4. Leaky mutants ............................................................................................................................ 12
2.5. Phytase AppA ............................................................................................................................ 13
2.6. Bioreactor cultivation of Escherichia coli ................................................................................. 15
3. MATERIALS AND METHODS .......................................................................................... 17
3.1. Chemicals .............................................................................................................................. 17
3.2. Devices and lab consumables ............................................................................................... 19
3.3. Software ................................................................................................................................ 21
3.4. Growth media ........................................................................................................................ 21
3.5. Plasmid ....................................................................................................................................... 22
3.6. Bacterial strains ..................................................................................................................... 24
3.7. Methods...................................................................................................................................... 24
3.6.1. Preculture setting........................................................................................................... 24
3.6.2. Strain stock .................................................................................................................... 24
3.6.3. Flask cultivation ............................................................................................................ 25
3.6.4. Bioreactor cultivation .................................................................................................... 25
3.6.5. Cell lysis ........................................................................................................................ 26
3.6.6. Making chemically competent cells .............................................................................. 27
3.6.7. Transformation of chemically competent cells ............................................................. 27
3.7. Analytical methods ............................................................................................................... 28
3.7.1. Optical density measurement ........................................................................................ 28
3.7.2. Microscopy ................................................................................................................... 28
3.7.3. Enzyme activity test ...................................................................................................... 28
3.7.4. Total protein quantitation – modified Bradford’s protein assay ................................... 29
3.7.5. SDS – PAGE ................................................................................................................. 30
4. RESULTS AND DISCUSSION ................................................................................................ 33
4.1. FLASK CULTIVATION OF DIFFERENT E. coli STRAINS ................................................. 33
4.1.1. Growth behaviour and OD600 .............................................................................................. 33
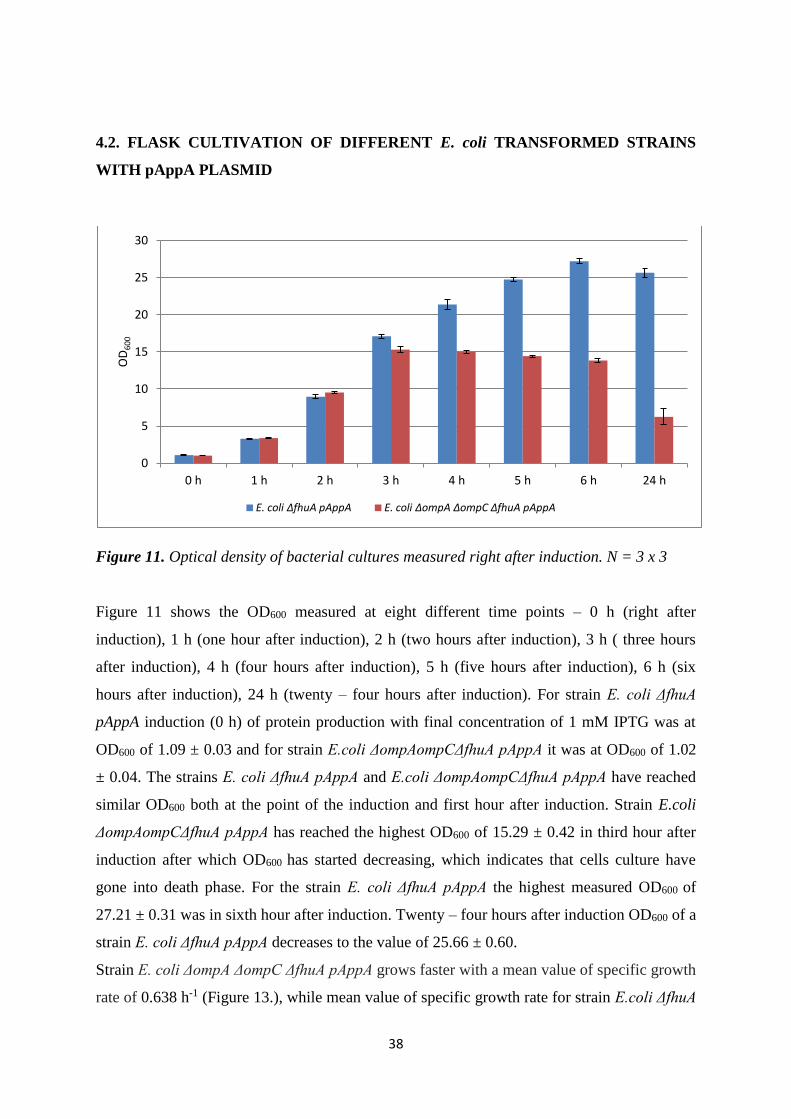
4.2. FLASK CULTIVATION OF DIFFERENT E. coli TRANSFORMED STRAINS WITH
pAppA PLASMID ............................................................................................................................ 38
Page 9
4.2.2. Protein secretion .................................................................................................................. 43
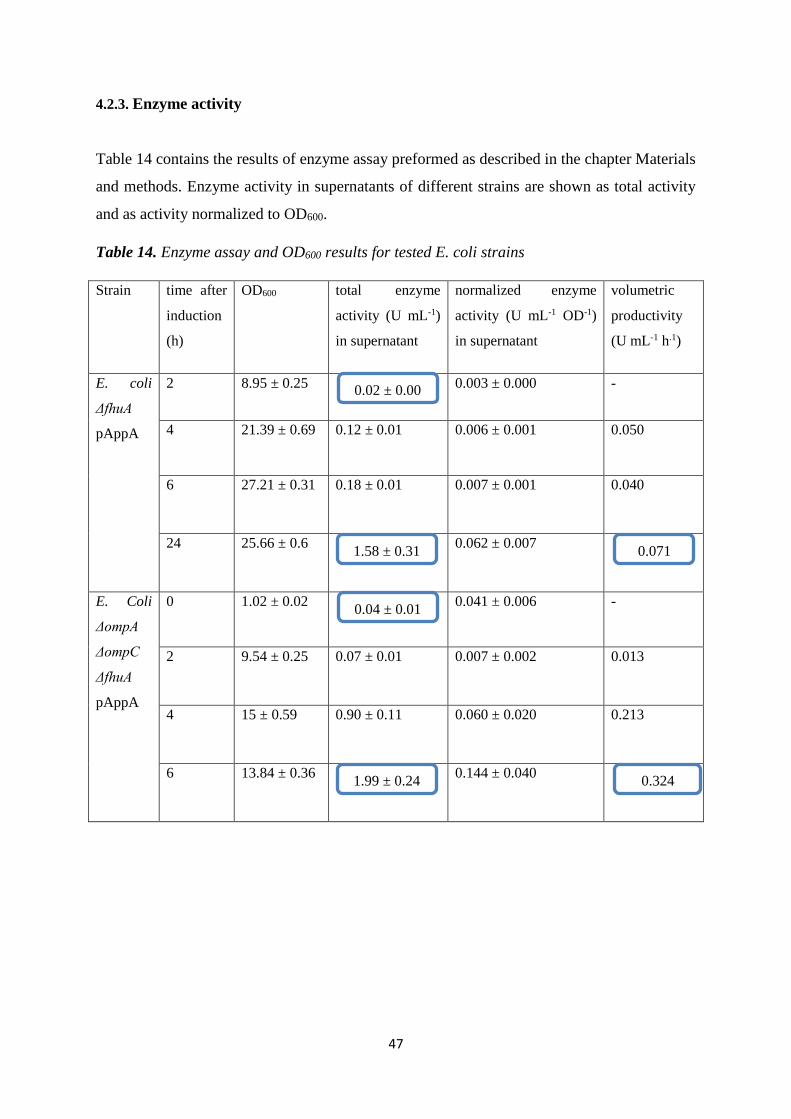
4.2.3. Enzyme activity................................................................................................................... 47
4.2.3. SDS – PAGE ....................................................................................................................... 50
4.3. BIOREACTOR CULTIVATION .............................................................................................. 56
4.3.1. Bioreactor cultivation of Escherichia coli ΔfhuA pAppA ................................................... 56
4.3.2. Bioreactor cultivation of Escherichia coli ΔompAompCΔfhuA pAppA .............................. 59
4.3.3. Protein concentration assay ................................................................................................. 62
4.3.4. Enzyme assay results .......................................................................................................... 65
4.3.5. SDS – PAGE ....................................................................................................................... 71
5. CONCLUSION AND OUTLOOK ........................................................................................... 74
6. BIBLIOGRAPHY ........................................................................................................................ 76
7. APPENDIX ................................................................................................................................ 80
Page 10
1
1. INTRODUCTION
The bacterium Escherichia coli is one of the most commonly used hosts for producing
recombinant proteins. Despite several advantageous characteristics like simplicity, safety,
short doubling time, simple genetic manipulation, high protein yields and easy cultivation in
common nutrient media, inadequate secretion to the extracellular environment represents a
severe drawback for industrial production processes. E. coli belongs to a group of Gram-
negative bacterium, so that its cell envelope comprises two membranes – the inner
cytoplasmic membrane and the outer membrane. Besides providing protection for the cell and
structural integrity, the cell envelope represents a bottleneck in extracellular production of
recombinant proteins. The vast majority of proteins are produced intracellular, either in
cytoplasm or periplasm, so that the downstream processing represents a challenging task in
order to obtain biologically active proteins. Downstream processing thereby often includes
the cell disruption step and the purification. Furthermore, overexpression of recombinant
genes often results in formation of inactive protein aggregates, i. e. inclusion bodies, so that
complicated and costly denaturation-refolding processes are necessary. Hence, extracellular
protein production is highly desirable.
There have been developed a multiple approaches to enhance the extracellular yield and the
secretion efficiency of recombinant proteins. One of the approaches, applied and investigated
in this thesis, is usage of leaky mutants. Due to mutations in genes encoding for proteins of
cell membrane and outer membrane proteins, these mutants show increased protein release
from periplasm to extracellular milieu after the protein has been translocated by using natural
bacterial translocation system.
Both single and triple knock out mutants, ΔfhuA and ΔompAompCΔfhuA, transformed with
pAppA plasmid, have been cultivated and characterized according to their growth, protein
production and enzyme activity with E. coli phytase AppA as reporter protein. Both strains
were cultivated in 5 L bioreactors where the aim was to cultivate high cell density batch
cultures.
Page 11
2
2. THEORETICAL BACKGROUND
2.1. Composition of cell wall of Escherichia coli
The cell envelope of Gram-negative bacteria, such as E. coli, is composed of two lipid
membranes enclosing an aqueous compartment called the periplasm. The cytoplasmic
membrane is a symmetric phospholipid bilayer containing integral α-helical membrane
proteins which forms the barrier between the cytoplasm and the periplasm and it is composed
of approximately 70% phosphatidylethanolamine, 25% phosphatidylglycerol and 5% or less
cardiolipin (McMorran et al., 2014). The cytoplasmic membrane is a barrier for ions and
enables a unique ionic composition of cytosol and energy-consuming processes that are
triggered by the ionic gradients at the membrane. Furthermore, it prevents the uncontrolled
traverse of proteins and other macromolecules that are synthesized in the cytosol but that
fulfill their metabolic or structural functions on the outside of the cell. In order to allow
passage of secretory proteins across the cytoplasmic membrane without compromising its
structure and function, various transport mechanisms have evolved (Natale et al., 2008). The
periplasm is the compartment between the cytoplasmic membrane and the outer membrane,
which contains soluble proteins (McMorran et al., 2014), enzymes that catalyze the formation
of disulphide bonds (Nakamoto and Bardwell, 2004; Ruiz et al., 2006), as well as
peptidoglycan cell wall (McMorran et al., 2014). Periplasmic proteins play role in
maintaining the integrity of the cell envelope. The primary energy source in the periplasm is
proton-motive force across the inner membrane which is used by complex coupling
mechanisms. Since no ATP is present in the periplasm, the processes which take place in this
compartment are independent of nucleotide hydrolysis (McMorran et al., 2014). The
periplasm is an oxidizing environment (Nakamoto and Bardwell, 2004; Ruiz et al., 2006) and
it comprises around 10% of the total cell volume (McMorran et al., 2014). The
peptidoglycan layer is composed of glycan chains that are crosslinked by oligopeptides, but
there are also proteins associated with the peptidoglycan layer such as Lpp (Braun’s
lipoprotein) that covalently anchors the peptidoglycan layer to the outermembrane (Ruiz et
al., 2006). The peptidoglycan cell wall plays important roles such as preventing lysis and
maintaining the shape of the cell (McMorran et al., 2014). The outer membrane is an
asymmetric bilayer of lipopolysaccharide and phospholipid and contains β-barrel integral
membrane proteins. The inner leaflet of the asymmetric outer membrane is comprised of
Page 12
3
phospholipids. It is similar in composition to the cytoplasmic membrane, although the
phosphatidylethanolamin content is enriched compared with the cytoplasmic membrane. The
outer leaflet of the outer membrane consist of lipopolysaccharide (LPS), a glycolipid
typically consisting of a core oligosaccharide, lipid A and an O-antigen. Low permeability of
the outer membrane is due to the high number of fatty acid chains on lipopolysaccharide in
contrast to phospholipids, and the fact that these chains are saturated. Both the inner and the
outer membranes have associated lipoproteins on their periplasmic faces (McMorran et al.,
2014). Due to the high expression levels of pore-forming proteins and transporters that enable
the diffusion of nutrients into the periplasm, the outer membrane is considerably more
permeable than the cytoplasmic membrane (Faraldo-Gómez et al., 2003).
2.2. Recombinant proteins
Proteins are the building blocks of life and all living forms synthesize them as part of their
metabolism. They play a role in the cell cycle, cell signaling, cell adhesion and immune
responses, and they form cytoskeleton. Special sort of proteins are enzymes which serve as
biocatalysts, thus increasing the rate of metabolic reactions. Native and recombinant proteins
are being used in the enzyme industry, the agricultural industry and the biopharmaceutical
industry. The production of recombinant proteins requires the desired DNA getting cloned;
then the protein is amplified in the chosen expression system. The use of recombinant DNA
enabled that important genes, especially mammalian genes, could be amplified and cloned in
foreign organisms. The cell cultures of bacteria, yeast, molds, plants, insects or mammals are
being used as protein expression systems, so as transgenic plants and animals. The choice of
the expression system for recombinant protein production depends on protein functionality,
quality, yield and production speed. 39% of recombinant proteins are made by E. coli, 35%
by CHO cells, 15% by yeasts, 10% by other mammalian systems and 1% by other bacteria
and other systems. Generally, proteins smaller than 30 kD are expressed in a prokaryotic
system while those larger than 100 kD are expressed in a eukaryotic system. One of the most
commonly used hosts for the production of the heterologus proteins is enterobacterium E.
coli. The advantages for choosing E. coli as the expression system are rapid growth, rapid
expression, ease of culture and genome modifications, high product yields and the least
expensive production. In addition, E. coli genetics are far better understood than those of any
Page 13
4
other microorganism. The E. coli system has some drawbacks. E. coli is not suitable for
production of proteins that require glycosylation and for S-S rich proteins as it cannot remove
the S-S sequence. During high cell densities cultivation, the acetate is formed resulting in cell
toxicity. This can be avoided by controlling the level of oxygen, by feeding glucose
exponentially and keeping the specific growth rate below that which brings on acetate
production. The proteins with many disulfide bonds are difficult to express and refolding of
these proteins is difficult. Proteins which are produced as inclusion bodies are inactive,
aggregated, insoluble and require refolding. In addition, some of the proteins are produced
together with endotoxins. E. coli in not able to express very large proteins. In cases where
glycosylation is necessary for proper folding or stability, recombinant yeast, mold, insect or
mammalian cells are systems of choice (Demain and Vaishnav, 2009).
2.2.1. Recombinant protein production in E. coli
Recombinant proteins are generally produced either in microbial systems or in mammalian
cell cultures. Advantages of microbial systems over mammalian cell cultures are production
of recombinant proteins in a shorter time and at lower cost. Hence, bacteria are particularly
suitable for producing recombinant proteins (Dassler et al., 2008). Escherichia coli has been
the most commonly used host for mass-production of recombinant proteins of pharmaceutical
and industrial importance. This production host has numerous desirable characteristics as
easy manipulation, fast cell growth, high cell density cultivation and capacity to hold over
50% of foreign protein in total protein expression (Choi et.al., 2006; Yoon et al., 2010).
However, E. coli cannot produce mammalian proteins that require post-translational
modification for activity, or some proteins containing complex disulfide bonds (Choi and
Lee, 2004). The usage of E. coli as cell factory for secretory production of recombinant
proteins faces a few challenges for industrial production. Secretory production into the
periplasm is physically limited by periplasmic volume and results in reduced cell growth and
increased cellular burden. There is possibility that foreign proteins are degraded by host
proteases. Also, target protein production is limited by insufficient capacity of the transport
machinery. High rate of target translation can lead to accumulation inside the cell which
results in inclusion body formation (Yoon et al., 2010). Process that are particularly preferred
for producing recombinant proteins in E. coli are those in which the target protein is secreted
in the correct folding and in high yield directly into the fermentation medium (Dassler et al.,
2008). Recombinant proteins can normally be produced in E. coli in various ways, i.e.
Page 14
5
intracellular production as soluble protein, intracellular production as inclusion bodies, and
secretion into the periplasm. In addition, it is possible to use leaky strains which have a defect
in the outer membrane thereby releasing periplasmic proteins partly into the fermentation
medium by a nonspecific mechanism. Examples of such leaky mutants are strains with
altered lipoprotein contents in the outer membrane, e.g. lpp mutants which release the cell’s
periplasmic proteins into the fermentation medium. Such strains are extremely sensitive to
various detergents, dyes and EDTA (Dassler et al., 2008). When the target exogenous
proteins are expressed intracellularly in recombinant E. coli, cell disruption is necessary
which often results in decrease of protein activities, the increase of sample impurities and
pyrogen level (mainly from the cell membrane composition). In addition, intracellular
accumulation of target proteins often results in the formation of inclusion body (Chen et al.,
2014). In comparison with cytosolic production, secretory production of recombinant proteins
provides several advantages. Those advantages include simpler purification of recombinant
proteins due to fewer contaminating proteins in the periplasm. Also, periplasmic space
provides a more oxidative environment than the cytoplasm so that correct formation of
disulfide bonds is facilitated. In addition, there appears to be much less protease activity in
the periplasmic space than in the cytoplasm. Another advantage is that the N-terminal amino
acid residue of the secreted product can be identical to the natural gene product after signal
sequence is cleaved by a specific signal peptidase (Makrides, 1996; Choi and Lee, 2004). In
order to obtain recombinant protein extracellularly secreted with E. coli cells, protein
translocation is necessary across the two membranes – the cell membrane and the outer
membrane. The advantages of extracellular secretion of target proteins are higher
recombinant protein yield because the target protein accumulation is not limited by
intracellular or periplasmic space, reduced risk of intracellular enzyme degradation, better
environment for protein folding, and elimination of cell disruption step. Periplasmic
expression of recombinant proteins can often be achieved with the help of a signal peptide.
On the other hand, the available methods to overcome the outer membrane barrier for
extracellular production of recombinant proteins are limited. In pursuance of solving this
problem, various genetic attempts have been made to facilitate the extracellular secretion of
recombinant proteins in E. coli, including optimization of codon and signal sequence,
manipulation of transport pathways, fusion expression of outer membrane protein F, YebF or
osmotically inducible protein Y and fusion expression of carrier protein which can be
normally secreted extracellularly. Furthermore, the use of wall-less strains and the
Page 15
6
coexpression of lysis-promoting proteins such as bacteriocin release protein (BRP) or colicin
E1 lysis protein (Kil) have also been reported (Chen et al., 2014).
2.3. Type II secretion mechanism
The type II secretion system is a two-step process for the extracellular secretion of proteins
which includes periplasmic translocation and extracellular transport (Yoon et al., 2010). In
the the general secretory pathway (type II), proteins to be secreted contain an amino-terminal
signal sequence that target them to the cytoplasmic membrane. During the translocation,
signal peptidase removes the signal sequences. In the periplasm, proteins undergo
transformations such as folding and assembly prior to translocation through the outer
membrane (Pugsley, 1993; Sandkvist and Bagdasarian, 1996). Periplasmic translocation or
secretion across the bacterial cytoplasmic membrane can be mediated by three pathways: the
SecB-dependent pathway, the twin-arginine translocation (TAT) and the signal recognition
particle (SRP) pathways (Mergulhão et al., 2005). Concerted action of 12-16 proteins are
constituting a secretion machinery named “secreton” which carries out a extracellular release
of the periplasmic protein (Yoon et al., 2010).
2.3.1. Sec translocation
Secretory proteins can be targeted to the Sec translocation complex by two different
mechanisms, i. e., the co-translational and the posttranslational targeting. In the latter, the
signal sequence containing secretory protein is released from the ribosome in its synthesis
completed state and directed to the Sec-translocase. Posttranslational secretory proteins in
various Gram-negative bacteria are guided to the Sec-translocase by the secretion specific
chaperone SecB that maintains these proteins in a translocation-competent, unfolded state.
During co-translational targeting, the signal recognition particle (SRP) binds to the signal
sequence of the secretory protein while it emerges from the ribosome and the entire ternary
complex of ribosome/SRP/nascent secretory protein chain are transferred from SRP to Sec-
translocase. The signal peptide (signal sequence) is an amino-terminal extension of the
secretory protein that is necessary for a correct targeting to the translocation pathway. The
signal sequence typically has an average length of 20 amino acid residues with a tripartite
structure, i.e., a positively charged amino-terminal (n-region), a hydrophobic core (h-region)
and a polar carboxyl-terminal (c-region). The polar c-region is needed for recognition by the
Page 16
7
type I signal peptidase (or leader peptidase), a membrane bound enzyme that cleaves the
signal sequence from the mature secretory protein domain during or shortly after
translocation. The tripartite structure of Sec signal sequences is recognized by the Sec
components. The positively charged n-region has been implicated in electrostatic interactions
with membrane phospholipids, whereas the hydrophobic core (h-region) typically consists of
hydrophobic amino acids with a high propensity to form an α-helix. Both the n- and h-regions
are critical structural elements recognized by the motor protein SecA and SRP. The binding
affinity of SecA for signal sequences increases with the number of positive charges in the n-
region, whereas the SRP interaction increases with the hydrophobicity of the h-region (Natale
et al., 2008).
2.3.1.1. SecB-dependent pathway
The vast majority of the secretory proteins of E. coli reach SecYEG post-translationally, after
more than two-thirds of the chain has been synthesized at the ribosome. Here SecA is the
SecYEG partner and the energizer of the system (Chatzi et al., 2014). The bacterial Sec
translocase is composed of a peripheral associated ATPase, SecA, and a membrane
embedded protein conducting channel (PCC) that consist of three integral membrane
proteins, SecY, SecE and SecG. The protein conducting channel forms a hydrophilic pore for
secretory proteins to pass the membrane. The essential components of the Sec-translocase are
the motor SecA and the channel subunits SecY and SecE. SecA can associate with low
affinity with negatively charged phospholipids and binds with high-affinity to the PCC.
Binding of SecA to SecYEG leads to conformational change of SecA (Natale et al., 2008).
SecY is an essential transmembrane protein which forms the central export pore and is
stabilized and embraced by SecE (Chatzi et al., 2014). SecG is located at the periphery of
the channel complex and it makes only limited contact with SecY and SecE (Natale et al.,
2008). While SecG may not be essential for viability or translocation, it facilitates the binding
of SecA on SecY and its subsequent membrane insertion. Ten trans-membrane helices of
SecY create a clamshell with its opening, known as lateral gate, facing the lipid bilayer thus
allowing the hydrophobic signal sequences and trans-membrane helices to diffuse into the
lipid bilayer (Chatzi et al., 2014). The role of the n-region of signal peptide is believed to be
targeting the preprotein to the translocase and binding to the negatively charged surface of the
membrane lipid bilayer. It has been shown that increasing the positive charge in this region
enhances translocation rates, presumably by increasing the interaction of the preprotein with
Page 17
8
SecA. Furthermore, a minimum hydrophobicity of signal peptide is necessary for function
and that translocation efficiency increases with the length and hydrophobicity of the h-region.
On the SecB-dependent pathway, the ribosome-associated nascent chains of secreted proteins
bind trigger factor, which is bound to the ribosomes. This association prevents cotranslational
binding of the nascent chain to SRP components (Mergulhão et al., 2005). Soluble SecA
appears as a functionally idle state and exhibits a low ATPase activity. Upon binding to
SecYEG, the protein SecA attains its active state which manifests in conformational change
of SecA and an increased rate of nucleotide exchange at SecA. SecB does not interact with
the signal peptide region of secretory proteins, but binds to the polypeptide domains of long
nascent secretory proteins while they emerge from the ribosome exit tunnel and stabilizes
them in an unfolded conformation. Chaperone SecB is not essential for translocation. SecB
facilitates translocation by maintaining secretory proteins in an unfolded conformation and
actively targets and transfer secretory proteins to the PCC-bound SecA. In the absence of
SecB, the signal sequence suffices to direct secretory proteins to the SecA. Unlike other
chaperones, SecB binds specifically to the PCC-associated SecA, and this reaction initiates
the transfer of the unfolded secretory protein from SecB to SecA (Natale et al., 2008). By
bidning SecB to SecA, SecB releases the precursor protein that is transferred to SecA. SecA
recognizes specifically the signal peptide of the preprotein. At this point SecA is bound to the
SecY subunit of the SecYEG translocation complex. Binding of ATP at one of the two ATP-
binding sites on SecA results in the release of SecB from the membrane. Binding of the
preprotein to SecA causes translocation of approximately 20 amino acids. With subsequent
binding of ATP to SecA, promoted is SecA membrane insertion and translocation of an
additional 15-20 amino acids (Mergulhão et al., 2005), thus a loop of the signal sequence
with the mature N-terminal region of the secretory protein inserts into the PCC (protein
conducting channel). Here signal sequence gains access to the catalytic site of leader
peptidase and processing may take place (Natale et al., 2008). The cleavage of the signal
sequence occurs on the periplasmic face of the membrane (Chatzi et al., 2014). In a following
step, SecA-bound ATP is hydrolysed and this results in release of the secretory protein from
SecA while the inserted and translocated polypeptide domains remain trapped in the PCC
(Natale et al., 2008). During every catalytic cycle of ATP hydrolysis, 20-30 amino acyl
residues of the preprotein are translocated (Vassylyev et al., 2006; Chatzi et al., 2014). Next,
the PCC-bound SecA may re-bind the protein without dissociating from PCC or SecA may
dissociate from the PCC to allow a new SecA molecule to bind the translocation intermediate
(Natale et al., 2008). Multiple rounds of SecA insertion and deinsertion from the membrane
Page 18
9
promote protein translocation through the channel (Mergulhão et al., 2005), as well as
hydrolysis of ATP (Natale et al., 2008), whereas proton-motive force (PMF) can complete
translocation when the preprotein is halfway through the translocase. Despite being the most
commonly used for recombinant protein production, the SecB-dependent pathway has one
serious drawback. This system is not able to transport folded proteins and hence the secretion
of proteins that fold rapidly in the cytoplasm may not be possible (Mergulhão et al., 2005).
2.3.1.2. SRP pathway
The signal recognition particle (SRP) pathway consists of several proteins and one RNA
molecule (Mergulhão et al., 2005). SRP has a very high affinity for very hydrophobic signal
sequences and nascent hydrophobic trans-membrane segments (Chatzi et al., 2014). By
engineering the hydrophobicity of the signal sequence, recombinant proteins can be targeted
to the SRP pathway (Mergulhão et al., 2005). During “co-translational” secretion, the Signal
Recognition Particle (SRP), composed of the short 4.5S RNA species and the Ffh (Fifty four
homologue) protein, recognizes and binds to the ribosomal L23 subunit (Chatzi et al., 2014),
the site that overlaps the binding site of trigger factor (Mergulhão et al., 2005), and to the
exiting signal sequence (Chatzi et al., 2014). Whether the peptide is targeted to the membrane
via the SRP pathway, or post-translationally by the SecB pathway, is determined by the
characteristics of the nascent peptide. The presence of an N-terminal signal sequence with a
highly hydrophobic core, combined with a lack of a trigger factor binding site, results in
cotranslational binding of the nascent chain to cytoplasmic protein Ffh. 4.5S RNA is required
for binding of the nascent chain to Ffh (Mergulhão et al., 2005). Then ribosome-nascent
chain complex is delivered to FtsY, its membrane-associated receptor (Chatzi et al., 2014),
protein found both in the cytoplasm and at the membrane, thus releasing the nascent chain to
the translocation site, presumably the SecYEG translocon (Mergulhão et al., 2005). The SRP-
FtsY complex dissociates at the expense of GTP (Chatzi et al., 2014).
Page 19
10
2.3.2. TAT pathway
The Tat pathway appears to be the unique in its ability to transport relatively massive folded
proteins across energy-transducing cytoplasmic membrane (Robinson et al., 2011). The twin-
arginine translocation system does not require ATP as an energy source, and relies solely on
the proton motive force (PMF) (Patel et al., 2014). The Tat system’s best-known substrates
are redox proteins that bind their cofactors in the cytoplams, such as FeS, NiFe centres and
molybdopetrin, prior to export to the periplasm (Robinson et al., 2011). However, there are
also Tat substrates which lack cofactors. Obviously, cofactor assembly is not the only reason
for Tat dependent transport (Natale et al., 2008). The substrates for the Tat pathway are
exported posttranslationally in a process mediated by N-terminal signal peptides. Many Tat
substrates are cofactor-containing, so that after synthesis and initial folding they acquire
redox cofactors in the cytoplasm, often with the aid of chaperones and substrate-specific
guidance factors (Robinson et al., 2011). Furthermore, there are many general and specific
chaperones which can bind Tat signal sequences and help to protect Tat signal sequences
degradation. The term “proofreading” is used to describe a function that prevent targeting
prior to folding, which includes specific chaperones that prevent translocase interactions prior
to cofactor insertion and folding, leading in many cases to an oligomerization of the substrate
protein (Natale et al., 2008). The TAT system is capable of secreting folded proteins by
employing a particular signal peptide containing a twin-arginine sequence (Choi and Lee,
2004). TAT signal peptides are composed of three regions as well as Sec signal peptides: a c-
region that contains the cleavage site, a hydrophobic region (h-region) and a positively
charged region (n-region) (Mergulhão et al., 2005). Studies on Tat signal peptides revealed a
highly conserved SRRxFLK motif (where x is a polar amino acid (Robinson et al., 2001)),
where three determinants appear to be important: the twin-arginine pair, the hydrophilic -1
residue and the hydrophobic +2 residue (-/+ relative to the twin-arginine pair). The C-region
of certain Tat signal peptides houses basic residues, which are seldom found in the same
region of Sec signal peptides. The C-terminal region contains an A-x-A motif, which is a
consensus cleavage site for removal of the signal peptide by signal peptidase. The Tat signal
peptides are longer than Sec-specific signals (on average 38 to 24 amino acids, respectively)
(Patel et al., 2014) and usually, the hydrophobic region of TAT signal peptides is less
hydrophobic in comparison with that of Sec leader peptides (Mergulhão et al., 2005). On the
TAT pathway, the substrate bearing a twin-arginine signal peptide binds initially to TatBC
Page 20
11
complex in a resting membrane. Bounding of the precursor to the substrate-binding TatBC
complex, results in the association of the TatA complex with the TatBC complex in the
presence of a ΔpH (Patel et al., 2014). The substrate is then transported by a mechanism
requiring the proton motive force, after which it is processed to the mature size (Robinson et
al., 2011). Once the transport has been done, TatA disassembles from TatBC and the Tat
substrate is released from the membrane by a cleavage of type I signal sequences peptidases
(Yahr and Wickner, 2001; Natale et al., 2008). Three integral membrane proteins, TatA (9.6
kDa), TatB (18.5 kDa) and TatC (28.9 kDa), usually constitute the Tat translocase system.
These proteins are encoded by the tatABC operon and reside in the cytoplasmic membrane
arranged as a Tat(A)BC substrate binding complex and a separate TatA complex. In E. coli,
there is no evidence for a specific role of TatE, a paralog of TatA, and it is encoded elsewhere
in the genome. Both TatA and TatB are single-span transmembrane proteins that possess a
highly charged, unstructured cytoplasmically-exposed C-terminus, single-span
transmembrane helix; hinge region; amphipathic helix lying along the cytoplasm-membrane
interface and a short periplasmic N-terminal region. In contrast, TatC is a polytopic protein
that presumably contains 6 transmembrane spans, with both the N- and C- termini in the
cytoplasm. The tatABC gene products form two distinct membrane complexes at steady state:
a separate TatA complex and a TatBC-containing substrate binding complex where most of
TatB and –C are found at 1:1 stoichiometric ratio. TatC is the largest and most conserved
component of the Tat pathway where it plays a central role in the translocation event, ranging
from substrate recognition and binding, to the recruitment of other Tat components (Patel et
al., 2014). Although TatA and TatB share 25% sequence identity and the two subunits have a
similar secondary structure, these two subunits cannot substitute for each other, even when
they are overexpressed (Sargent et al., 1999; Robinson et al., 2011). It is believed that
physiological role of Tat system is to extend the set of translocatable substrates to those that
fold prior to translocation and that it is used only in cases where cytoplasmic folding excludes
the use of the Sec system (Natale et al., 2008). It has been reported that transport via the TAT
pathway is slower and less efficient than the Sec pathway. Furthermore, it has been shown
that this secretion mechanism is rapidly saturated, so that coexpression of the tatABC operon
is required for large-scale production. The requirement for coexpression presents a severe
disadvantage for the application of the TAT pathway for production processes. However,
unlike the SecB or the SRP pathways, the TAT pathway is capable of transporting folded
protein across the inner membrane (Mergulhão et al., 2005), especially proteins that contain
Page 21
12
complex disulfide bonds or that may be folded before they reach the Sec machinery (Choi
and Lee, 2004).
2.4. Leaky mutants
Leaky mutants of E. coli are mutants which, owing to mutations in structural elements of the
outer cell membrane or the cell wall, show increased release of periplasmic proteins into the
medium (Shokri et al., 2003; Wich and Dassler, 2008) and allow the entry of molecules (Ruiz
et al., 2006). Weakened cell wall contributes to the cell sensitivity due to influences from the
outer environment (Wang, 2002). A set of precisely defined, single-gene deletions of all
nonessential genes in Escherichia coli K-12 strain BW25113 was made to create the KEIO
strain collection. Escherichia coli K-12 has been one of the best-characterized organisms in
molecular biology. BW25113 is a strain with a well-defined pedigree that has not been
subjected to mutagens. Open-reading frame coding regions were replaced with a kanamycin
cassette flanked by FLP (flippase) recognition target (FRT) sites by using a one-step method
(λ Red system) for inactivation of chromosomal genes and primers designed to create in-
frame deletions upon excision of the resistance cassette. Of 4186 genes targeted, mutants
were obtained for 3864. Two independent mutants were saved for every deleted gene in order
to alleviate problems encountered in high-throughput studies (Baba et al., 2006). E. coli
JW0146-2 strain has fhuA deleted which codes for a monomeric protein FhuA, a β barrel
composed of 22 antiparallel transmembrane β strands (Ferguson et al., 1998). FhuA protein
(ferric hydroxamate uptake protein component A, 714 residues) has a physiological function
in the uptake of the siderophore ferrichrome, i.e., it facilitates ligand-gated transport of
ferrichrome-bound iron across outer membranes (Locher et al., 1998). In addition to bining
ferrichrome-iron, FhuA in the outer membrane of Escherichia coli also functions as the
primary receptor for the structurally related antibiotic albomycin, for the bacterial toxin
colicin M, for the peptide antibiotic microcin 25, and for several bacteriophages (T1, T5, UC-
1, and φ80) (Ferguson et al., 1998). Another strain used in this thesis is triple knock-out
strain ∆ompA ∆ompC ∆fhuA. Gene ompA codes for OmpA - outer membrane protein A, the
most well-studied major outer membrane protein in E. coli (Wang, 2002) with typically 100
000 copies per cell (Ortiz-Suarez et al., 2016). The outer membrane protein A (OmpA) which
Page 22
13
forms a non-specific diffusion pore is a 325-residue protein and it is the most common
protein component of the outer membrane of E. coli (Ishida et al., 2014). The function of
heat-modifiable OmpA is thought to contribute to the structural integrity of the outer
membrane, along with peptidoglycan-associated lipoprotein and murein lipoprotein, by
holding peptidoglycan and the outer membrane together as the whole structure in E. coli.
Furthermore, OmpA serves as a receptor of colicin and several phages, it is required for F-
conjugation and some small molecules may pass the β-barrel of OmpA and cross the outer
membrane (Wang, 2002). Within the outer membrane resides the N-terminal domain of
OmpA which is an eight-stranded transmembrane β-barrel. The soluble C-terminal domain is
located in the periplasm. A 15-amino-acid linker region connects the barrel to the C-terminal
domain (Ortiz-Suarez et al., 2016). The β-barrel of OmpA can be in either an open or closed
state, thus causing different levels of conductance (Ortiz-Suarez et al., 2016). Wang has
propored that OmpA is composed of three functional domains including a hydrophilic
extracellular mass, a β-barrel transmembrane structure, and a peptidoglycan binding domain
(Wang, 2002). Second gene, ompC codes for protein OmpC. It belongs to a group of porin
proteins which form relatively nonspecific pores which allow diffusion of nutrients across the
outer membrane, facilitate the transport of colicins and serve as receptors for various
bacteriophages. It is tightly associated with peptidoglycan and lipopolysaccharide (Misra and
Benson, 1988). The sequence of OmpC is 60% identical to another porin, OmpF. OmpC is
slightly more cation selective than OmpF and its pore has been predicted to be smaller
(Nikaido, 2003; Baslé et al., 2006). Both major outer membrane proteins OmpC and OmpF in
E. coli are known as porins because they form passive diffusion pores which allow small
molecular weight hydrophilic materials across the outer membrane (Nikaido, 1979; Mizuno
et al., 1983). In E. coli they are among the most abundant outer membrane proteins with
about 105 copies per cell and serve as general pathways for the influx of small molecules (e.g.
molecular weight under 600) (Masi and Pagès, 2013). Many environmental factors have been
identified that alter OmpF and OmpC expression, including temperature, pH, osmolarity,
nutrient availability, and various toxins (Forst and Inouye, 1988; Pratt et al., 1996; Liu and
Ferenci, 2001; Batchelor et al., 2005).
2.5. Phytase AppA
Phytates are the primary storage form of both phosphate and inositol in plants, predominantly
occurring in cereal grains, oilseeds and legumes (Haefner et al., 2005). Phytase (myo-inositol
Page 23
14
hexakisphosphate phosphohydrolase, EC 3.1.3.8 for 3-phytase and 3.1.8.26 for 6-phytase)
catalyses the release of inorganic phosphate and myo-inositol from phytate (myo-inositol
hexakiphosphate) (Pandey et al., 2001), the salt of phytic acid (Haefner et al., 2005). Phytic
acid (myo-inositol 1,2,3,4,5,6-hexakis dihydrogen phosphate) is a polyanionic chelating
agent that forms insoluble complexes with nutritionally important cations, e.g., Ca2+, Fe2+,
Mg2+, Zn2+,Cu2+ and Mn2+ (Haefner et al., 2005), thereby decreasing their bioavailability
(Greiner et al., 1993). Furthermore, it can also form complexes with amino acids and proteins
at both alkaline and acidic pH. Microbial phytase is able to enhance protein digestibility
(Haefner et al., 2005). Phytase has been added as a supplement to animal feed for
monogastric animals to eliminate the negative effects of phytic acid in animal nutrition and to
enhance plant phosphorous utilization (Morz et al., 1994, Miksch et al., 2002). Phytase is
used in commercial diets of swine, poultry and fish to improve the availability of energy,
phosphorous, minerals and amino acids. Without enzymatic degradation by phytases, the
phytate molecule together with nutrients bound to it, cannot be absorbed in the digestive tract
and consequently accumulates in fecial material. Since the availability of phosphorous in
plant-derived animal food is low, diets for nonruminants have been supplemented with
inorganic phosphates. The manure of livestock has been applied to the soil, thus leading to
accumulation of phosphate in the soil. Outcome of this could be long-term leaching of
phosphate into ground water and eutrophication of surface waters. Phosphorus excretion of
monogastric animals can be reduced between 25 and 50% by replacing inorganic phosphates
with microbial phytase (Haefner et al., 2005). Phytase activity in microorganisms occurs
most frequently in fungi, in particular Aspergilli, bacteria, yeast and rumen microorganisms
(Greiner et al., 1993). Main features of E. coli phytase are the highest specific activity of all
phytases tested so far and in contrast with commonly used Aspergillus phytases, the pH
optimum is situated more in the acid range and E. coli phytase is resistant to proteolytic
degradation in stomach of monogastric animals (Miksch et al., 2002). Furthermore, E. coli
phytase is more resistant to high temperatures during pelleting process (Kleist et al., 2003). E.
coli phytase is a periplasmatic 6-phytase (Greiner et al., 1993) with a molecular weight of
about 45000 (with signal sequence being cleaved) and an isoelectric point of 6.3 (Dassa et al.,
1980). Since the phytase is periplasmic enzyme, extracellular production is required for this
industial enzyme in order to facilitate downstream processing, e.g. cell disruption and the
separation of cell debris (Miksch et al., 2002).
Page 24
15
2.6. Bioreactor cultivation of Escherichia coli
The overall goal in production of recombinant proteins is to simultaneously reach a high cell
density, a high product quality and a high specific recombinant protein production rate.
A high cell density can only be achieved by fed-batch cultivation that corresponds to a feed
profile, which leads to a continuously decreasing growth rate during the process (Shokri et
al., 2003). However, the extended culture period in fed-batch cultures is the reason why the
production of acetate is greater in fed-batch rather than in batch culture (Lee, 1996). High
productivities are obtained through either a high concentration or a high activity of the bio-
catalyst (Knoll et al., 2007). Cultivation of E. coli to high cell concentrations is necessary for
obtaining the maximal volumetric productivities. In response to excess carbon or oxygen
limitation, cells produce growth-inhibiting acidic by-products of incomplete substrate
oxidation such as acetic acid. Prevention of the accumulation of toxic levels of acetic acid is
the main task for achieving high cell concentrations in bioreactors (Korz et al., 1995).
Development of high cell density culture (HCDC) techniques for cultivation of E. coli cells
has improved productivity and provided advantages such as lower production costs, reduced
investment in equipment, reduced wastewater, enhanced downstream processing and reduced
culture volume (Lee, 1996). Some of the problems that can arise in high-cell-density cultures
are limited capacity for O2 supply, limitation and/or inhibition of substrates and formation of
metabolic by-products. In addition, the final cell density can be limited by a several factors
such as formation of metabolic by-products, heat and generation of CO2 (Riesenberg, 1991).
Temperature of cultivation impacts cell metabolism. Nutrient uptake and growth rate can be
reduced by lowering the culture temperature from 37°C to 26-30°C. This results in reduced
formation of toxic by-products and the generation of metabolic heat. Furthermore, it also
reduces cellular oxygen demand and formation of inclusion bodies. High partial-pressure of
CO2 (>0.3 atm) stimulates acetate formation and reduces growth rate. With the increase of
bioreactor size, efficiency of mixing is being reduced causing unequal distribution of
nutrients in HCDCs. It has been demonstrated that some nutrients, such as nitrogen and
carbon sources, can inhibit cell growth when they are present above a certain concentrations.
For example, glucose inhibits growth at concentration above 50 g L-1, ammonia at
concentration above 3 g L-1 and phosphorus at concentration above 10 g L-1. Therefore,
HCDCs are started with concentrations of nutrients below the inhibitory thresholds and as
necessary to maintain high growth rates. Three types of media have been known: defined,
Page 25
16
semi-defined and complex. It is necessary that medium for growing cells to a high density
contains all the necessary components for supporting cell growth, while avoiding inhibition.
In HCDCs ammonium hydroxide is often used both as a nitrogen source and as a base for
adjustment of culture pH (Lee, 1996). The formation of metabolic by-products, such as
acetate, ethanol, D-lactate and L-glutamic acid, during aerobic growth in media containing
glucose, pyruvate, glycerol and/or complex components might become a serious problem if
the by-products accumulate to concentrations which inhibit the growth (Riesenberg, 1991).
The major problem in fermentation is the formation of acetate resulting in cell toxicity.
Acetate is produced when E. coli is grown under anaerobic or oxygen-limited conditions.
Also, it has been shown that E. coli cultures growing in the presence of excess glucose can
also produce acetate even under aerobic conditions. A high concentration of acetate (i.e.,
above 5 g L-1 at pH 7) inhibits the growth rate and reduces biomass yield (Kleist et al. 2003).
Production of acetate happens when carbon flux into the central metabolic pathway exceeds
the capacity for energy generation within the cell and biosynthetic demands; the main cause
can be saturation of the electron transport chain and/or the tricarboxyl acid (TCA) cycle.
Under aerobic conditions, there are two enzymatic pathways for formation of the main by-
product acetate. The major one is the acetate kinase phosphotransacetylase pathway starting
from acetyl-coenzyme A, and in the minor one acetate is derived directly from pyruvate by
pyruvate oxidase. Low solubility of oxygen is limiting factor in HCDCs. Oxygen limitation
can be prevented by increasing the aeration rate or agitation speed, using oxygen-enriched air
or pure oxygen (Lee, 1996), decreasing the temperature and pressurizing the culture
(Riesenberg, 1991). Concentration of the saturated dissolved oxygen (DO) in water at 1atm
and 25°C is about 7 mg L-1 (Lee, 1996). Hence, the challenging task in biochemical
engineering presents sufficient oxygenation of aerobic fermentation process, especially in
high cell density cultivation (HCDC) where the oxygen demand exceeds by far the maximum
oxygen transfer capacity (OTRmax) of conventional bioreactors such as bubble columns or
stirred tanks. The microbial growth and activity are limited by the dissolved oxygen
concentration in the culture medium. Oxygen limitation results in diminish of the growth and
production rates and for the microorganisms which are capable of anaerobic metabolism, the
metabolic pathway can be shifted in an unfavorable direction thus declining product yield.
The most commonly applied for overcoming oxygen limitation by increasing the OTRmax of
bioreactors are aeration using oxygen enriched air and special aeration systems (Knoll et al.,
2007).
Page 26
17
3. MATERIALS AND METHODS
3.1.Chemicals
Following table (Table 1.) lists all used chemicals and their manufacturers. In Table 2., there
is a list of special chemicals – kits and ladders (Figure 1.). Chemicals are dissolved in ddH20
except for 4-Nitrophenyl phosphate disodium salt hexahydrate, which is dissolved in glycine-
HCl buffer made as explained later in chapter Enzyme activity test.
Table 1. List of used chemicals and their manufacturers.
Chemicals manufacturer
4-Nitrophenol Sigma-Aldrich Chemie GmbH
4-Nitrophenyl phosphate disodium salt hexahydrate Sigma-Aldrich Chemie GmbH
agar – agar Carl Roth GmbH + Co. KG
ammonium persulphate Carl Roth GmbH + Co. KG
Bis-/Acrylamide (0,8 %, 30 %) Carl Roth GmbH + Co. KG
bromophenol blue Carl Roth GmbH + Co. KG
BSA (albumin fraction V) Carl Roth GmbH + Co. KG
Coomassie Brilliant Blue G – 250 Carl Roth GmbH + Co. KG
dipotassium phosphate VWR International GmbH
glycerine (99,5 %) Emery Oleochemicals GmbH
Glycine Carl Roth GmbH + Co. KG
IPTG Carl Roth GmbH + Co. KG
Isopropanol VWR International GmbH
kanamycin sulphate Carl Roth GmbH + Co. KG
natrium carbonate Carl Roth GmbH + Co. KG
natrium chloride Fisher Scientific GmbH
natrium hydroxide Carl Roth GmbH + Co. KG
Page 27
18
phosphoric acid Carl Roth GmbH + Co. KG
Pluronic (antifoam) BASF SE
potassium dihydrogen phosphate VWR International GmbH
SDS Carl Roth GmbH + Co. KG
soya peptone UD Chemie GmbH
TEMED Carl Roth GmbH + Co. KG
Tris Fisher Scientific GmbH
Tris-HCl Fisher Scientific GmbH
yeast extract Ohly GmbH
CaCl2 PanReac AppliChem ITW
Table 2. Special chemicals and their manufacturers.
Chemical manufacturer
PageRuler Prestained Ladder Thermo Fisher Scientific Inc.
Roti®–Nanoquant kit for protein concentration test
K880
Carl Roth GmbH + CO. KG
Page 28
19
Figure 1. PageRuler Prestained Ladder by Thermo Fisher Scientific Inc. on SDS
electrophoresis gel. (www.thermofisher.comordercatalogproduct26616, access date May 4,
2018)
3.2. Devices and lab consumables
Tables in this chapter show list of all used devices, their model and manufacturer, as well as
lab consumables and their manufacturers.
Table 3. List of used devices with respective model and manufacturer.
Device Model manufacturer
autoclave V – 150
D – 65
Systec GmbH
heat block Blockthermostat BT 100 Kleinfeld Labortechnik
GmbH
light microscope BX40 Olympus Corporation
magnet mixer IKAMAG REO IKA
pH - meter 691 Metrohm AG
Shaker Lab – Shaker LS – X Kühner AG
Page 29
20
spectrophotometer BioPhotometer Eppendorf AG
spectrophotometer
(microplates) SPECTRA MAX 250
Molecular Devices
Corporation
Ribolyser TeSeE PRECESS 24 Bio-Rad Laboratories
Vortex Vortex – Genie 2 Scientific Industries, Inc.
Centrifuges 3-30KS
1-15
Sigma Laborzentrifugen
GmbH
orbital rocking shaker POLYMAX 2040 Heidolph Instruments
GmbH and Co. KG
electrophoresis power
supplier Standard Power Pack P25 Biometra GmbH
analytical balance PM34-K DeltaRange Mettler – Toledo GmbH
agarose gel electrophoresis
system MINI GEL II VWR International GmbH
precision balance AE 260 DeltaRange Mettler – Toledo GmbH
Freezer MDF – U5386S SANYO Electric CO., Ltd
vacuum dryer VT 5042 EK Heraeus
ultrasound homogenizer Sonifier 450 BRANSON
Table 4. List of used lab consumables and their manufacturers.
Item manufacturer
BRANDplates® (96–well microplates), polystyrene: 350 µL Brand GmbH + Co. KG
cuvette, polystyrene, 1.5 mL Brand GmbH + Co. KG
Page 30
21
pipette tips, polypropylene: 1000, 200 and 10 µL Greiner Bio-One AG
microcentrifuge tube, polypropylene: 1,5 mL and 2 mL Greiner Bio-One AG
Erlenmeyer flask with baffles, glass: 300 ml, 500 mL and 1000 mL Schott Duran
Erlenmeyer flask, glass: 300 mL Schott Duran
conical centrifuge tubes, polypropylene: 15 mL and 50 mL Greiner Bio-One AG
3.3. Software
Table 5. below shows list of software used in this thesis.
Table 5. List of used software and respective developer companies.
Name developer company
SoftMax® Pro Molecular Devices Corporation
BiOSCADA Lab BIOENGINEERING
3.4. Growth media
In this thesis, two different media were used: LB medium (Luria – Bertani) to grow a
preculture and make glycerine cultures, and TB medium (Terrific broth) to grow main culture
in flasks as well for the cultivation of bacteria in the bioreactor (Table 5. and 6.). If needed,
kanamycin was added to a final concentration of 50 µg/mL. Media were sterilized in
autoclave in 121 ºC and pressure of 1 bar.
Table 6. Composition of Luria-Bertani medium, pH 7,4.
Component concentration [g/L]
Page 31
22
soya peptone 10
yeast extract 5
sodium chloride 10
*to make agar plates, 15 g/L agar-agar added
Table 7. Composition of Terrific broth medium
Component concentration [g/L]
soya peptone 12,0
yeast extract 24,0
Glycerine 5,0
dipotassium phosphate, K2HPO4* 12,5
potassium dihydrogen phosphate, KH2PO4* 2,4
* autoclaved separately from other components
3.5. Plasmid
In this paper plasmid pAppA1 was used. Figure 2. below shows plasmid map which contains
all important features closely explained in Table 8.
Page 32
23
Figure 2. Map of plasmid pAppA1 made with SnapGene software, GSL Biotech LLC.
Table 8. Explanation of abbreviations on plasmid map showed on Figure 2. above.
Contractions meaning
AppA phytase AppA from E. coli with native
signal sequence for translocation
BlaP promoter for ampicillin resistance
KanR kanamycin resistance
AmpR ampicillin resistance
LacI repressor for binding to lac-operator
ori high copy origin of replication,
ColE1/pMB1/pBR332/pUC
T5 promoter promoter induced by IPTG
Page 33
24
rrnB1 B2 T1 txn terminator structural terminator
M13 forward the binding site for primer
3.6. Bacterial strains
In Table 9. below, there is a list of E. coli strains used for this thesis. Each of them is
transformed with previously explained plasmid pAppA1.
Table 9. List of bacterial strains with respective genotype used in Working Group
Fermentation technology laboratory. Strains are originally from KEIO collection and
deletions written in column “strain” were made in Laboratory for Fermentation Technology.
Strain genotype
E. coli JW0146-2
CGSC 8416
KEIO ∆fhuA766
F-, Δ(araD-araB)567, ΔfhuA766::kan,
ΔlacZ4787(::rrnB-3), λ-, rph-1, Δ(rhaD-rhaB)568,
hsdR514
E. coli JW0940-6
∆ompA ∆ompC
∆fhuA
F-, Δ(araD-araB)567, ΔlacZ4787(::rrnB-3), λ-
, ΔompA772 rph-1, Δ(rhaD-rhaB)568, hsdR514,
∆ompC, ∆fhuA::kan
3.7. Methods
3.6.1. Preculture setting
To grow preculture, 50 µL of glycerine culture was added to 30 mL of LB medium
(composition described in chapter Growth media) and grown in 300 mL flasks without
baffles. Preculture used for bioreactor cultivation is grown in 100 mL of LB medium in 1 L
flasks with baffles. Also, kanamycin is added in final concentration of 50 µg/mL. Preculture
was cultivated on shaker (120 rpm, 50 mm rotation radius) for 16 hours on 37º C.
3.6.2. Strain stock
Page 34
25
To keep bacterial culture over longer time, 800 µL of preculture was added to 200 µL of
87 % glycerine in a 1,5-mL reaction vessel. Then, the sample was mixed on vortex and
frozen in liquid nitrogen. Glycerine culture was kept in -80º C. Short time storage of samples
to be analysed was in -20 ºC. Agar plates were stored in -4 ºC.
3.6.3. Flask cultivation
To set a main culture, in 1000 mL Erlenmeyer flask with four baffles, 100 mL of TB medium
was added. Also, kanamycin was added in final concentration of 50 µg/mL. Volume of
inoculum, i.e. preculture, was calculated to set the initial OD600 value to 0.2. Cultivation was
performed on a shaker (120 rpm, 50 mm rotation radius) at 37 º C until OD600 reached a value
between 0.8 and 0.9. At this point, IPTG as inductor was added to a final concentration of 1
mM. Samples from each of three biological replicates were taken at three time points: 0 hours
(immediately after induction), 1 hours, 2 hours, 3 hours, 4 hours, 5 hours, 6 hours and 24
hours after induction. 500 µL- samples were taken in each time point for measuring OD600
and microscopy control.
To get supernatant samples, 500 µL from each biological replicate was taken and centrifuged
for 10 minutes at 4 º C and 7000 g. Supernatant samples were stored at -20 º C.
Also, 1 mL of cell culture from each biological replicate was taken and stored at -20 º C for
SDS-PAGE.
3.6.4. Bioreactor cultivation
Selected strains were cultivated in a bioreactor. TB medium was used as a nutrient medium
(composition in chapter Materials) to which, after sterilization, antibiotic kanamycin was
added to final concentration of 50 µg/mL. Additionally, inductor IPTG was added to final
concentration of 1 mM when the OD600 was around 1. The software BiOSCADA Lab by
BiOENGINEERING was used to follow the course of fermentation and collect process data.
The single knock-out E. coli strain ΔfhuA and the triple knock-out ΔompAΔompCΔfhuA were
cultivated in bioreactor NLF 3. The total volume of the bioreactor was 7 L while the working
volume was 5 L. Conditions of cultivation are shown in Table 10. below.
Page 35
26
Table 10. Conditions of cultivation in bioreactors.
conditions
bioreactor
NLF 3
pH 7.4
37º C
0.2 bar
5 NL/m
30 %
92-1067 rpm
temperature
overpressure
air flow
pO2
stirrer speed
To keep a constant pH during fermentations, 10 % phosphoric acid and 2 M NaOH are used
and sterilized prior to use as well as antifoam Pluronic.
A stirrer cascade is used to control oxygen concentration in nutrient medium. The lower limit
was 92 rpm (rotations per minute) and the upper one 1067 rpm. pO2 signal is adjusting pO2
level and if the level is lower than the setpoint, the pO2 control-unit gives a signal to the
stirrer control unit to increase the stirrer frequency.
Cell growth was monitored by measuring optical density. Initial cell density was 0.2. Samples
were taken by autosampler. After induction, samples were taken at sixteen time points. First
sample was taken right after the induction and others were taken every hour until sixth hour
after induction. Afterwards, every two hours samples were taken until twenty-fourth hour
after the induction. Samples were taken aseptically using a steam-sterilisable sampling valve
of bioreactor and prepared in a same way as described in chapter Flask cultivation.
Bioreactor specification is attached in Appendix.
3.6.5. Cell lysis
Sonication is used to lyse bacterial cells cultivated in flasks in following way: 1 mL of
defrosted sample was put in an ice-water bath and sonicated in three cycles for 30 seconds
with 30 seconds break in between the cycles. Ultrasound homogeniser settings were: Timer
Page 36
27
on hold, Duty Cycle on constant and Output Control was set on 2. The efficiency of
sonication is monitored by microscopy. If cells were not disrupted, another cycle of
sonication is repeated. Then, samples were centrifuged for 10 minutes on 4 º C and 16000 g.
The precipitate was discarded, and the supernatant was kept on -20 º C.
Cells were lysed mechanically in a Ribolyser TeSeE PRECESS 24 Homogenizer cell
disrupter at speed 6500 rpm, three times for 30 s. 800 μL of defrostet sample were taken. The
efficiency of cell lysis is monitored by microscopy. If cells were not distupted, another cycle
is repeated. Then, samples were centrifuged for 10 minutes on 2 ºC and 14 000 rpm. The
precipitate was discarded, and the supernatant was kept on -20 º C.
3.6.6. Making chemically competent cells
To set a main culture, in 300 mL Erlenmeyer flask, 60 mL of LB medium was added. Also,
kanamycin was added in final concentration of 50 µg/mL. Volume of inoculums, i.e.
preculture, was calculated to set the initial OD600 value to 0.2. Cultivation was performed on
a shaker (120 rpm, 50 mm rotation radius) at 37 º C until OD600 reached a value between 0.8
and 0.9. Then the cultivation stopped, and the cell culture was cooled down on ice for 15 min.
The cell culture was then centrifuged for 10 min at 4 º C and 4000 g. The supernatant was
discarded. The residues of the supernatant were absorbed with paper. The cells were
resuspended in 2 mL of ice cold buffer 1. Afterwards, the cells were centrifuged for 10 min at
4 º C and 4000 g. The supernatant was discarded. The cells were resuspended in 2 mL of ice
cold buffer 2. 100 µL of sample was poured in 1.5 mL vessel and frozen in liquid nitrogen.
The samples were stored in -80 º C.
3.6.7. Transformation of chemically competent cells
100 µL of sample was melted on ice. 1 µL of DNA was added and incubated on ice for 20
min. Then, it was incubated in 42 º C water bath for 30 s and left on ice for 2 min. 500 µL of
LB medium was added and incubated on a shaker for 1 h at 37 º C. Afterwards, samples
where centrifuged for 2 min and 7000 rpm at room temperature. 500 µL of the supernatant
was discarded, and cells were resuspended with pipette in 100 µL of supernatant. The
transformed cell suspension was then pipetted on LB agar plates containing kanamycin.
Page 37
28
3.7.Analytical methods
3.7.1. Optical density measurement
During the cultivation, bacterial growth was monitored by measuring optical density
(OD600). Using photometer (BioPhotometar by Eppendorf AG), absorbance is measured on
wavelength of 600 nm. To stay in linear range (0 – 0.9), samples are diluted with respective
medium in disposable polystyrene cuvette (1.5 mL, Brand GmbH & Co. KG) prior to
measurement. Respective medium was used as a blank.
3.7.2. Microscopy
A few drops of cell suspension were diluted on a slide and observed under BX40 light
microscope by Olympus Corporation with magnification 200x. Sample photos were taken
and saved using IC Capture 2.0 software by Imaging Source Europe GmbH.
3.7.3. Enzyme activity test
Acid phosphatase activity test with pNPP (para-nitrophenylphosphate) is used to quantify the
enzyme activity in both supernatant and total enzyme activity (in cell lysate and supernatant
together). Samples and standards are diluted in fresh 0.25 M glycine–HCl buffer, pH 2.5.
Supernatants are diluted in a range of 1:10 to 1:400 and disrupted cell samples in a range of
1:40 to 1:700.
Pipetting schedule in 96-well plate is shown on Figure 3. below.
Page 38
29
Figure 3. Pipetting schedule for enzyme activity test. Yellow colour stands for samples
(pipetted in three replicates) in which substrate was added, grey colour stands for samples in
which buffer was added instead of substrate, blue colour stands for standards and green
colour for blank (buffer only), both pipetted in two replicates. On the right side, there are
concentrations of standard para-nitrophenol.
50 µL of samples and standards was pipetted in a 96-well plate and incubated in a thermostat
in 50 ºC for exact 15 minutes as well as the substrate solution, 50 mM para-
nitrophenylphosphate (pNPP) dissolved in 0.25 M glycine–HCl buffer. After 15 minutes of
incubation, 50 µL of substrate or buffer is added to samples and standards (see figure above).
The reaction is stopped after 10 minutes by adding 100 µL of stop solution (1 M sodium
carbonate) in each well, causing a change of colour from colourless to yellow. Thereafter,
A405 was measured using software SoftMax® Pro. Absorbance value of blank (green coloured
wells, Figure 4.) is subtracted from measured absorbance values of samples and standards.
This step eliminates influence of buffer. To eliminate autocatalysis influence, absorbance
value measured in grey wells (Figure 4.) is subtracted from absorbance values of respective
samples. Enzyme activity is calculated from standard curve which correlates A405 of standards
and concentration of product pNP. Targeted A405 measuring range was from 0.75-1.1 because
in this narrow range, correlation of product concentration and absorbance is linear. One unit
(U) corresponds to 1 mM of product (pNP) per minute.
3.7.4. Total protein quantitation – modified Bradford’s protein assay
Page 39
30
Prior to the measurement samples were diluted in H2Odd - supernatants were diluted in a
range of 1:5 to 1:40 and cell lysate samples in a range of 1:10 to 1:300. According to the
schedule (Figure 4.), 50 µL of each calibration standard and 50 µL of the sample dilutions
were pipetted into the wells of a 96-well plate. Standards were pipetted in two replicates and
samples in three technical replicates. BSA (bovine serum albumin) was used as standard.
Roti®–Nanoquant solution (5 x) was diluted in 4 volumes of H2Odd and 200 µL of 1 x
solution was pipetted to the standards and the samples on plate. The plate was incubated for 5
minutes at room temperature. Thereafter, OD590 and OD450 were measured using software
SoftMax® Pro. To calculate the protein concentration, the quotient OD590/OD450 of each
sample was compared to the calibration curve (dependence of OD590/OD450 to protein
concentration).
Figure 4. Pipetting schedule for total protein test: orange colour stands for samples (pipetted
in three replicates) and blue colour represents standards (pipetted in two replicates).
3.7.5. SDS – PAGE
Protein samples (prepared in 4 x Laemmli buffer followed by boiling at 96°C for 5 min) were
separated on SDS-PAGE gels. Polyacrylamide gels are composed of a separating and a
stacking gel (Table 10.). First, the separation gel was poured and layered with isopropanol. It
was polymerizing for 30 min at room temperature. Thereafter, isopropanol was removed, the
stacking gel was poured, and a comb was inserted into the layer of stacking gel solution. It
was left for 10 min to polymerize. Afterwards, the comb was removed, the gel was placed in
the electrophoresis apparatus and filled with 1 x electrophoresis buffer. 8 µL of pre-stained
marker and 20 µL of prepared samples were loaded and electrophoresis was performed at the
Page 40
31
current of 20 mA for the stacking gel and of 40 mA for the separation gel. Electrophoresis is
tracked by stain migration and stopped when stain reached the bottom of the plate. Gels were
stained in Comassie brilliant blue solution (Table 10.) and destained in water. Both staining
and destaining was performed on orbital rocking shaker. Composition of each gel and other
used solutions is listed in tables below.
Table 10. Composition of polyacrylamide separating and stacking gel.
separating gel (12,5%) stacking gel (5%)
H2O 1,5 mL 775 µL
1 M Tris – HCl, pH 8,8 2,8 mL -
0,25 M Tris – HCl, pH 6,8 - 1,25 mL
Bis/Acrylamide (0,8%, 30%) 3,0 mL 425 µL
5% SDS 150 µL 50 µL
10% APS 37,5 µL 25 µL
TEMED 2,5 µL 2,5 µL
Page 41
32
Table 11. Composition of buffers and stain solution used for SDS-PAGE.
Solution Component concentration
4 x Laemmli buffer, pH 6,8 bromphenol blue 200 mg/L
dithiothreitol 200 mM
Glycerine 200 g/L
SDS 40 g/L
Tris-HCl 100 mM
stain solution 80% o-phosphoric acid 2 % (v/v)
ammonium sulphate 50 g/L
Coomassie brilliant blue G-250 200 mg/L
ethanol 10 % (v/v)
Tris-glycine electrophoresis buffer,
pH 8,3
Glycine 192 mM
SDS 1 g/L
Tris 25 mM
Page 42
33
4. RESULTS AND DISCUSSION
This chapter contains results obtained during flask cultivations of two different E. coli strains
without and with pAppA plasmid. The aim of the flask cultivation was to see how
transformation of cells with pAppA plasmid influence the cell growth and to see how certain
deletions of the transformed selected strains influence cell growth, protein production and
secretion. Strains were cultivated in larger scale, i. e. in bioreactors. Each of the strains has
also kanamycin resistance, i. e. Δkan mutation.
4.1. FLASK CULTIVATION OF DIFFERENT E. coli STRAINS
4.1.1. Growth behaviour and OD600
Figure 5 shows the OD600 measured at nine different time points – 0h, 1h, 2h, 3h, 4h, 5h, 6h,
7h and 8h of cultivation.
Figure 5. Optical density of bacterial cultures. N = 2 x 2.
At first time point (0 h) initial OD600 of both strains is 0.2. After 8 h of cultivation, strain
E.coli ΔfhuA has reached higher OD600 with a value of 30.05 ± 0.41 than E.coli
ΔompAompCΔfhuA strain with OD600 value of 26.58 ± 0.26 (Figure 5). The highest specific
growth rate for the strain E.coli ΔfhuA is 0.896 h-1, while strain E.coli ΔompAompCΔfhuA has
reached 0.693 h-1 . Generation time of the strain E.coli ΔfhuA is 1.11 h and for the E.coli
0
5
10
15
20
25
30
35
0 1 2 3 4 5 6 7 8
OD
60
0
time (h)
E.coli ΔfhuA E.coli ΔompAompCΔfhuA
Page 43
34
ΔompAompCΔfhuA is 1.13 h. Results and errors shown in this chart are calculated from
measurement of two biological and two technical replicates, N = 2 x 2.
Figure 6. Cell dry weight of bacterial cultures. N = 2 x 3.
In 2, 4, 6, and 8 h of cultivation, cell dry weight of strain E.coli ΔfhuA was higher than a cell
dry weight of a strain E.coli ΔompAompCΔfhuA, which corresponds to the OD
measurements. The highest measured cell dry weight of both strains was eighth hours of
cultivation, with a value of 9.13 ± 0.08 g L-1 for strain E.coli ΔfhuA while for strain E.coli
ΔompAompCΔfhuA it is 6.88 ± 0.15 g L-1 (Figure 6). Results and errors shown in this chart
are calculated from measurement of two biological and three technical replicates, N = 2 x 3.
0
1
2
3
4
5
6
7
8
9
10
2 4 6 8
Cel
l dry
wei
ght
(g L
-1)
time (h)
E.coli Δ fhuA E.coli ΔompAompCΔfhuA
Page 44
35
Figure 7. Correlation of OD600 with cell dry weight for strain E.coli ΔfhuA
For the strain E.coli ΔfhuA the equation y = 3.3081x represents the correlation of cell culture
optical density at 600nm with cell dry weight, with the coefficient of determination of 0.9966
(Figure 7).
Figure 8. Correlation of OD600 with cell dry weight for strain E.coli ΔompAompCΔfhuA
For the strain E.coli ΔompAompCΔfhuA the equation y = 3.5747x represents the correlation
of cell culture optical density at 600nm with cell dry weight, with the coefficient of
determination of 0.9726 (Figure 8).
y = 3.3081xR² = 0.9966
0
5
10
15
20
25
30
35
0 2 4 6 8 10
OD
60
0
Cell dry weight (g L-1)
E.coli Δ fhuA
y = 3.5747xR² = 0.9726
0
5
10
15
20
25
30
35
0 2 4 6 8 10
OD
600
Cell dry weight (g L-1)
E.coli ΔompAompCΔfhuA
Page 45
36
.
Figure 9. Specific growth rate and OD measurements of strain E.coli ΔfhuA
At the first time point (0.5 h) specific growth rate of strain E.coli ΔfhuA is lower (0.96 h-1)
than a specific growth rate (1.51 h-1) at the second time point (1.5 h) because of the
adaptation of cells to the new media. Furthermore, at the second time point (1.5 h) cells have
reached the highest specific growth rate (1.51 h-1) (Figure 9). Mean value of specific growth
rate of strain E.coli ΔfhuA is 0.63 h-1. Generation time of the strain is 1.11 h. Results of
optical density shown in this chart are calculated from measurement of two biological and
two technical replicates, N = 2 x 2.
0
0.2
0.4
0.6
0.8
1
1.2
1.4
1.6
1.8
2
0
5
10
15
20
25
30
35
0 1 2 3 4 5 6 7 8 9
spec
. gro
wth
rat
e (h
-1)
OD
60
0
time (h)
OD
μ
Page 46
37
Figure 10. Specific growth rate (µ) and OD measurements of strain E.coli
ΔompAompCΔfhuA
At the first time point (0.5 h) specific growth rate of strain E.coli ΔompAompCΔfhuA is lower
(0.55 h-1) than a specific growth rate (1.38 h-1) at the second time point (1.5 h) because of the
adaptation of cells to the new media. Furthermore, at the second time point (1.5 h) cells have
reached the highest specific growth rate (1.38 h-1) (Figure 10). Mean value of specific growth
rate of strain E.coli ΔompAompCΔfhuA is 0.61 h-1. Generation time of the strain is 1.13 h.
Results of optical density shown in this chart are calculated from measurement of two
biological and two technical replicates, N = 2 x 2.
0
0.2
0.4
0.6
0.8
1
1.2
1.4
1.6
1.8
2
0
5
10
15
20
25
30
35
0 1 2 3 4 5 6 7 8 9
spec
. gro
wth
rat
e (h
-1)
OD
60
0
time (h)
OD
μ
Page 47
38
4.2. FLASK CULTIVATION OF DIFFERENT E. coli TRANSFORMED STRAINS
WITH pAppA PLASMID
Figure 11. Optical density of bacterial cultures measured right after induction. N = 3 x 3
Figure 11 shows the OD600 measured at eight different time points – 0 h (right after
induction), 1 h (one hour after induction), 2 h (two hours after induction), 3 h ( three hours
after induction), 4 h (four hours after induction), 5 h (five hours after induction), 6 h (six
hours after induction), 24 h (twenty – four hours after induction). For strain E. coli ΔfhuA
pAppA induction (0 h) of protein production with final concentration of 1 mM IPTG was at
OD600 of 1.09 ± 0.03 and for strain E.coli ΔompAompCΔfhuA pAppA it was at OD600 of 1.02
± 0.04. The strains E. coli ΔfhuA pAppA and E.coli ΔompAompCΔfhuA pAppA have reached
similar OD600 both at the point of the induction and first hour after induction. Strain E.coli
ΔompAompCΔfhuA pAppA has reached the highest OD600 of 15.29 ± 0.42 in third hour after
induction after which OD600 has started decreasing, which indicates that cells culture have
gone into death phase. For the strain E. coli ΔfhuA pAppA the highest measured OD600 of
27.21 ± 0.31 was in sixth hour after induction. Twenty – four hours after induction OD600 of a
strain E. coli ΔfhuA pAppA decreases to the value of 25.66 ± 0.60.
Strain E. coli ΔompA ΔompC ΔfhuA pAppA grows faster with a mean value of specific growth
rate of 0.638 h-1 (Figure 13.), while mean value of specific growth rate for strain E.coli ΔfhuA
0
5
10
15
20
25
30
0 h 1 h 2 h 3 h 4 h 5 h 6 h 24 h
OD
60
0
E. coli ΔfhuA pAppA E. coli ΔompA ΔompC ΔfhuA pAppA
Page 48
39
pAppA is 0.635 h-1 (Figure 12). Additionally, E.coli ΔompAompCΔfhuA pAppA strain has a
shorter generation time (1.087 h) than a strain E.coli ΔfhuA (1.091 h).
The highest specific growth rate of a strain E.coli ΔfhuA pAppA is 0.927 h-1 and for the strain
E.coli ΔompAompCΔfhuA pAppA it is 0.916 h-1.
It could be that the triple knock out strain E.coli ΔompAompCΔfhuA pAppA grows faster
because the outer membrane of the strain is more permeabilized so the velocity of substrate
transport into the cell could be higher. On the other hand, it could be that with more
permeabilized outer membrane, the cells are less stable because they are losing necessary
substances out of the periplasm and therefore cells culture skipped stationary phase and went
into death phase immediately.
Influence of induction between cells which are transformed with plasmid and those which are
not, manifests in cell culture optical density measurements and the highest specific growth
rate. Strain E. coli ΔfhuA pAppA has reached lower highest measured OD600 of 27.21 ± 0.31
in sixth hour after induction (Figure 11) than a strain E. coli ΔfhuA after 8h of cultivation
with a highest measured OD600 of 30.05 ± 0.41 (Figure 5). The highest specific growth rate of
E. coli ΔfhuA is 0.896 h-1, while for E. coli ΔfhuA pAppA the highest specific growth rate is
0.927 h-1. However, influence of induction was even greater for the strain E. coli ΔompA
ΔompC ΔfhuA pAppA which has reached highest OD600 of 15.29 ± 0.42 in third hour after
induction, after which cells went into death phase (Figure 11), than a strain E. coli ΔompA
ΔompC ΔfhuA which has reached OD600 of 26.58 ± 0.26 after 8h of cultivation (Figure 5). The
highest specific growth rate of a strain E. coli ΔompA ΔompC ΔfhuA is 0.693 h-1, while for E.
coli ΔompA ΔompC ΔfhuA pAppA the highest specific growth rate is 0.916 h-1.
Page 49
40
Figure 12. Specific growth rate (µ) and OD measurements of strain E.coli ΔfhuA with pAppA
plasmid.
At the first (0.5 h) and the second (1.2 h) time points, specific growth rates of strain E.coli
ΔfhuA pAppA are lower (0.70 h-1 and 1.10 h-1) than a highest specific growth rate (1.33 h-1) at
third time point (1.37 h) because of the adaption of cells to the new media (Figure 12). Mean
value of specific growth rate of strain E.coli ΔfhuA pAppA is 0.64 h-1. Generation time of the
strain is 1.09 h. Results and errors shown in this chart for optical density, are calculated from
measurement of three biological and three technical replicates, N = 3 x 3.
-0.5
0
0.5
1
1.5
2
0
5
10
15
20
25
30
35
0 5 10 15 20 25 30
spec
. gro
wth
rat
e (h
-1)
OD
60
0
time (h)
OD
μ
Page 50
41
Figure 13. Specific growth rate (µ) and OD measurements of strain E. coli ΔompA ΔompC
ΔfhuA with pAppA plasmid.
The highest specific growth rate is 1.77 h-1 at 1.42 h of cultivation. After reaching the highest
measured OD600 of 15.29 ± 0.42 at third hour after induction, cells culture went into death
phase. Therefore, specific growth rate of the last four measurements is below 0 h-1 (Figure
13). Mean value of specific growth rate of strain E. coli ΔompA ΔompC ΔfhuA pAppA is 0.64
h-1. Generation time of a strain is 1.09 h. Results and errors shown in this chart for optical
density, are calculated from measurement of three biological and three technical replicates, N
= 3 x 3.
By using the equation y = 3.3081x which represents the correlation of cells optical density at
600nm with cell dry weight for the strain E.coli ΔfhuA with the coefficient of determination
of 0.9966 (Figure 7), cell dry weight has been calculated for the strain E.coli ΔfhuA pAppA.
Results have been shown in Table 12.
-0.5
0
0.5
1
1.5
2
0
5
10
15
20
25
30
35
0 5 10 15 20 25 30
spec
. gro
wth
rat
e (h
-1)
OD
60
0
time (h)
OD
μ
Page 51
42
Table 12. Cell dry weight of a strain E.coli ΔfhuA pAppA
Time (h) OD600 Cell dry weight (g L-1)
0 0.2 ± 0.00 0.06 ± 0.00
1 0.40 ± 0.01 0.12 ± 0.00
1.7 0.87 ± 0.00 0.26 ± 0.00
1.87 1.09 ± 0.03 0.33 ± 0.00
2.87 3.30 ± 0.04 1.00 ± 0.01
3.87 8.95 ± 0.25 2.70 ± 0.08
4.87 17.11 ± 0.25 5.17 ± 0.07
5.87 21.39 ± 0.69 6.47 ± 0.21
6.87 24.76 ± 0.24 7.48 ± 0.07
7.87 27.21 ± 0.31 8.23 ± 0.09
25.87 25.66 ± 0.60 7.76 ± 0.18
By using the equation y=3.5747x which represents the correlation of cells optical density at
600nm with cell dry weight for the strain E.coli ΔompAompCΔfhuA with the coefficient of
determination of 0.9726 (Figure 8), cell dry weight has been calculated for the strain E.coli
ΔompAompCΔfhuA pAppA. Results have been shown in Table 13.
Page 52
43
Table 13. Cell dry weight of a strain E.coli ΔompAompCΔfhuA pAppA
Time (h) OD600 Cell dry weight (g L-1)
0 0.2 ± 0.00 0.06 ± 0.00
1 0.35 ± 0.00 0.10 ± 0.00
1.62 0.71 ± 0.00 0.20 ± 0.00
1.83 0.88 ± 0.00 0.25 ± 0.00
1.92 1.02 ± 0.04 0.29 ± 0.01
2.92 3.39 ± 0.03 0.95 ± 0.00
3.92 9.54 ± 0.08 2.67 ± 0.02
4.92 15.29 ± 0.42 4.28 ± 0.12
5.92 15 ± 0.23 4.20 ± 0.06
6.92 14.43 ± 0.12 4.04 ± 0.03
7.92 13.84 ± 0.32 3.87 ± 0.09
25.92 6.25 ± 1.06 1.75 ± 0.30
4.2.2. Protein secretion
Protein concentration in the supernatant was determined. Results of modified Bradford test
described in chapter Materials and methods are shown on Figure 14 and Figure 15.
Page 53
44
Figure 14. Optical density and protein concentration in supernatants of E. coli ΔfhuA
pAppA. N = 3 x 3.
Figure 14 shows the OD600 and protein concentration in supernatants measured at five
different time points – 0 h (right after induction), 2 h (two hours after induction), 4 h (four
hours after induction), 6 h (six hours after induction), 24 h (twenty – four hours after
induction). It can be noticed that as well as OD600 increases over the time, protein
concentration in supernatant increases too. The highest protein concentration in supernatant
of 0.39 ± 0.01 g L-1 is reached at twenty – fourth hour after induction and it is more than
1.5x higher than at the point of induction, which is in correlation with the decrease of OD600
thus indicating cell lysis.
0
0.1
0.2
0.3
0.4
0.5
0.6
0
5
10
15
20
25
30
0 2 4 6 24
pro
tein
co
nce
ntr
atio
n (
g L-1
)
OD
60
0
time (h)
OD
supernatants
Page 54
45
Figure 15. Optical density and protein concentration in supernatants of E. coli
ΔompAompCΔfhuA pAppA. N = 3 x 3
Figure 15 shows the OD600 and protein concentration in supernatants measured at five
different time points – 0 h (right after induction), 2 h (two hours after induction), 4 h (four
hours after induction), 6 h (six hours after induction), 24 h (twenty – four hours after
induction). With increase of OD600 protein concentration in supernatants also increases at the
point of induction, second and fourth hour after induction. However, in sixth and twenty –
fourth hour after induction OD600 decreases while protein concentration is supernatants
increases presumably because of cell lysis. Because protein concentration in twenty – fourth
hour is lower (0.35 ± 0.05 g L-1) than in sixth hour (0.53 ± 0.05 g L-1) it could indicate that
there has been made mistake either with sampling or with the method.
0
0.1
0.2
0.3
0.4
0.5
0.6
0
5
10
15
20
25
30
0 2 4 6 24
pro
tein
co
nce
ntr
atio
n (
g L-1
)
OD
60
0
time (h)
OD
supernatants
Page 55
46
Figure 16. Normalized protein concentration comparison in supernatant of two different E.
coli strains.
In Figure 16 bars represent the protein concentration in supernatants normalized to the OD600
of the respective strains. The highest normalized protein concentration in supernatant of both
strains can be noticed at the point of induction. This could be due to the inoculation, since it
is possible that lysis of some cells occurred in preculture because in the starter culture, cells
can be in dissimilar metabolic states (Huber et al., 2009; Rosano and Ceccarelli, 2014). At
the point of induction and second hour after induction, normalized protein concentration of E.
coli ΔfhuA pAppA is higher than E. coli ΔompAompCΔfhuA pAppA. From fourth hour after
induction until the end of cultivation, E. coli ΔompAompCΔfhuA pAppA has higher
normalized protein concentration. Twenty – fourth hour after induction normalized protein
concentration of E. coli ΔompAompCΔfhuA pAppA is 3.65 times higher than E. coli ΔfhuA
pAppA, but it is important to accentuate that OD600 of E. coli ΔompAompCΔfhuA pAppA
started decreasing in fourth hour after induction.
0
0.05
0.1
0.15
0.2
0.25
0 2 4 6 24
pro
tein
co
nce
ntr
atio
n/O
D6
00
time (h)
E. Coli ΔompA ΔompC ΔfhuA pAppA
E. coli ΔfhuA pAppA
Page 56
47
4.2.3. Enzyme activity
Table 14 contains the results of enzyme assay preformed as described in the chapter Materials
and methods. Enzyme activity in supernatants of different strains are shown as total activity
and as activity normalized to OD600.
Table 14. Enzyme assay and OD600 results for tested E. coli strains
Strain time after
induction
(h)
OD600 total enzyme
activity (U mL-1)
in supernatant
normalized enzyme
activity (U mL-1 OD-1)
in supernatant
volumetric
productivity
(U mL-1 h.1)
E. coli
ΔfhuA
pAppA
2 8.95 ± 0.25 0.003 ± 0.000 -
4 21.39 ± 0.69 0.12 ± 0.01 0.006 ± 0.001 0.050
6 27.21 ± 0.31 0.18 ± 0.01 0.007 ± 0.001 0.040
24 25.66 ± 0.6 0.062 ± 0.007
E. Coli
ΔompA
ΔompC
ΔfhuA
pAppA
0 1.02 ± 0.02 0.041 ± 0.006 -
2 9.54 ± 0.25 0.07 ± 0.01 0.007 ± 0.002 0.013
4 15 ± 0.59 0.90 ± 0.11 0.060 ± 0.020 0.213
6 13.84 ± 0.36 0.144 ± 0.040
0.02 ± 0.00
1.58 ± 0.31
0.071
0.04 ± 0.01
1.99 ± 0.24
0.324
Page 57
48
For the strain E. coli ΔfhuA pAppA at the point of the induction and for the strain E. coli
ΔompA ΔompC ΔfhuA pAppA at twenty – fourth hour after induction, enzyme activity in the
supernatant could not have been measured due to the too low product concentration.
All measured samples of strains had too high dilutions, thus eluding the targeted A405 that has
measuring range from 0.75 – 1.1 where correlation of product concentration and absorbance
is linear. Because of that, these results are not reliable. Furthermore, errors are high due to
different cell growth in each of three biological replicates.
As can be seen in the table above, there are differences in the enzyme activity between the
tested strains. The highest total enzyme activity can be noticed for a strain E. coli ΔompA
ΔompC ΔfhuA pAppA at sixth hour after induction (1.99 ± 0.24 U mL.1), while for the strain
E. coli ΔfhuA pAppA it is at twenty - fourth hour after induction (1.58 ± 0.31 U mL.1). These
obtained results match the protein concentration test (Figure 14 and 15). There is influence of
triple knock out (E. coli ΔompA ΔompC ΔfhuA pAppA) compared with the single knock out
(E. coli ΔfhuA pAppA) in the growth and in total protein concentration in supernatants
(Figure 10 and Figure 11) while the total enzyme activity in supernatants of both strains is
quite similar which could mean that there is not more enzyme in the periplasm. Similar total
enzyme activity in supernatants in both strains shows that there is similar amount of enzyme
in supernatants and that knock out system for this specific enzyme might not limit the
secretion. Because the same amount of enzyme is produced, the amount of the enzyme is not
high enough to see the difference in secretion and hence triple knock out does not show better
secretion performance.
Higher volumetric productivity has been obtained for strain E. coli ΔompA ΔompC ΔfhuA
pAppA at sixth hour after induction (0.324 U mL-1 h-1) compared with the strain E. coli ΔfhuA
pAppA at twenty - fourth hour after induction (0.071 U mL-1 h-1). Since the total enzyme
activity in supernatants of both strains is quite similar, none of the strains does not show
better secretion performance hence higher volumetric productivity is due to higher growth
rate of a strain E. coli ΔompA ΔompC ΔfhuA pAppA (Figure 13) compared with growth rate
of a strain E. coli ΔfhuA pAppA (Figure 12). Because of higher growth rate, the enzyme is
secreted earlier and therefore E. coli ΔompA ΔompC ΔfhuA pAppA shows higher volumetric
productivity.
Page 58
49
Figure 17. Normalized activity comparison in supernatants of two different E. coli strains.
N= 3 x 3
The OD600 must also be considered for further assessment of strains. The lower the cell
density, the lower is the number of cells that potentially secrete. The activity must therefore
be normalized to the OD600. This is shown in Table 14 and Figure 17. The bars represent the
activity of phytase normalized to the OD600 of respective strain. Two hours after induction
higher normalized activity of supernatant is noticed for strain E. coli ΔompA ΔompC ΔfhuA
pAppA (0.007 ± 0.002 U mL-1 OD-1) than for strain E. coli ΔfhuA pAppA (0.003 ± 0.000 U
mL-1 OD-1). Fourth and sixth hour after induction, the strain E. coli ΔompA ΔompC ΔfhuA
pAppA has higher normalized activity of supernatant than E. coli ΔfhuA pAppA, but it is
important to accentuate that strain E. coli ΔompA ΔompC ΔfhuA pAppA showed lower cell
growth (Table 14).
0
0.02
0.04
0.06
0.08
0.1
0.12
0.14
0.16
0.18
0.2
2 4 6
acti
vity
/OD
(U
mL-1
OD
-1)
time (h)
E. coli ΔfhuA pAppA
E. Coli ΔompA ΔompC ΔfhuA pAppA
Page 59
50
4.2.3. SDS – PAGE
The following figures 18 – 26 are showing SDS-PAGE gels of supernatant and total cell
culture of the tested strains at five measuring time points: 0 h, 2 h, 4 h, 6 h and 24 h. MW of
phytase is expected to be around 45 kDa.
Figure 18. SDS-PAGE, E. coli ΔfhuA pAppA. 1, 2 and 3 represent the number of flasks. 0h,
2h and 4h stand for time after induction samples were taken at. SN stands for supernatant.
Red box shows phytase band.
Figure 19. SDS-PAGE, E. coli ΔfhuA pAppA. 1, 2 and 3 represent the number of flasks. 6h
and 24h stand for time after induction samples were taken at. SN stands for supernatant. Red
box shows phytase band.
Page 60
51
Figure 20. SDS-PAGE, E. coli ΔfhuA pAppA. 1, 2 and 3 represent the number of flasks. 0h,
2h and 4h stand for time after induction samples were taken at. S stands for cell lysate and
supernatant sample together. Red box shows phytase band.
Figure 21. SDS-PAGE, E. coli ΔfhuA pAppA. 1, 2 and 3 represent the number of flasks. 6h
and 24h stand for time after induction samples were taken at. S stands for cell lysate and
supernatant sample together. Red box shows phytase band.
Page 61
52
Figure 22. SDS-PAGE, E. coli ΔompA ΔompC ΔfhuA pAppA. 1, 2 and 3 represent the
number of flasks. 0h, 2h and 4h stand for time after induction samples were taken at. SN
stands for supernatant. Red box shows phytase band.
Figure 23. SDS-PAGE, E. coli ΔompA ΔompC ΔfhuA pAppA. 1, 2 and 3 represent the
number of flasks. 6h stand for time after induction samples were taken at. SN stands for
supernatant. Red box shows phytase band.
Page 62
53
Figure 24. SDS-PAGE, E. coli ΔompA ΔompC ΔfhuA pAppA. 1, 2 and 3 represent the
number of flasks. 24h stand for time after induction samples were taken at. SN stands for
supernatant. Red box shows phytase band.
Figure 25. SDS-PAGE, E. coli ΔompA ΔompC ΔfhuA pAppA. 1, 2 and 3 represent the
number of flasks. 0h and 2h stand for time after induction samples were taken at. S stands for
cell lysate and supernatant sample together. Red box shows phytase band.
Page 63
54
Figure 26. SDS-PAGE, E. coli ΔompA ΔompC ΔfhuA pAppA. 1, 2 and 3 represent the
number of flasks. 4h, 6h and 24h stand for time after induction samples were taken at. S
stands for cell lysate and supernatant sample together. Red box shows phytase band.
SDS – PAGE is used as a confirmation that there is secreted target protein in the nutrient
medium and it can provide information whether there is a contamination with other proteins.
An increased permeability of the cell wall is supposed to increase the secretion of the target
protein, but it also enhances release of the other periplasmic proteins to the nutrient medium
thus leading to contamination. With the signal sequence being cleaved, protein AppA has
molecular weight of approximately 45 kDa (Dassa et al., 1980).
In supernatant samples of strain E. coli ΔfhuA pAppA phytase band cannot be seen in almost
all samples, except in sample taken at twenty – four hour where it is barely visible (Figure 18
and Figure 19) what matches with the highest obtained result of protein concentration test and
enzyme activity test for the respective sample (Figure 14 and Table 14). The absence of the
phytase band, MW of 45 kDa, in supernatant sample of this strain might be due to too small
total amount of produced protein. Phytase band can be seen in all cell lysate samples of the
reference strain, whereas numerous proteins stained in the gel. In the second and fourth hour
after induction band is more distinct, as well as in sixth and twenty – fourth hour after
induction (Figure 20 and Figure 21). It can be interpreted as this strain is having a good
phytase production ability, but poor protein secretion ability.
Page 64
55
In supernatants of strain E. coli ΔompA ΔompC ΔfhuA pAppA phytase band cannot be seen in
at the point of induction, second and fourth hour after induction (Figure 22), while it can be
clearly seen in sixth (Figure 23) and twenty – fourth hour after induction (Figure 24). Band is
more distinct in supernatant sample taken at sixth rather than twenty – fourth hour, what
supports result of protein concentration test (Figure 15) and enzyme assay (Table 14) since
enzyme activity of supernatant sample taken at twenty – fourth hour could not be measured
due to the too low product concentration. In cell lysate, phytase band is not visibly at the
point of induction (Figure 25) but visibility of the phytase band on SDS-PAGE increases over
the time (Figure 26). However, it can be noticed that phytase band is less visible at twenty –
fourth hour after induction due to the decrease of optical density.
Page 65
56
4.3. BIOREACTOR CULTIVATION
4.3.1. Bioreactor cultivation of Escherichia coli ΔfhuA pAppA
E. coli ΔfhuA pAppA was cultivated in 5 L bioreactor in TB medium under conditions
described before in chapter Batch cultivation. Samples for measuring enzyme activity and
determining protein concentration as well as for SDS-PAGE were taken 0, 2, 4, 6, 8, 12, 16,
20 and 24 hours after induction. Enzyme activity and protein concentration were determined
in supernatant and in cell lysate.
Figure 27. Growth curve of E. coli ΔfhuA pAppA. Moment of induction was at 1.55 h. N = 1
x 3.
0
5
10
15
20
25
30
35
40
45
OD
60
0
time (h)
Page 66
57
Figure 28. Parameters of cultivation of E. coli ΔfhuA pAppA.
Figure 29. Specific growth rate (µ) and OD measurements of strain E.coli ΔfhuA pAppA
By using the equation y = 3.3081x which represents the correlation of cells optical density at
600nm with cell dry weight for the strain E.coli ΔfhuA with the coefficient of determination
of 0.9966 (Figure 7), cell dry weight has been calculated for the strain E.coli ΔfhuA pAppA.
Results have been shown in Table 15.
Table 15. Cell dry weight of a strain E.coli ΔfhuA pAppA
0
20
40
60
80
100
120
140
160
180
200
0
200
400
600
800
1000
1200
0 5 10 15 20 25 30
pO
2 (
%)
agit
ato
r (r
pm
)
time (h)
agitator (rpm) pO2
-0.2
0
0.2
0.4
0.6
0.8
1
1.2
1.4
1.6
1.8
0
5
10
15
20
25
30
35
40
45
0 5 10 15 20 25 30
Spec
. gro
wth
rat
e (h
-1)
OD
60
0
time (h)
OD
μ
Page 67
58
Time (h) OD600 Cell dry weight (g L.1)
0.07 0.48 ± 0.01 0.15 ± 0.00
1.07 0.66 ± 0.00 0.20 ± 0.00
1.35 0.88 ± 0.01 0.27 ± 0.00
1.55 1.06 ± 0.09 0.32 ± 0.03
2.55 2.63 ± 0.10 0.79 ± 0.03
3.55 6.21 ± 0.03 1.88 ± 0.01
4.55 13.53 ± 0.30 4.09 ± 0.09
5.55 21.97 ± 0.40 6.64 ± 0.12
6.55 24 ± 0.87 7.25 ± 0.26
7.55 28.77 ± 0.59 8.70 ± 0.18
9.55 34 ± 0.79 10.28 ± 0.24
11.55 37.23 ± 0.80 11.26 ± 0.24
13.55 38.63 ± 0.35 11.68 ± 0.11
15.55 41.03 ± 0.96 12.40 ± 0.29
17.55 41.27 ± 0.51 12.47 ± 0.16
19.55 39.9 ± 0.92 12.06 ± 0.28
21.55 39.8 ± 0.7 12.03 ± 0.21
23.55 39.4 ± 0.2 11.91 ± 0.06
25.55 39.8 ± 0.17 12.03 ± 0.05
Figure 27 shows bacterial growth curve of strain E. coli ΔfhuA pAppA monitored by
measuring OD600 value. OD600 was measured for 24 hours of cultivation after induction when
IPTG was added (OD600 = 1.06 ± 0.09 at 1.55 h). After reaching maximal OD600 value of
41.27 ± 0.51 in sixteenth hour after induction, cells enter stationary phase, remaining OD600
Page 68
59
value about 40. Percentage of pO2 and agitator speed during the cultivation are shown in
Figure 23.
Dissolved oxygen level rapidly drops in first hours of cultivation (Figure 28) and prior to
induction reaches 30 %. Dissolved oxygen level was kept at 30 % of air saturation by
controlling the cascading impeller speed. However, percentage of pO2 can be followed
through two peaks around 9 and 15 h where cells have reached the maximal OD600 value.
Stirrer speed was up to 950 rpm while cells were in exponential phase. Other cultivation
parameters; pH, temperature and overpressure, were kept constant and therefore they are not
shown in the charts. Mean value of specific growth rate for strain E. coli ΔfhuA pAppA was
0.32 h-1, while generation time was 2.18 h (Figure 29). Maximum specific growth rate was
0.715 h-1. Cell dry weight was up to 12.47 ± 0.16 g L-1 at sixteenth hour after induction.
4.3.2. Bioreactor cultivation of Escherichia coli ΔompAompCΔfhuA pAppA
E. coli ΔompAompCΔfhuA pAppA was cultivated in 5 L bioreactor in TB medium under
conditions described before in chapter Batch cultivation. Samples for measuring enzyme
activity and determining protein concentration as well as for SDS-page were taken 0, 2, 4, 6,
8, 12, 16, 20 and 24 hours after induction. Enzyme activity and protein concentration were
determined in supernatant and in cell lysate.
0
5
10
15
20
25
30
35
40
45
OD
60
0
time (h)
Page 69
60
Figure 30. Growth curve of E. coli ΔompAompCΔfhuA pAppA. Moment of induction was at
2.07 h. N = 1 x 3.
Figure 31. Parameters of cultivation of E. coli ΔompAompCΔfhuA pAppA
0
20
40
60
80
100
120
140
160
180
200
0
200
400
600
800
1000
1200
0 5 10 15 20 25 30
pO
2(%
)
agit
ato
r (r
pm
)
time (h)
agitator pO2
-0.2
0
0.2
0.4
0.6
0.8
1
1.2
1.4
1.6
1.8
0
5
10
15
20
25
30
35
40
45
0 5 10 15 20 25 30
Spec
. gro
wth
rat
e (h
-1)
OD
60
0
time (h)
OD
μ
Page 70
61
Figure 32. Specific growth rate (µ) and OD measurements of strain E. coli
ΔompAompCΔfhuA pAppA
By using the equation y=3.5747x which represents the correlation of cells optical density at
600nm with cell dry weight for the strain E.coli ΔompAompCΔfhuA with the coefficient of
determination of 0.9726 (Figure 8), cell dry weight has been calculated for the strain E.coli
ΔompAompCΔfhuA pAppA. Results have been shown in Table 16.
Table 16. Cell dry weight of a strain E.coli ΔompAompCΔfhuA pAppA
Time (h) OD600 Cell dry weight (g L-1)
0 0.23 ± 0.01 0.06 ± 0.00
1 0.37 ± 0.01 0.10 ± 0.00
1.75 0.77 ±0.01 0.21 ± 0.00
2.07 1.26 ± 0.11 0.35 ± 0.03
3.07 3.97 ± 0.10 1.11 ± 0.03
4.07 9.03 ± 0.12 2.53 ± 0.03
5.07 23.77 ± 0.2 6.65 ± 0.06
6.07 28.67 ± 0.21 8.02 ± 0.06
7.07 35.97 ± 0.47 10.06 ± 0.13
8.07 36.47 ± 0.81 10.20 ± 0.23
10.07 35.97 ± 0.91 10.06 ± 0.26
12.07 34.47 ± 0.40 9.64 ± 0.11
14.07 33.27 ± 0.06 9.31 ± 0.02
16.07 31.8 ± 0.7 8.90 ± 0.20
18.07 29.7 ± 0.46 8.31 ± 0.13
20.07 28.97 ± 0.06 8.10 ± 0.02
22.07 28.37 ± 0.93 7.94 ± 0.26
24.07 28.47 ± 0.32 7.96 ± 0.09
Page 71
62
26.07 28.17 ± 0.12 7.88 ± 0.03
Figure 30 shows bacterial growth curve of strain E. coli ΔompAompCΔfhuA pAppA
monitored by measuring OD600 value. OD600 was measured for 24 hours of cultivation after
induction when IPTG was added (OD600 = 1.26 ± 0.11 at 2.07 h). After reaching maximal
OD600 value of 36.47 ± 0.81 in sixth hour after induction, cells enter death phase until 20.07 h
of cultivation after which density of the cells remains constant until the end of cultivation
(OD600 value about 28.5). Figure 31 shows percentage of pO2 and agitator speed during the
cultivation of E. coli ΔompAompCΔfhuA pAppA. Dissolved oxygen level was kept at 30 % of
air saturation by controlling the cascading impeller speed. Dissolved oxygen level rapidly
drops in first hours of cultivation and prior to induction reaches 30 %.
It can be noticed that the highest agitator speed (1067 rpm) was right before cells have
reached maximal density. It may be that due to shear stress, on which cells are sensitive due
to the weakened cell wall, cells skipped stationary phase and entered death phase
immediately.
Mean value of specific growth rate of strain E. coli ΔompAompCΔfhuA pAppA was 0.35 h-1,
while generation time was 2 h. Cell dry weight was up to 10.20 ± 0.23 g L-1 in sixth hour
after induction. Maximal specific growth rate was 0.895 h-1.
4.3.3. Protein concentration assay
Time points refer to the time after induction point. Results of the protein concentration in cell
lysate are now shown.
Page 72
63
Figure 33. Optical density and protein concentration in supernatant of E.coli ΔfhuA pAppA.
Figure 33 shows protein concentration measured in supernatants and OD600 of strain E.coli
ΔfhuA pAppA. Protein concentration in supernatant increases over time what matches the
OD600. However, opposite of expectations, in eighth and twelfth hour after induction, protein
concentration is quite similar (0.41 ± 0.02 g L-1 and 0.40 ± 0.02 g L-1), as well as in twentieth
and twenty- fourth hour (0.71 ± 0.03 g L-1 and 0.71 ± 0.01 g L-1). Protein concentration in
supernatant of strain E.coli ΔfhuA pAppA reaches maximal value of 0.71 ± 0.01 g L-1 twenty
four hours after induction and it is almost five times more than at the point of induction.
0
0.1
0.2
0.3
0.4
0.5
0.6
0.7
0.8
0.9
0
5
10
15
20
25
30
35
40
45
0 2 4 6 8 12 16 20 24
pro
tein
co
nce
ntr
atio
n (
g L-1
)
OD
60
0
time (h)
OD
protein concentration
Page 73
64
Figure 34. Optical density and protein concentration in supernatant of E. coli
ΔompAompCΔfhuA pAppA
Figure 34 shows protein concentration measured in supernatants and OD600 of strain E. coli
ΔompAompCΔfhuA pAppA. Opposite of expectations, from eight hour until twenty – fourth
hour after induction optical density of culture decreases while protein concentration in
supernatants increases. Since the protein concentration in sixteenth hour is lower (0.48 ± 0.03
g L-1) than in twelfth hour (0.53 ± 0.08 g L-1) while in twentieth and twenty – fourth hour
after induction it is still increasing, it could be that there were some problems either with
pipetting or sampling. Protein concentration in fourth hour after induction is higher (0.39 ±
0.01 g L-1) than in sixth hour (0.29 ± 0.02 g L-1) while OD600 is still increasing, thus
indicating possible problems with pipetting or sampling. Intriguingly, results obtained in E.
coli ΔompAompCΔfhuA pAppA cultivation in flasks (Figure 15) show as well decrease of
optical desnity while protein concentration is increasing and this could be due to the cell
lysis.
0
0.1
0.2
0.3
0.4
0.5
0.6
0.7
0.8
0.9
0
5
10
15
20
25
30
35
40
45
0 2 4 6 8 12 16 20 24
pro
tein
co
nce
trat
ion
(g
L-1)
OD
60
0
time (h)
OD
protein concentration
Page 74
65
Figure 35. Normalized protein concentration comparison in supernatant of two different E.
coli strains
The bars represent the protein concentration in supernatants normalized to the OD600 of the
respective strains. The highest normalized protein concentration in supernatant of both strains
can be noticed at the point of induction. This could be due to the inoculation, since it is
possible that lysis of some cells occurred in preculture. At the point of induction, normalized
protein concentration of strain E.coli ΔfhuA pAppA is two times higher than the normalized
protein concentration of strain E. coli ΔompAompCΔfhuA pAppA. Normalized protein
concentration of E.coli ΔfhuA pAppA is higher than E. coli ΔompAompCΔfhuA pAppA also in
second, fourth, and sixth hour after induction. Eighth hour after induction, the situation is
changing in for the benefit of E. coli ΔompAompCΔfhuA pAppA compared to normalized
protein concentration of E.coli ΔfhuA pAppA, but it is important to accentuate that optical
density of E. coli ΔompAompCΔfhuA pAppA started decreasing in eighth hour of induction.
4.3.4. Enzyme assay results
Table 17 shows enzyme assay results and OD600 results for strains cultivated in bioreactor.
Table 18 shows volumetric productivity of strains cultivated in bioreactor.
Table 17. Enzyme assay and OD600 results obtained during bioreactor cultivation
0
0.02
0.04
0.06
0.08
0.1
0.12
0.14
0.16
0 2 4 6 8 12 16 20 24
pro
tein
co
nce
trat
ioti
on
/OD
60
0
time (h)
E. coli ΔompA ΔompC ΔfhuA pAppA
E. coli ΔfhuA pAppA
Page 75
66
Strain Time
after
induction
(h)
OD600 Total enzyme activity (U mL-1) Normalized enzyme
activity (U mL-1)
supernatant cell lysate supernatant cell lysate
E. coli
ΔfhuA
pAppA
0 1.06 ± 0.09 - - - -
2 6.21 ± 0.03 - - 0.143
4 21.97 ±
0.40 2.92 ± 0.06 0.055 0.133
6 28.77 ±
0.59 3.01 ± 0.08 3.64 ±0.08 0.104 0.127
8 34.00 ±
0.79 2.34 ± 0.07 6.48 ± 0.29 0.069 0.190
12 38.63 ±
0.35 4.21 ± 0.05 8.01 ± 0.26 0.109 0.207
16 41.27 ±
0.51 8.97 ± 0.32 8.90 ± 0.68 0.217 0.216
20 39.80 ±
0.70 9.40 ± 0.63 0.301 0.236
24 39.80 ±
0.17 7.74 ± 0.18 0.194 0.257
E. Coli
ΔompA
ΔompC
ΔfhuA
pAppA
0 1.26 ± 0.11 - - - -
2 9.03 ± 0.12 0.024 0.059
4 28.67 ±
0.21 1.57 ± 0.30 3.84 ± 0.20 0.055 0.134
6 36.47 ±
0.81 2.06 ± 0.18 4.23 ± 0.25 0.057 0.116
8 35.97 ±
0.91 1.82 ± 0.08 6.19 ± 0.31 0.051 0.172
12 33.27 ±
2.39 ± 0.08 7.47 ± 0.34 0.072 0.224
0.89 ± 0.08
1.22 ± 0.02
11.98 ± 0.40
10.24 ± 0.92
0.22 ± 0.01
0.53 ± 0.03
Page 76
67
0.06
16 29.70 ±
0.46 2.39 ± 0.05 6.26 ± 0.15 0.080 0.211
20 28.37 ±
0.93 4.63 ± 0.23 0.163 0.270
24 28.17 ±
0.12 5.58 ± 0.33 0.199 0.198
Table 18. Volumetric productivity of strains cultivated in bioreactor
Strain Time after induction
(h)
Volumetric productivity (U mL-1 h.1)
supernatant cell lysate
E. coli ΔfhuA pAppA 4 -
6 0.687
8 0.282
12 0.374 0.712
16 0.646 0.572
20 0.473
24 0.326 0.425
E. Coli ΔompA ΔompC
ΔfhuA pAppA
4
6 0.461 0.925
8 0.267 0.942
12 0.217 0.693
16 0.155 0.409
20 0.245 0.395
7.65 ± 0.16
5.61 ± 0.27
1.015
0.895
0.931
0.673
0.676
1.654
Page 77
68
24 0.245 0.229
Figure 36. Normalized phytase activity in supernatants of E. coli strains ΔfhuA pAppA and
ΔompA ΔompC ΔfhuA pAppA cultivated in bioreactor. Time points are for time after
induction.
For the strain E. coli ΔfhuA pAppA enzyme activity in the supernatants at the point of
induction and second hour after induction as well as in cell lysate at the point of induction
could not have been measured due to the too low product concentration. For the strain E. coli
ΔompA ΔompC ΔfhuA pAppA enzyme activity in the supernatant at the point of induction as
well as in cell lysate at the point of induction could not have been measured as well, due to
the too low product concentration. It is hard to compare results of enzyme assay during flask
cultivation to those obtained during bioreactor cultivation because samples from flask
cultivation had too high dilutions, thus eluding the targeted A405 that has measuring range
from 0.75 – 1.1 where correlation of product concentration and absorbance is linear.
High dilutions of samples affect error values. Although each enzyme activity test is
performed the same way, another problem is that the substrate solution is very sensitive to
temperature leading to higher readings of absorbance if substrate is not well tempered.
Because all of that, there are multiple criteria when it comes to decision which strain shows
the best secretion ability.
0
0.05
0.1
0.15
0.2
0.25
0.3
0.35
4 6 8 12 16 20 24
acti
vity
/OD
time (h)
E. coli ΔfhuA pAppA
E. Coli ΔompA ΔompC ΔfhuA pAppA
Page 78
69
In supernatant of strain E. coli ΔfhuA pAppA, phytase activity increases in sixth hour after
induction, after which it decreases in eighth hour after induction. Then, activity increases
again and reaches maximal value of 11.98 ± 0.4 U mL-1 twenty hours after induction. High
enzyme activity in supernatant indicates high protein secretion. Twenty – four hours after
induction, phytase activity in supernatant decreases again.
Phytase activity in cell lysate increases over time and reaches maximal value of 10.24 ± 0.92
U mL-1 twenty – four hours after induction and it is 11.5x higher than in second hour after
induction (Table 17). It is unlikely that maximal value of phytase activity in supernatant of
the strain E. coli ΔfhuA pAppA is higher than in cell lysate. It could be that with disruption of
cells, samples got overheated causing denaturation of some AppA, thus AppA lost part of its
total activity.
For the strain E. coli ΔompA ΔompC ΔfhuA pAppA phytase activity in supernatant reaches
maximum value of 5.61 ± 0.27 U mL-1 twenty - four hours after induction. It reaches value
more than five times higher than in second hour after induction, suggesting that prolonged
time of cultivation increases excreted protein concentration in nutrient medium. It also fits the
results of protein concentration in supernatants (Figure 34). Phytase activity in cell lysate had
the highest value of 7.65 ± 0.16 U mL-1 twenty hours after induction. Compared to the
activity in supernatant of strain E. coli ΔompA ΔompC ΔfhuA pAppA, total activity in
supernatant of strain E. coli ΔfhuA pAppA is 3.75 x higher in the sixteenth hour after
induction.
If OD600 is also included as an important factor of characterization of protein secretion,
normalized activity results show that E. coli ΔfhuA pAppA remains better secreting (Figure
36) and producing strain (Table 17) because E. coli ΔfhuA pAppA reaches up to 2.71 x higher
normalized activity in supernatant and 2.42 x higher normalized activity in cell lysate than
the E. coli ΔompA ΔompC ΔfhuA pAppA.
Volumetric productivity of strain E. coli ΔfhuA pAppA has two maximum values both in
supernatant and in cell lysate, while on the other hand strain E. coli ΔompA ΔompC ΔfhuA
pApp has one maximum value both in supernatant and in cell lysate (Table 18). Second
maximum value of volumetric productivity of strain E. coli ΔfhuA pAppA is a consequence of
better cultivation conditions in bioreactor, hence the growth of a strain is more stable even
with the smaller growth rate compared to the flask cultivation of strain. The lower robustness
Page 79
70
of strain E. coli ΔompA ΔompC ΔfhuA pAppA compared to strain E. coli ΔfhuA pAppA, has a
great impact on cell cultivation in bioreactor, which is why cells skipped stationary phase and
entered death phase immediately. Since the robustness of cell influences growth, growth rate
and OD600, there is also influence in the volumetric productivity.
Page 80
71
4.3.5. SDS – PAGE
Figure 37. SDS-PAGE, E.coli ΔfhuA pAppA. 0h, 2h, 4h, 6h, 8h, 12h, 16h, 20h and 24h stand
for time after induction samples were taken at. SN stands for supernatant. Red box shows
phytase band.
Figure 38. SDS-PAGE, E.coli ΔfhuA pAppA. 0h, 2h, 4h, 6h, 8h, 12h, 16h, 20h and 24h stand
for time after induction samples were taken at. C stands for cell lysate. Red box shows
phytase band.
Page 81
72
Figure 39. SDS-PAGE, E. coli ΔompAompCΔfhuA pAppA. 0h, 2h, 4h, 6h, 8h, 12h, 16h, 20h
and 24h stand for time after induction samples were taken at. SN stands for supernatant. Red
box shows phytase band.
Figure 40. SDS-PAGE, E. coli ΔompAompCΔfhuA pAppA. 0h, 2h, 4h, 6h, 8h, 12h, 16h, 20h
and 24h stand for time after induction samples were taken at. C stands for cell lysate. Red
box shows phytase band.
In supernatant samples of strain E.coli ΔfhuA pAppA phytase band on SDS-PAGE gel is not
visible at the point of the induction, at second hour after induction it is barely visible and in
fourth, sixth and eighth hour it is more visible (Figure 37). For the following measuring
points it is not visible at all, which does not support results of protein concentration test nor
Page 82
73
activity test. Furthermore, it does not match with the SDS-PAGE of the respective strain
cultivated in flasks. This result can be a consequence of error that occurred during sample
preparation. Because all of that, the experiment should be repeated.
For cell lysate of the reference strain, phytase band could not be seen at the point of the
induction, but visibility of phytase band increases over the time in following measuring
points (Figure 38) what matches the enzyme assay results where activity of cell lysate is
increasing (Table 17).
For samples of protein in supernatants of strain E. coli ΔompAompCΔfhuA pAppA, phytase
band is not visible at the point of induction, while in following measuring points phytase
bands become stronger over the time of cultivation (Figure 39) what supports protein
concentration test (Figure 34) and activity assay (Table 17) . For the cell lysate samples of the
reference strain, there is no phytase band both at the point of induction and second hour, and
in following measuring points phytase bands become stronger over the time of cultivation
(Figure 40) what matches with the increasing enzyme activity (Table 17).
Page 83
74
5. CONCLUSION AND OUTLOOK
To investigate whether the increased permeability is sufficient to allow secretion of
recombinant proteins to an extracellular environment, one single and one triple knock-out
mutants of Escherichia coli were characterized. Single knock-out ΔfhuA pAppA and triple
knock-out ΔompAompCΔfhuA pAppA were constructed in Laboratory of Fermentation
technology and hoped to have increased secretion ability. Firstly, ΔfhuA and
ΔompAompCΔfhuA were cultivated in flasks to have an overview of growth features of both
strains. Secondly, ΔfhuA and ΔompAompCΔfhuA were transformed with plasmid pAppA and
phytase AppA was used as a reporter protein. Flask cultivation was carried out to have an
overview of features, in terms of growth, protein secretion and enzyme activity. Thirdly, both
strains were cultivated in bioreactors over a period of twenty-four hours after induction, again
with the aim to characterize them regarding growth, protein secretion and enzyme activity.
1. During the flask cultivation strains ΔfhuA and ΔompAompCΔfhuA were cultivated.
Strain ΔfhuA has reached higher maximal measured optical density (30.05±0.41) than
ΔompAompCΔfhuA (26.58±0.26). Both strains were transformed with plasmid pAppA
and cultivated in flasks where once again strain ΔfhuA pAppA has reached higher
maximal measured optical density (27.21±0.31) than ΔompAompCΔfhuA pAppA
(15.29±0.42). Extracellular protein concentration was higher for ΔompAompCΔfhuA
pAppA (0.53±0.05 g L-1) than ΔfhuA pAppA (0.39±0.01 g L-1) but it is important to
accentuate that high protein concentration in supernatant indicate a good secretion
ability of different periplasmic proteins, but also, it can mean cell lysis. The enzyme
activity assay results are not reliable as all measured samples of strains had too high
dilutions thus eluding a narrow range of linear dependency of absorbance and
concentration. Therefore, the enzyme activity assay should be repeated for flask
cultivation.
2. Both strains, ΔfhuA pAppA and ΔompAompCΔfhuA pAppA, were cultivated in
bioreactors. Further assessment showed that strain ΔompAompCΔfhuA pAppA is more
sensitive to shear stress in bioreactor than ΔfhuA pAppA, presumably due to lower
robustness of the cells caused by weakened cell wall structure since genes encoding
for outer membrane proteins have been deleted. ΔompAompCΔfhuA pAppA has
remained a strain with higher obtained extracellular protein concentration (0.84±0.30
Page 84
75
g L-1) than ΔfhuA pAppA (0.71 ± 0.01 g L-1). The enzyme activity assay has shown
that ΔfhuA pAppA is a better secreting and producing strain.
Page 85
76
6. BIBLIOGRAPHY
Baba, T., Ara, T., Hasegawa, M., Takai, Y., Okumura, Y., Baba, M., Datsenko, K.A., Tomita,
M., Wanner, B.L. and Mori, H. (2006) Construction of Escherichia coli K-12 in-frame,
single-gene knockout mutants: the Keio collection. Mol Syst Biol, 2, 2006.0008.
doi:10.1038/msb4100050
Baslé, A., Rummel, G., Storici, P., Rosenbusch, J.P. and Schirmer, T. (2006) Crystal
structure of osmoporin OmpC from E. coli at 2.0 A. J Mol Biol, 362 (5), 933–942.
Batchelor, E., Walthers, D., Kenney, L. J. and Goulian, M. (2005) The Escherichia coli
CpxA-CpxR envelope stress response system regulates expression of the porins OmpF and
OmpC. J Bacteriol, 187 (16), 5723-5731.
Chatzi, K. E., Frantzeskos Sardis, M., Economou, A. and Karamanou, S. (2014) SecA-
mediated targeting and translocation of secretory proteins. Biochim. Biophys. Acta, 1843 (8),
1466-1474.
Chen, Z.-Y., Cao, J., Xie, L., Li, X.-F., Yu, Z.-H. and Tong, W.-Y. (2014) Construction of
leaky strains and extracellular production of exogenous proteins in recombinant Escherichia
coli. Microb Biotechnol, 7 (4), 360–370.
Choi, J.H. and Lee, S.Y. (2004) Secretory and extracellular production of recombinant
proteins using Escherichia coli. Appl Microbiol Biot, 64 (5), 625–635.
Dassa, E., Tetu, C. and Boquet, P. L. (1980) Identification of the acid phosphatase (optimum
pH 2.5) of Escherichia coli. FEBS Lett, 113, 68-73.
Dassler, T., Guenter, W. and Schmid, G. (2008) Process for the fermentative production of
proteins. No. US20080254511 A1.
Demain, A. L., and Vaishnav, P. (2009) Production of recombinant proteins by microbes and
higher organisms. Biotechnol Adv, 27 (3), 297-306.
Faraldo-Gómez, J. D., Smith, G. R. and Sansom, M. S. P. (2003) Molecular dynamics
simulations of the bacterial outer membrane protein FhuA: A comparative study of the
ferrichrome-free and bound states. Biophys. J., 85 (3), 1406-1420.
Page 86
77
Ferguson, A. D., Hofmann, E., Coulton, J. W., Diederichs, K. and Welte, W. (1998)
Siderophore-mediated iron transport: crystal structure of FhuA with bound
lipopolysaccharide. Science, 282 (5397), 2215-2220.
Greiner, R., Konietzny, U. and Jany, K.D. (1993) Purification and characterization of two
phytases from Escherichia coli. Arch Biochem Biophys, 303 (1), 107–113.
Haefner, S., Knietsch, A., Scholten, E., Braun, J., Lohscheidt, M., Zelder, O. (2005)
Biotechnological production and applications of phytases, Appl Microbiol Biot, 68 (5), 588-
597.
Ishida, H., Garcia-Herrero, A. and Vogel, H. J. (2014) The periplasmic domain of
Escherichia coli outer membrane protein A can undergo a localized temperature dependent
structural transition. Biochim. Biophys. Acta, 1838(12), 3014-3024.
Kleist, S., Miksch, G., Hitzmann, B., Arndt, M., Friehs, K. and Flaschel, E. (2003)
Optimization of the extracellular production of a bacterial phytase with Escherichia coli by
using different fed-batch fermentation strategies. Appl Microbiol Biot, 61 (2-6), 456–462.
Knoll, A., Bartsch, S., Husemann, B., Engel, P., Schroer, K., Ribeiro, B., Stöckmann, C.,
Seletzky, J. and Büchs, J.(2007) High cell density cultivation of recombinant yeasts and
bacteria under non-pressurized and pressurized conditions in stirred tank bioreactors. J.
Biotechnol, 132 (2), 167-179.
Korz, D. J., Rinas, U., Hellmuth, K., Sanders, E. A. and Deckwer, W. –D. (1995) Simple fed-
batch technique for high cell density cultivation of Escherichia coli. J. Biotechnol, 39 (1), 59-
65.
Lee, S.Y. (1996) High cell-density culture of Escherichia coli. Trends Biotechnol, 14 (3), 98–
105.
Locher, K. P., Rees, B., Koebnik, R., Mitschler, A., Moulinier, L., Rosenbusch, J. P. and
Moras, D. (1998) Transmembrane signaling across the ligand-gated FhuA receptor: crystal
structures of free and ferrichrome-bound states reveal allosteric changes. Cell, 95 (6), 771-
778.
Masi, M. and Pagès, JM. (2013) Structure, function and regulation of outer membrane
proteins involved in drug transport in Enterobactericeae: the OmpF/C – TolC Case. Open
Microbiol J., 7, 22-33.
Page 87
78
McMorran, L. M., Brockwell, D. J. and Radford, S. E. (2014) Mechanistic studies of the
biogenesis and folding of outer membrane proteins in vitro and in vivo: What have we
learned to date? Arch Biochem Biophys, 564, 265-280.
Mergulhão, F.J.M., Summers, D.K. and Monteiro, G.A. (2005) Recombinant protein
secretion in Escherichia coli. Biotechnol Adv, 23 (3), 177–202.
Miksch, G., Kleist, S., Friehs, K. and Flaschel, E. (2002) Overexpression of the phytase from
Escherichia coli and its extracellular production in bioreactors. Appl Microbiol Biot, 59 (6),
685–694.
Misra, R. and Benson, S.A. (1988) Isolation and characterization of OmpC porin mutants
with altered pore properties. J Bacteriol, 170 (2), 528–533.
Mizuno, T., Chou, MY. and Inouye, M. (1983) A comparative study on the genes for three
porins of the Escherichia coli outer membrane. J. Biol. Chem., 258 (11), 6932-6940.
Natale, P., Brüser, T. and Driessen, A.J.M. (2008) Sec- and Tat-mediated protein secretion
across the bacterial cytoplasmic membrane--distinct translocases and mechanisms. Biochim
Biophys Acta, 1778 (9), 1735–1756.
Ortiz-Suarez, M., Samsudin, F., Piggot, T. J., Bond, P. J. and Khalid, S. (2016) Full-length
OmpA: structure, function, and membrane interactions predicted by molecular dynamics
simulations. Biophys. J. 111(8), 1692-1702.
Pandey, A., Szakacs, G., Soccol, C. R., Rodriguez-Leon, J. A. and Soccol, V. T. (2001)
Production, purification and properties of microbial phytases, Bioresour. Technol, 77 (3),
203-214.
Patel, R., Smith, S. M. and Robinson, C. (2014) Protein transport by the bacterial Tat
pathway. Biochim. Biophys. Acta, 1843 (8), 1620-1628.
Riesenberg, D. (1991) High-cell-density cultivation of Escherichia coli. Curr Opin Biotech, 2
(3), 380-384.
Robinson, C., Matos, C. F. R. O., Beck, D., Ren, C., Lawrence, J., Vasisht, N. and Mendel, S.
(2011) Transport and proofreading of proteins by the twin-arginine translocation (Tat) system
in bacteria. Biochim. Biophys. Acta, 1808 (3), 876-884.
Page 88
79
Rosano, G.L. and Ceccarelli, E.A. (2014) Recombinant protein expression in Escherichia
coli: advances and challenges. Front Microbiol, 5, 172.
Ruiz, N., Kahne, D. and Silhavy, T. (2006) Advances in understanding bacterial outer-
membrane biogenesis. Nat. Rev. Microbiol., 4, 57-66.
Sandkvist, M. and Bagdasarian, M. (1996) Secretion of recombinant proteins by Gram-
negative bacteria. Curr Opin Biotech, 7 (5), 505-511.
Shokri, A., Sandén, A. M. and Larsson, G. (2003) Cell and process design for targeting of
recombinant protein into culture medium of Escherichia coli. Appl Microbiol Biotechnol, 60
(6), 654-664.
Wang, Y. (2002) The function of OmpA in Escherichia coli. Biochem Bioph Res Co, 292 (2),
396–401.
Wich, G. and Dassler, T. (2008) Process for the fermentative production of antibodies. No.
US20080206818 A1.
Yoon, S., Kim, S. and Kim, J. (2010) Secretory Production of Recombinant Proteins in
Escherichia coli. Rec Pat Biotechnol, 4 (1), 23–29.
Page 89
80
7. APPENDIX
1. Bioreactors specifications
Bioreactor model Bioengineering NLF 3
Process control BioSCADA Bioengineering
Total volume 7 L
Reactor diameter (D) 155 mm
Reactor height (H) 360 mm
Impeller diameter (d) 60 mm
Impeller blade width (a) 21 mm
Impeller blade height (b) 16 mm
Blade diameter (c) 30 mm
Number of blades 6
Number of stirrer levels 3
Blade bottom and bioreactor
bottom distance 70 mm
Distance between two
stirrers (k) 122 mm
Distance between the 2nd
stirrer and bioreactor bottom ca. 65 mm
Stirrer blade and air opening ca.60 mm
Stirring shafts diameter 12 mm
Number of baffles 4
Baffle height (g) 326 mm
Baffle width (e) 15 mm
Baffle and bioreactor wall
distance (f) 3 mm
Baffle and bioreactor bottom
distance (h) 0 mm
Page 90
81
2. NLF 3 (7 L) bioreactor system scheme