46
MoDOT Research, Development and Technology RDT 00-004 Culvert Study Report RI 91-011 August, 2000

MoDOT
Research, Development and Technology
RDT 00-004
Culvert Study Report
RI 91-011
August, 2000

RDT 00-004
RESEARCH INVESTIGATION 91-11
CULVERT STUDY REPORT
PREPARED BY
MISSOURI DEPARTMENT OF TRANSPORTATION
RESEARCH, DEVELOPMENT AND TECHNOLOGY
Written by: AMY GIFT, E.I.T., Research & Development Assistant
and BILL SMITH, Statistician
Acknowledgments to:
VERNON ADAMS, Research & Development Assistant
MICHAEL BLACKWELL, Field Testing Technician
PATTY BRAKE LEMONGELLI, Director/Research
JEFFERSON CITY, MISSOURI
AUGUST, 2000
The opinions, findings, and conclusions expressed in this publication are those of the principal
investigator and Research, Development and Technology of the Missouri Department of
Transportation.
They are not necessarily those of the U.S. Department of Transportation, Federal Highway
Administration. This report does not constitute a standard, specification or regulation.

i
EXECUTIVE SUMMARY
The purpose of this report is to assess the results to date of the Missouri Department of
Transportation's (MoDOT) culvert study. This report will provide some insight as to what has
been accomplished in the past, what is being done now, and recommendations for the future.
Topics discussed in this report are testing methods, quality of different pipe materials, visual
inspections, and life span of pipes with respect to environmental conditions.
The diagnostic plot analysis in Appendix C indicates that pipe installed from the time
period of 1900 to 1939 metal pipe lasted approximately 60 years. However, metal pipe installed
after 1940 has only lasted an average of about 40 years. Corrugated galvanized steel pipe (GSP)
was originally expected to last at least 50 years. Due to an insufficient number of failed
reinforced concrete pipe (RCP), it was not possible to determine service life at this time. RCP
has demonstrated a service life of at least 75 years to date in Missouri, but may last well beyond.
Polyethylene pipe has only been evaluated for 15 to 20 years, since its initial installation in
Missouri, so a service life based on statistical analysis cannot be determined at this time.
Steel, reinforced concrete and polyethylene pipes are all susceptible to some sort of
environmental condition. Steel and concrete pipes are subject to corrosion by pH levels and soil
resistivity. Concrete pipe is also affected by sulfate levels. Ultra-violet degradation is a concern
with polyethylene pipe. However, some manufacturers provide UV protection in the pipe.
Carbon black is mixed with the polyethylene resin to inhibit degradation.
The best practice for choosing the appropriate type of pipe is knowing about the
environmental conditions and the properties of the different pipe materials. Familiarity with the
pH level, soil resistivity, sulfate level, and other general information about the potential or

ii
existing site should help indicate what type of pipe is suitable.
This study, like other studies prior, found that attempting to correlate culvert field
performance and service life to field testing techniques, including pH and soil resistivity, proved
inconclusive. Other field testing conducted in this study identified little or no correlation to field
performance.
Tracking and monitoring the performance of the different pipe materials used throughout
Missouri is felt to be a worthwhile effort. It is recommended that the culvert study continue on
an ongoing basis. However, it should be re-designed to provide a study which is more efficient
and provides effective results.

iii
TABLE OF CONTENTS
EXECUTIVE SUMMARY i
TABLE OF CONTENT iii
LIST OF FIGURES iv
LIST OF TABLES v
INTRODUCTION 1
HISTORY 3
OBJECTIVE 6
DISCUSSION OF PRESENT CONDITIONS 7
CURRENT CULVERT STUDY TEST METHODS AND RESULTS 9
Soil and Water pH 9
4 Pin Resistance Test 9
Soil Box Resistance 11
Soil to Pipe Resistance 12
Water Hardness 12
Pipe Thickness 13
Test Results 14
Proposed NCHRP Project 14
PIPE MATERIALS AND PERFORMANCE 17
Performance Factors 17
What is Corrosion? 17
Corrosion Indicators 18
Corrosion 19
Abrasion 20
Structural Strength 20
Miscellaneous 21
Service Life 22
Coated Pipes 23
CONCLUSIONS 25
RECOMMENDATIONS 27
REFERENCES 29
APPENDIX A A
APPENDIX B B
APPENDIX C C

iv
LIST OF FIGURES
Figure 1: Useful Life of GSP from 1900 - 1939 .......................................... C-2
Figure 2: Useful Life of GSP from 1940 - 1998 .......................................... C-3
Figure 3: Time period: Up to 1939 ............................................................... C-3
Figure 4: Time period: 1940 - Present. .......................................................... C-4
v
LIST OF TABLES
Table 1: Soil Corrosiveness and Resistivity .................................................. 10
Table 2: Itemized List of the 230 Pipes inspected....................................... A-1
Table 3: Culvert Investigation Test Results ............................................… A-3

1
INTRODUCTION
The Materials & Research Division started a formal investigation and
inspection of a select number of experimental pipes in 1991 known as RI 91-11, The
Culvert Study. During the summer and fall of 1994, research personnel visited
maintenance buildings throughout the state trying to locate different pipe materials
including polyethylene, aluminized, aluminum, polymer coated, poly-vinyl chloride
(PVC) and polyethylene liners, and concrete. Upon locating each site, these pipes
were tested and the log mile of the site reaffirmed. A list containing 141 culvert
pipes in fifty-three counties throughout the ten districts was created to sample the
performance of various types of pipes. This study was an annual investigation until
1997. It was decided that the culvert inspections should be performed on a bi-annual
basis, so the 1998 season was the fourth year for the inspection of these pipes. The
number of culverts inspected has increased since 1994. The list now contains 230
culvert pipes in seventy-one counties throughout the ten districts. The types of pipe
inspected include double wall polyethylene (DWP), single walled polyethylene
(CPE), poly-liner, aluminized, aluminum, polymer coated, concrete box, poly-vinyl
chloride (PVC), PVC liner, insituform, fiberglass, slotted drain, galvanized, and
reinforced concrete. A full list of the 230 pipes can be found in Table 2 in Appendix
A.

2
The testing and inspecting aspect of the survey consists of several
components. Testing procedures will be discussed in detail later in the report. All
pipes are visually inspected to determine if any damage, erosion, or abrasion has
occurred since it was last inspected. A picture is taken of the inlet and outlet of each
pipe. Beginning in 1995, a video was taken of the inside of the pipe to determine the
condition of the joints, view any possible deflections along the length of the pipe,
and discover any deterioration of the pipe itself. All videos and pictures are kept on
file.

3
HISTORY
In 1931-32, a total of 1349 culverts were inspected by the Materials and
Research Division. All possible original locations were resurveyed in 1946-47. In
1964, a comprehensive culvert pipe survey was completed which included 2,149
corrugated metal culvert pipes and 880 reinforced concrete culvert pipes. Many of
the culverts in the previous surveys were not resurveyed in 1964 due to route
relocation (i.e. the county road system changed). All culverts in the 1964 survey
were rated on structural and material durability. The rating of these culverts was
based on methods used by the states of Georgia and Tennessee with slight
modifications based on experience gained from the department's previous culvert
pipe surveys of 1931-32 and 1946-47. The purpose of the survey was to determine
service life of the culverts. All of the surveys mentioned above concluded that CSP
had a predicted life of less than 50 years and that RCP would approach 100 years.
In 1987 a departmental report was written, MR87-1, Study of Use, Durability
and Cost of Corrugated Steel Pipe on the Missouri Highway and Transportation
Department's Highway System. One aspect of this report was the installations of
several types of coating for corrugated steel pipe. The types of coatings used were
epoxy, bituminous, bituminous and paved, polymer, and aluminum (known as
aluminized pipe). Aluminized pipe was found to be the only coating accepted as
equal to the galvanized (or zinc) coated pipe. Also in 1987, a database was created
to track the life of culverts. When a pipe was installed, maintenance personnel filled
out a form called a Culvert Rehabilitation, Replacement, or Construction Report.
The form is now sent to Research, Development and Technology (RDT) where the

4
data from the form is entered into the original database. This database is referred to
as the culvert inventory.
Another comprehensive culvert report was written in 1991, MR91-1, Life
Expectancy Determination of Zinc-Coated Corrugated Steel and Reinforced
Concrete Pipe Used in Missouri. This report strictly compared metal and concrete
culvert pipe. It found that CSP has a service life of approximately 44 years. A
service life for RCP was not predicted due to an insufficient number of RCP having
deteriorated. MR91-1 summarized all of the previous culvert surveys. The report
also indicated that others have tried to relate service life of pipe culverts to
measurable parameters such as pH, abrasion, soil resistivity, chemical characteristics
of the effluent, and watershed characteristics. According to the report, these efforts
were also attempted in this study. However, the results showed that neither a single
or combination of measurable parameters were found to exist, which would predict
the service life of pipe placed anywhere in the state. Although two isolated
incidences were identified which did relate early deterioration to certain conditions,
when incorporating these influences into the total survey data, they were
subsequently "wiped out." Lastly, report MR91-1 recommended the investigation of
plastic or fiberglass pipe liners and also the investigation of pipe materials other than
those considered in the study (zinc-coated or galvanized corrugated steel and
reinforced concrete).
A more recent report written in 1995, RI91-11B, Performance Evaluation of
Aluminized and Galvanized Steel Culverts, provided conclusions to an on-going
study which had been initiated in 1980. This study involved a direct comparison of

5
the performance of aluminized culvert sections to galvanized culvert sections, which
were installed at specific locations in 1952. The 1995 report conclusions indicated
that aluminized culverts have a longer life expectancy than galvanized culverts in
similar environments.

6
OBJECTIVE
This report has three primary objectives. The first objective is to review
current field and laboratory testing procedures. The second objective is to review
current data and build on findings from past surveys. The third objective is to
address the quality and durability of different pipe materials.

7
DISCUSSION OF PRESENT CONDITIONS
The culvert study consists of a biannual investigation of 230 culverts located
in seventy-one counties. The large number of culverts and variation in location
provides adequate representation of various pipe materials proposed for specific
environmental conditions.
Seven tests are conducted by the culvert crew during the biannual culvert
inspection. These tests are the soil pH, water pH, 4-pin resistance, soil box
resistance, soil to pipe resistance, water hardness and pipe thickness. All seven tests
are not appropriate for every type of pipe. The technical report section explains
when and how these tests are performed. All the tests are conducted at the inlet end
of the pipe, unless the inlet is not accessible, then the outlet end is tested. It is then
noted on the culvert inspection sheet if the outlet end is tested. Some of these tests
provide significant data and some do not. The soil to pipe resistance and the water
hardness data does not show any consistency or trends. The hardness of the water
does not affect a pipe unless it stays in the pipe for an extremely long time. Since
most pipes are installed with a slope, water does not remain in the pipe for very long.
On the other hand, tests such as soil and water pH should potentially furnish valuable
information.
Besides performing tests on the culverts, problems are also detected by
means of a visual inspection. One of the most common problems is mower damage.
Fifty percent of the single wall polyethylene culverts, eighteen percent of the double
wall polyethylene culverts, eighty percent of the aluminum culverts, twelve percent
of the aluminized culverts, and ten percent of the polyethylene liners experienced
8
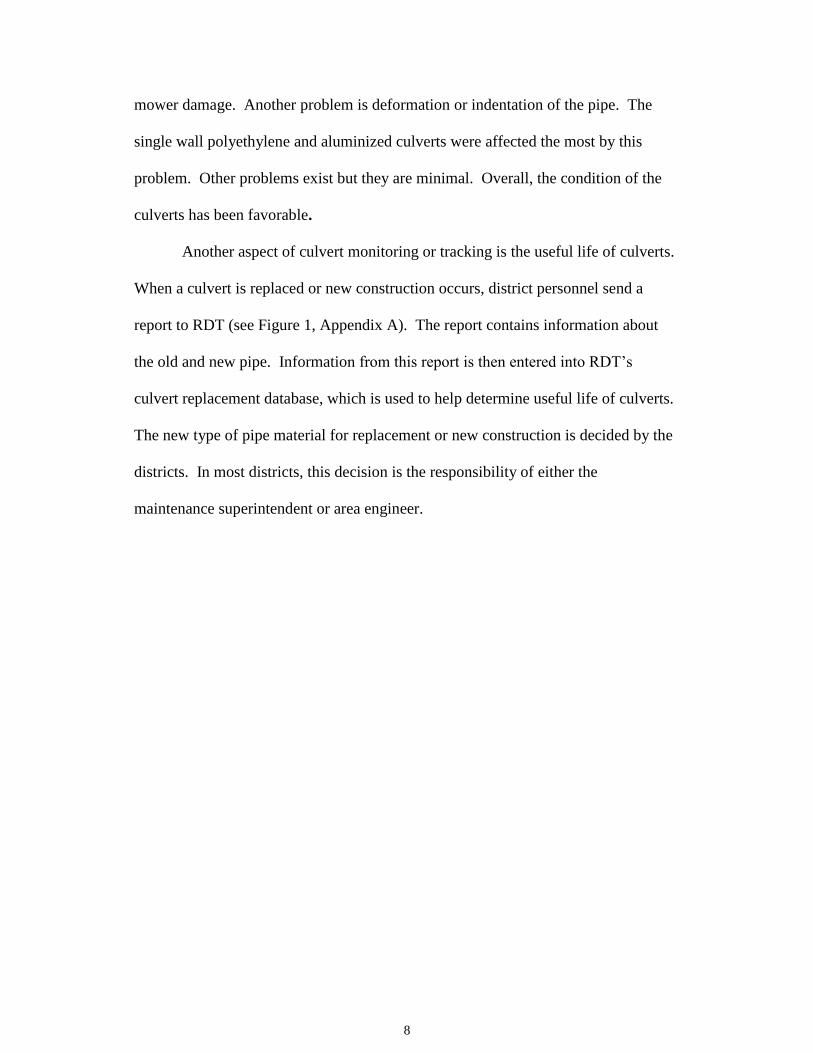
mower damage. Another problem is deformation or indentation of the pipe. The
single wall polyethylene and aluminized culverts were affected the most by this
problem. Other problems exist but they are minimal. Overall, the condition of the
culverts has been favorable.
Another aspect of culvert monitoring or tracking is the useful life of culverts.
When a culvert is replaced or new construction occurs, district personnel send a
report to RDT (see Figure 1, Appendix A). The report contains information about
the old and new pipe. Information from this report is then entered into RDT’s
culvert replacement database, which is used to help determine useful life of culverts.
The new type of pipe material for replacement or new construction is decided by the
districts. In most districts, this decision is the responsibility of either the
maintenance superintendent or area engineer.

9
CURRENT CULVERT STUDY TEST METHODS AND RESULTS
The following is an explanation of how and when the seven culvert tests are
performed. This section will also explain a pending NCHRP project that concerns
testing methods for soil resistivity and pH measurements.
Soil and Water pH
PH is a measure of the relative acidity or alkalinity of water. It is defined as
the negative log (base 10) of the hydrogen ion concentration. Soil and water with a
pH of 7 is neutral; lower pH levels indicate increasing acidity, while pH levels above
7 indicate increasingly basic solutions.
A soil and water sample is collected in the field and submitted to the
chemical laboratory for the determination of pH. Obviously, if there is not any water
in the inlet, then a sample is not collected. When inspecting a slotted drain, a soil
sample is not required because there is not any soil present.
Although soil and water pH is an important aspect of the culvert study,
several studies have found little relationship between pH alone and rates of corrosion
of aluminum or steel. Therefore, one should not rely solely on pH as indicating
absence or presence of corrosive soil or water.
4 Pin Resistance Test
The purpose of the 4-pin resistance test is to determine if the soil around the
pipe is corrosive. This test is performed on every culvert except slotted drains.
The procedure is as follows. The first pin is inserted in the ground 4' from
the inlet of the pipe. The next pin is placed two feet from the first. The third is

10
placed two feet from the second, and so forth. The four pins should follow the flow
line of the water entering the culvert (i.e., the ditch line). After the pins are placed,
an electric pulse is sent to the ground via the electrodes (pins) and the resistance is
measured by a Nilsson 400 soil resistance meter. All numbers are reported in ohms.
Afterwards the value obtained from the meter is multiplied by a formula (reading*
distance in feet*191.51=soil resistivity) (1) to determine resistivity in ohms-cm.
Below is a table showing the level of soil corrosiveness for specific resistivity ranges
(2).
Table 1 - Soil Corrosiveness and Resistivity
Soil Corrosiveness Resistivity (ohm-cm)
Very low 10,000>R>6,000
Low 6,000>R>4,500
Moderate 4,500>R>2,000
Severe 2,000>R
There has been some inconsistency in the resistivity readings in the past.
This is attributed to several factors. The most common error is misinterpreting the
resistance meter. In the first couple of years of the study, some operators read the
multiplier dial on the resistance meter differently than others. During the 1998
inspections, all culvert crew members were shown the proper way to read the meter.
Another problem is the location of the pins. A record was not kept of where the pins
were placed in previous inspections, so in 1998 a drawing of the pin's location was
attached to the back of the inspection sheet. This schematic shows the distance and
direction of the pins from the inlet. Some difference in resistance readings could
also be caused by nature such as non-homogeneous fill materials around the pipe,

11
acidity from rain water, and saturation of the soil. The soil resistance readings,
combined with pH measurements, are useful indicators of corrosive environments.
If field testing of culverts is continued, it is recommended that the 4-pin
resistance test be eliminated from procedures. As previously discussed, the test has
produced results with significant variability which have been misleading. In addition
to improper interpretation of the meter, misplacement of the pins with regards to the
previous location of testing poses a problem. Regardless of providing a diagram for
placement of the pins, it is difficult to place the pins in the exact location, as well as,
repeating the test under the same environmental conditions. The procedures of
setting the pins at 2 feet intervals also dictates that the resistance level recorded is
actually two feet deep, which may have no bearing on the pipe itself.
Soil Box Resistance
The purpose of the soil box test is to consider the worst case scenario for the
type of soil around a pipe. The worst case occurs when the soil is saturated.
Saturated soil gives a low resistance reading, and a low resistance reading indicates
high corrosion. Table 1 shows this correlation.
Minimum resistance is determined by adding distilled or de-ionized water to
400 grams of prepared soil such to obtain the minimum resistance reading from the
soil box. It was determined that an amount of water that creates a pudding like
consistency will give the minimum resistance. Several water contents may be used
to check the validity of this procedure. The dimensions of the box have been chosen
so that the measured resistivity can be expressed in ohm-centimeter. Therefore, all
values are recorded in ohms-cm.

12
The soil box test uses the same Nilsson 400 soil resistance meter as the 4 pin
resistance test. Therefore, the problems experienced with operating the meter will be
similar. To allow for a more controlled test, the soil box test should be performed in
the lab after the moisture content has been determined. This test is performed on the
all culverts except for slotted drains.
Soil to Pipe Resistance
The soil to pipe resistance test is performed only on metal culverts, and is the
measure of resistance between the pipe and a pin placed in the soil 4' from the inlet.
The first pin used in the 4-pin resistance test setup can also be used for this test. One
red and one black wire are connected to the culvert, and the other red and black wires
are attached to the pin. The two wires from the culvert are plugged into one side of
the resistance meter. The two wires from the pin are plugged into the other side of
the meter. Then a resistance reading is recorded. All numbers are reported in ohms-
cm. Again, low resistivity readings indicate a more corrosive soil condition.
The soil to pipe resistance test also uses the same resistance meter as the 4-pin
resistance and soil box resistance tests. Therefore, the problems experienced with
the meter will be similar. There is not a correlation in the soil to pipe resistance
readings from year to year. Therefore, it is recommended not to perform this test in
future culvert investigations.
Water Hardness
The water hardness test is performed by titrating a buffer solution into a
water sample and adding a hardness pill. The step by step procedure is located in the
RDT Culvert Manual. This test is performed when there is an ample amount of

13
water in the inlet to be tested. The purpose of the water hardness test is to test the
hardness of the water. Soft water has a more adverse affect on metal than hard
water. Hard or soft water must remain in contact with a pipe for an extremely long
time in order to affect the pipe. Most of the pipes that are tested are sloped, so this
condition does not apply to any pipes in the culvert survey. Therefore, it is
recommended that this test not be performed in future culvert investigations. The
results from the hardness test are displayed in Tables 3, 4, and 5, Appendix A.
Pipe Thickness
The purpose of the pipe thickness test is to determine if the pipe material is
thinning in certain areas (e.g., where the water runs through the pipe). Pipe thickness
is measured using the Krautkramer Branson DME. This instrument measures the
thickness of culvert pipes by means of an ultrasonic sound wave passing through the
material and measuring the known velocity of the sound waves. The sound waves
reflect from the first interior surface encountered. This meter is used on steel,
aluminum, single and double wall polyethylene, and some polyethylene liners.
However, most liners cannot be tested because they exceed the maximum
measurable thickness of 1/2". Special care must be taken when measuring double
wall polyethylene pipe. A reading should be taken at a point where the interior and
exterior walls are the farthest apart. If a measurement is taken where the two walls
meet, the reading will be incorrect. Since the meter measures the thickness
according to the known velocity of the material, the meter must be calibrated for the
specific material that is being tested. Also, the operator must make sure the units of
the recorded readings are in inches.

14
Test Results
Table 3, 4, and 5 shows the test results from the bi-annual culvert
investigation. It is obvious from this data that the test results are often unpredictable.
Many of the readings are drastically different from year to year. What is not so
apparent from these results is the correlation between the readings and the
deterioration of the pipes themselves. For example, only 4 out of the 19 soil pH
readings in district 7 were below 5.5. This would indicate that, for the most part, the
soil in district 7 is not acidic. However, past field performance indicates that the soil
is too corrosive for metal pipe; therefore, district 7 only installs concrete and plastic
pipe. Soil resistivity readings from the 4-pin resistance test also indicate some
inconsistencies. Perhaps future testing should consider testing for the presence of
other substances such as sulfate, fertilizers, and other chemicals that might influence
these readings. The pipe condition does not always coincide with what is expected
from the soil maps. Therefore, RDT could try to relate the soil pH from the field
samples to the soil maps. The readings vary so much from year to year that it is
difficult to make a correlation between the readings and the condition of the pipe.
NCHRP has initiated a project that would help address this issue. The project is
described in the next section.
NCHRP Project
According to NCHRP Project 21-06 (3),"Corrosion in the Soil Environment:
Soil Resistivity and pH Measurements," there is a major dispute concerning the
proper laboratory and field test procedures to use for soil resistivity and pH
measurements to determine soil corrosivity. The two methods of measuring soil

15
resistivity are AASHTO T 288, Determining Minimum Laboratory Soil Resistivity
and ASTM G57, Standard Test Method for Field Measurement of Soil Resistivity
Using the Wenner Four-Electrode Method. ASTM G57 is the method utilized by
RDT, and is currently being revised by the NCHRP Project 21-06. The method will
be replaced by a two-part standard. The first part will deal with measurements taken
in the field with the four-pin method. The second part deals with soil box tests taken
in the field and the laboratory.
The type of testing instrument is not specified for testing soil resistivity.
Because different testing instruments use different frequencies, numbers of pins and
pin material, this could cause different resistivity readings from the same soil. There
is nothing that says one method is better than another. However, one method needs
to be chosen and set as the standard. Besides testing instruments, soil compaction
can also affect resistivity readings. The appropriate level of compaction needed in a
soil box to represent actual field conditions is not known.
There are also two methods for testing soil pH measurements AASHTO
Method T289, Determining pH of Soil for Use in Corrosion Testing, and ASTM
G51, Standard Test Method for Measuring pH of Soil for Use in Corrosion Testing.
Just as the soil resistivity methods differed, so do these methods. Again, there is no
basis on which to select one method over the other.
This NCHRP study will provide (3):
1) practical test methods for laboratory and field measurements of soil resistivity and pH that yield more precise, accurate values than existing methods and 2) correlation factors between results obtained with the new methods and those from existing methods and equipment...... This information will help engineers effectively manage investment in the construction and rehabilitation of metal-containing structures and facilities that are fully or partially buried in soil.

16
The study will associate soil resistivity and pH with actual corrosion.
Correlating corrosion to soil resistivity and pH measurements will assist in deterring
the corrosion of buried metal structures. As of this date, there is a contract pending
to carry out this 4-year study.

17
PIPE MATERIALS AND PERFORMANCE
Performance Factors What is Corrosion? According to NCHRP Synthesis 254 (2), "corrosion is a cause of
deterioration, dissolution or destructive attack on material properties by chemical or
electrochemical reaction with the environment." When a metal corrodes, it releases
energy. The energy is released in the form of electrical energy. The four basic
components of a corrosion cell are as follows:
Electrolyte - soil moisture around buried pipes, or fluid in the pipe, transferring an ionic current between the
anode and the cathode.
Anode - an area on a metal surface (possibly the pipe itself) on which oxidation occurs, forming an insoluble compound on the metal. This component gives up electrons and thus corrodes.
Cathode - an area on a metal surface (possibly the pipe itself) that receives electrons and does not corrode. Conductor - a metal connection (possibly the pipe itself) that allows electrical current flow and completes the circuit. A voltage difference between the anode and the cathode causes a current to
flow through an electrolyte. In culverts, the potential difference is often associated
with two locations on the pipe embedded in soil with each location having different
electrical properties (an anode and a cathode).
Because of uncontrollable factors affecting corrosion, a metal's potential
difference cannot always be easily estimated. Some of these factors include the
environment that the metal is located in, such as, temperature, the chemistry of the
soil or backfill material, fertilizers, soluble salts and concentrations of oxygen.

18
Cinders, specifically coal cinders, will almost certainly carry acid or acid-forming
compounds. Coal cinders are highly corrosive to those pipe materials vulnerable to
acid attack (particularly metal pipe). Coal cinders also contain unburned carbon.
Unburned carbon serves as a cathode, and may cause accelerated corrosion in metal
pipes.
Corrosion is also accelerated when dissimilar metals are adjoining. The rate
of this corrosion depends on the electrical resistance between the metals, the
potential difference, the conductivity of the soil, the ratio of cathode to anode area
and the polarization characteristics of the metals.
In much the same way that dissimilar metals can cause corrosion cells, a pipe
passing through dissimilar or non-homogeneous soils can also establish corrosion
cells. The half-cell potential of a metal with respect to its environment can vary with
differences in the soil composition.
Corrosion Indicators Generally, the most frequently considered indicators of corrosion
susceptibility are pH, resistivity, conductivity, oxidation-reduction potential, soil
characteristics, precipitation and flow velocity.
As mentioned before, a pH value of 7.0 is neutral, values of less than 7.0 are
acidic and values of more than 7.0 are alkaline. Soils or waters having a pH = 5.5 or
less are considered significantly acidic; those of pH = 8.5 or more are considered
significantly alkaline. Both high and low pH values effect corrosion. Low pH
affects metal pipe and high pH affects concrete. A change of one unit of pH
represents an order of magnitude difference (a factor of 10) in relative acidity or
alkalinity. For example, a solution with pH = 4 is 10 times more acid than one with

19
pH = 5, or 100 times more acid than one with pH = 6. However, several studies have
found little relationship between pH alone and rates of corrosion of aluminum or
steel. One should not rely solely on pH as indicating absence or presence of
corrosive soil or water.
Corrosion Culverts can be made from many different types of pipe material. Three
popular types of pipe material used in Missouri are polyethylene, corrugated steel
(galvanized or aluminized), and reinforced concrete.
Polyethylene pipes are highly resistant to pH and to chemically and
electrochemically induced corrosion. Unlike metals, plastics are nonconductors; and
therefore, not subject to galvanic corrosion. The problem with steel pipe is that it is
susceptive to corrosion and abrasion. The reasons for replacing a steel pipe are
categorized as rusted, crushed, or undermined. The pipe could be replaced for a
combination of these reasons. According to Missouri data, seventy-six percent of the
pipes were replaced due to rusting alone. Therefore, the culvert data indicates that
most of the metal pipes are replaced because of corrosion. There are many factors
that affect the corrosion of steel, for instance: soil pH, water pH, soil resistivity, coal
mining areas, deicing road salts, non-homogeneous backfill material, ground water,
and surface water. RCP is prone to many of the same corrosion factors as steel pipe.
The potential for chemical attack of concrete includes sensitivities to low pH and
soluble salts in both soil and drainage water. Again, similar to steel pipe, mining
areas have a substantial affect on RCP. While Missouri has reported no problems
with RCP due to low pH or the presences of sulfates, there have been some RCP’s
replaced in locations of mining operations. Cyclic freezing and thawing also has a

20
negative influence on RCP. The cyclic freezing and thawing of moisture that
remains in, or has been absorbed by, exposed concrete may cause spalling of the
surface leaving it open to further acid and/or sulfate attack.
Abrasion Generally, polyethylene pipe is resistant to abrasion by relatively small
aggregates and fine sands that are transported by water flowing at normal flow rates.
The effects of continuous abrasion by larger debris, such as stones and cobbles,
along with high velocity are not as clearly defined. Coupled with the potential for
corrosion, the nature of the abrasive aggregate bed load determines durability and
useful life of steel pipe. The bed load refers to aggregate or rock debris carried by
the water flowing through the pipe. Aggregates contained in the bed load generally
are much harder than the steel and typically harder than the protective coatings of
zinc or aluminum. The abrasive action of a bed load of transported aggregates acts
to expose the iron surface, which then oxidizes and forms a scale that is not highly
resistant to further abrasion. The same abrasive action is a concern when loading
and unloading the pipe for installation. MoDOT currently uses a front end loader
and log chains to load and unload pipe. It is possible for the chains to scratch the
steel pipe's coating in a manner similar to the bed load. Therefore, special care
should be taken in the transportation, loading and unloading of coated steel pipe.
One suggestion is using nylon tie-down ropes instead of log chains.
Structural Strength The original plastic pipes used were single-walled polyethylene. There were
a few problems with the strength and weight of these pipes. The High Density
Polyethylene (HDPE) used now is a double-wall polyethylene pipe. Its heavier

21
weight seems to terminate the problem of upwards floating. Steel has a high initial
strength, but it becomes weak once it begins to deteriorate. Obviously concrete is
the strongest material of the three main types discussed in this report. However,
some reinforced concrete pipe (RCP) has failed in Missouri. These failures were due
to disjointing at the end sections. Records indicate that there is a database containing
1642 reinforced concrete pipes in Missouri that were inspected in 1989 and 1990.
Almost all of these pipes had an excellent structural and material durability rating.
Miscellaneous Two major concerns with HDPE pipe are fire damage and ultra-violet (UV)
degradation. Most manufacturers now add carbon black to the resin mix to resolve
degradation problems. Three cases of fire damage to plastic pipe have been reported
to RDT. Out of 49 states surveyed for NCHRP Synthesis 254 (2), only three other
states reported cases of fire damage. These cases were due to forest or grass fires.
Protecting the inlet and outlet of the pipes would guard the pipe from exposure to
grass fires and UV degradation. A concern for both polyethylene and metal pipe is
mower damage. Using some sort of end protection is the best solution to this
problem. However, it is not always economical on the secondary routes. If mower
damage has already been done to polyethylene, the damaged end can be cut off.
Sometimes it is possible to create a beveled end treatment with what is left of the
pipe. Mower damage to metal pipe is more serious. The abrasion to the pipe allows
corrosion to begin immediately.
22
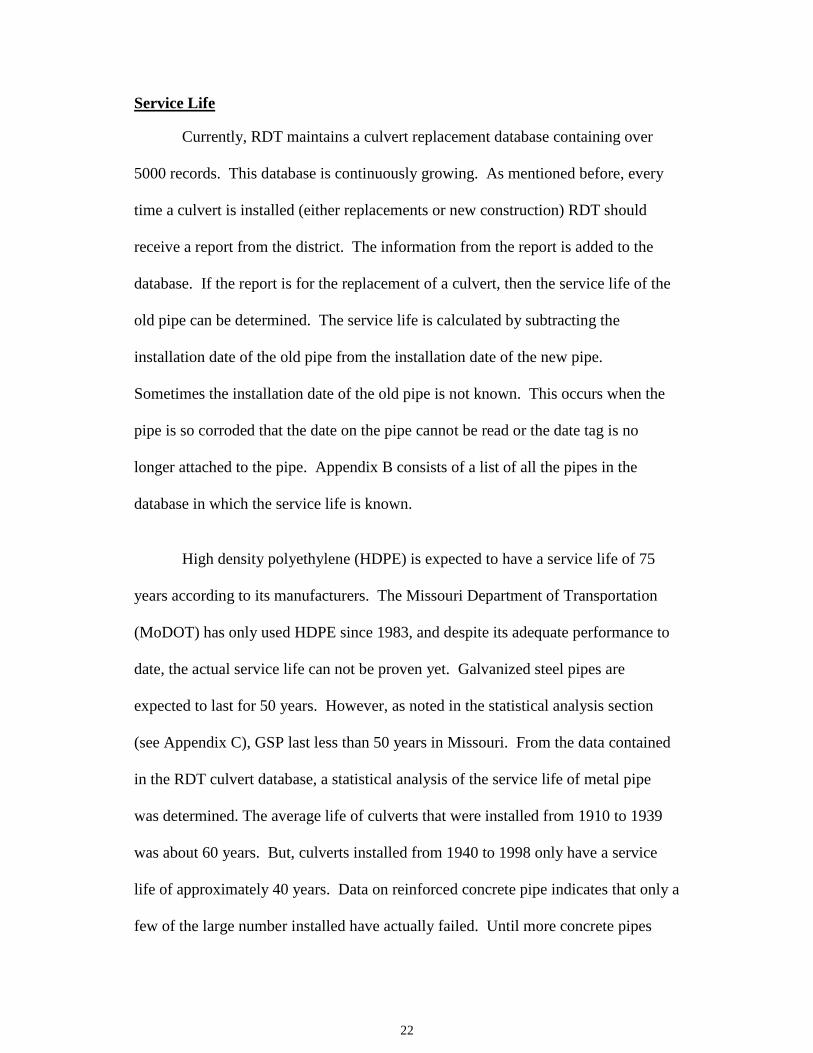
Service Life Currently, RDT maintains a culvert replacement database containing over
5000 records. This database is continuously growing. As mentioned before, every
time a culvert is installed (either replacements or new construction) RDT should
receive a report from the district. The information from the report is added to the
database. If the report is for the replacement of a culvert, then the service life of the
old pipe can be determined. The service life is calculated by subtracting the
installation date of the old pipe from the installation date of the new pipe.
Sometimes the installation date of the old pipe is not known. This occurs when the
pipe is so corroded that the date on the pipe cannot be read or the date tag is no
longer attached to the pipe. Appendix B consists of a list of all the pipes in the
database in which the service life is known.
High density polyethylene (HDPE) is expected to have a service life of 75
years according to its manufacturers. The Missouri Department of Transportation
(MoDOT) has only used HDPE since 1983, and despite its adequate performance to
date, the actual service life can not be proven yet. Galvanized steel pipes are
expected to last for 50 years. However, as noted in the statistical analysis section
(see Appendix C), GSP last less than 50 years in Missouri. From the data contained
in the RDT culvert database, a statistical analysis of the service life of metal pipe
was determined. The average life of culverts that were installed from 1910 to 1939
was about 60 years. But, culverts installed from 1940 to 1998 only have a service
life of approximately 40 years. Data on reinforced concrete pipe indicates that only a
few of the large number installed have actually failed. Until more concrete pipes

23
have failed, a statistical analysis to determine service life cannot be performed.
However, reinforced concrete pipe (RCP) has been used extensively in Missouri and
has demonstrated a service life, to date, of at least 75 years. Based on current
performance, it is expected that RCP will last well beyond the current 75 years and
very possibly will last for 100 years, as originally predicted.
Coated Pipes
The Department has tested several types of coatings over the years in an
attempt to find a coating that would increase the life expectancy of a corrugated steel
pipe to a point where it would approach that of RCP. Coatings tested, to date, are
aluminum, epoxy, bituminous, and polymer. According to the MR87-1 report, zinc
(galvanized) and aluminized Type 2 (aluminum coatings) are the only coatings for
steel pipe that are accepted by the department.
In the 1965 investigation, the department concluded to discontinue the use of
bituminous coatings. This coating is subject to poor adhesion, abrasion, and salts.
The life expectancy of bituminous coating is 0 to 7 years. Epoxy coatings are
affected by direct sunlight. This type of coating was found to fail after 5 years of
exposure to acidic conditions.
A study initiated in 1980 specifically evaluated and compared the
performance of zinc coated (galvanized) to aluminum coated (aluminized) steel
pipes. The pipes were actually installed in 1952. A report written after the pipes
were in-place approximately 42 years concluded that the aluminized culverts have a
longer life expectancy than galvanized culverts in similar environments. Further
monitoring would determine the extent of increased life expectancy of aluminized

24
over galvanized steel pipe.
The MR87-1 report states that only one polymer coated pipe had been
installed prior to 1987. All the rivets were gone from the invert of this pipe six
months after installation due to highly acidic runoff.
In 1990, three more polymer coated pipes were installed and monitored.
These pipes were 10' extensions that were added to existing pipes. One of the
extensions was added to a concrete pipe on Route O in St. Clair County. The
location was chosen for its acidic environment. Previously, metal pipes only lasted
up to six months at this location. When this pipe was investigated in 1998, there was
no corrosion on the polymer end and excessive corrosion on the concrete portion.
The other two extensions were added to galvanized steel pipe. The pipe installed in
Monroe County on Route V is still in good condition (inlet and outlet). The placing
for this pipe was chosen because of the agricultural runoff. The pH is fairly neutral.
The other pipe, located in Howell County on Route K, had slight dings and scratches
but has not begun to rust. The galvanized steel end of the pipe is beginning to rust.
This location was selected because of the abrasive runoff. The most recent polymer
coated pipe installation was in 1997 on Route B in St. Clair County. It has begun to
rust after one year. The soil pH at the pipe location was 5.7 in 1998. There was not
any water present, so water pH was not taken. Continued monitoring of coated pipes
should be carried out in order to determine their field performance and service life.
25
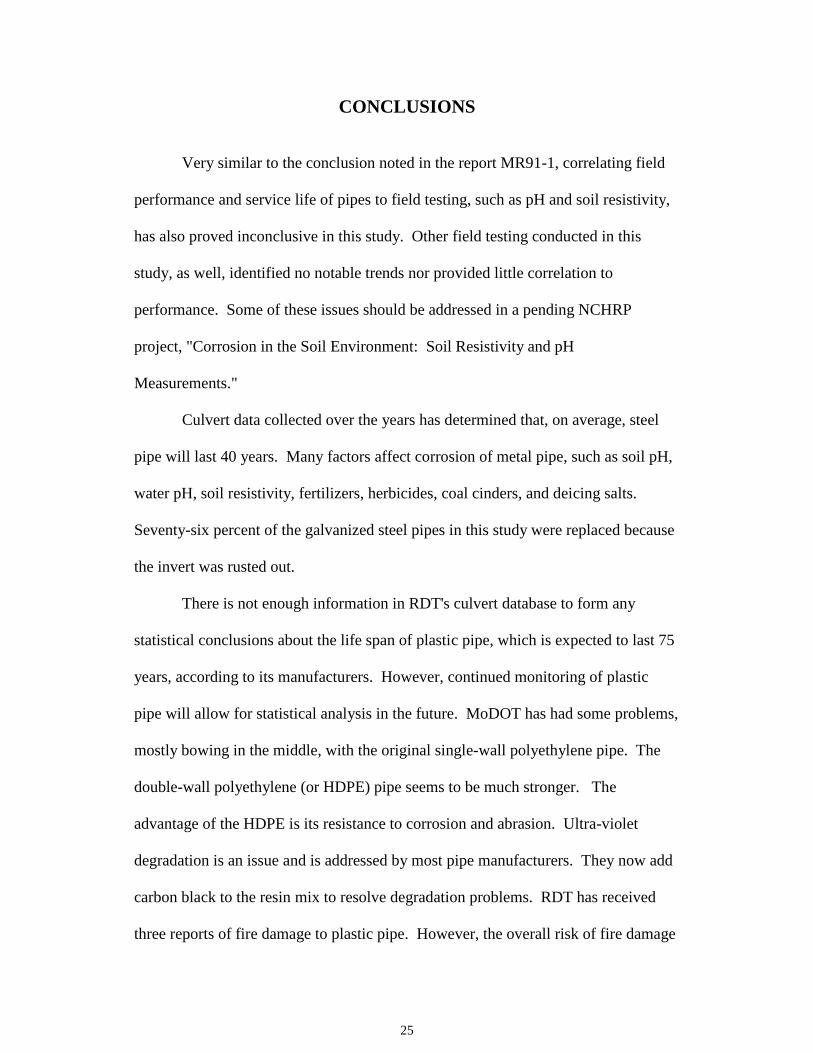
CONCLUSIONS
Very similar to the conclusion noted in the report MR91-1, correlating field
performance and service life of pipes to field testing, such as pH and soil resistivity,
has also proved inconclusive in this study. Other field testing conducted in this
study, as well, identified no notable trends nor provided little correlation to
performance. Some of these issues should be addressed in a pending NCHRP
project, "Corrosion in the Soil Environment: Soil Resistivity and pH
Measurements."
Culvert data collected over the years has determined that, on average, steel
pipe will last 40 years. Many factors affect corrosion of metal pipe, such as soil pH,
water pH, soil resistivity, fertilizers, herbicides, coal cinders, and deicing salts.
Seventy-six percent of the galvanized steel pipes in this study were replaced because
the invert was rusted out.
There is not enough information in RDT's culvert database to form any
statistical conclusions about the life span of plastic pipe, which is expected to last 75
years, according to its manufacturers. However, continued monitoring of plastic
pipe will allow for statistical analysis in the future. MoDOT has had some problems,
mostly bowing in the middle, with the original single-wall polyethylene pipe. The
double-wall polyethylene (or HDPE) pipe seems to be much stronger. The
advantage of the HDPE is its resistance to corrosion and abrasion. Ultra-violet
degradation is an issue and is addressed by most pipe manufacturers. They now add
carbon black to the resin mix to resolve degradation problems. RDT has received
three reports of fire damage to plastic pipe. However, the overall risk of fire damage

26
with polyethylene pipe is minimal. To be safe, plastic pipe should be protected at the
inlet and outlet from exposure to grass and UV degradation.
The third type of pipe discussed in this report is concrete. Like steel,
concrete is susceptible to corrosion and abrasion. Low pH levels, high levels of
sulfates in the soil or water, and acid run-off from mining areas can be a concern
with concrete. While Missouri has reported no problems with RCP due to low pH or
the presences of sulfates, there have been some RCP’s replaced in locations of
mining operations. A total of 1,642 reinforced concrete pipes were inspected during
1989 and 1990. The majority of the pipes inspected had a high structural and
material durability rating. Based on current performance to date, reinforced concrete
pipe in Missouri has demonstrated a service like of at least 75 years and very well
may last 100 years, as originally predicted.
While the culvert study has allowed close performance monitoring of a
specified number and type of pipe materials, it appears that limited applicable
information has resulted from its field testing efforts. Most of the useful information
has been provided by visual examination of pipe condition and familiarity of
surrounding conditions. Additional useful information, being the service life of the
various pipe materials, has been determined from the information compiled in the
culvert inventory database.

27
RECOMMENDATIONS
Tracking and monitoring the performance of the different pipe materials used
throughout Missouri is felt to be a worthwhile effort. With new materials emerging
in more recent years, such as polyethylene pipe materials and pipe liners, it's
important that some sort of continued evaluation take place so that a determination
can be made with regards to the most cost-effective culvert installation, given the
location and conditions. While culvert materials have been studied for years in
Missouri, some of these efforts have simply been more effective than others. Hence,
it is vital that any further monitoring efforts be carried out with the intentions and
design of providing effective results.
It is recommended that the culvert study continue, but that it be re-designed
for improved efficiency. The following is a summary of proposed changes or
additions to the current culvert study:
1) Revise the current list of pipe materials under evaluation to include a
comprehensive list of materials both which have been used for years
and newer materials installed in Missouri. The number of pipes
representing each material should reflect a statistically valid quantity,
which is also evenly distributed throughout the state as much as
possible. Therefore, the study should take into account the different
geographical locations and conditions in Missouri and how these
influence material performance. Pipe materials recommended to be
included in the study, but not limited to, are as follows:
galvanized steel poly vinyl chloride
aluminized steel single wall poly
aluminum clad double wall poly
reinforced concrete poly liner
polymer coated poly vinyl chloride liner
2) Eliminate the following field testing: soil and water pH, 4 pin
resistance, soil box resistance, soil to pipe resistance, water hardness,
and pipe thickness.

28
3) Continue field observations of pipe materials to determine
performance. Establish an evaluation system, which would allow
quantifying performance with regards to pipe durability and structural
aspects.
4) Continue the culvert study on an on-going basis with inspections
taking place tri-annually. Reports summarizing findings or
observations made during field inspections should be completed
following the surveys.
5) Implement global positioning system (GPS) technology to locate the
exact location of the pipes in the field. This would minimize field
personnel needed and provide a more efficient means of locating
pipes during field inspections.

29
REFERENCES
1. 4-Pin Soil Resistance Meter Instruction Manual, Nilsson Electrical
Laboratory, Inc., New York, New York (1984).
2. Gabriel, L. and E. Moran, "Service Life of Drainage Pipe," in National
Cooperative Highway Research Program Synthesis 254, Transportation
Research Board, National Research Council, Washington, D.C. (1998).
3. Corrosion in the Soil Environment: Soil Resistivity and pH Measurements.
National Cooperative Highway Research Program. 2 Mar. 1999
<http://www2.nas.edu/trbcrp/6412.html>.

30
APPENDIX A

31
Table 2 - Itemized List of the 230 Pipes Inspected
Double Walled Polyethylene 51.00
Single Walled Polyethylene 10.00
Polyethylene Liner 30.00
Aluminized 25.00
Aluminum 5.00
Polymer Coated 4.00
Concrete Box 8.00
Poly-Vinyl Chloride 3.00
Poly-Vinyl Chloride Liner 1.00
Insituform 1.00
Fiberglass 2.00
Slotted Drain 7.00
Galvanized 1.00
Reinforced Concrete 82
Total 230

32
APPENDIX B

1
Soil PH Water PH 4 Pin Resistance ohm-cm Soil Box Resistance ohm-cm Soilpipe Resistance ohm-cmWater Hardness Pipe Thickness inch position 12-3-6-9CountyRoute Location Type Install date 94 95 96 98 94 95 96 98 94 95 96 98 94 95 96 98 94 95 96 98 94 95 96 98 94 95 96Dist 1Buch H 0.9 E RT E DWP 08/01/89 6.9 7.6 6.8 2527.93 2183.21 1646.99 1991.70 2700 4700 4600 27007 0.23 0.27 0.23 0.30Davi E 2.85 E DEKA CO LN DWP 04/16/92 7.3 7.5 7.1 7.1 26811.40 6894.36 5362.28 4596.24 3800 4400 3200 4000 0.22 0.25 0.24 0.26Deka D 1.55 N RT 6 DWP 04/14/92 7.2 6.7 6.6 6.8 14937.78 2681.14 72.77 1761.89 3050 3500 2200 0.16 0.13 0.13Deka D 2.1 N RT 6 DWP 04/13/92 7.1 6.8 6.9 7.1 65113.40 6894.36 1915.10 1800.19 2200 2200 3300 1400 0.09 0.09 0.09 0.09Deka D 3.75 N RT 6 DWP 04/13/92 6.6 7 7.1 6.7 7.3 6.7 41749.18 3753.60 4596.24 2259.82 3100 2900 2200 2500 306 186 0.20 0.21 0.21Deka E 0.05 E RT D DWP 04/16/92 7.1 7.6 7.1 7 7.2 22981.20 1991.70 1646.99 1608.68 1500 1600 2400 3400 690 0.13 0.17 0.13 0.13Deka E 0.4 E RT D DWP 04/16/92 6.7 7.2 7.1 28726.50 8809.46 4596.24 3868.50 4700 4500 2800 3300 0.49 0.47 0.20 0.31 0.28 0.28Deka E 0.7 W RT D DWP 04/15/92 7.1 7 6.9 6.8 7.8 7.1 41366.16 2183.21 1493.78 1340.57 2900 2200 2400 4200 424 448 0.39 0.17 0.12 0.16 0.15 0.15 0.11 0.11 0.11Deka E 3.45 W RT D DWP 04/15/92 7 7 6.9 7.2 12256.64 2566.23 4596.24 2500 2700 3300 224 0.12 0.13 0.15 0.10 0.15 0.15 0.15 0.14Deka E 3.55 W RT D DWP 03/15/92 6.9 7.1 7.1 6511.34 3179.07 3830.20 4200 3050 3500 0.19 0.15 0.14 0.15 0.16 0.16 0.16 0.15Holt 111 4.1 N RT 111 S ALZ 10/14/93 6.7 7.4 7.1 7 2642.84 2183.21 1570.38 1761.89 3300 2100 2600 3100 1050 120 305 0.07 0.07 0.07 0.05 0.05 0.06 0.05 0.07 0.08 0.07Holt 111 4.9 N RT 111 S ALZ 10/07/93 6.9 7.8 7.1 7.1 2298.12 1991.70 1953.40 1378.87 3100 2700 800 3100 420 150 140 0.10 0.07 0.07 0.07 0.03 0.05 0.05 0.06 0.08 0.09Noda 246 3.24 E RT 148 ALZ 01/01/52 6.8 7 7.3 6.9 7.3 6.9 7 6.7 29492.54 7277.38 1570.38 2336.42 7200 10 1600 1500 520 2600 245 1100 352 170 225 0.11 0.12 0.12 0.12 0.11 0.11 0.11 0.11 0.12 0.12 0.12Dist 2Adai 6 4.8 E SULL CO PLI 04/15/94 4.9 6.5 6.8 6.7 1187.36 1532.08 1493.78 3102.46 1800 2700 2050 1700 0.73 0.79 0.80 0.83Adai 6 4.9 E SULL CO PLI 04/15/94 5.3 6.9 6.6 6.9 3523.78 2872.65 2566.23 1302.27 2300 3000 2200 1600Adai 6 5.05 E SULL CO PLI 04/19/94 5.7 7.6 7 7 1378.87 1302.27 1608.68 3830.20 2200 2500 2000 1600Char JJ 0.4 S LINN CO DWP 06/01/92 6.5 7.3 7.2 6.9 2681.14 2068.31 3447.18 2068.31 4000 2700 5200 2700 764 764 0.20 0.22 0.21 0.18 0.17 0.21 0.20 0.17 0.17Linn 5 1.55 S RT JJ DWP 06/01/92 6.9 6.7 6.8 7 957.55 1072.46 1034.15 1417.17 1400 1400 1300 2800 0.38 0.36 0.36 0.11 0.14 0.13 0.14 0.16 0.14 0.14Sali C 7.8 E RT 41 DWP 01/01/94 7.4 6.9 7 7.2 7 7 7.1 7 1417.17 1493.78 1493.78 1646.99 3700 1850 2600 2500 300 426 0.15 0.17 0.11 0.16 0.05 0.05 0.05Sali EE 2.1 N I-70 CPE 05/15/97 5.7 6.6 7 7 1149.06 2681.14 1455.48 766.04 3500 2800 2100 5800 0.24 0.26 0.23 0.20 0.15 0.14 0.15 0.15Sull 6 0.7 E RT 129 PLI 01/01/93 7.4 7.1 7.1 7 7.2 3562.09 3102.46 2336.42 1570.38 2200 1700 1900 2500 0.23 0.23 0.23 0.24 0.30 0.29 0.29Dist 3Lewi 81 1.9 N RT 16 DWP 10/12/93 6.9 7 6.9 6.6 7 6.3 2872.65 4213.22 1953.40 1263.97 4200 4600 1900 2100 140 581 0.35 0.29 0.33 0.38 0.10 0.09 0.10Linc U 2.8 W RT J DWP 05/03/94 5.6 7.2 7 7.1 1263.97 8043.42 3025.86 1187.36 7500 3300 3600 2500 0.12 0.14 0.15 0.14Linc W 4.8 S RT B DWP 06/01/95 5 4.6 7 7.2 7 1340.57 9192.48 4596.24 1149.06 3700 2850 2700 5000 70 0.17 0.16 0.18Mari A 0.8 N RT 168 DWP 01/01/94 5.6 7 6.6 6.8 6.7 5362.28 1646.99 5745.30 957.55 3800 5500 2600 4100 109 0.08 0.07 0.10 0.07 0.11 0.14 0.12 0.11Mari C 0.15 S RT 168 DWP 01/01/94 6.8 7.2 6.6 7.1 6128.32 6894.36 4213.22 574.53 3500 7100 1700 3200Mari P 3.3 N RT A CPE 01/01/94 6.8 6.8 6.9 7.1 7.1 6.5 6.8 1378.87 2757.74 766.04 880.95 1600 3400 1800 2200 416 66 0.16 0.17 0.18 0.17 0.18 0.20 0.19Monr 151 1.2 S RT K DWP 11/17/92 6.6 7.1 6.8 6.8 12639.66 6511.34 2106.61 2566.23 2800 3500 2100 3500 0.17 0.16 0.15 0.15 0.17 0.16 0.19 0.16Monr K 1.3 W RT 151 DWP 04/03/92 7.1 7.2 6.6 6.9 107245.60 2681.14 1991.70 689.44 1500 4900 2500 4500 0.13 0.12 0.14 0.15 0.15 0.15 0.13Monr K 5.6 W RT 151 DWP 04/02/92 6.7 6.8 6.4 7 12639.66 1800.19 1493.78 1761.89 2800 5600 2400 3500 0.14 0.13 0.12 0.13 0.15 0.17 0.13 0.16Monr V 2.45 S SHEL CO LN DWP 04/06/92 6.8 7.3 6.2 6.9 26811.40 2757.74 15320.80 1225.66 2400 2700 1700 0.16 0.15 0.17 0.15 0.16 0.20 0.16 0.17Monr V 2.8 S SHEL CO LN DWP 04/06/92 8.1 7.4 7.2 7.4 38302.00 1455.48 2719.44 1302.27 2300 4000 2600 2300 0.13 0.13 0.18 0.14 0.15 0.14 0.16 0.16Monr V 3.0 S SHEL CO LN DWP 04/06/92 7.1 6.9 7.2 7.6 80434.20 2642.84 1915.10 1532.08 1600 3900 2000 1900 0.15 0.32 0.30 0.11Monr V 3.2 S SHEL CO LN PCO 10/04/90 7.2 7.1 6.8 7.3 7.1 6.6 49792.60 3370.58 2068.31 2527.93 2500 2800 1200 2100 170 155 1100 500 680 0.11 0.11 0.11 0.11Mont 161 3.1 S RT CC ALU 01/01/74 6.9 7.2 6.9 7.2 7.1 6.6 6.9 24513.28 5745.30 2872.65 919.25 1500 3000 4000 4300 130 350 278 496 340 0.07 0.08 0.07 0.07 0.07 0.08 0.07 0.07Mont CC 0.7 E RT 161 DWP 05/24/94 7.6 7 6.7 7.4 6.7 7.1 6.7 7.7 42132.20 6894.36 3830.20 1991.70 1800 4100 1280 2600 548 326 500 222 1.83 0.18 0.19 0.18 0.15 0.16 0.15 0.15Mont P 0.7 S RT K PLI 12/15/91 5.2 5.8 6.9 6.4 11490.60 6894.36 3064.16 1723.59 2200 1700 6400 7100 1.29 1.23 1.24 1.25Shel 151 6.0 S RT 36 DWP 04/15/92 6.9 7.2 7.3 6.8 6.8 6.6 7.3 2489.63 7277.38 2834.35 1761.89 8500 2500 4300 1600 304 500 149Shel 151 6.3 S RT 36 DWP 04/21/92 6.8 6.8 7 6.3 68943.60 3523.78 3370.58 2106.61 3700 4900 3300 3200Warr WW 1.05 E RT J PLI 05/10/93 7 6.8 7.2 4596.24 2106.61 4979.26 7700 8100 4400Dist 4John 13 3.3 N RT H PLI 01/01/94 6.9 7.2 7.3 6.5 1532.08 3064.16 1493.78 1072.46 5600 6700 2900 2550Lafa FF 1.07 W RT 13 ALZ 01/01/52 6.6 6.7 6.5 6.6 7 5.5 30641.60 2144.91 2374.72 2106.61 2200 1550 3000 2700 1100 135 160 92 780 100 0.03 0.03 0.03Lafa FF 1.46 W RT 13 ALZ 01/01/52 7 6.5 7 6.7 2949.25 1608.68 3293.97 4000 2500 2350 75 76 266 132 0.13 0.12 0.11Lafa FF 1.5 W RT 13 ALZ 01/01/52 6.8 6.5 6.6 3293.97 1915.10 0.00 2300 1300 505 350 266 0.04 0.04 0.04 0.12 0.12 0.11Dist 5Boon Z 2.45 N RT FF CPE 03/01/87 4.2 6.3 6 11490.60 1417.17 1700 2200 470Boon Z 3.8 S RT HH CPE 03/01/87 5.1 6.7 5.5 21832.14 1685.29 1400 2300 520Boon Z 6.0 N RT OO CPE 03/01/87 6.7 5.4 14554.76 651.13 2000 8800 292Call 54 4.2 N RT J CON 10/24/92 6.9 7 7 6511.34 6894.36 0.00 4600 2400 340Call 94 6.9 E RT 54 PLI 03/01/94 7.5 6.8 6.9 7277.38 17235.90 5100 2200 0.10 0.10 0.10Call 94 7.1 E RT 54 PLI 03/01/94 6.8 6.7 6511.34 1417.17 4200 4300Call 94 7.2 E RT 54 PLI 03/01/94 6.9 6.8 6894.36 1340.57 7800 3700Call 94 7.5E RT 54 PLI 03/01/94 7.2 6.5 5745.30 1991.70 6500 3800Call 94 7.7 E RT 54 PLI 03/01/94 7.1 6.6 6511.34 2796.05 5600 2400 0.09 0.08 0.08 0.09Call DD 2.3 S RT E S J DWP 05/01/94 7.2 7.3 6.9 7 3064.16 5745.30 9575.50 5600 2700 3300 122 0.12 0.11 0.10 0.11Camd 54 1.3 E RT KK PVC 11/01/91 7.5 7 6.9 6.5 9192.48 6894.36 6894.36 7600 6700 3300 318Camd 54 2.6 E RT KK PLI 11/30/93 5.5 12256.64 0.00 1500Cole 50 1.2 W RT Z DWP 09/01/93 6.6 7 7.1 7.1 8426.44 9958.52 9575.50 34854.82 5700 3600 11 5000Cole U 0.2 N RT C ALZ 06/03/94 7.2 6.8 7 30258.58 2681.14 2030.01 43000 4000 5400 200 160 0.07 0.06 0.06 0.06Gasc 100 2.7 W RT J PLI 10/02/92 5.4 6.7 6.8 14554.76 13022.68 1800.19 4500 2600 7200Gasc 100 3.2 E RT J PLI 06/21/93 6 7 7 6.7 6128.32 16852.88 5362.28 5000 4000 4600Gasc 28 0.2 W RT19 N J PLI 09/02/94 7.1 6.7 26428.38 3753.60 5100 4800Gasc 28 1.6 E RT19 N J PLI 01/01/89 6.8 7 7 5745.30 1378.87 2000 4200Gasc EE 11.55 S RT 28 PLI 09/21/94 5.7 7.2 5.3 6.4 7 18001.94 18767.98 16469.86 13788.72 26000 1100 13 11000MariesN 2.9 N RT 28 PLI 08/23/89 6.9 6.8 7 6894.36 4174.92 4100 3200 520MariesN 3.0 N RT 28 PLI 08/23/89 6.5 6.8 2796.05 2489.63 2900 2500Mill AA 1.2 N RT 54 DWP 06/07/94 7 6.8 6.7 6.6 8426.44 5745.30 4979.26 2681.14 3500 8000 8700 5500 0.07 0.09 0.08 0.09Mill AA 2.6 N RT 54 DWP 06/02/94 7.3 6.8 6.7 6.8 14554.76 3830.20 6128.32 1800.19 9200 5400 5900 4800 1.25 1.25 1.11 1.38Mill AA 3.1 N RT 54 DWP 06/13/94 6.6 6.6 6.8 6.7 14171.74 12639.66 7660.40 6511.34 10 4800 16 3200 1.90 1.64 1.74 1.79Osag 133 1.05 N MARI CO LN PLI 10/20/93 6.8 6.8 6.6 31024.62 38302.00 7277.38 20000 7000 12000 7.10 6.48 3.63 9.46Osag 89 2.05 N RT E PLI 05/01/94 6 6.8 6.7 6.6 1149.06 6511.34 3064.16 4596.24 17000 6100 17 7800 0.77 0.80 0.83 0.80 0.41 0.45 0.49 0.43Osag 89 2.6 N RT E PLI 05/01/94 6 6.6 6.4 6.7 3064.16 4596.24 3447.18 1608.68 8300 3000 5900 3100 0.82 0.82 0.85 0.84Osag M 0.5 N MARI CO LN DWP 06/20/95 6.6 7 6.4 6.6 6.7 6.6 3830.20 37152.94 3830.20 12256.64 6600 6800 25 9300 204 0.45 0.45 0.45 0.44Osag M 0.8 N MARI CO LN DWP 06/09/95 6.9 7 6.6 6.8 6.5 7 6.7 1149.06 6511.34 25279.32 9575.50 8100 5500 15 17000 324 0.45 0.46 0.47 0.46

2
Soil PH Water PH 4 Pin Resistance ohm-cm Soil Box Resistance ohm-cm Soilpipe Resistance ohm-cmWater Hardness Pipe Thickness inch position 12-3-6-9CountyRoute Location Type Install date 94 95 96 98 94 95 96 98 94 95 96 98 94 95 96 98 94 95 96 98 94 95 96 98 94 95 96
Osag N 3.4 N RT 50 PLI 06/04/93 5.9 6.8 6.7 6.8 6.9 5745.30 6511.34 7277.38 2489.63 13000 6700 12 5800 340 0.28 0.62 0.63 0.55Pett 127 0.6 N RT 50 CON 01/01/63 7.9 5.9 6.7 6.6 95755.00 6511.34 2489.63 23000 4200 3000 492Pett W 8.4 S RT 50 CON 01/01/63 7.3 6.5 6.6 7.1 6.9 6.7 11490.60 15703.82 5745.30 64000 3100 2400 770 248Dist 6Jeff B 8.5 W RT 21 FGL 06/01/75 6.9 6.8 1493.78 842.64 5100 1900Jeff B 8.55 W RT 21 FGL 06/01/75 6.9 7.3 919.25 689.44 4000 3200StCh D 1.6 W RT DD PLI 07/20/92 6.9 7.4 6.8 7.1 6.5 33322.74 4596.24 2604.54 6400 7700 4700 204 254 264StCh P 1.6 E RT 61 PLI 08/01/88 5.7 7.3 7 7 24896.30 1876.80 1953.40 1532.08 3600 5700 12 2000 0.18 0.18 0.18 0.18StCh W 4.5 N I-70 PLI 06/01/94 5.6 7 6.8 7.1 957.55 3523.78 2604.54 2757.74 5100 3600 8600 4200 0.89 0.84 0.87 0.90Dist 7Barr 37 700' N AR LINE CON 02/01/92 7.9 7.3 6.5 6.9 5745.30 65113.40 3830.20 9100 2200 5800 320Bart C 1.0 E RT F ALU 02/09/62 7.1 6.8 6.8 6.5 6.9 42132.20 19917.04 9575.50 4596.24 7200 4100 7800 2800 845 600 360 140 0.01 0.01 0.01Bart J 0.3 S RT 126 DWP 05/09/89 6.8 6.5 7 6 7 1915.10 4596.24 3064.16 3447.18 2400 2200 7200 2300 325 325 0.01 0.01 0.01Bart NN 0.5 S RT K ALU 12/18/62 6.8 6.8 6.9 5.9 6.8 6.8 13405.70 1570.38 4596.24 1608.68 1700 2100 4800 1200 62 250 48 774 250Bate H 1.5 E RT VV DWP 02/09/95 7.2 6.5 7 6.6 7.6 7.1 6894.36 8043.42 3830.20 24513.28 2700 3600 3500 2000 296 458Bate H 2.7 E RT VV DWP 02/08/95 7 6.2 7.1 4.5 7.2 6.6 3447.18 8809.46 2298.12 1455.48 5000 1700 4800 2100 254 418Bate O 5.4 S RT 52 DWP 07/08/92 7.2 6.4 7.1 5.8 7 24130.26 7660.40 5745.30 1838.50 7200 4500 8400 1800 220 0.03 0.04 0.03Bate W 2.9 S RT 52 DWP 10/11/93 6.4 7 6.8 6.4 6.6 22215.16 3064.16 3830.20 2489.63 1300 3100 1600 4800 430 0.03 0.02 0.02 0.02Ceda 32 5.2 S RT 54 CON 06/27/90 7.7 6.6 6.8 7 7 6.9 6.5 42132.20 6511.34 3830.20 4979.26 3200 5050 9400 4700 318 280 244 356Jasp A-71 0.55 S I-44 CON 08/15/94 6.8 6.9 6.1 6.7 6.9 6128.32 11490.60 6511.34 9300 19 4900 276 250Jasp H 1.4 W RT Y ALU 03/09/62 6.9 6.9 6.9 5.4 6.9 574.53 25662.34 9575.50 8426.44 6900 2800 11 2300 590 340 950Newt I-44 E/B WEIGHST. SLD 03/10/88StCl A 3.45 W RT 13 CPE 05/01/93 5.9 6.5 6.9 6.4 6.8 6.8 45962.40 2834.35 10724.56 6894.36 3900 3700 5200 2800 778 402 0.01 0.01 0.01StCl A 4.1 W RT 13 CPE 05/01/93 4.7 7.1 5.8 6 6.6 76604.00 6128.32 6511.34 2144.91 2450 3250 4100 2325 0.01 0.01 0.02StCl AA 5.9 N RT 54 PVL 05/11/94 6.8 2719.44 3200StCl B 4.5 W RT 13 PCO 5.7 4979.26 6700 220 280StCl D 2.45 S RT A PVC 6.2 4596.24 5000 112StCl O 0.7 E RT H PCO 10/24/90 7.4 6.9 7.1 3.5 7.2 6.9 3.2 2.7 53622.80 8426.44 57453.00 6511.34 2200 3600 5800 4400 225 640 566 350 112 0.15 0.14 0.13 0.14Vern F 2.5 W RT 43 ALU 04/03/62 7.2 7.1 6.8 5.2 6.9 76604.00 38302.00 12256.64 21449.12 7900 5200 9400 5500 690 700 1100 222 0.01 0.01 0.01Dist 8Chri NN 1.05 N RT 14, DWP 09/30/94 5.6 6.8 6 6.7 17235.90 19151.00 2527.93 16086.84 8200 2300 1500 2700 0.21 0.26 0.18 0.18 0.19 0.18 0.21 0.19Chri NN 2.39 S RT 14 DWP 09/30/94 7.5 6.8 6.2 6.7 4596.24 3753.60 57453.00 12639.66 780 2700 3400 3200 0.15 0.11 0.14 0.13Chri NN 2.5 N RT 14 ES DWP 09/30/94 5.2 6.9 6.9 6.2 6128.32 6894.36 20683.08 24130.26 11 2400 3200 2400 0.12 0.13 0.14 0.11Chri NN 2.5 N RT 14 WS DWP 09/30/94 5.2 6.7 6.5 6.7 12639.66 9958.52 2298.12 29109.52 24 2400 2100 3100Lacl Z 2.3 N RT O CPE 03/02/87 7.6 5.7 6.5 6.5 6.3 6.4 7 65113.40 5745.30 21066.10 4979.26 11 12 3600 9900 1200 1000 54 0.27 0.29 0.29 0.28 0.14 0.14 0.14 0.13Lacl Z 4.3 N RT O CPE 03/02/87 6.5 5.9 6.4 6.7 5.9 72773.80 10341.54 6128.32 5362.28 10 9800 3600 3400 63 0.49 0.49 0.49 0.49Wrig M 0.3 W RT 5 PLI 09/25/94 6.5 6.3 6.5 7 6.9 7 7660.40 7277.38 7277.38 9958.52 10 5300 3700 6100 1000 850 150 1.25 1.25 1.25 1.00Dist 9Cart 60 0.1 N BL 60 E CON 06/11/92 6 6.9 6.2 6.6 8426.44 18767.98 5745.30 6800 4400 4800 249Cart 60 0.45 W RT M CON 07/09/92 6.2 6.3 6.8 12639.66 8043.42 30641.60 6500 4500 2000Cart D 1.5 S REYN CO LN ALZ 01/01/52 6.9 6.3 7 3102.46 95755.00 6511.34 7700 120 5100 518 7600 570 0.12 0.12 0.12Cart D 1.7 S REYN CO LN ALZ 01/01/52 6.8 6.1 6.5 9575.50 32556.70 0.00 2800 29 100 1300 0.09 0.09 0.09 0.09
Craw 8 1.2 W RT 19 PLI 01/01/89 6 7 6.6 6.8 6.9 6.8 11490.60 17235.90 4979.26 10150.03 14 16 16 5700 500 428 0.51 0.57 0.57 0.58 0.38 0.46 0.39
Craw 8 1.7 W RT 19 PLI 01/01/89 5.9 6 6.9 6.8 6.8 23364.22 1532.08 15320.80 18767.98 71 3400 24 2300 572 0.48 0.48 0.57 0.53 0.35 0.37 0.37
Howe K 8.8 W RT 63 PCO 04/19/90 6.9 6.2 5.3 6.4 6.6 11873.62 11873.62 6894.36 7900 23 11000 520 710 1300 216 402 0.06 0.06 0.07
Phel 63 0.11 N I-44 SLD 08/17/87
Phel 63 0.15 S I-44 SLD 08/17/87
Phel 63 N PINE ST & 63 SLD 08/17/87
Phel 63 0.05 N PINE ST SLD 08/17/87
Phel 63 0.54 N I-44 SLD 08/17/87 6.6 6.7 7.1 6.5 8043.42 ######## 13022.68 3400 100 9300
Phel 63 0.55 N I-44 SLD 08/17/87 6.8
Reyn 21 3.6 S RT D PLI 05/01/89 4.8 5.3 6.4 6.6 134057.00 ######## 149377.80 89 21 2100 236
Ripl 142 0.75 N RT H DWP 06/30/92 5.9 7.1 5.4 6.7 9575.50 4213.22 1455.48 7200 12 1050 340
Ripl H 0.8 W RT 142 ALZ 06/01/92 5.6 6.1 5.7 6.6 6.6 7660.40 10724.56 8043.42 15 25 5200 52 425 440 338
Texas38 0.6 E RT M CPE 6.7 8809.46 3700
Dist 10
Butl 51 3.7 N RT 53 ALZ 07/26/94 1.8 7.3 6.1 6.7 2.5 6.9 6.5 3064.16 29875.56 23747.24 5745.30 12 5400 2500 9300 2000 460 336 141 0.01 0.01 0.01 0.01
Butl HH 8.9 S RT 53 DWP 04/25/94 6.9 6.9 7 42132.20 12639.66 0.00 3200 2100 320
Madi C 1.3 W RT 67 ALZ 01/05/94 5.5 6.2 6.6 6.4 88094.60 91924.80 29492.54 32 28 99999 1100 2000 310 0.05 0.05 0.05
Madi C 1.4 W RT 67 ALZ 01/06/94 4.8 6.2 7.1 6.4 6.8 8426.44 9192.48 2604.54 12 17 4600 470 335 202 146 0.05 0.05 0.02
Madi C 4.7 W RT 67 ALZ 02/24/94 5.4 6.2 6.4 6.5 18767.98 14554.76 6511.34 21 37 9900 300 200 480 0.06 0.05 0.05
Madi C 4.9 W RT 67 ALZ 01/11/94 5.3 6.3 6.6 6.9 24513.28 14171.74 4213.22 22 32 8900 680 320
Madi C 6.3 W RT 67 ALZ 12/08/93 4.9 6.1 6.6 6.3 21066.10 31407.64 8426.44 30 22 5300 1850 340 198
Madi C 6.4 W RT 67 ALZ 12/08/93 5.4 6.6 6.5 13405.70 13022.68 6511.34 20 4700 5000 770 220
Perr 61 0.3 N RT D PVC 06/01/89 7.3 6.8 6.6 3064.16 68943.60 2604.54 9100 1560 8500
Ste.GeV 0.05 E RT 61 DWP 04/02/96 7 1149.06 12000
Scot W 0.85 E RT CC DWP 05/06/92 2.5 6 5.7 2.7 6.6 5745.30 12639.66 8809.46 8000 14 6900 290 200
Scot ZZ 1.7 E RT Z DWP 01/01/92 5.5 6.9 6.6 8.8 6.6 34471.80 18767.98 5362.28 5400 29 9000 62 190
Stod 51 0.3 S RT K DWP 08/01/93 1.2 6.6 6.7 1.7 6.6 6.5 18001.94 5745.30 1876.80 2800 5000 2300 244 254 206 0.10 0.10 0.10
Stod N 2.0 S RT Y DWP 07/02/90 6.8 6.2 7 9192.48 8426.44 0.00 10 1300 244
Stod TT 0.95 S RT 60 DWP 01/01/94 2.4 6.8 7 6.9 6.9 6.7 14554.76 7660.40 1149.06 3500 11 2500 186 214 218 0.10 0.09 0.10
Wayn 172 0.05 E RT 67 ALZ 03/22/94 5.3 4.5 6.8 6.5 11873.62 22981.20 8809.46 2000 8200 5600 900 260 288
Wayn 172 2.4 E RT 67 ALZ 03/22/94 5 4.9 6.8 6.8 42898.24 42132.20 32173.68 3200 25 15000 1600 1300 428
Wayn 172 3.2 E RT 67 ALZ 03/28/94 5.3 4.4 4.4 6.7 31024.62 42132.20 20300.06 49 35 21000 1600 910 318
Wayn 172 6.2 E RT 67 ALZ 03/28/94 5.5 6.7 6.5 6.7 42898.24 57453.00 23364.22 39 42 35000 6300 1600 1200 174
Wayn C 2.0 S RT 34 ALZ 04/01/93 2.3 5.5 6.4 8.2 6.5 6.8 137887.20 84264.40 11490.60 12 120 10000 4600 5100 2700 484 258 168 0.00 0.00 0.00 0.00
Wayn D 14.45 E RT 67 ALZ 10/01/93 3.5 5.8 7 8.4 6.3 91924.80 11873.62 4979.26 2700 11 5200 280 140 480 350 0.00 0.00 0.00 0.00
Wayn D 14.6 E RT 67 ALZ 10/01/93 1.2 6.4 6.8 3.1 6.6 6.7 118736.20 23364.22 12639.66 4400 13 7800 4400 490 690 326 290 45 0.00 0.00 0.00 0.00
Wayn D 14.65 E RT 67 ALZ 10/01/93 2.9 6.2 6.8 2.6 6.7 6.4 99585.20 8809.46 8809.46 4700 7200 9500 1300 2500 170 362 258 94 0.00 0.00 0.00 0.00

1
APPENDIX C

2
STATISTICAL ANALYSIS
The life span of galvanized steel pipe (GSP) was found to follow a normal
distribution. The data was separated by age and how many were replaced at that
particular age. Then each age was divided by the total number of GSP replaced thus
giving a probability of a pipe being replaced at that age. The mean and standard
deviation were found using this binomial approximation, and this was used to find
the normal approximation. This may be useful in the future for quality control,
approximating when specific culverts need to be replaced, the reliability of a specific
culvert at a certain age, and other analysis of general or specific culverts.
The charts on the following pages show graphically how the separate
distributions fit the data from their particular time period and how the time periods
relate to each other. The purpose of the diagnostic plot analysis is to test the validity
of the approximations. This is accomplished by plotting the residuals (the actual
value minus the expected value) to check for any distinct patterns (see figures 3 and
4). Since there exist no contradicting evidence we will assume the data fits the
normal approximation. The analysis will focus on the approximation for the time
period from 1940 to the present because most of the culverts in place and those being
installed will fall into this category.
It was assumed that GSP would last 50 years. Given our data, there is strong
evidence to show that GSP does not last 50 years.
The probability that the life span of a GSP is 50 years or more is 0.4%.
A 90% Confidence Interval that the life span is [32.49,46.29] years which
does not contain 50 years.

3
If a culvert does last 50 years, the probability it will fail at 50 years is 72.5%
A better assumption is that GSP will last 40 years. 40 does fall within the
above noted 90% Confidence Interval.
If a culvert lasts 40 years, the probability it will fail at 40 years is only
22.8%.
Figure 1 - Useful Life of GSP from 1900 – 1939
Figure 1 shows the normal distribution curve for GSP replaced from 1900 to 1939. The
curve indicates that the average life is approximately 60 years.

4
Figure 2 - Useful Life for GSP from 1940 - 1998
Figure 2 covers the time period of 1940 to the present. The useful life for this
time interval is about 40 years.
Figure 3: Time period: Up to 1939
Summary: There is no evidence the data does not fit the normal approximation
because no patterns are evident in the residual plots for this time period.
Conclusion: The life span of culverts during this time period is distributed
normally with: Mean life time = 59.10 years
Standard deviation = 3.450 years

5
Figure 4: Time period: 1940 - Present
Summary: There is no evidence the data does not fit the normal approximation
because no patterns are evident in the residual plots for this time period.
Conclusion: The life span of culverts during this time period is distributed
normally with: Mean life time = 39.19 years
Standard deviation = 4.075 years
Equality of means: Does the mean for pipes made before 1940 equal those made
after?
No. Hypothesis testing showed approximately zero probability that they are equal.


