Toshikazu Seto* and Yoshihide Sekimoto * Project Assistant Professor (Ph.D) Center for Spatial Information Science, the University of Tokyo Comparing the Distribution of Open Geospatial Information between the Cities of Japan and Other Countries 14th International Conference on Computers in Urban Planning and Urban Management @ MIT 1/21
Transcript
Toshikazu Seto* and Yoshihide Sekimoto
* Project Assistant Professor (Ph.D) Center for Spatial Information Science, the University of Tokyo
Comparing the Distribution of Open Geospatial Information between the Cities of Japan and
Other Countries
14th International Conference on Computers in Urban Planning and Urban Management @ MIT
1/21
Outline
• The background on this study: open data• The overview and situation of Japanese open
data cities• Comparison with open data in the
international open data cities• Conclusions
2/21
3/21
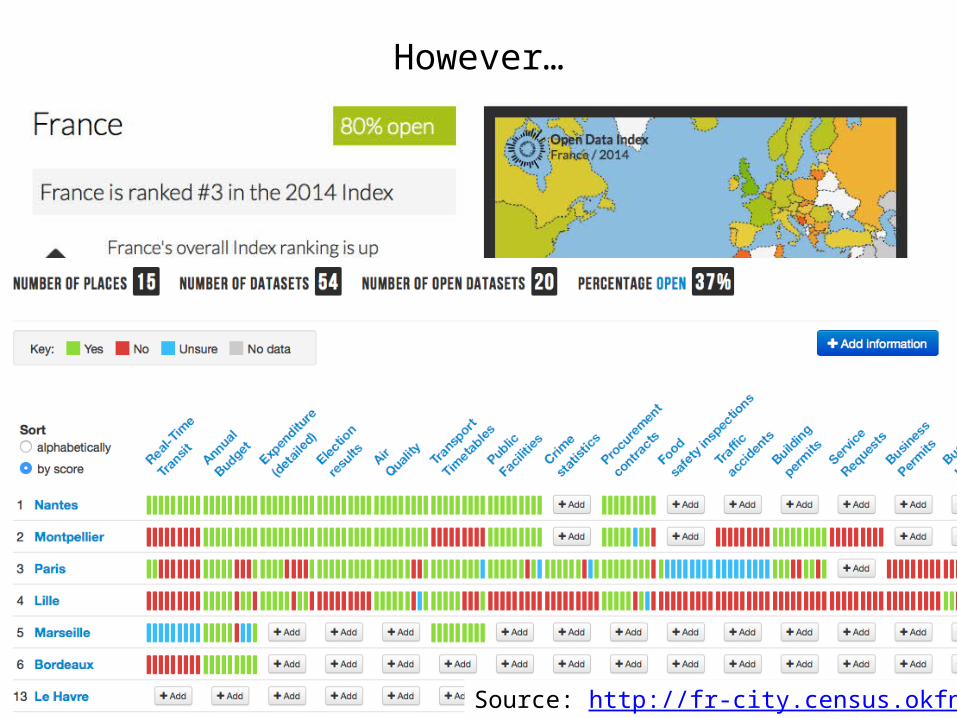
“Open means anyone can freely access, use, modify, and share for any purpose (subject, at most, to requirements that preserve provenance and openness).”
by opendefinition.org■Open government diagram
G8 Open Data Charter 2013.6.18→ High Value Data is Geospatial !
1. The focus of open data for open government and geospatial information distribution( cf. Sui, 2014; Kitchen, 2014; Johnson and Robinson, 2015)– Civic engagement with open data/government– Information distribution by open data platform
2. Development and distribution of open geospatial data has not been compared at the local government level.
• This study examined the present situation and quantitative evaluation of open geospatial data by comparing local governments in Japan and the international open data cities.
6/21
The Overview and Situation of Japanese Open Government Cities
7/21
The Distribution of Open Data by Japanese Local Governments
8/21
GIS Datasets
Open Data Distribution in Japanese Local Governments( almost embedded in a static Web page: cannot easy to count!)
9/21
The Comparison of Aggregates with Open Data Formats in Japanese Cities
★: The aggregates with “Linked Open Data 5 Star index”
10/21
GIS
CKAN Platform
The Comparison of Japanese Open Local Governments
11/21
Comparison with Open Data in the International Open Government Cities
12/21
CKAN: about 110 local governments (mainly European cities and a few Japanese cities)Socrata: many local governments in the United States
Github: Philadelphia, Chicago…
14/21
Methods
• To get all metadata of open data catalog of the individual cities using API (however, many open data cities difficult to deep access API).
• We choose 10+1 typical open data cities worldwide.
• To evaluate with quantitative status of published basic open data and open geospatial data
15/21
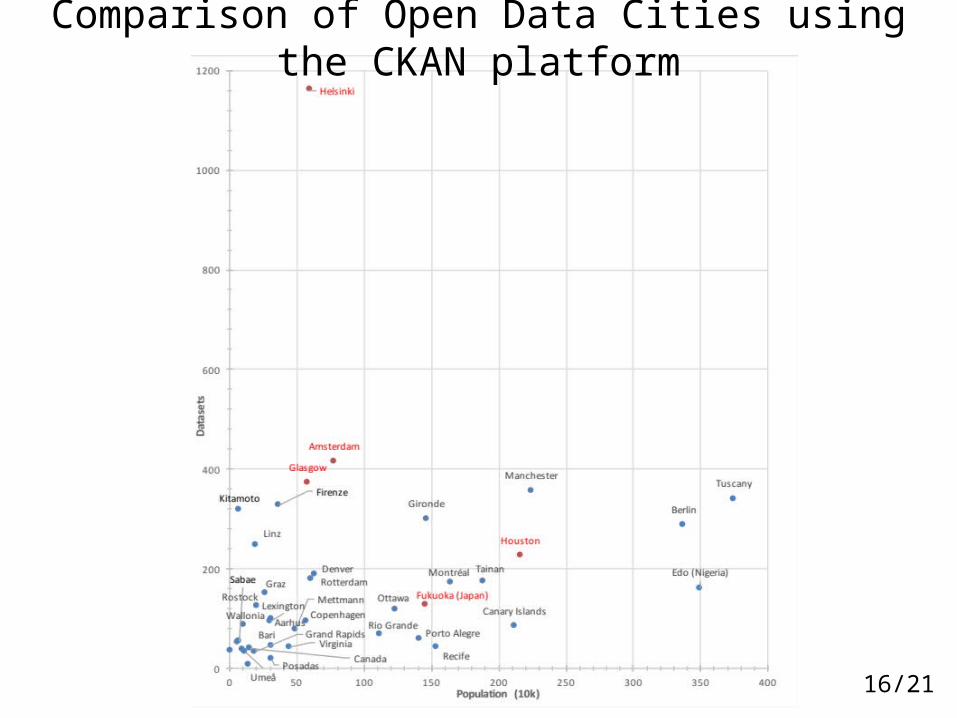
Comparison of Open Data Cities using the CKAN platform
16/21
Comparison of10+1 International Open Government Cities
Total 639 1,699 2,772 2,311 128 2,332 492 2,497 58113,45
1
(Cont’d.) Comparison of Open Data Formatof 10 International Open Government Cities
★: The aggregates with “Linked Open Data 5 Star index”18/21
Conclusions– In terms of quantity, open data provided in Japan
range from only a few to dozens of datasets; however, format types and platforms are limited.
– In contrast, local governments in the US and EU are more open to the provision of data in various formats. Some local governments in the EU have adopted the open-source data portal platform CKAN, and provide open geospatial data in various formats.
– In the US, local governments use Socrata, which allows data to be organized by format; it was found that the proportion of RDF and geospatial data was relatively high. 19/21
Future Research
– The deeply evaluation (cf. number of views and downloads of open data)• Necessary to devise or even retrieve statistics in
API for data portal– The evaluation by capture and introduction to the
civic tech application• Update frequency and the data itself (in the case
of geospatial information) creating precision scaling
• Aim for open government: is the participation of a variety of citizens and entities able to achieve this?
20/21
Thank you for your attention !Please suggest your cities situation