12
CURRENCY MATTERS

CURRENCY MATTERS
Did you know that, despite the loss to investors’ international equity portfolios during the global financial crisis, an unhedged Australian investor exposed to the falling AUD would have achieved an extra 14% compared to a 100% currency hedged investor?*
Fluctuations in the Australian dollar can cause changes to the value of your international equity investments, sometimes significant enough to put into question investors’ ability to achieve their goals, such as achieving a more stable return profile during retirement.
When to hedge and not to hedge becomes a big dilemma for investors. The challenge is to find an underpinning currency strategy for their portfolios that puts their interests at heart — one that seeks not merely to reduce risk but also improves risk-adjusted returns.
At State Street Global Advisors, we have global teams dedicated to analysing currency movements and their impact on portfolios. Our global currency team plays a critical role in helping investors in our Active Equity Solutions optimise the currency exposures of their global equity portfolio and thus, keeping them on the path toward their investment goals.
An unexpected 14% currency loss is significant to most investors. In this paper, we will set out step by step how we may mitigate such losses.
• First, we will explain the role of an investor’s base currency in portfolio construction. We will show that not only is the base currency important from a country allocation perspective, it is also true from a sector perspective.
• Second, we will discuss how an active currency management approach, based on well-researched long-term currency valuations, can be beneficial to investors in the long run. We will demonstrate that, while it is possible to remove currency risk by passive hedging (i.e. hedging a fixed proportion of the foreign holdings at all times), this may actually expose investors to increased volatility.
Our aim is to remove the burden on investors to navigate currency conundrums, with a view to add value to returns without compromising their portfolio risk characteristics.
* Using MSCI World ex Australia as proxy for International Equities exposure. See page 9.
Currency Matters
State Street Global Advisors 1

IntroductionInvesting outside of your home country involves assuming foreign currency exposure. This currency exposure needs to be considered and appropriately managed. In this article, we examine two critical aspects of managing currency in a global equity portfolio:
PORTFOLIO CONSTRUCTION
For Australian investors, the risk/return trade-off offered by countries, sectors and securities needs to be considered from an Australian dollar (AUD) perspective. Base currency matters when trying to maximize risk-adjusted returns. Low currency risk for an investor in the US, UK, Europe or Japan may not be low risk for an Australian investor.
In this article we have included some sample exposures from two actual SSGA global equity portfolios.1 Both are long-only equity portfolios seeking to deliver strong risk-adjusted total returns. One portfolio is constructed for Australian (AUD) based investors (which excludes Australian Securities) and one for US (USD) based investors. All other aspects of the process are the same; the same expected return model, the same risk model and the same portfolio construction rules.
CURRENCY HEDGING
The decision to hedge currency exposures will have a significant impact on both risk and return.
In this article we explore some of the pitfalls of using a passive hedge, and demonstrate how we believe you can achieve better risk-adjusted outcomes using a more active approach based on long-term currency valuations.
1 2
Currency Matters
State Street Global Advisors 2
PORTFOLIO CONSTRUCTIONWhy Base Currency Matters
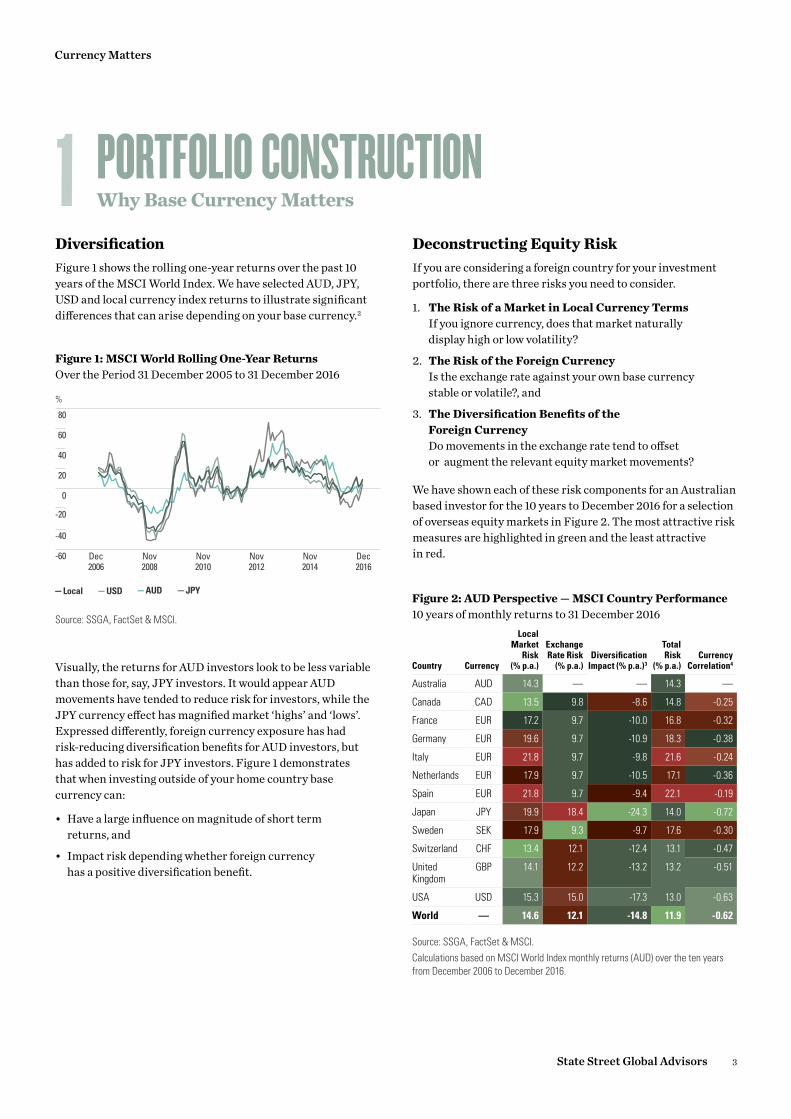
DiversificationFigure 1 shows the rolling one-year returns over the past 10 years of the MSCI World Index. We have selected AUD, JPY, USD and local currency index returns to illustrate significant differences that can arise depending on your base currency.2
Visually, the returns for AUD investors look to be less variable than those for, say, JPY investors. It would appear AUD movements have tended to reduce risk for investors, while the JPY currency effect has magnified market ‘highs’ and ‘lows’. Expressed differently, foreign currency exposure has had risk-reducing diversification benefits for AUD investors, but has added to risk for JPY investors. Figure 1 demonstrates that when investing outside of your home country base currency can:
• Have a large influence on magnitude of short term returns, and
• Impact risk depending whether foreign currency has a positive diversification benefit.
Deconstructing Equity RiskIf you are considering a foreign country for your investment portfolio, there are three risks you need to consider.
1. The Risk of a Market in Local Currency Terms If you ignore currency, does that market naturally display high or low volatility?
2. The Risk of the Foreign Currency Is the exchange rate against your own base currency stable or volatile?, and
3. The Diversification Benefits of the Foreign Currency Do movements in the exchange rate tend to offset or augment the relevant equity market movements?
We have shown each of these risk components for an Australian based investor for the 10 years to December 2016 for a selection of overseas equity markets in Figure 2. The most attractive risk measures are highlighted in green and the least attractive in red.
Figure 1: MSCI World Rolling One-Year Returns Over the Period 31 December 2005 to 31 December 2016
%
— AUD — JPY— USD— Local
-60
-40
-20
0
20
40
60
80
Dec2006
Nov2008
Nov2010
Nov2012
Nov2014
Dec2016
Source: SSGA, FactSet & MSCI.
1
Figure 2: AUD Perspective — MSCI Country Performance10 years of monthly returns to 31 December 2016
Country Currency
Local Market
Risk (% p.a.)
Exchange Rate Risk
(% p.a.)Diversification
Impact (% p.a.)3
Total Risk
(% p.a.)Currency
Correlation4
Australia AUD 14.3 — — 14.3 —
Canada CAD 13.5 9.8 -8.6 14.8 -0.25
France EUR 17.2 9.7 -10.0 16.8 -0.32
Germany EUR 19.6 9.7 -10.9 18.3 -0.38
Italy EUR 21.8 9.7 -9.8 21.6 -0.24
Netherlands EUR 17.9 9.7 -10.5 17.1 -0.36
Spain EUR 21.8 9.7 -9.4 22.1 -0.19
Japan JPY 19.9 18.4 -24.3 14.0 -0.72
Sweden SEK 17.9 9.3 -9.7 17.6 -0.30
Switzerland CHF 13.4 12.1 -12.4 13.1 -0.47
United Kingdom
GBP 14.1 12.2 -13.2 13.2 -0.51
USA USD 15.3 15.0 -17.3 13.0 -0.63
World — 14.6 12.1 -14.8 11.9 -0.62
Source: SSGA, FactSet & MSCI.Calculations based on MSCI World Index monthly returns (AUD) over the ten years from December 2006 to December 2016.
Currency Matters
State Street Global Advisors 3

The first important observation from Figure 2 is the strong diversification benefits for Australian investors when holding foreign currency. The AUD is seen by many overseas investors as a ‘high risk’ currency that responds positively to global growth and poorly to downturns. For AUD investors, this works in reverse. Foreign currencies appear ‘low risk’, responding poorly to growth environments and well to downturns. For Australian investors, movements in foreign currencies tend to be negatively correlated with movements in foreign equity markets (-0.62 in Figure 2). The ‘Currency Correlation’ column is full of negative numbers which means the ‘Diversification Impact’ has plenty of large numbers.5 This feature of the AUD pervades much of the discussion that follows and is the reason the AUD rolling returns in Figure 1 appear relatively smooth.
Figure 2 shows that low risk countries for AUD based investors can arise from any of the three risk columns. Switzerland and the US both showed relatively lower risk levels for Australian investors, but for slightly different reasons. The Swiss market had lower volatility than the US in local terms, and the variability of AUD/CHF was also lower than AUD/USD. The strongest feature of the US market however was the currency diversification. After allowing for currency diversification, the total US market risk was similar to Switzerland for AUD investors over this period.
The exchange rate risk and the currency diversification benefit change as the investor’s base currency changes. The local market risk is the only risk that remains unchanged. We have illustrated this in Figure 3, by showing the same risk analysis but from a USD perspective. The differences to Figure 2 are stark.
Figure 3 shows that the currency diversification benefits for a US investor investing overseas are limited. Unlike in Figure 2, most of the ‘Currency Correlation’ numbers are positive and so the ‘Diversification Impact’ numbers are much smaller. Japan is the only meaningfully diversifying currency. For USD investors, foreign currencies appear high risk. Movements in foreign currencies tend to be positively correlated with movements in foreign equity markets, adding to their volatility.
Figure 3: USD Perspective — MSCI Country Performance10 years of monthly returns to 31 December 2016
Country Currency
Local Market
Risk (% p.a.)
Exchange Rate Risk
(% p.a.)Diversification
Impact (% p.a.)3
Total Risk
(% p.a.)Currency
Correlation4
Australia AUD 14.3 14.6 -4.1 24.8 0.50
Canada CAD 13.5 10.5 -2.4 21.6 0.63
France EUR 17.2 10.9 -5.3 22.9 0.30
Germany EUR 19.6 10.9 -5.9 24.6 0.26
Italy EUR 21.8 10.9 -5.6 27.1 0.32
Netherlands EUR 17.9 10.9 -6.3 22.5 0.20
Spain EUR 21.8 10.9 -4.6 28.1 0.43
Japan JPY 19.9 10.5 -14.7 15.7 -0.63
Sweden SEK 17.9 12.2 -5.2 24.9 0.35
Switzerland CHF 13.4 11.7 -8.1 17.0 -0.08
United Kingdom
GBP 14.1 9.5 -5.1 18.6 0.21
USA USD 15.3 — — 15.3 —
World — 14.6 3.7 -1.7 16.5 0.45
Source: SSGA, FactSet & MSCI.Calculations based on MSCI World Index monthly returns (USD) over the ten years from December 2006 to December 2016.
Currency Matters
State Street Global Advisors 4
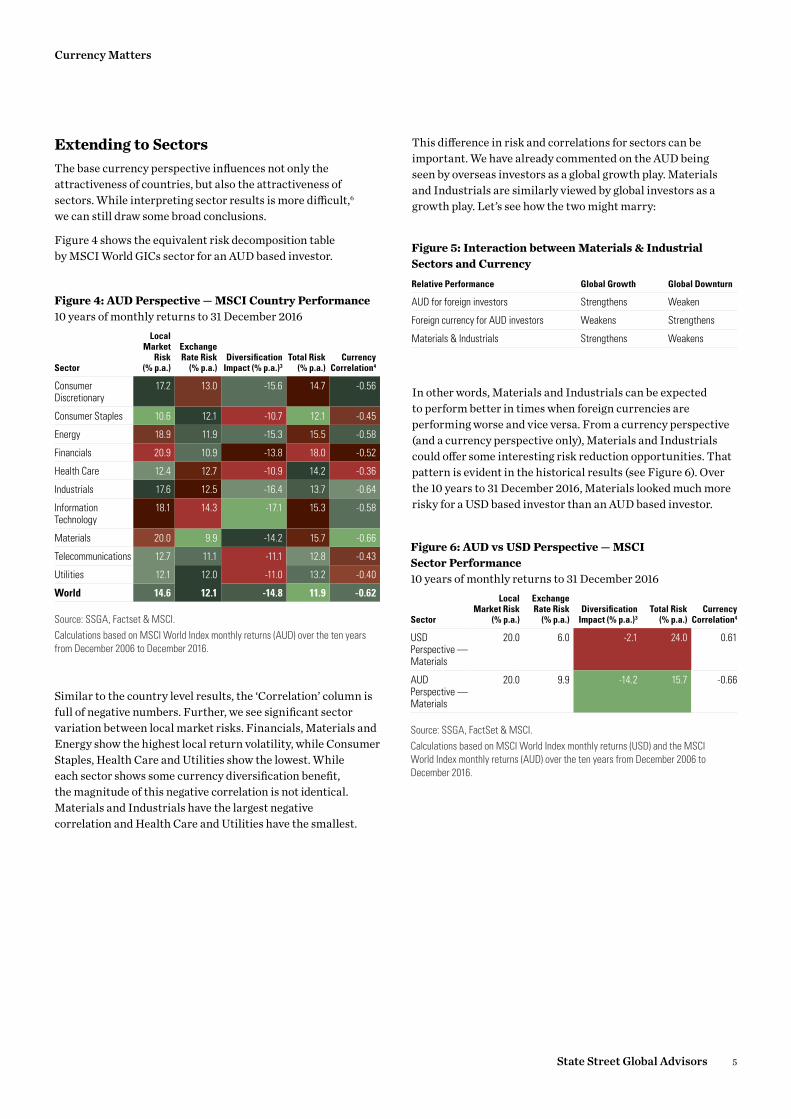
Extending to SectorsThe base currency perspective influences not only the attractiveness of countries, but also the attractiveness of sectors. While interpreting sector results is more difficult,6 we can still draw some broad conclusions.
Figure 4 shows the equivalent risk decomposition table by MSCI World GICs sector for an AUD based investor.
Similar to the country level results, the ‘Correlation’ column is full of negative numbers. Further, we see significant sector variation between local market risks. Financials, Materials and Energy show the highest local return volatility, while Consumer Staples, Health Care and Utilities show the lowest. While each sector shows some currency diversification benefit, the magnitude of this negative correlation is not identical. Materials and Industrials have the largest negative correlation and Health Care and Utilities have the smallest.
This difference in risk and correlations for sectors can be important. We have already commented on the AUD being seen by overseas investors as a global growth play. Materials and Industrials are similarly viewed by global investors as a growth play. Let’s see how the two might marry:
In other words, Materials and Industrials can be expected to perform better in times when foreign currencies are performing worse and vice versa. From a currency perspective (and a currency perspective only), Materials and Industrials could offer some interesting risk reduction opportunities. That pattern is evident in the historical results (see Figure 6). Over the 10 years to 31 December 2016, Materials looked much more risky for a USD based investor than an AUD based investor.
Figure 5: Interaction between Materials & Industrial Sectors and CurrencyRelative Performance Global Growth Global Downturn
AUD for foreign investors Strengthens Weaken
Foreign currency for AUD investors Weakens Strengthens
Materials & Industrials Strengthens Weakens
Figure 6: AUD vs USD Perspective — MSCI Sector Performance10 years of monthly returns to 31 December 2016
Sector
Local Market Risk
(% p.a.)
Exchange Rate Risk
(% p.a.)Diversification
Impact (% p.a.)3Total Risk
(% p.a.)Currency
Correlation4
USD Perspective — Materials
20.0 6.0 -2.1 24.0 0.61
AUD Perspective — Materials
20.0 9.9 -14.2 15.7 -0.66
Source: SSGA, FactSet & MSCI.Calculations based on MSCI World Index monthly returns (USD) and the MSCI World Index monthly returns (AUD) over the ten years from December 2006 to December 2016.
Figure 4: AUD Perspective — MSCI Country Performance10 years of monthly returns to 31 December 2016
Sector
Local Market
Risk (% p.a.)
Exchange Rate Risk
(% p.a.)Diversification
Impact (% p.a.)3Total Risk
(% p.a.)Currency
Correlation4
Consumer Discretionary
17.2 13.0 -15.6 14.7 -0.56
Consumer Staples 10.6 12.1 -10.7 12.1 -0.45
Energy 18.9 11.9 -15.3 15.5 -0.58
Financials 20.9 10.9 -13.8 18.0 -0.52
Health Care 12.4 12.7 -10.9 14.2 -0.36
Industrials 17.6 12.5 -16.4 13.7 -0.64
Information Technology
18.1 14.3 -17.1 15.3 -0.58
Materials 20.0 9.9 -14.2 15.7 -0.66
Telecommunications 12.7 11.1 -11.1 12.8 -0.43
Utilities 12.1 12.0 -11.0 13.2 -0.40
World 14.6 12.1 -14.8 11.9 -0.62
Source: SSGA, Factset & MSCI.Calculations based on MSCI World Index monthly returns (AUD) over the ten years from December 2006 to December 2016.
Currency Matters
State Street Global Advisors 5

Currency risk impacts vary between different sectors. For example, from a currency perspective, Health Care looks less risky for USD investors than for AUD investors (see Figure 7). Clearly base currency is important from a sector perspective as well as a country perspective.
SSGA Global Equity Portfolios PositioningIn Figure 8 we show actual country and sector weights as at 31 December 2016 for SSGA AUD8 and USD based portfolios. When the USD and AUD portfolios are constructed, allocations to stocks can vary significantly depending on the perspective taken on the base currency. For example, the weight to the US is much higher in the USD portfolio, largely because the US presents “relatively lower” total risk for the US investor. On the other hand, France (EUR) looks less attractive for USD based investors than for AUD investors, and so the Australian portfolio has a higher weight.
Figure 8 also shows subtle differences in GICs sector exposures. The Australian portfolio’s exposure to Materials and Industrials is higher than the US portfolio, consistent with the risk results in Figures 4 and 6. Similarly, the Australian portfolio’s exposure to Health Care and Utilities is lower.
Figure 7: AUD vs USD Perspective — MSCI Sector Performance10 years of monthly returns to 31 December 2016
Sector
Local Market Risk
(% p.a.)
Exchange Rate Risk
(% p.a.)Diversification
Impact (% p.a.)3Total Risk
(% p.a.)Currency
Correlation4
USD Perspective — Health Care
12.4 3.1 -1.9 13.5 0.27
AUD Perspective — Health Care
12.4 12.7 -10.9 14.2 -0.36
Source: SSGA, FactSet & MSCI.Calculations based on MSCI World Index monthly returns (USD) and the MSCI World Index monthly returns (AUD) over the ten years from December 2006 to December 2016.
Figure 8: Australian and US Global Equity Portfolio Positioning by Country as at 31 December 2016Country Currency Australian Portfolio (%) United States Portfolio (%)
Australia AUD - 1.24
Canada CAD 6.15 3.52
France EUR 4.62 1.60
Germany EUR 1.79 2.40
Italy EUR 1.29 1.19
Japan JPY 7.61 6.51
Netherlands EUR 2.41 1.13
Singapore SGD 3.55 1.02
Spain EUR 1.33 0.54
Switzerland CHF 2.85 3.16
United Kingdom GBP 0.81 0.91
United States USD 57.67 68.28
Sector Australian Portfolio (%) United States Portfolio (%)
Consumer Discretionary 6.48 6.04
Consumer Staples 15.17 16.50
Energy 0.38 0.77
Financials 14.68 12.14
Health Care 20.14 23.01
Industrials 10.72 8.81
Information Technology 4.49 7.56
Materials 7.64 2.62
Real Estate 2.71 1.76
Telecommunications 6.85 6.21
Utilities 10.73 14.58
Source: SSGA, FactSet & MSCI.Country exposures outlined above are samples only so therefore do not total 100% allocation. Countries excluded include Hong Kong, Sweden, New Zealand, Denmark and Norway.
Currency Matters
State Street Global Advisors 6

CURRENCY HEDGINGWhy Active Currency Management is Beneficial
In the analysis thus far, we have considered currency risk (i.e. volatility), but we have ignored currency returns. Currency ‘risk’ can always be removed by passive ‘hedging’, but this doesn’t always produce the best risk-adjusted returns. Given that currencies often move in very long cycles, we believe that long-term currency valuations provide a sound basis for currency hedging decisions.
What is a Hedge?Consider an Australian based portfolio that has USD 1 million in US equities. In order to ‘hedge’ the currency exposure, the manager would enter into a forward contract to sell $1m in USD and buy AUD at some future date. This forward contract would generate a profit (or loss) depending on movements in the exchange rate. The profit (or loss) would offset the currency loss (or profit) from the underlying equities.
How Effective Are Passive Hedges?A ‘passive’ or ‘static’ hedge is where the manager hedges a fixed proportion of the foreign holdings. For example, the manager might hedge 50% of the foreign currency holdings at all times. Over the past 20 years, Australians with a 100% passive hedge of international equities would have increased returns but also increased volatility (Figure 9).
However, the tendency over the last 20 years for unhedged portfolios to have lower risk is only a tendency, not a law. There have also been long periods like pre-2000, 2002 to 2007, or 2011 to 2016 where unhedged portfolios have had higher risk (see Figure 10).
Figure 9: Growth of $100 of MSCI World ex AU Indices with Various Static Hedges
0
50
100
150
200
250
300
Jan2001
Mar2004
Jun2007
Aug2010
Nov2013
Feb2017
— MSCI World ex Australia 100% Hedged (AUD)
— MSCI World ex Australia 50/50 Hedged (AUD)
— MSCI World ex Australia Unhedged (AUD)
Source: SSGA, Bloomberg. Note that the 50/50 hedged and 100% hedged indices are based on SSGA estimates and are not officially published figures from MSCI.
Figure 10: Rolling 5 Year Volatility of MSCI World ex AU Indices With and Without Currency Fluctuations
0
5
10
15
20
Dec1992
Sep1997
Jul2002
Apr2007
Feb2012
Dec2016
%
— Removing Currency Fluctuations (Hedged)— With Currency Fluctuations (Unhedged)
Source: SSGA, Bloomberg.Note that the above legends are based on MSCI World Ex Australia (Unhedged) and (Hedged) Indices.
2Currency Matters
State Street Global Advisors 7

When it comes to returns, hedging results are highly sensitive to the starting exchange rates. During the GFC (Aug 2007 to Feb 2009) the USD/AUD exchange rate, for example, fell from $0.81 USD/AUD to $0.64 USD/AUD. Had you decided to fully hedge your international equities exposure during the GFC, you would have lost an extra 14%7 as illustrated in Figure 11. In other words, an unhedged Australian investor would have gained 14% from the falling AUD — cushioning the market drawdown.
While, in hindsight, the decision to remain unhedged during the GFC looked wise, the same decision looked much less wise during the 2009 market recovery. From Feb 2009 to Dec 2009, remaining unhedged would have returned you 38% less than being fully hedged.
However, predicting short-term currency movements like those that occured during the GFC is particularly difficult — even for the experts.
So, predicting either the risk or return outcomes from passive hedging is difficult. For Australian investors, we expect fully hedged portfolios to have slightly higher risk, but there will be extended periods where that is not true. We also expect that the medium-term return of passive hedges will be highly sensitive to the starting exchange rate.
Figure 11: Total Returns of MSCI World ex AU Indices With and Without Hedging
Total Return (%)
-40
-20
0
20
40
60
n MSCI World ex Australia 100% Hedged (AUD)
n MSCI World ex Australia Unhedged (AUD)
Aug 07–Feb 09 Feb 09–Dec 09
Source: SSGA, Bloomberg.
Currency Matters
State Street Global Advisors 8

Long Term Currency CyclesSo where does that leave investors seeking the best risk-adjusted return? We believe long-term currency valuations provide a pragmatic basis for hedging. Consider the 20 year movements in the AUD/USD exchange rate and the AUD/JPY exchange rate in Figure 12. As well as showing the wide swings in the exchange rate, the chart shows SSGA’s assessment of long-term “fair value” based on economic factors like inflation, terms of trade and productivity.
Using this long term fair-value perspective, investors might fully hedge each currency when their base currency looks particularly cheap. Investors might then remove all currency hedges when their base currency looks particularly expensive. The rest is just fine-tuning the transition between extremes. Hence, the hedge ratio would be around 50% when the currency is close to fair value. This is the principle behind the SSGA Dynamic Strategic Hedging (DSH) strategy.
Figures 13 and 14 show the risk/return results over 10 year and 20 year periods for the MSCI World ex Australia Index with various hedging policies. The static hedges are represented by
the green Index, ranging from 0% to 100%. The DSH dots in Figure 13 & 14 represents MSCI World ex Australia Index combined with back-tested returns (see appendix). Over the long-term the back-tested DSH results have added significant value to returns without compromising the portfolio’s risk characteristics.
Figure 13: 10 Year Risk/Return Chart of MSCI World ex Australia Indices for Various Hedging Policies as at 31 December 2016
% Risk
% Return
11 12 13 14 1615
6
5
7
4
8
l 100% Hedged l DSHl Indexl Unhedged
Unhedged1020
30 4050 60 70 80 90 100
DSH
Source: SSGA, MSCI.Index is the various static hedge levels. For example 20 represents a static hedge of 20%. DSH is the MSCI World Ex Australia Index combined with back tested DSH returns (SSGA Proprietary, see appendix).
Figure 12: AUDJPY and AUDUSD Spot Exchange Rates and SSGA Estimated Fair Value
1996 2001 2006 2011 2016
AUDJPY
100
80
60
40
120
— Spot— Fair Value
AUDUSD
1996 2001 2006 2011 2016
0.7
0.8
0.9
1.0
0.6
0.5
0.4
1.1
— Spot— Fair Value
Source: SSGA, MSCI.
Figure 14: 20 Year Risk/Return Chart of MSCI World ex Australia Indices for Various Hedging Policiesas at 31 December 2016
% Risk
% Return
12 13 14 15
7.5
6.5
8.5
5.5
9.5
l 100% Hedged l DSHl Indexl Unhedged
Unhedged1020
30 4050 60 70 80 90 100
DSH
Source: SSGA, MSCI.Index is the various static hedge levels. For example 20 represents a static hedge of 20%. DSH is the MSCI World Ex Australia Index combined with back tested DSH returns (SSGA Proprietary, see appendix).
Currency Matters
State Street Global Advisors 9

ConclusionIn this article we have examined currency risk from two key perspectives - Portfolio Construction and Currency Hedging. When building global equity portfolios which seek to deliver strong risk-adjusted returns, we believe
1. Portfolios need to be constructed with the base currency in mind and
2. Currency exposures should be hedged using long term valuations.
1 These sample exposures have been included for illustrative purposes only and should not be used or construed as an offer or recommendation to buy or sell any Fund.
2 For clarity, not shown in Figure 1 are the EUR returns, which shows strong diversification properties and the GBP returns, which shows some but significantly less diversification benefit.
3 Calculated in this case as Total Risk – (Exchange Rate Risk + Local Market Risk).4 Currency correlation is measured as the correlation between the return
of the relevant currencies vs local currency returns.5 Currency correlations can range from -1.0 to +1.0. The worst possible
Diversification Impact is 0.0, which occurs when the Currency Correlation is +1.0.
6 Not least because each sector includes multiple currencies across multiple countries with varying weights.
7 As measured by the period between 31-August-07 to 28-February-09.8 The AUD global equity portfolio has a MSCI World ex Australia universe and the
USD global equity portfolio has a MSCI World universe.
SSGA Currency Management CapabilitiesWhile SSGA’s global equity portfolios are constructed by the Active Quantitative Equities team, the Dynamic Strategic Hedging (DSH) strategy is separately managed by our Global Currency team as a currency overlay.
SSGA’s Global Currency team is part of the Fixed Income, Currency and Cash Team; it comprises of 20 dedicated currency professionals and is located in four major financial centres (Boston, London, Sydney and Tokyo). The group includes specialist researchers who produce state-of-the-art quantitative research and enhancement of quantitative currency investment models. The collaboration between researchers and currency portfolio managers allows us to provide highly customised strategies to meet client investment objectives, using 31 different currencies, against any risk target or benchmark. As at 31 December 2016, the Global Currency team manages a total of US$133.4B in currency overlay mandates across the globe.
Currency Matters
State Street Global Advisors 10

ssga.com
For institutional and wholesale investors only. Not for use with retail investors.
State Street Global Advisors, Australia, Limited (ABN 42 003 914 225) (“SSGA Australia”) (AFSL Number 238276). SSGA Australia’s Responsible Entity is State Street Global Advisors, Australia Services Limited (ABN 16 108 671 441) (“SSGA, ASL”) (AFSL Number 274900). Registered office: Level 17, 420 George Street, Sydney, NSW 2000, Australia; T: 612 9240-7600.
The views expressed in this material are the views of SSGA’s Active Quantitative Team through the period ended 13 April 2017 and are subject to change based on market and other conditions. This document contains certain statements that may be deemed forward-looking statements. Please note that any such statements are not guarantees of any future performance and actual results or developments may differ materially from those projected.
The information contained in this document is for information purposes only. SSGA Australia and SSGA, ASL, its employees, directors and officers accept no liability for this information or any consequences from its use. No person or entity should act on the basis of any information contained in this document without taking appropriate professional advice. Nothing contained in this document constitutes an offer of, or an invitation to purchase or subscribe for interests in SSGA Australia Funds.
Derivative investments may involve risks such as potential illiquidity of the markets and additional risk of loss of principal.
Investing involved risk including the risk of loss of principal. Risk associated with equity investing include stock values which may fluctuate in response to the activities of individual companies and general market and economic conditions.
Currency Hedging involves taking offsetting positions intended to substantially offset currency losses on the hedged instrument. If the hedging position behaves differently than expected, the volatility of the strategy as a whole may increase and even exceed the volatility of the asset being hedged. There can be no assurance that the hedging strategies will be effective.
This material is of a general nature only and does not constitute personal advice. It does not constitute investment advice and it should not be relied on as such. It does not take into account any investor’s particular investment objectives, strategies, tax status or investment horizon. We encourage you to consult your tax or financial advisor. There is no representation or warranty as to the current accuracy of, nor liability for, decisions based on such information. Past performance is not a reliable indicator of future performance.
This communication is directed at institutional and wholesale clients only. Persons of any other description (including retail clients) are not entitled to rely on this communication.
The whole or any part of this work may not be reproduced, copied or transmitted or any of its contents disclosed to third parties without SSGA Australia’s express written consent.
© 2017 State Street Corporation. All Rights Reserved.ID9297-AUSMKT-3518 0617 Exp. Date: 31/07/2018
Appendix
Dynamic Strategic Hedging (DSH) Backtested Results
Backtested results are not indicative of the past or future results of any SSGA offering. The portion of results through to December 2008 represents a back-test of the DSH model, which means that those results were achieved by means of the retroactive application of the model which was developed with the benefit of hindsight. All data shown above does not represent the results of actual trading, and in fact, actual results could differ materially due to DSH’s sensitivity to all of the following factors: the base currency, combination and extent of currency exposures, timing and frequency of rebalances, and limits on the hedging range. Results of this model vary materially if these inputs are varied. Use of this model exposes you to the potential for loss as well as profit.
DSH Backtested Methodology
The Dynamic Strategic Hedge (DSH) Ratio for each local currency is applied to the MSCI World weight and the currency forward return for said local currency. This is summed across all currencies in the MSCI World Index to arrive at the DSH return.
The back-tested performance shown on Page 9 was created by the Currency Group. The historical back-tested portfolios were created using SSGA’s proprietary models. Monthly portfolios were created and returns generated were based on the model hedge ratios applied to the currency exposure of the index listed in the DSH section. The Dynamic Strategic Hedging (DSH) Ratio for each local currency is applied to the Index weight and the currency forward return for said local currency. This is summed across all currencies in the Index and added to the underlying spot return to arrive at the DSH return in the relevant home currency as mentioned earlier. The DSH backtest assumes no limitation (i.e. 0-100%) on the hedging range and monthly rebalances. The Dynamic Strategic Hedging program was back-tested using data available from January 1st, 1991 to December 31st, 2014. The results shown do not represent the results of actual trading using client assets but were achieved by means of the retroactive application of a model that was designed with the benefit of hindsight.
The back-tested performance was compiled after the end of the period depicted and does not represent the actual investment decisions of the advisor. These results do not reflect the effect of material economic and market factors on decision-making. The results do
not involve financial risk, and no hypothetical trading record can completely account for the impact of financial risks associated with actual investing. No representation is being made that any account will or is likely to achieve profits or losses similar to these being shown above. In fact, there are frequently significant differences between back-tested performance results subsequently achieved by following a particular strategy. The performance of this model varies if these inputs are varied. Unless your exposures are identical to those listed above, DSH will yield you materially different results. The back-tested performance data is reported on a gross of fees basis, but net of administrative costs. Additional fees, such as the advisory fee, would reduce the return. For example, if an annualized gross return of 10% was achieved over a 5-year period and a management fee of 1% per year was charged and deducted annually, then the resulting return would be reduced from 61% to 54%. SSGA does not manage actual assets to this strategy.
This material has been prepared or is distributed solely for informational purposes and is not a solicitation or an offer to buy any security or instrument or to participate in any trading strategy. It is not intended to supplement or replace the confidential offering memorandum and related offering materials, which should be the sole basis for making an investment.
Currency Matters


