Current and Future Satellite Radar Altimetry Current and Future Satellite Radar Altimetry Missions for Hydrology and the River&Lake Project Missions for Hydrology and the River&Lake Project and the River&Lake Project and the River&Lake Project Jérôme Benveniste Jérôme Benveniste European Space Agency Contributions from: Philippa Berry and her team at De Montfort University Peter Bauer-Gottwein, Danish Technical University Anny Cazenave & Jean-François Crétaux EGU-GIFT 2009 - BENVENISTE
Transcript
Current and Future Satellite Radar Altimetry Current and Future Satellite Radar Altimetry yMissions for Hydrology
and the River&Lake Project
yMissions for Hydrology
and the River&Lake Projectand the River&Lake Projectand the River&Lake Project
Jérôme BenvenisteJérôme BenvenisteEuropean Space Agency
Contributions from: Philippa Berry and her team at De Montfort UniversityPeter Bauer-Gottwein, Danish Technical UniversityAnny Cazenave & Jean-François Crétaux
EGU-GIFT 2009 - BENVENISTE
AbstractEGU GIFT-2009 LECTURE
Current and Future Satellite Radar Altimetry Missions for Hydrology and the River&Lake ProjectJé ô B i tJérôme BenvenisteEuropean Space Agency, Via Galileo Galilei, Frascati, RM 00044, Italy
Since the launch of the altimeters on-board ERS-1 and TOPEX/POSEIDON 17 years ago, significant advances in all facets of Radar Altimetry have resulted in a height accuracy over the open ocean to the cm level. Thanks to advances in the processing of Radar Altimetry data, results are now obtainable over surfaces for which the instruments were not designed. The Radar Altimeter was designed to operate over the oceans and continental ice caps; however echoes are now successfully being processed from within the continental landmasses Overechoes are now successfully being processed from within the continental landmasses. Over inland water bodies such as Rivers and Lakes, the measurements of both the Radar Altimeter and Radiometer are degraded by the presence of land; however it is recognized by the global community that useable results can be obtained in Continental Hydrology by dedicated reprocessing of the raw altimeter measurements and careful use of environmental corrections. The European Space Agency has launched a research initiative, "River&Lake", focused on developing two special user products, one aimed at hydrologists and the other at altimeter specialists. This paper will report upon the strategic outlook for exploiting the current and future potential of Radar Altimetry missions. Particular attention is paid to their support to Hydrology, their mission requirements and the potential evolution of the River&Lake products currently attheir mission requirements and the potential evolution of the River&Lake products, currently at the stage of a pilot demonstration experiment. Important progress have been made recently in using Satellite data for Hydrology, juxtaposed with in-situ data and the modelling effort.
http://earth esa int/riverandlake http://earth esa int/hydrospace07http://earth.esa.int/riverandlake , http://earth.esa.int/hydrospace07
Introduction
• The effective management of the Earth’sThe effective management of the Earth s inland water is a major challenge facing scientists and governments worldwidescientists and governments worldwide.
• However, whilst demand for this often scarce resource continues to grow thescarce resource continues to grow, the number and distribution of in-situ hydrological gauge stations is steadilyhydrological gauge stations is steadily falling and many catchments basins in th d l i ld ti lthe developing world are now entirely ungauged.
Introduction
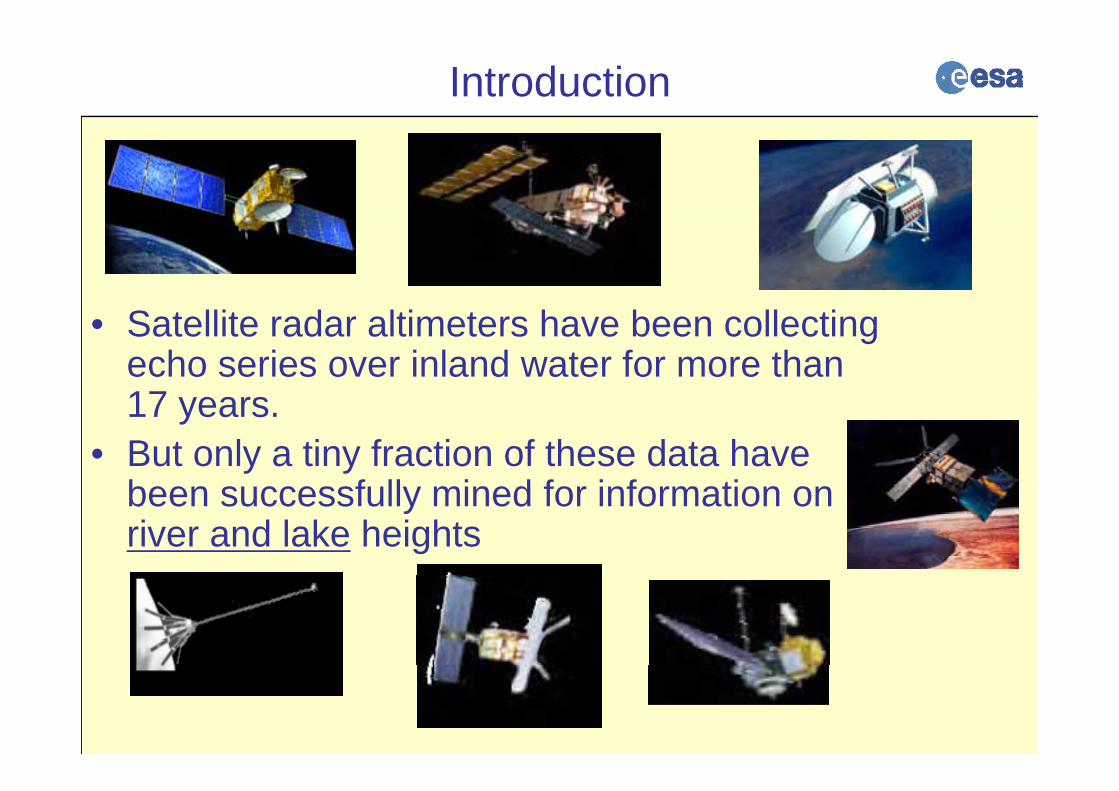
• Satellite radar altimeters have been collecting echo series over inland water for more than 1717 years.
• But only a tiny fraction of these data have b f ll i d f i f tibeen successfully mined for information on river and lake heights
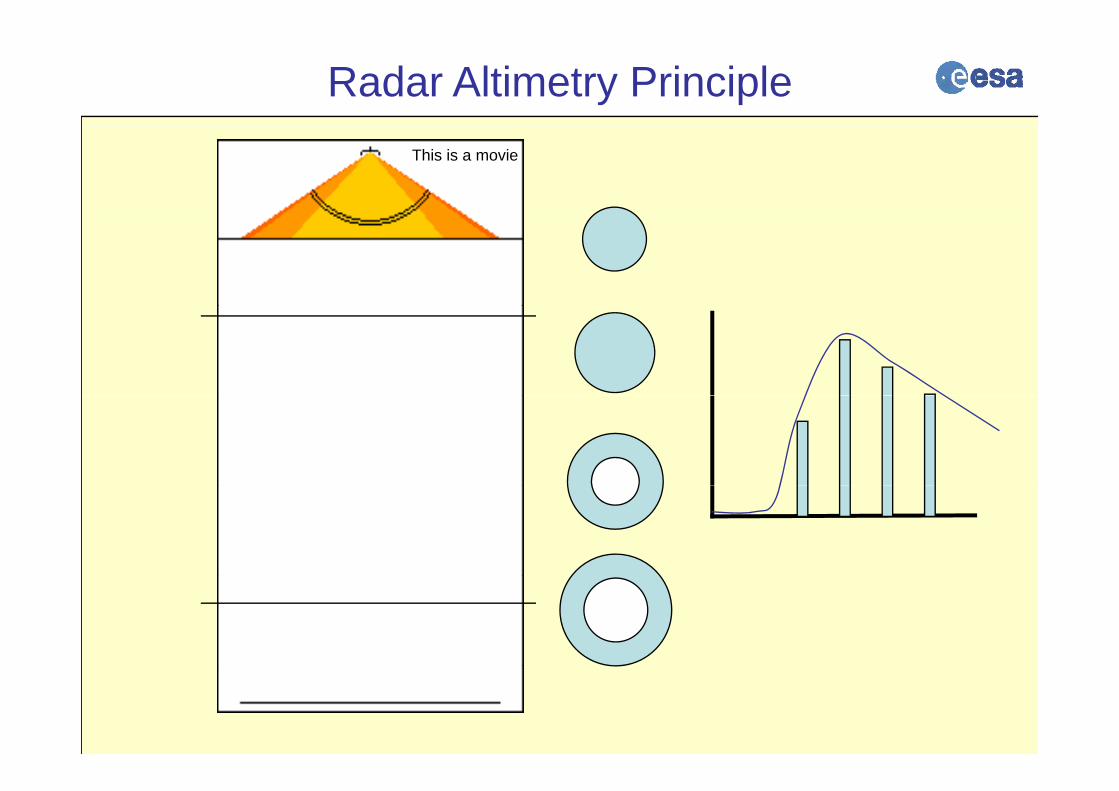
Radar Altimetry PrincipleThis is a movie
Return Power Waveform
Received powerReceived powerrelates to σ0
Slope of leading edgerelates to wave height
Trailing edge slope relatesto instrument pointing and antenna pattern
relates to wave height
Time delay relatedto satellite altitude
TIME
Tracking point in ocean mode at mid-point of leading edgeTransmitted pulse
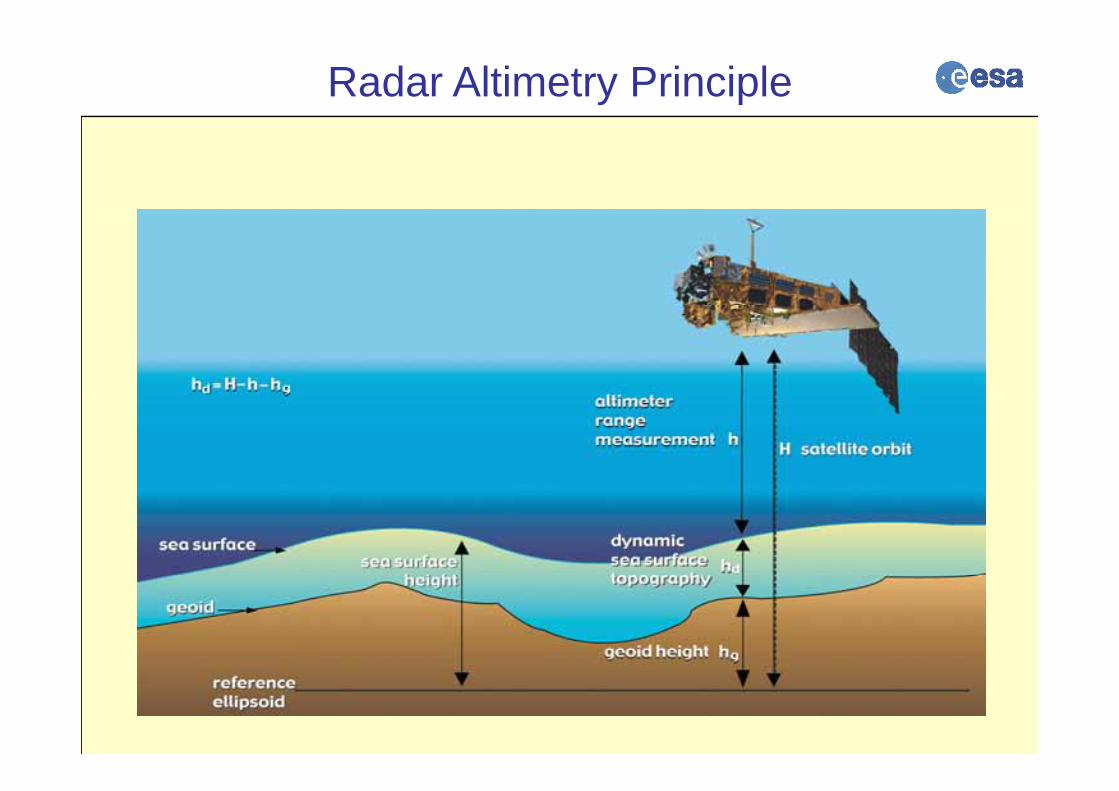
Radar Altimetry Principle
Vertical Datum Applications
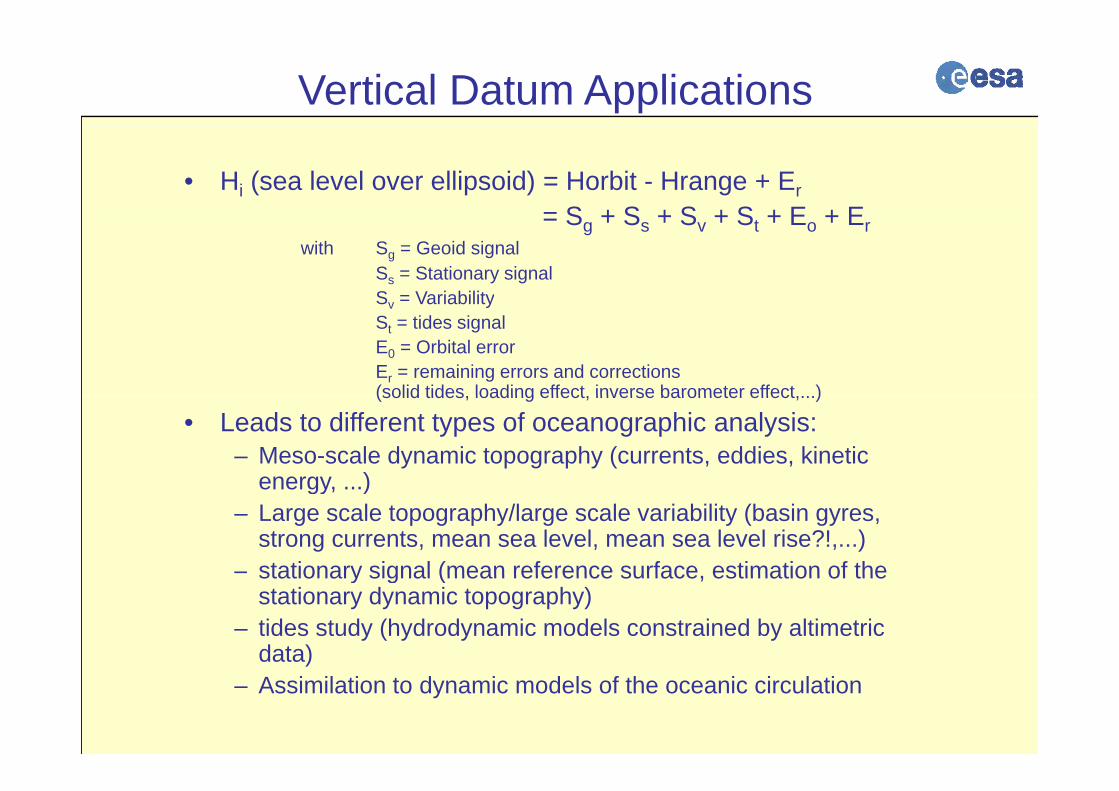
• Hi (sea level over ellipsoid) = Horbit - Hrange + Er= S + S + S + S + E + E= Sg + Ss + Sv + St + Eo + Er
• Leads to different types of oceanographic analysis:– Meso-scale dynamic topography (currents, eddies, kinetic
energy )energy, ...)– Large scale topography/large scale variability (basin gyres,
strong currents, mean sea level, mean sea level rise?!,...)– stationary signal (mean reference surface estimation of thestationary signal (mean reference surface, estimation of the
stationary dynamic topography)– tides study (hydrodynamic models constrained by altimetric
data))– Assimilation to dynamic models of the oceanic circulation
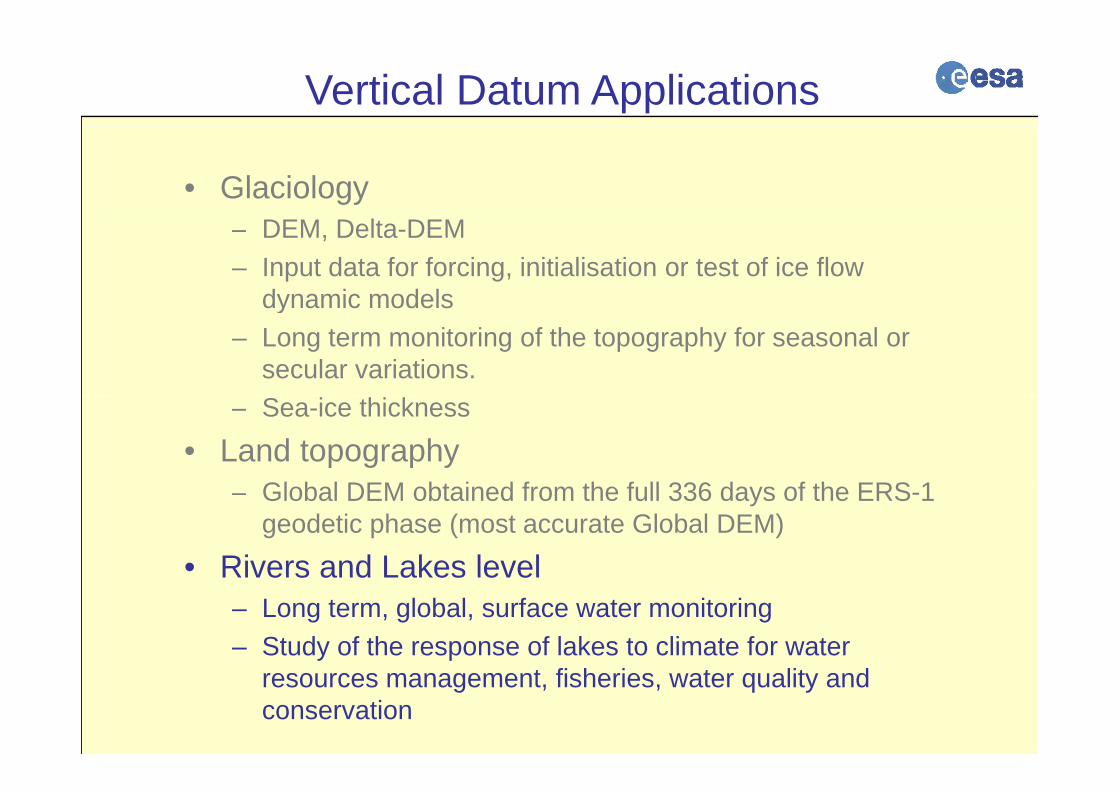
Vertical Datum Applications
• Glaciology– DEM, Delta-DEM– Input data for forcing, initialisation or test of ice flow
dynamic modelsdynamic models– Long term monitoring of the topography for seasonal or
secular variations.– Sea-ice thickness
• Land topography Gl b l DEM bt i d f th f ll 336 d f th ERS 1– Global DEM obtained from the full 336 days of the ERS-1 geodetic phase (most accurate Global DEM)
• Rivers and Lakes levelRivers and Lakes level– Long term, global, surface water monitoring– Study of the response of lakes to climate for water
resources management, fisheries, water quality and conservation
• Lower movie shows the 1800Hz 1800Hzwaveforms averaged to make QuickTime™ and a
None decompressorQuickTime™ and a
None decompressorg
the upper picture
1800H
None decompressorare needed to see this picture.
None decompressorare needed to see this picture.
1800Hz
18Hz
Inland water waveform
• Inland water waveforms showwaveforms show more coherent features than theirfeatures than their ocean counterparts.
• So averaging to1800Hz So averaging to 18/20Hz loses significantQuickTime™ and a
None decompressorQuickTime™ and a
None decompressor significant information.
1800Hz
None decompressorare needed to see this picture.
None decompressorare needed to see this picture.
1800Hz
Retracking
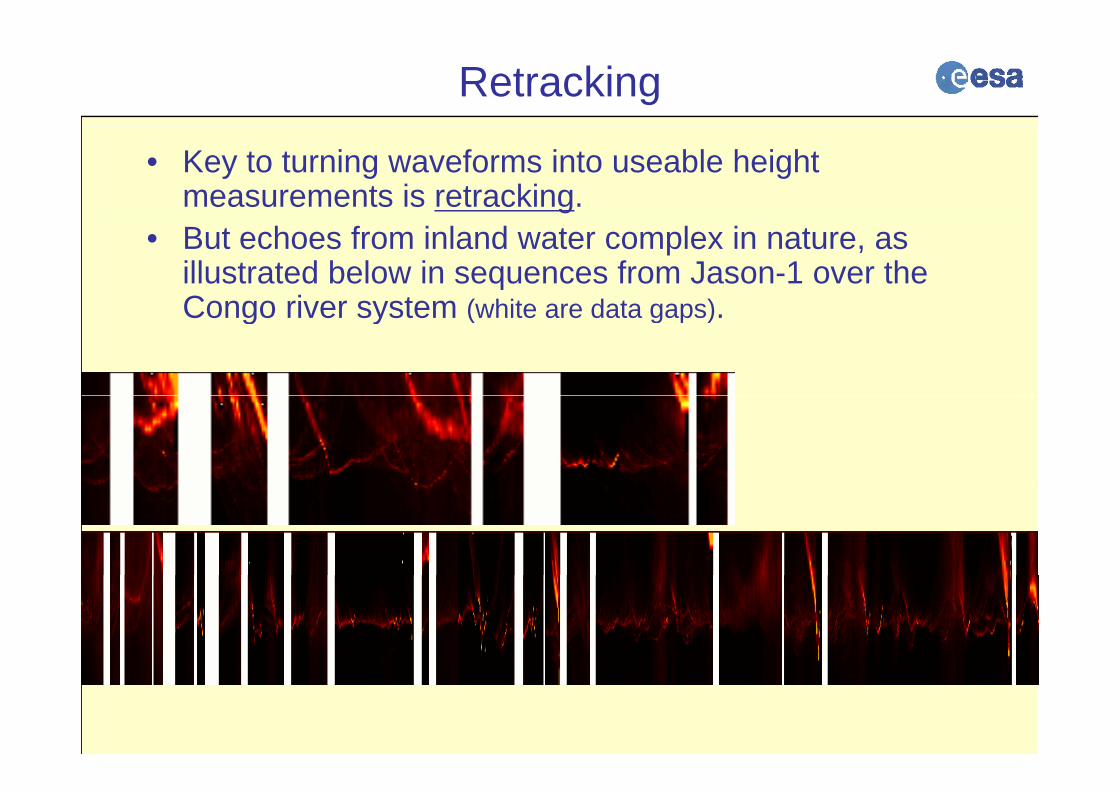
• Key to turning waveforms into useable height measurements is retracking.
• But echoes from inland water complex in nature, as illustrated below in sequences from Jason-1 over the Congo river system (white are data gaps)Congo river system (white are data gaps).
Current capabilities
So what can the current generation of altimeters i l d t ?recover over inland water?
• Huge global analysis carried out of waveform i l d t f ERS 2 TOPEXrecovery over inland water from ERS-2, TOPEX
Jason-1/2 and Envisat. E l ti h t l t 80% f l h• Every location where at least 80% of cycles have valid waveforms over the targets was identified and flaggedflagged
• Next slides show global plots for TOPEX, ERS-2 and Envisat with one red dot for each crossingand Envisat with one red dot for each crossing flagged.
TOPEX Global Targets
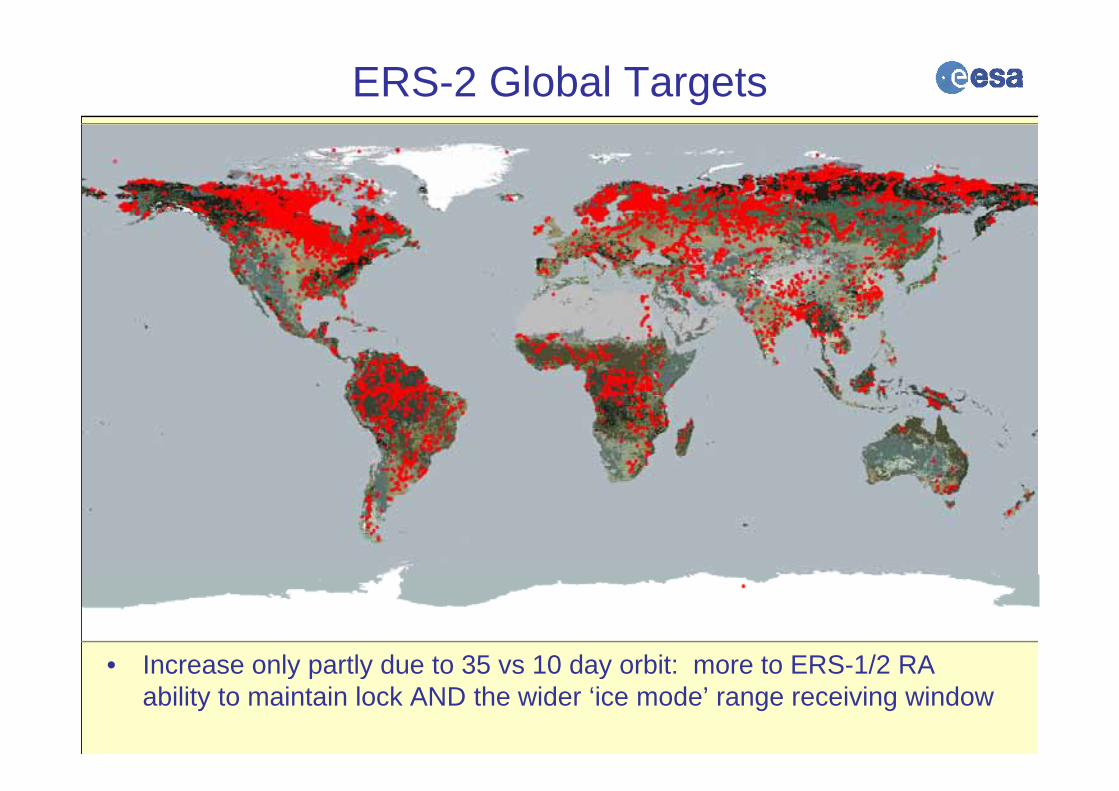
ERS-2 Global Targets
• Increase only partly due to 35 vs 10 day orbit: more to ERS 1/2 RA• Increase only partly due to 35 vs 10 day orbit: more to ERS-1/2 RA ability to maintain lock AND the wider ‘ice mode’ range receiving window
Envisat Global Targets
• Even more targets overall, although more ‘drop-out’ of waveforms (the self-adaptive tracker is mostly in high-resolution mode)
Global Mask for NRT RA-2 & Jason-1
• NRT RA-2 targets red, RA-2 & Jason-1 targets turquoise, potential targets grey blue Note: all targets acquired bypotential targets grey-blue. Note: all targets acquired by Jason-1 also seen by RA-2 (better time sampling with both).
NRT mask : Zoom on Africa
L k TLake Tana
River Congo
Lake TurkanaLake Turkana
L k M l iLake Malawi
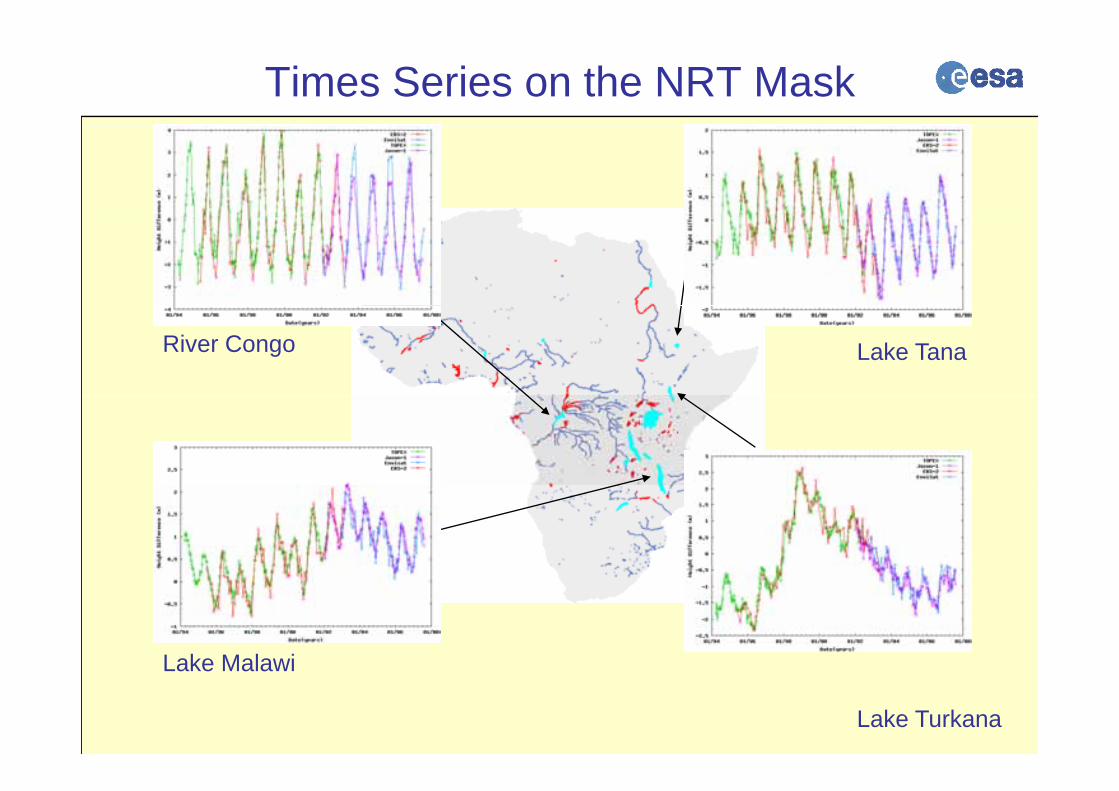
Times Series on the NRT Mask
Lake TanaRiver Congo
Lake Malawi
Lake Turkana
Lake Malawi
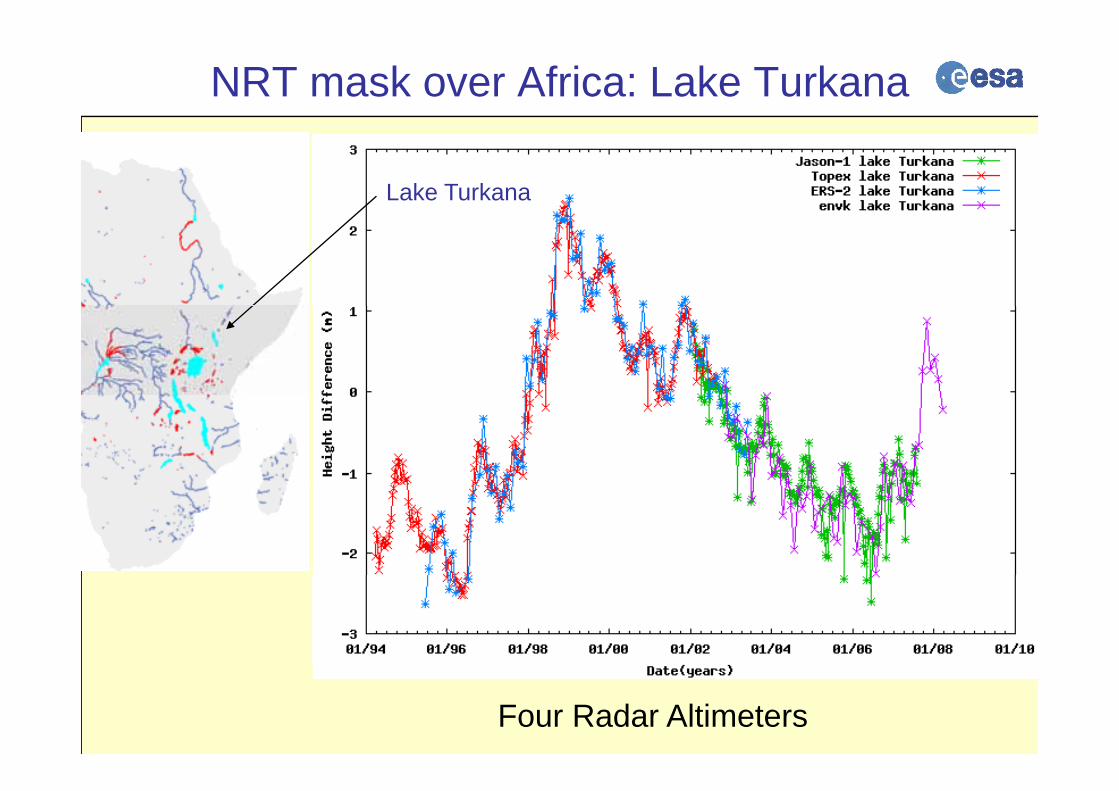
NRT mask over Africa: Lake Turkana
Lake Turkana
Four Radar Altimeters
NRT mask over Africa: Lake Malawi
Lake Malawi
Four Radar Altimeters
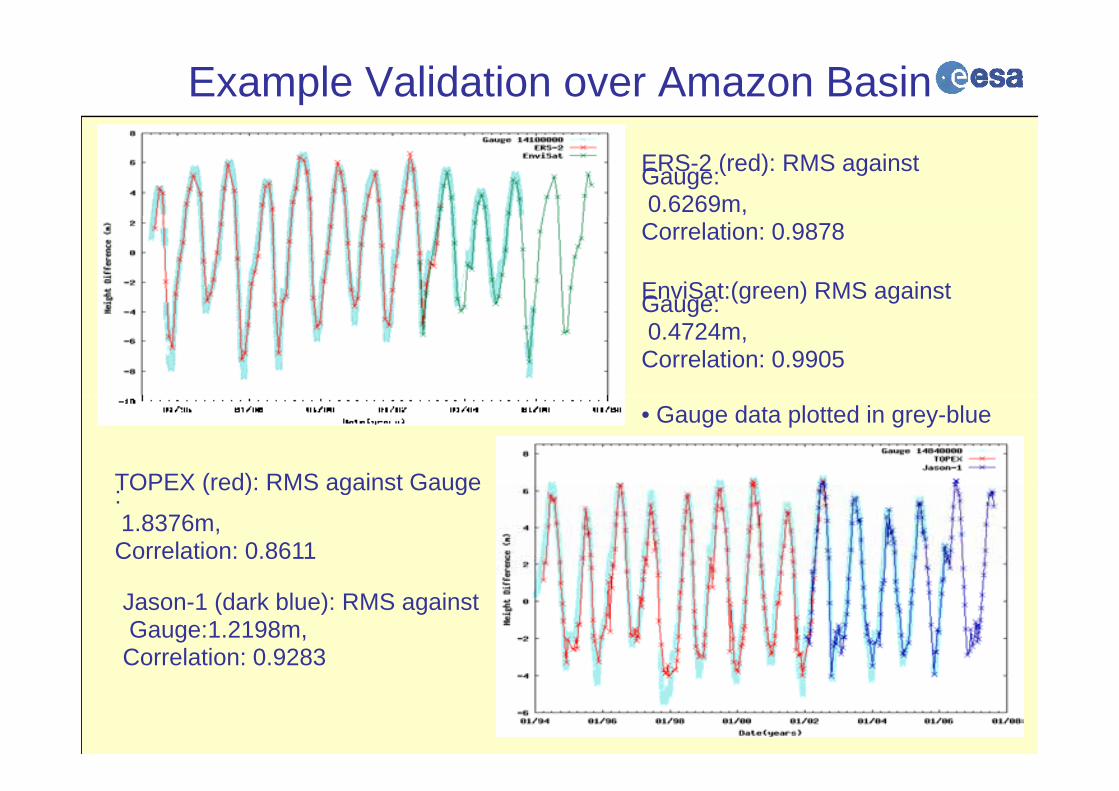
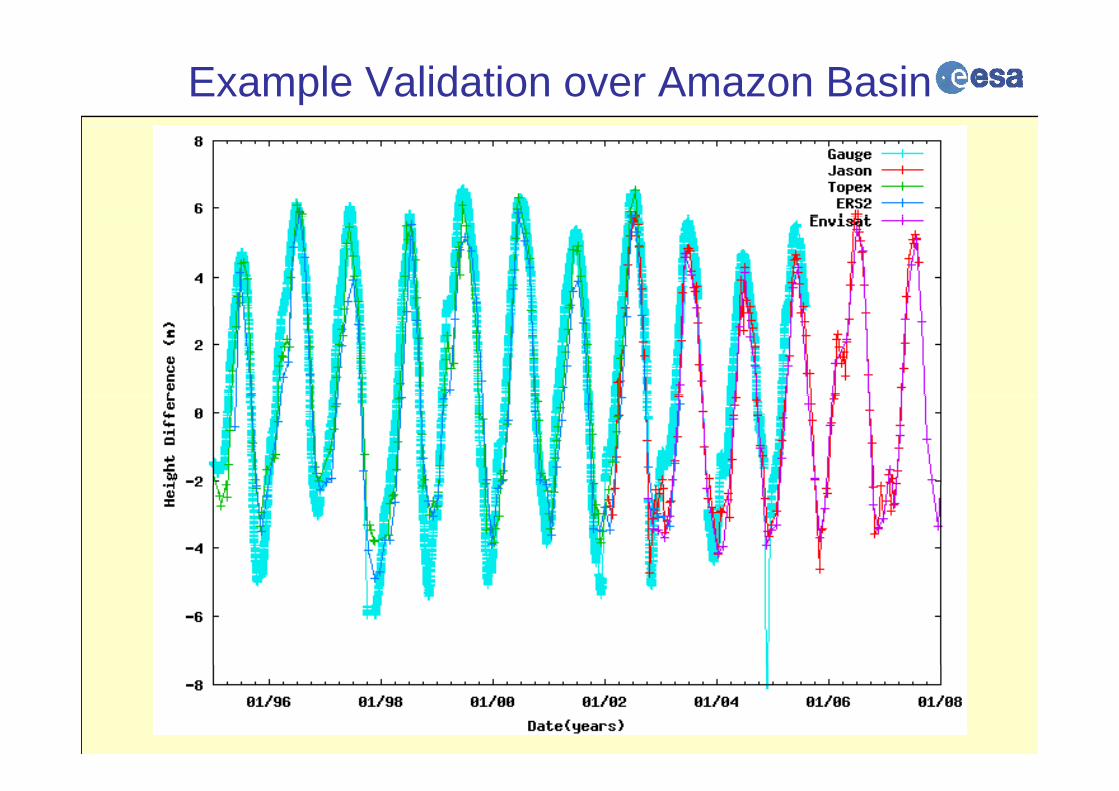
Example Validation over Amazon Basin
ERS-2 (red): RMS against Gauge:0.6269m,
EnviSat:(green) RMS against Gauge:
Correlation: 0.9878
Gauge:0.4724m, Correlation: 0.9905
• Gauge data plotted in grey-blue
TOPEX (red): RMS against GaugeTOPEX (red): RMS against Gauge :1.8376m,Correlation: 0.8611
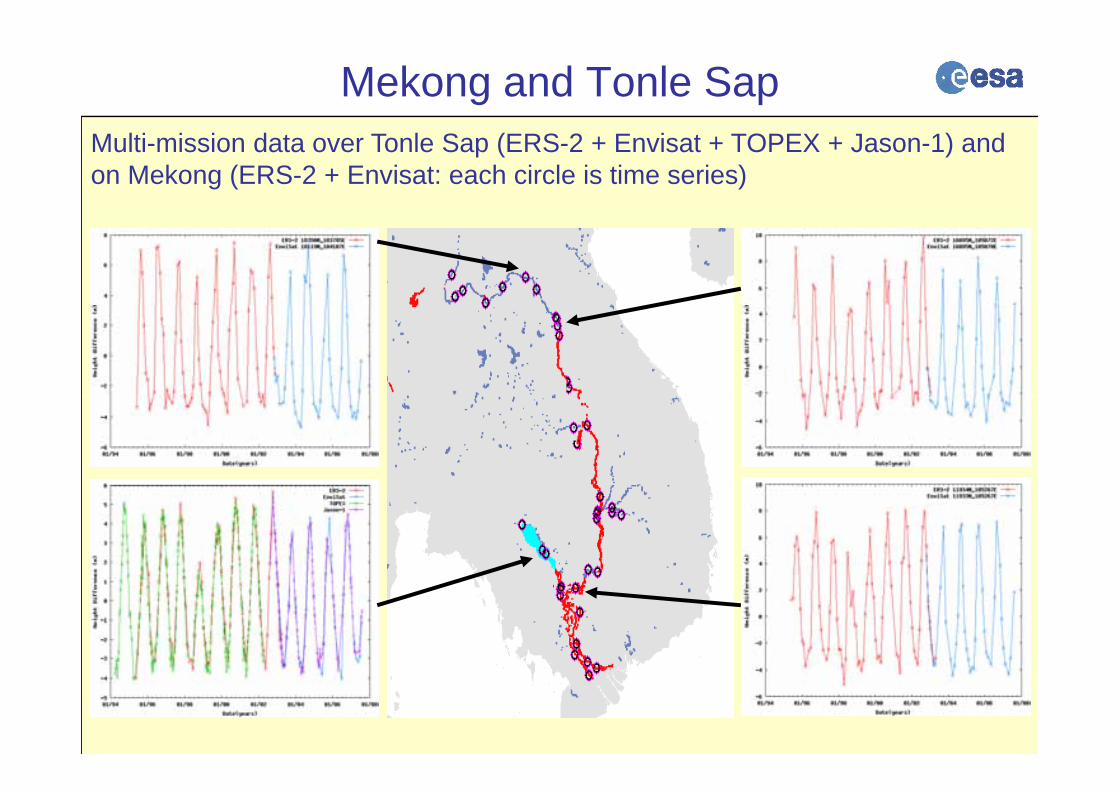
Mekong and Tonle SapMulti-mission data over Tonle Sap (ERS-2 + Envisat + TOPEX + Jason-1) and on Mekong (ERS-2 + Envisat: each circle is time series)
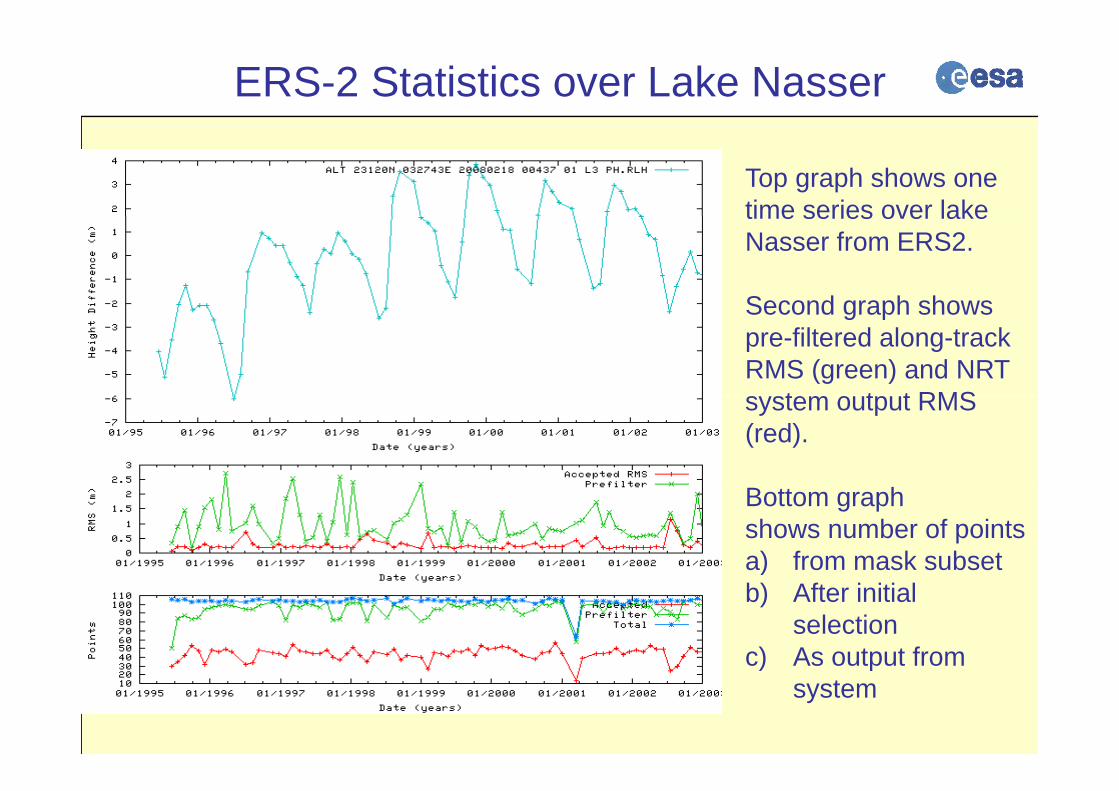
ERS-2 Statistics over Lake Nasser
Top graph shows onetime series over laketime series over lakeNasser from ERS2.
Second graph showsSecond graph showspre-filtered along-trackRMS (green) and NRT
t t t RMSsystem output RMS(red).
Bottom graphshows number of pointsa) from mask subset)b) After initial
selectionc) As output fromc) As output from
system
Envisat Statistics over Lake Kariba
Statistics for Envisat over Lake Kariba
Plots as last slideslide
Note low loss of waveforms but reductionbut reduction in RMS
TOPEX Statistics over Lake TanaStatistics for TOPEX from Lake TTana.Again, note substantialsubstantial improvement in along-track RMS gafter system processing and
t kiretracking
More waveformsMore waveforms rejected from TOPEX but RMS improves dramatically
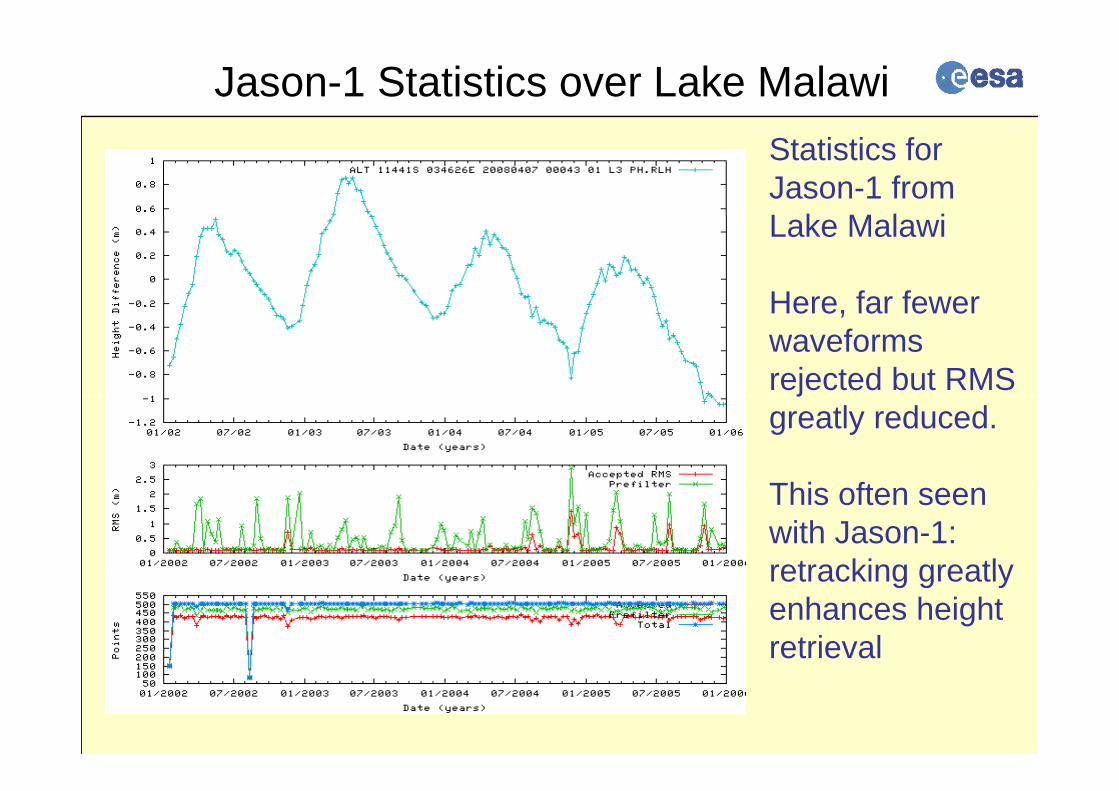
Jason-1 Statistics over Lake MalawiStatistics for Jason-1 from L k M l iLake Malawi
Here far fewerHere, far fewer waveforms rejected but RMS jgreatly reduced.
Thi ftThis often seen with Jason-1: retracking greatlyretracking greatly enhances height retrieval
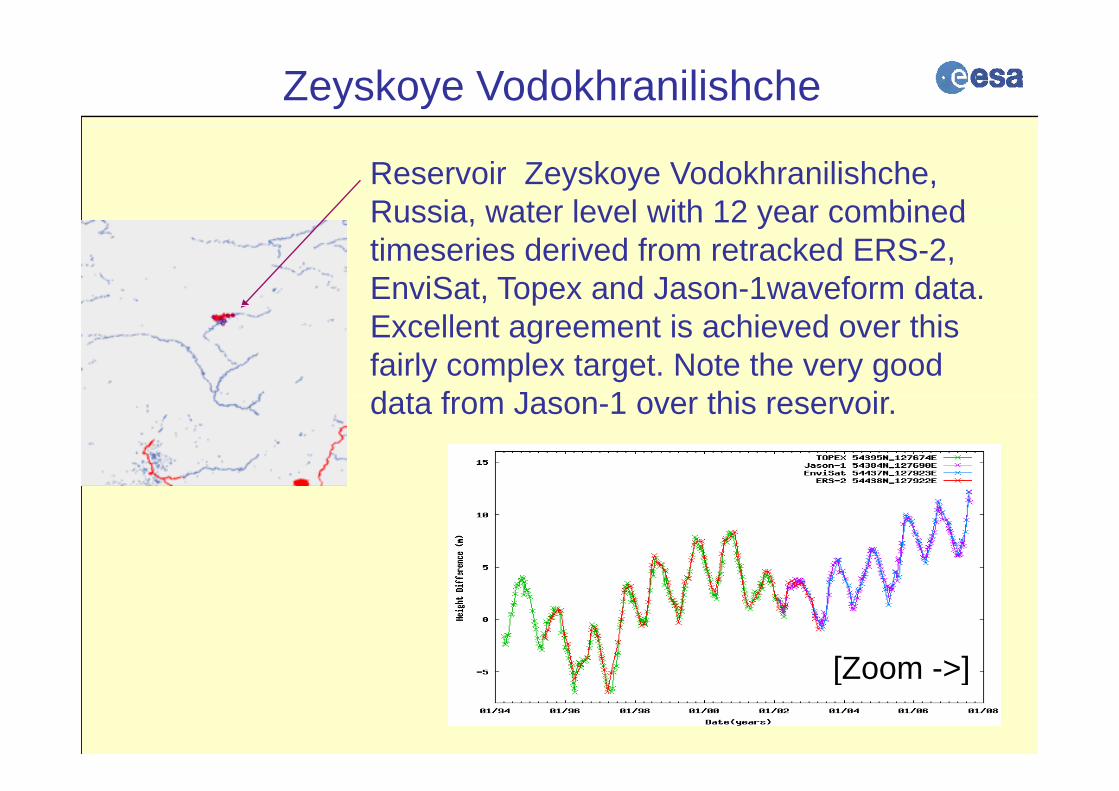
Zeyskoye Vodokhranilishche
Reservoir Zeyskoye Vodokhranilishche, Russia water level with 12 year combinedRussia, water level with 12 year combined timeseries derived from retracked ERS-2, EnviSat, Topex and Jason-1waveform data. Excellent agreement is achieved over this fairly complex target. Note the very good d t f J 1 thi idata from Jason-1 over this reservoir.
[Zoom >][Zoom ->]
Zeyskoye Vodokhranilishche
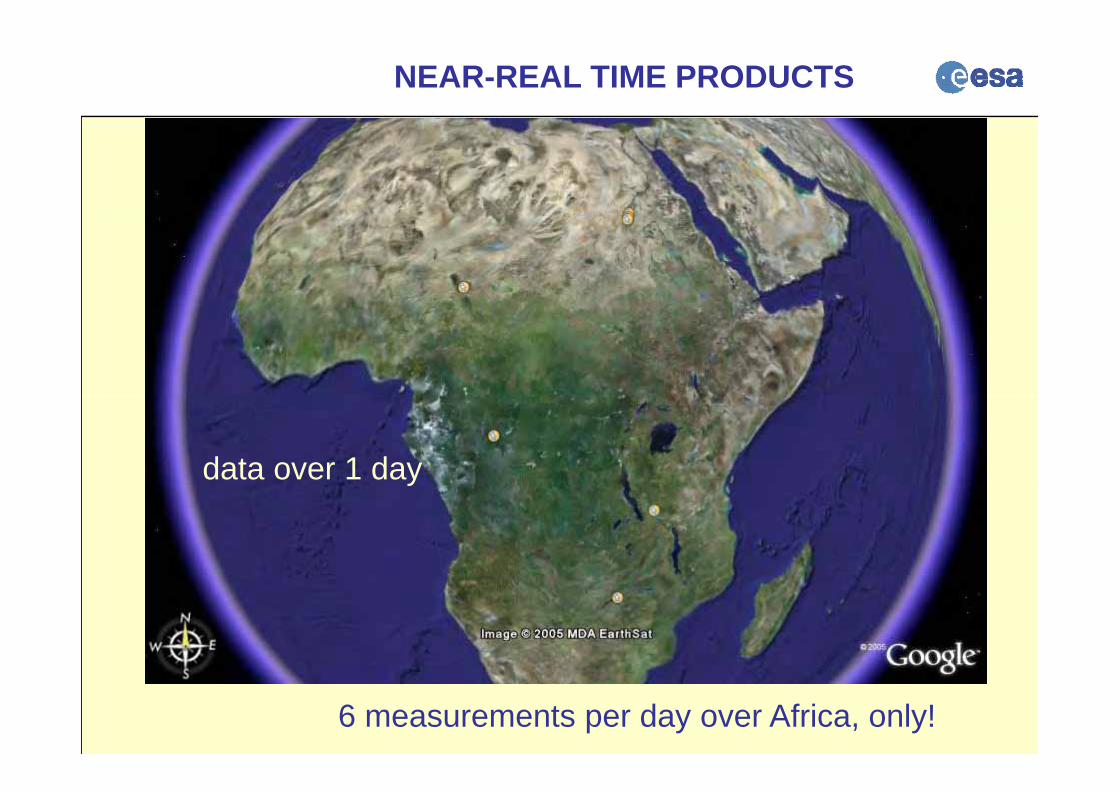
NEAR-REAL TIME PRODUCTS
data over 1 dayy
6 measurements per day over Africa, only!
NEAR-REAL TIME PRODUCTS
data over 1 dayAll Data generated in ygNear Real Time over a 35-day cycle
Location of data since 25 October
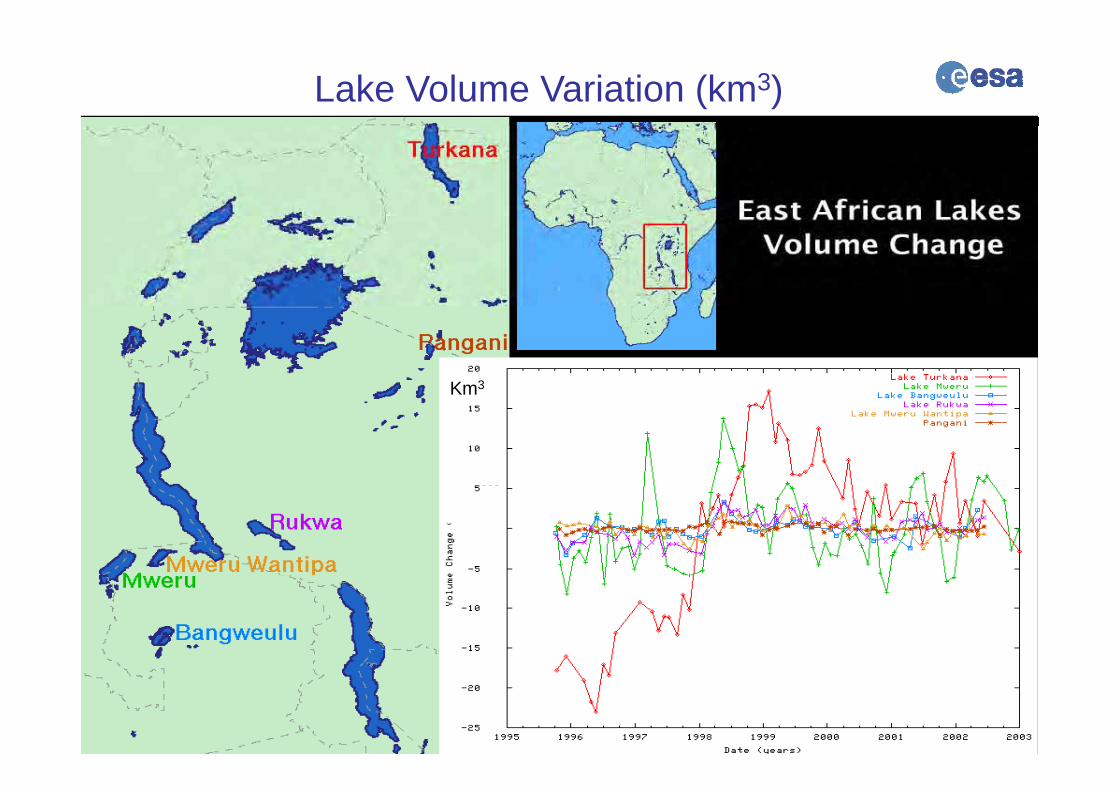
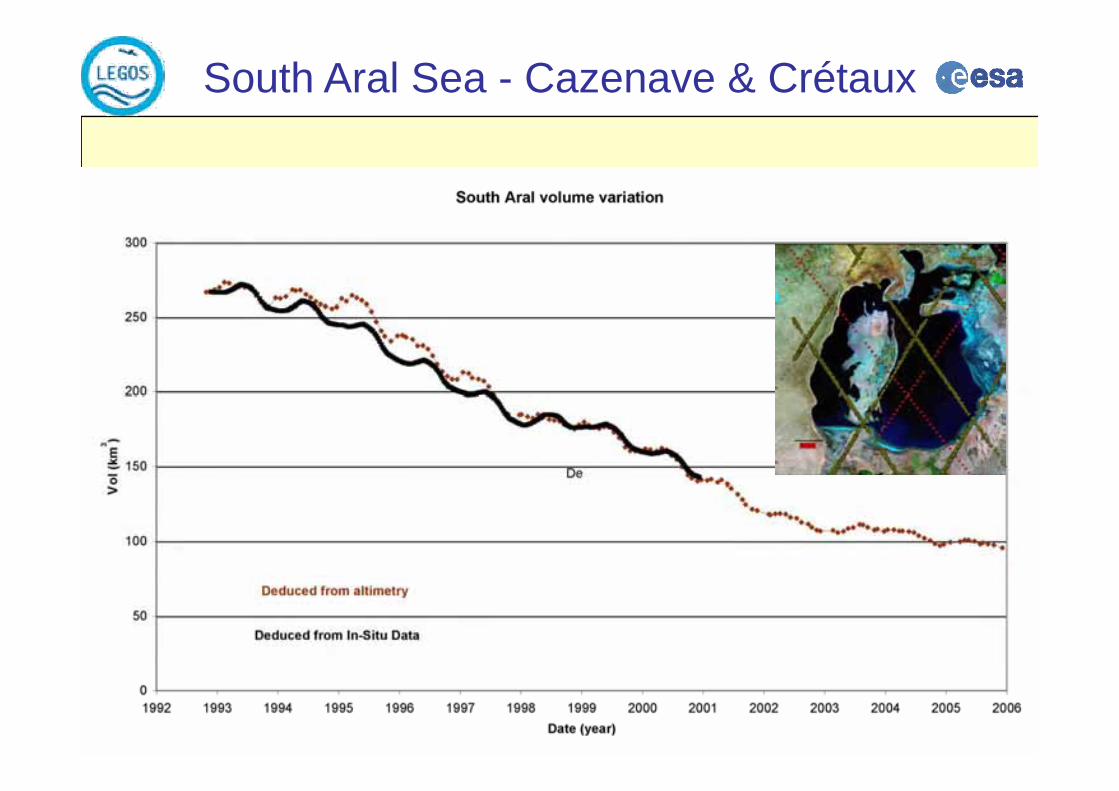
Lake Volume Variation (km3)
Km3
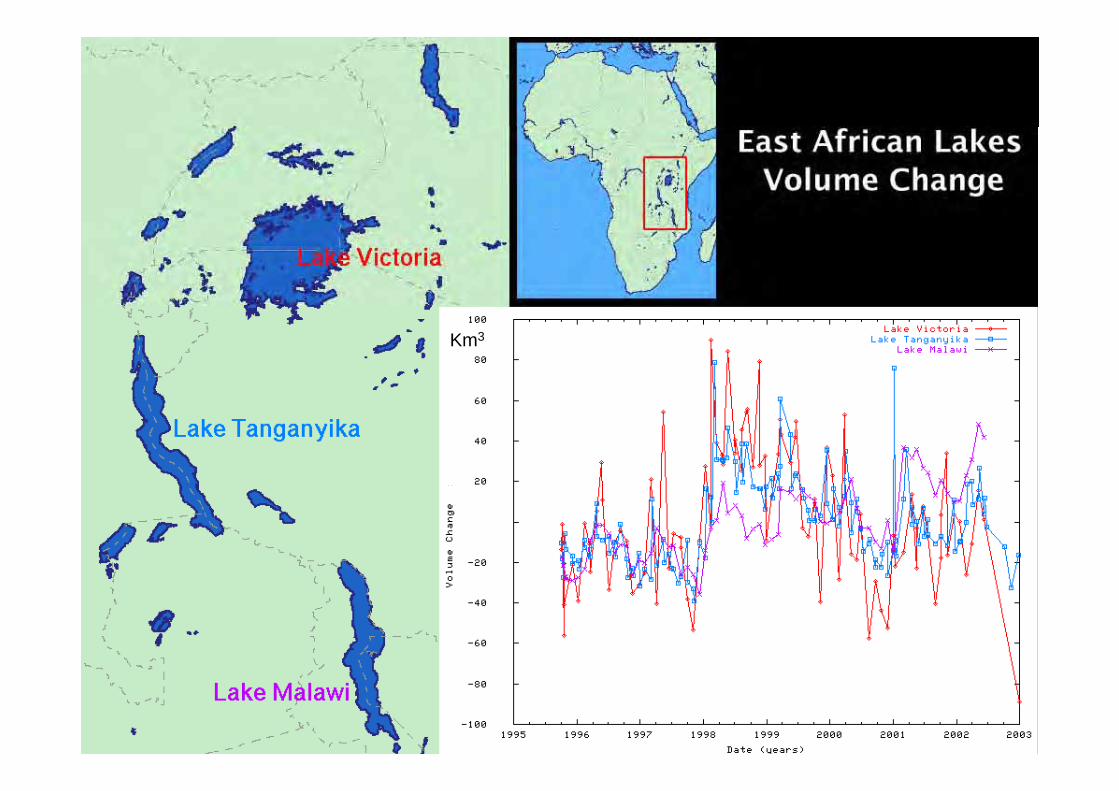
Lake Volume Variation (km3)
Km3
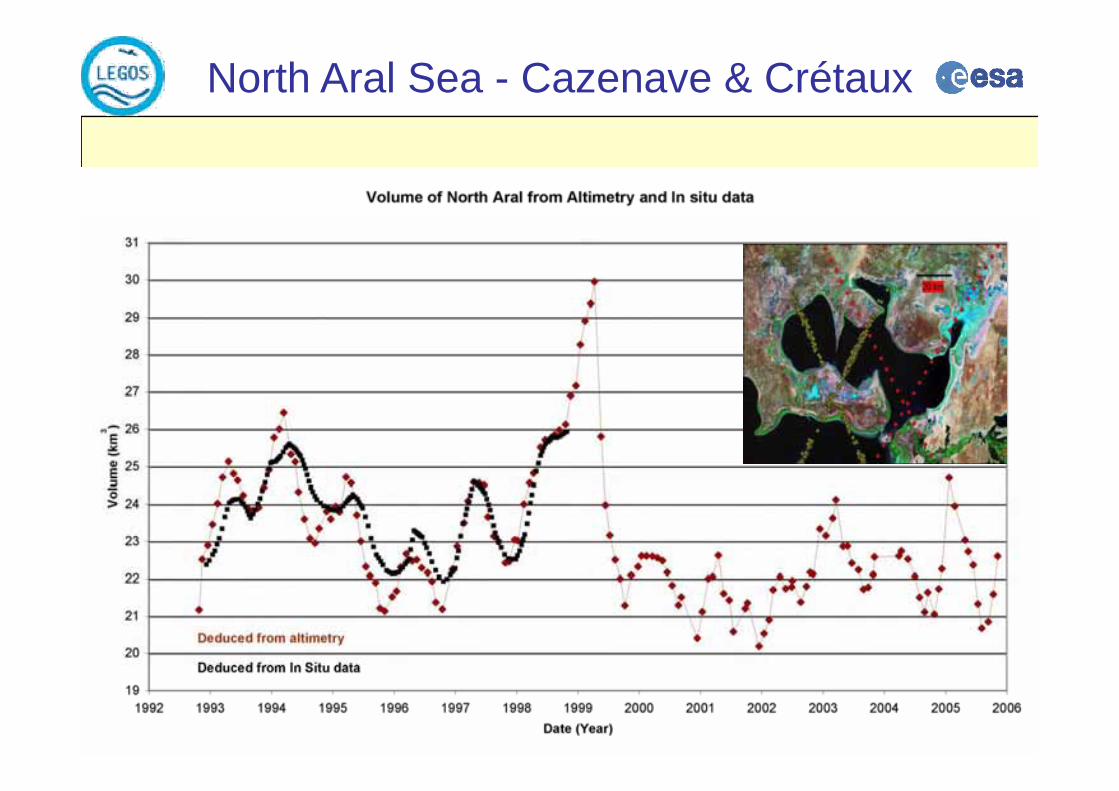
North Aral Sea - Cazenave & Crétaux
South Aral Sea - Cazenave & Crétaux
Syr Darya Modeling and Assimilation
The Syr Darya River Basin is shared between the four central Asian republics of Kyrgyzstan, Tajikistan, Uzbekistan and Kazakhstan. The total surface area of the Basin is 780 000 km2 (below left) The runoff regime in the basin is snow meltBasin is 780,000 km2 (below left). The runoff regime in the basin is snow-melt dominated and most of the runoff is generated in the mountainous parts of the catchment, which rise to altitudes of more than 7000 meters above mean sea level. The Syr Darya river is the Northern tributary to Lake Aral and contributed aboutThe Syr Darya river is the Northern tributary to Lake Aral and contributed about 30% to the total inflow into Lake Aral in the near-natural state.
Locations ofLocations of altimeter timeseries: EnviSat (light blue), ERS2 (pink) Topex (gold) and Jason-1 (green).
Thi t f th j t ill d l th S D i
This part of the project will model the Syr Darya river basin, incorporating multi-mission satellite radar altimetry
Syr DaryaLocations of altimeter timeseries: •EnviSat (light blue)EnviSat (light blue), •ERS2 (pink) •Topex (gold) and •Jason 1 (green)•Jason-1 (green).
Syr Darya
ERS-2 HeightERS 2 Height
Zambesi Modeling and Assimilation • The Zambezi River is the fourth largest in Africa, flowing
eastward for more than 2’800 km from the Kalene Hills in northern Zambia to its mouth at the Indian Ocean in Mozambique. It has an approximate catchment size of 1’570’000 km2.
• One of Africa’s most heavily dammed river systemsy y
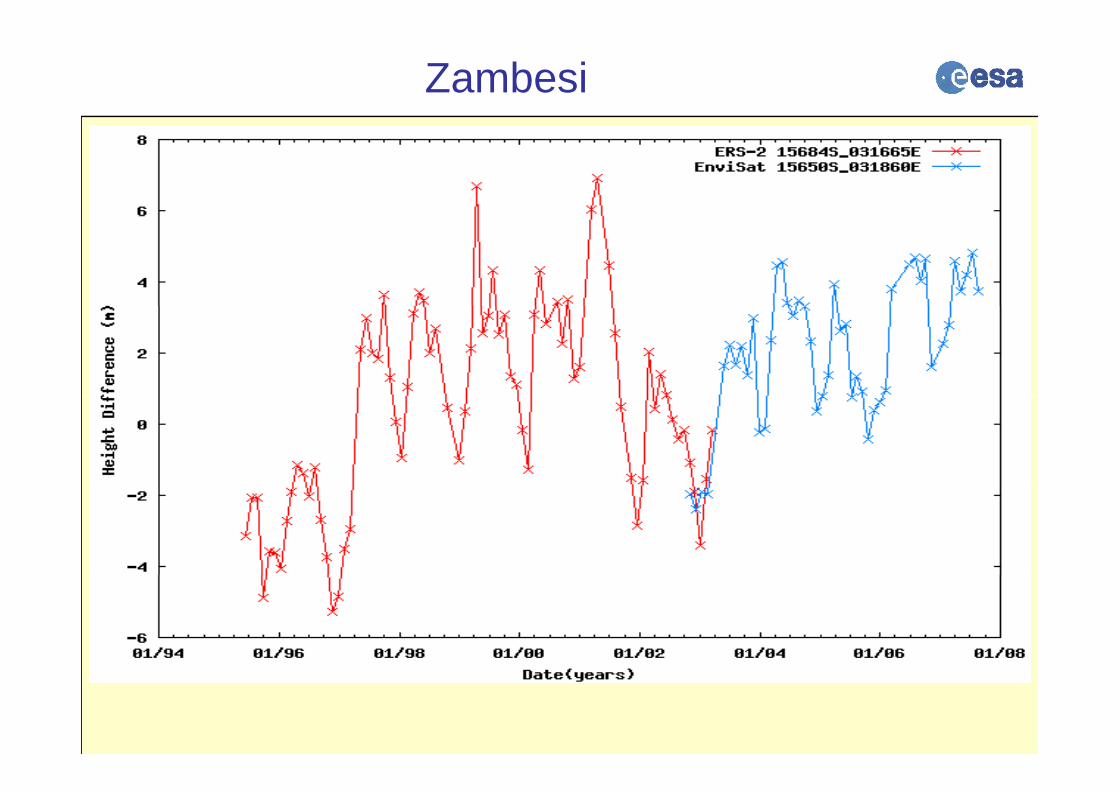
Again, combined timeseries from ERS2/EnviSat and Topex/Jason 1ERS2/EnviSat and Topex/Jason-1 (where possible!) will be used in modeling this river basin. Below are
bi d ERS2/E iStwo combined ERS2/EnviSat timeseries over the Zambesi.
Zambesi
• The Zambezi River is the fourth largest in Africa, flowing eastward for more than 2’800 km from the Kalene Hills in northern Zambia to its mouth at the Indian Ocean innorthern Zambia to its mouth at the Indian Ocean in Mozambique. It has an approximate catchment size of 1’570’000 km2.
• One of Africa’s most heavily dammed river systems• One of Africa s most heavily dammed river systems
Zambesi
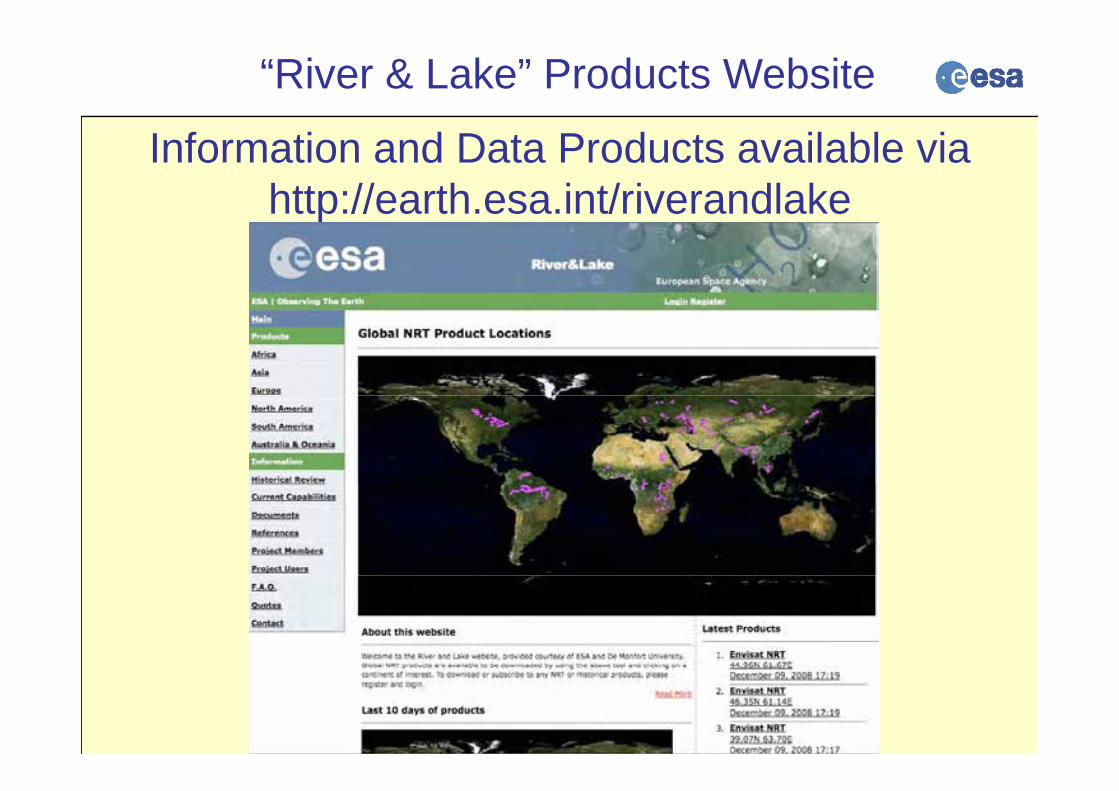
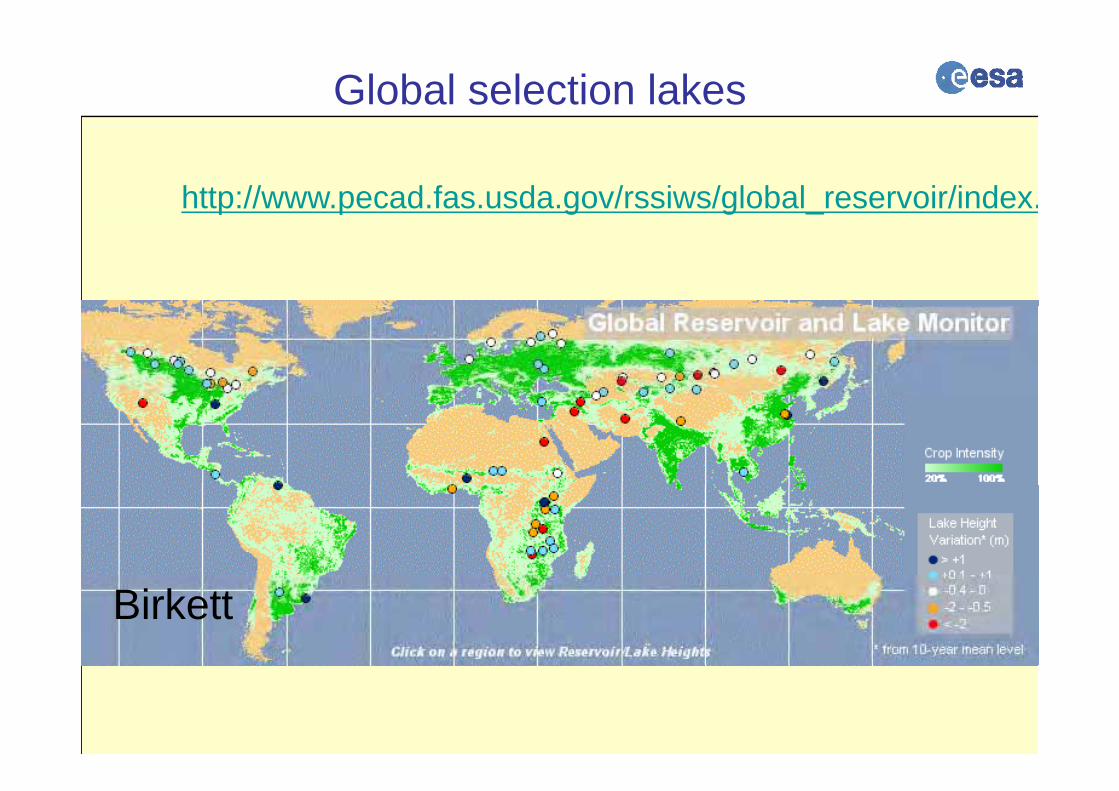
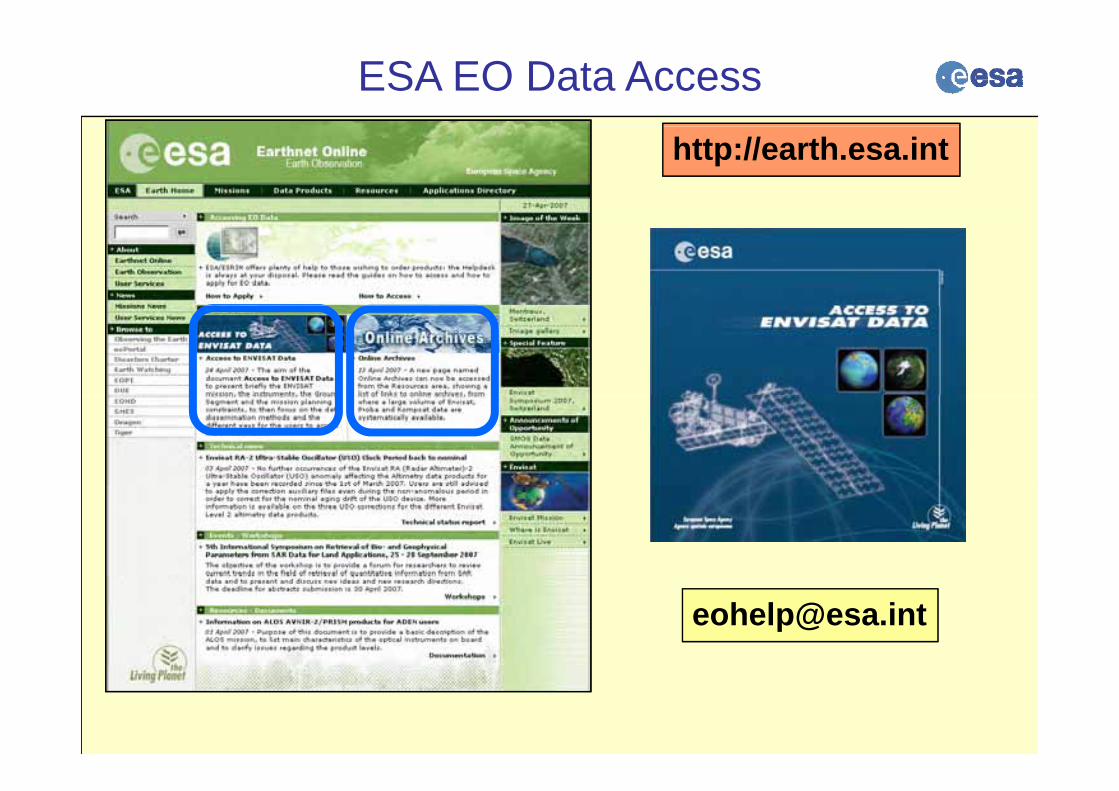
“River & Lake” Products Website
Information and Data Products available viahttp://earth.esa.int/riverandlake p
SWAT: Soil & Water Assessment ToolSWAT is a public domain model actively supported by the USDA Agricultural Research Service at the Grassland, Soil and Water Research Laboratory in Temple, Texas, USA.http://www.brc.tamus.edu/swat/
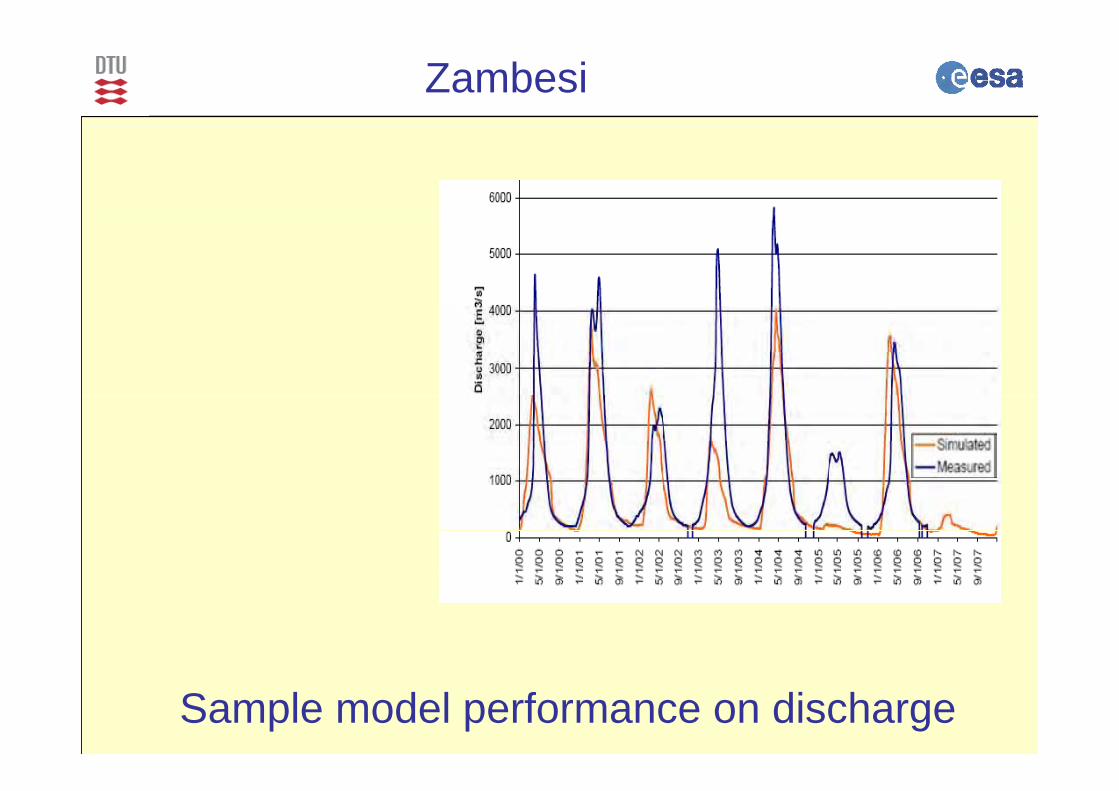
Zambesi
Sample model performance on discharge
Zambesi
visual comparison of 1 river-crossing stage and catchment dischargenext step is to model stage-discharge relations
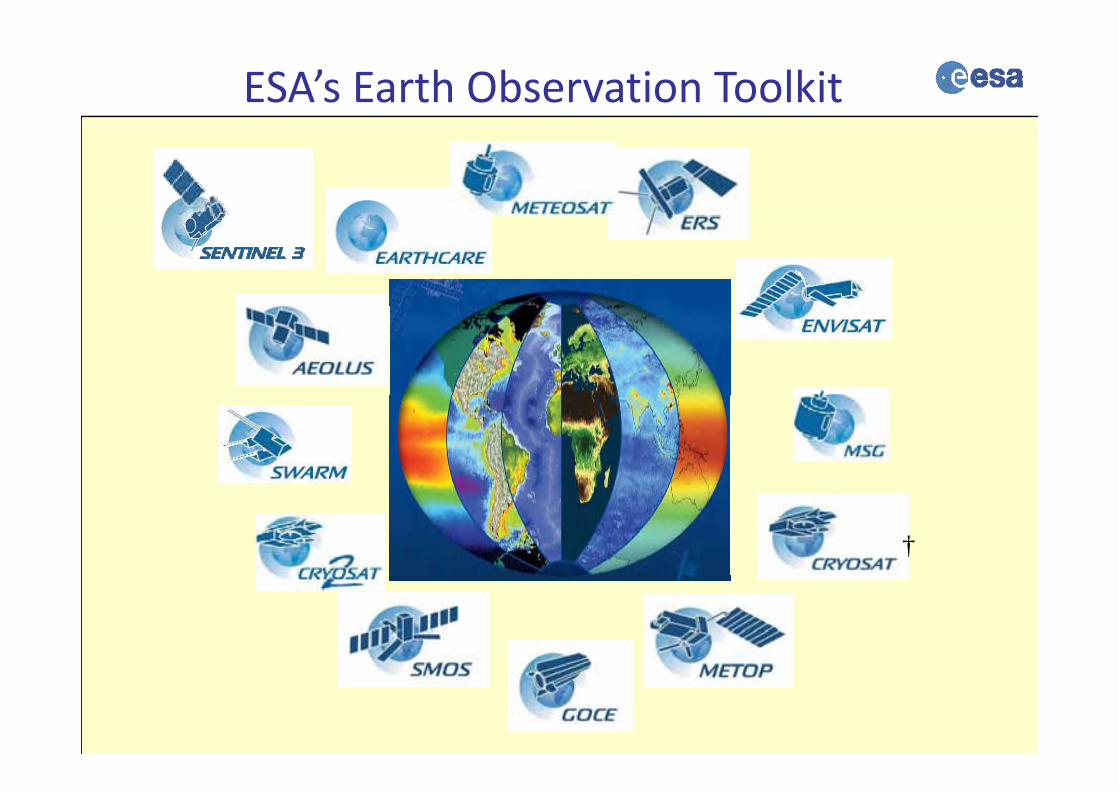
Cloud, Aerosols & Cloud, Aerosols & Radiation ExplorerRadiation Explorer
2005 2006 2007 2008 2009 2010 2011 2012
Core
2005 2006 2007 2008 2009 2010 2011 2012
Opportunity
C t 1 & 2C t 1 & 2†Cryosat 1 & 2Cryosat 1 & 2 SMOS SwarmSwarmSea Ice thickness Sea Ice thickness
and Ice sheet and Ice sheet topographytopography
Soil Moisture and Soil Moisture and Ocean SalinityOcean Salinity
Geomagnetic field surveyGeomagnetic field survey
†
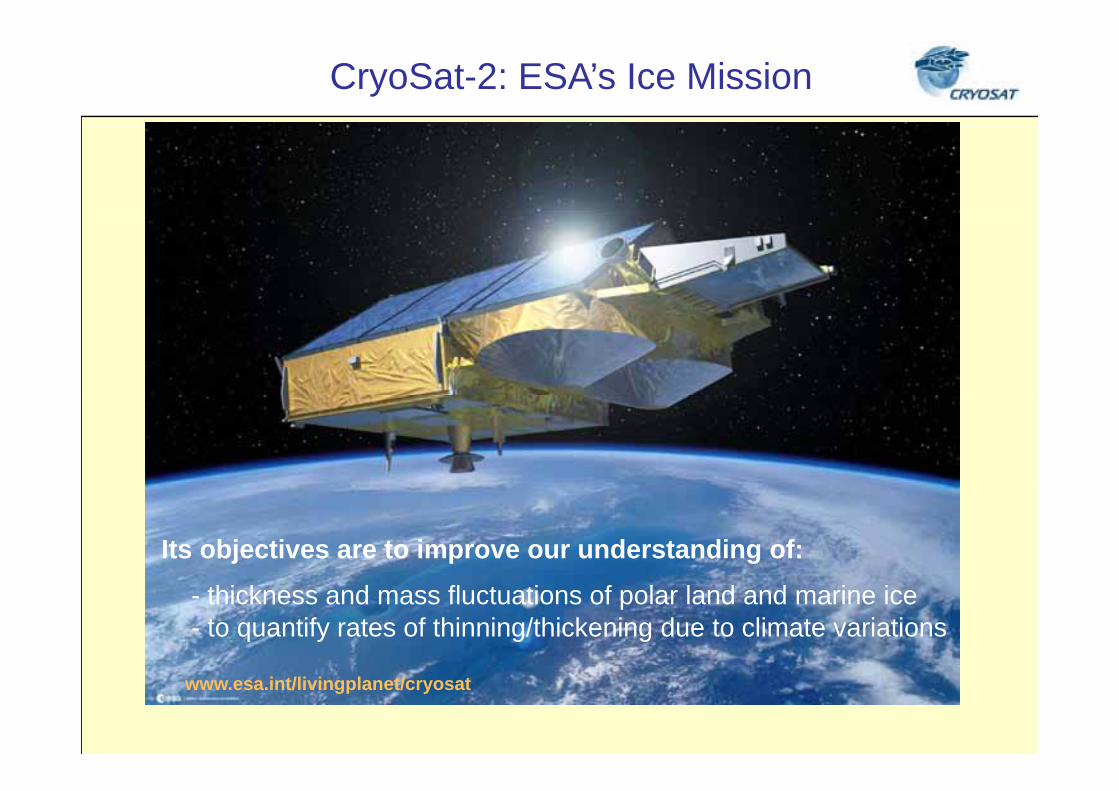
CryoSat-2: ESA’s Ice Mission
Its objectives are to improve our understanding of:- thickness and mass fluctuations of polar land and marine ice- to quantify rates of thinning/thickening due to climate variations
www.esa.int/livingplanet/cryosat
Next Generation Altimetryy
CryoSat will carry a new generation Altimeter
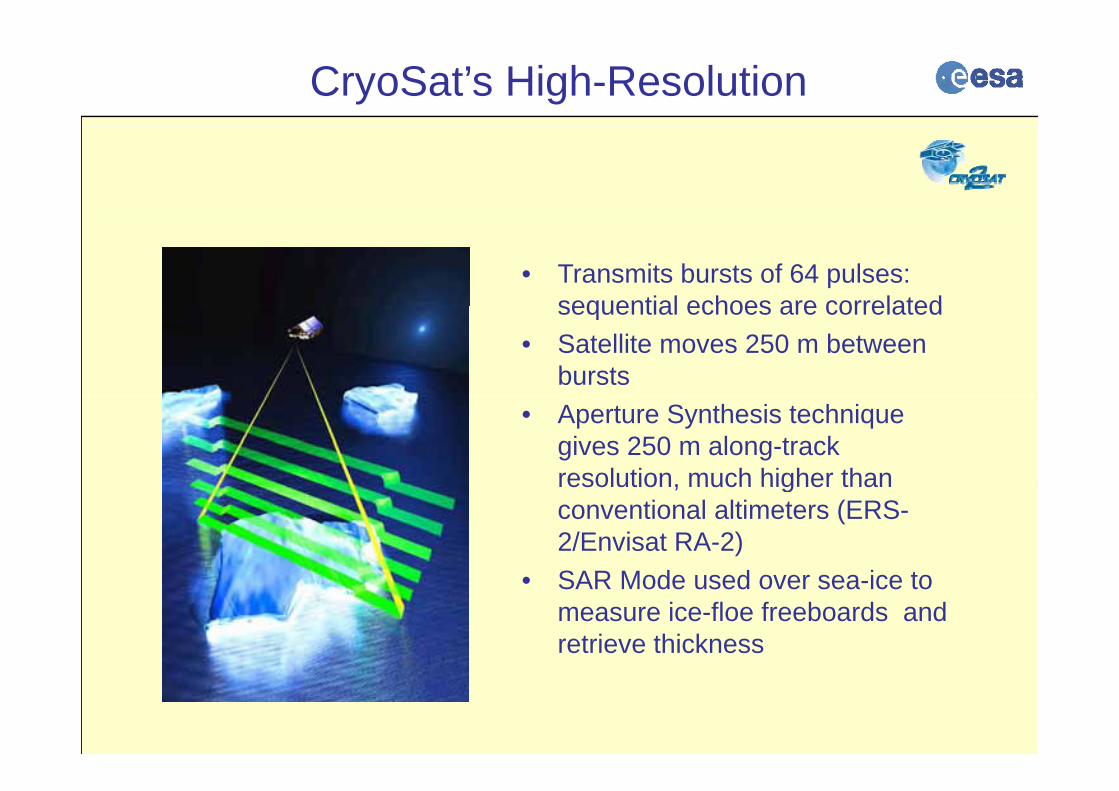
CryoSat’s High-Resolution
• Transmits bursts of 64 pulses: sequential echoes are correlatedsequential echoes are correlated
• Satellite moves 250 m between bursts
• Aperture Synthesis technique gives 250 m along-track resolution, much higher thanresolution, much higher than conventional altimeters (ERS-2/Envisat RA-2)SAR Mode sed o er sea ice to• SAR Mode used over sea-ice to measure ice-floe freeboards and retrieve thickness
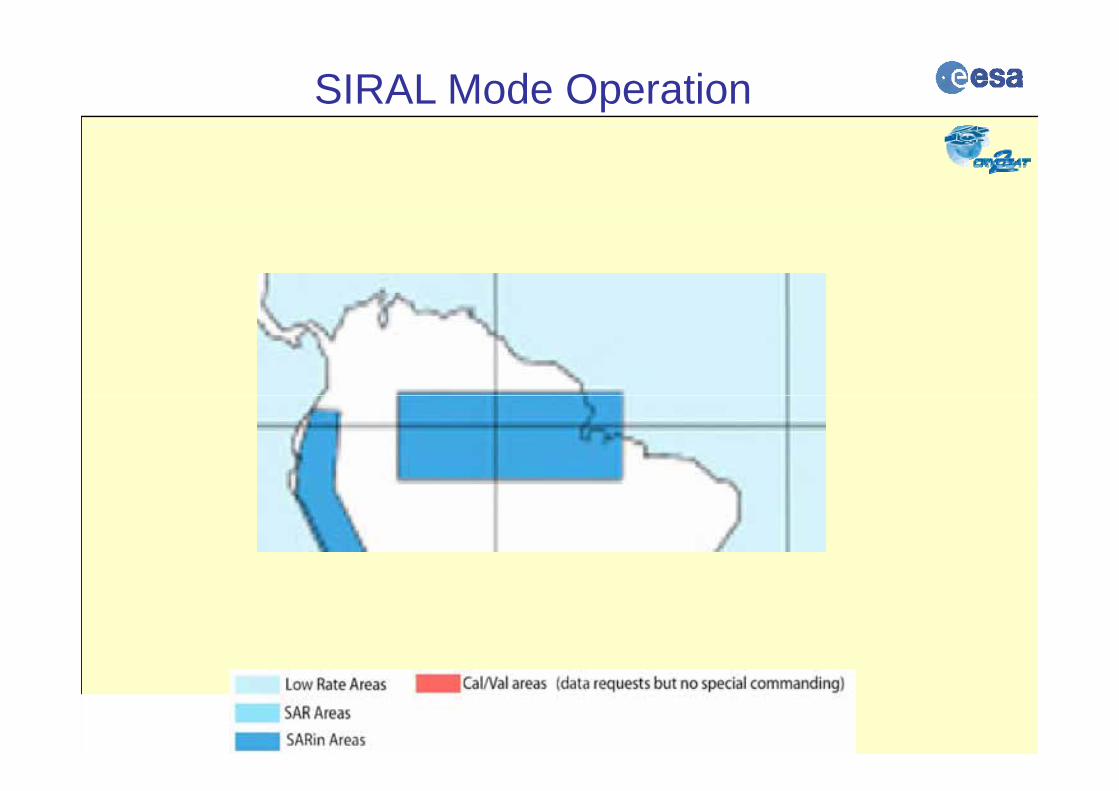
SIRAL Mode Operation
92˚ inclination, 369-day repeat, 30-day subcycle
Cal/Val and Pi’s Requests
SIRAL Mode Operation
SIRAL Mode Operation
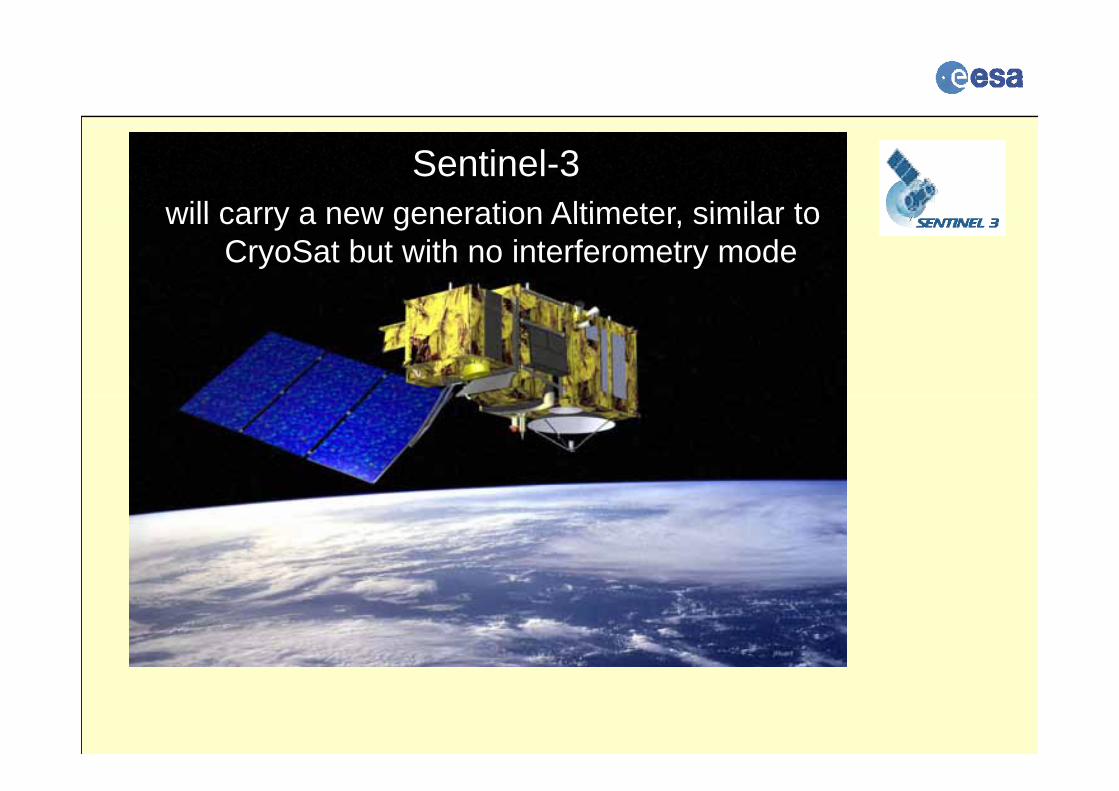
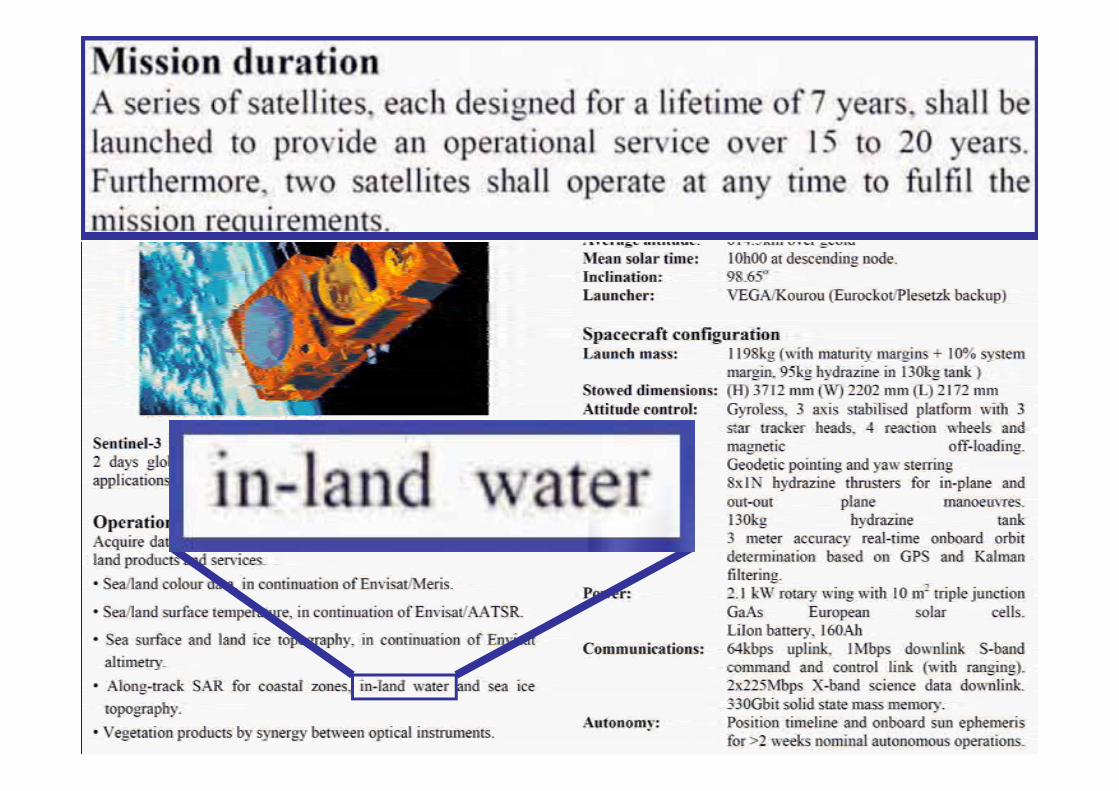
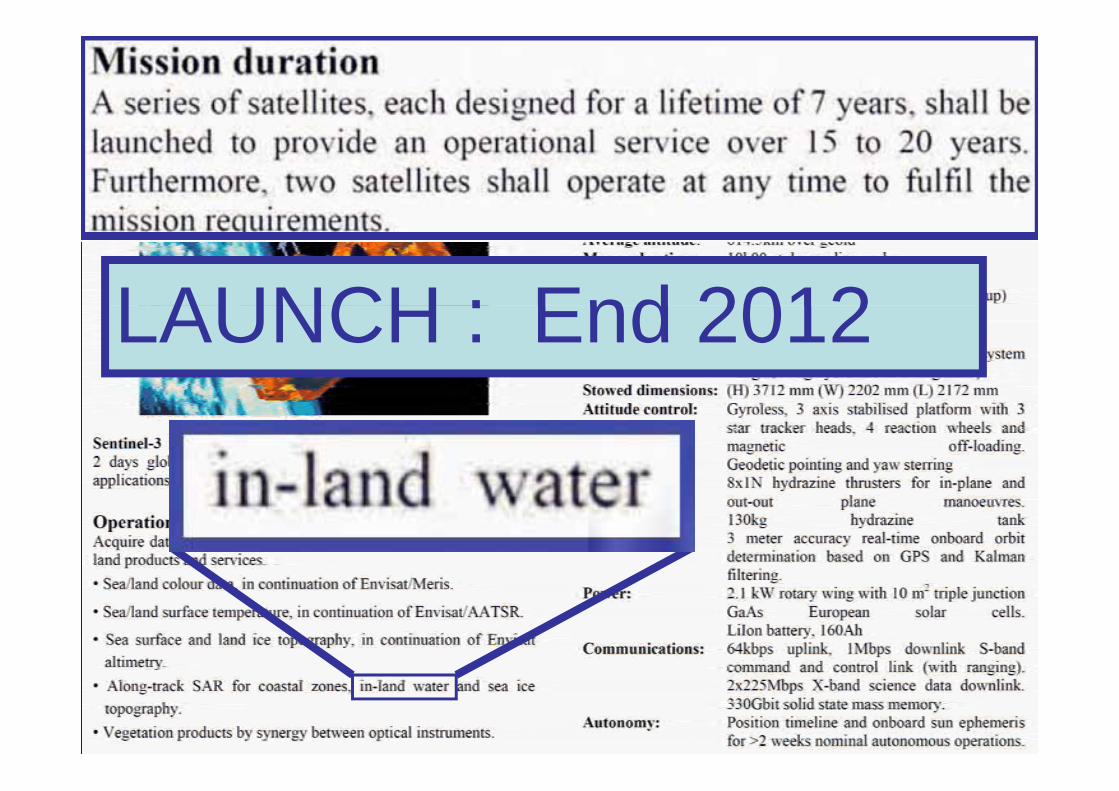
Sentinel-3will carry a new generation Altimeter similar towill carry a new generation Altimeter, similar to
CryoSat but with no interferometry mode
LAUNCH : End 2012LAUNCH : End 2012
SWOT in 2016
Conclusions (1/5)
• A huge amount of waveforms are already gathered over inland water targets globally. g g y
• Processing these complex echoes to retrieve decadal time-series of height changes has already recovered i f ti h d d f t t ld idinformation over hundreds of targets worldwide. ADAPTED RETRACKING IS ESSENTIAL...
• With applications ranging from near-real-timeWith applications ranging from near real time monitoring for water resource management to decadal climate change indicators, and spatial scales
hi h b th ll l ti ith GRACE d t dwhich both allow correlations with GRACE data, and permit monitoring of hundreds of river systems, the unique contribution of satellite radar altimetry to q yglobal inland surface water monitoring and the importance of continued measurements is evident.
Conclusions (2/5)
• As the existing network of in-situ gauges falls out of repair, more and morecatchments are becoming p , gungauged, whilst the demand on this increasingly scarce resource continues to escalate. Using the remote measurement capability of altimetry particularly the nearmeasurement capability of altimetry, particularly the near-real-time capability, is now beginning to allow water resource managers access to both the NRT data and its context, in the form of decadal historical information.
• The global monitoring capability now being achieved using multi mission satellite radar altimetry revealsusing multi-mission satellite radar altimetry reveals changing patterns of use, as stress on water resources increasingly depletes drainage basin resources beyond their capability to recharge.
• The technology can be applied as well in the oceanic coastal zone (similar difficulties in making thecoastal zone (similar difficulties in making the measurement due to contamination by surrounding land)
Conclusions (3/5)
• The scientific challenge is to fully extend to the global inland water bodies and the coastal ocean theinland water bodies and the coastal ocean the success of altimetry in monitoring the global open ocean. To satisfy hydrologist requirements we need:-– 1) better processing techniques on current instruments; – 2) better instruments for the future;– 3) better spatial/temporal sampling (this will require new
technology or constellations as proposed by CEOS Strategic Implementation Team) and
– 4) integration of measurement and forecast systems (satellites, river gauges, discharge and current meters, tide gauges hydrographic measurements models)gauges, hydrographic measurements, models).
Conclusions (4/5)
• In Hydrology and coastal altimetry cooperation is essential at EU level but even globally as theessential at EU level, but even globally, as the problems are global and the expertise needed is interdisciplinary and geographically distributed.
• The best excellences need to be networked and complementarities exploited. This is actually happening and needs to be sustained with adequate funding. E h i l di th fi ld f lti t f• Europe however is leading the field of altimetry for hydrology and coastal zone oceanography (important investments) and should endeavour to retain this roleinvestments) and should endeavour to retain this role as a key player on the international scene.
Conclusions (5/5)
• Concerning instrument data processing and auxiliary corrections an active network is required forcorrections, an active network is required for gathering local data, both used for altimeter measurement corrections and validation, to be patchworked into a global product, both for inland water, estuaries and oceanic coastal zone.