Hydrodynamic forces are known to be an impor-tant factor affecting the morphology and populationdynamics of kelps. Studies carried out along exposedcoastlines have shown that episodic periods of largewaves exert a critical role in determining abundance
and relative species composition of assemblages ofsurface canopy and understory kelps (e.g. Dayton &Tegner 1984, Dayton et al. 1984, Seymour et al. 1989,Graham et al. 1997). The strength of currents orwaves has been shown to determine morphologicaldifferences among widely separated sites in kelpblade morphology and biomechanical properties of
Current and wave dynamics in the shallowsubtidal: implications to the ecology of understory and surface-canopy kelps
James E. Eckman1,*, David O. Duggins2, Christopher E. Siddon3, 4
1Office of Naval Research, Code 322, 800 North Quincy Street, Arlington, Virginia 22217, USA2Friday Harbor Laboratories, University of Washington, 620 University Road, Friday Harbor, Washington 98250, USA
3Department of Ecology and Evolutionary Biology, Brown University, Providence, Rhode Island 02912, USA
4Present address: Juneau Center, School of Fisheries and Ocean Sciences; University of Alaska Fairbanks, 11120 Glacier Highway, Juneau, Alaska 99801-8677, USA
ABSTRACT: Current and wave properties were studied in the semi-protected waters of the San JuanArchipelago, Washington, at 6 shallow subtidal sites chosen to include a wide range of variability inexposure to both tidal currents and waves. Within each site, 4 to 6 plots measuring roughly 50 to100 m2 each were established on nearly horizontal rock platforms at mean depths ranging from 6.1 to11.0 m, with most plots at mean depths of 7.0 to 9.2 m. Plots were established nominally to minimizewithin-site variability in hydrodynamics, and were locations of several species of kelp (reported in acompanion paper). For more than a year replicate measurements of flow and pressure (mean depthand wave signals) were collected at all sites in 2 Hz bursts 25 cm above the substratum, a heightrelative to understory kelps, providing a unique, detailed spatial and temporal characterization of ashallow subtidal hydrodynamic regime pertinent to these plants. Despite the intended similarity ofplots within sites, local-flow microhabitat remained substantial at scales relative to understory plants,and largely ameliorated differences in tidal signals among most sites. Greater than 50% of the spatialvariability in maximum tidal current speed, and 31 to 44% of the variance in the duration of periodsof calm flow (speeds consistently <20 cm s–1), occurred within sites at scales of meters, and not at thelarger (km) scales that separated sites. In contrast, wave effects at 7 to 11 m depth were predictablespatially. Significant wave impacts were recorded only at 2 sites characterized by a large, open fetch.Wave-dominated flows were recorded by replicate sensors multiple times within both of these sites,and the strongest instantaneous wave speeds approached 150 to 200 cm s–1. Maximum wave-generated speeds recorded just above the substratum at these 2 sites were ~2 to 3× maximumtidal currents. These results help to explain patterns noted in concurrent studies of the populationdynamics and morphology of several species of kelp.
KEY WORDS: Hydrodynamics · Kelp · Wave · Tidal current
Resale or republication not permitted without written consent of the publisher
Mar Ecol Prog Ser 265: 45–56, 2003
plants (Koehl & Alberte 1988, Gaylord et al. 1994,Johnson & Koehl 1994, Denny et al. 1997, Gaylord &Denny 1997, Kawamata 2001, Blanchette et al. 2002).Flow forces impact kelp morphology in a mannersimilar to their effects on the morphology of intertidalanimals (Denny et al. 1985, Etter 1989, Pentcheff1991, but see Denny 2000, Denny & Blanchette2000).
Most prior research on interactions between kelpsand flow has been carried out in open-coast environ-ments, exceptions being Koehl & Alberte (1988) andJohnson & Koehl (1994). In addition, detailed spatialmeasurements of flow forces relative to plant or animalecology come primarily from the rocky intertidalregion in open-coast environments (Denny 1985, Bell& Denny 1994). Though comparatively well studied,these environments are physically extreme (i.e. endmembers) and patterns discovered there may indicatelinks between flow dynamics and biota that may notapply homologously in other marine environmentsin which kelp populations are well established. Forexample, detailed studies of flow forces in the inter-tidal have indicated that microtopography can greatlyalter exposure of plants and animals to wave forces(Shanks & Wright 1986, Bell & Denny 1994). However,the extremely shallow flow depth during immersionand wave surge may accentuate the importance oflocal topography in the intertidal, and such effectsmight therefore be far less important subtidally. More-over, wave forces presumably might play less of a rolein determining kelp population dynamics and spe-cies composition in more protected, inland, subtidalregions.
Our research has examined the ecology of under-story and surface canopy kelps in the shallow subtidalregions of the San Juan Archipelago, Washington(USA). This area generally is characterized by a densecoverage of overlapping fronds of diverse understorykelps (dominated by Agarum fimbriatum and Costariacostata), punctuated by occasional urchin barrens andclustered populations of the surface-canopy plantNereocystis luetkeana. We report here on a detailedevaluation of the hydrodynamic environment of theshallow subtidal regions of this inland island archipel-ago. We obtained these data at an unprecedented res-olution both spatially and temporally using a suite ofinstruments designed to discern the importance of tidaland wave-generated currents near the seafloor tounderstory plants. Among other findings, our resultsindicate the importance of apparently subtle micro-topography in determining the exposure of understorykelps to the strong tidal currents that characterize cer-tain sites within this archipelago, and the variabilityamong widely spaced locales in exposure to storm-generated wave forces.
MATERIALS AND METHODS
Study sites. Six study sites in the San Juan Archipel-ago (Fig. 1) were chosen to include a broad range ofhydrodynamic regimes, incorporating variability inboth tidal currents and storm-generated waves. Thesesites were locations of simultaneous studies of kelppopulation dynamics and ecology (Duggins et al. 2001,2003, in this issue). Sites at Brown Island (Site B), Can-tilever Point (Site C), Yellow Island (Site Y) and Min-nesota Reef (Site M) were all located within San JuanChannel, or smaller channels or harbors connected toit. These 4 sites are sheltered by San Juan Island fromstrong southwesterly winds associated with fall, winterand spring storms, and therefore were expected to becomparatively free of large wave impacts. In contrast,sites at Whale Rocks (Site W) and Long Island (Site L)are located outside of San Juan Channel and are opento the Haro Strait and Strait of Juan de Fuca to thesouth and west. It was expected that these sites wouldexperience more intense storm energy. The San JuanArchipelago experiences a mixed semi-diurnal tidalrange, at times >3 m. This, coupled with the complextopography and distribution of islands within the arch-ipelago, causes considerable spatial variability in tidalcurrent intensity. The 6 sites were selected nominallyso as to exploit a wide range of exposures to tidalcurrents.
Four to 6 regions (plots) of roughly 50 to 100 m2 eachwere defined within each site. Plots were created to
46
Fig. 1. San Juan Archipelago showing locations of 6 studysites. B: Brown Island; C: Cantilever Point; L: Long Island; M:
Minnesota Reef; W: Whale Rocks; Y: Yellow Island
Eckman et al.: Subtidal flow dynamics and kelps
allow studies of replicate plots of several species ofkelp. Plots were established on nearly horizontal rockplatforms at all sites, at depths ranging from 6.1 to11.0 m, with most plots at depths of 7.0 to 9.2 m. As ischaracteristic of the shallow subtidal region in thisarea, these horizontal rock platforms existed within amore complex terrain of rocky shallows and steepledges, located sometimes only meters from the plots.This narrow depth range was selected to minimizevariability in penetration of light and wave energy tothe bottom (both considered important to kelp popula-tions, e.g. Dayton et al. 1999). It was thereby expecteda priori that wide uniformity in environmental (light,nutrient, hydrodynamic) conditions would occur withineach site, with maximal variability, primarily in hydro-dynamic forcing, exhibited among sites.
Hydrodynamic measurements. The hydrodynamicproperties of each study site were measured in situusing a suite of identical instrument complexes (Fig. 2).Each sensor in the instrument complex (2 thermistors,1 pressure sensor [to measure depth and wave signals],and 2 bi-directional current sensors [oriented ortho-gonally to permit measurement of horizontal cur-rents]) was wired to a battery-powered microcomputer(Tattletale® model 5F) contained inside the watertightpressure housing.
Each bi-directional current sensor was made of arectangular strip of 0.5 × 7 cm fiberglass (blankprinted-circuit board) enclosed in a flexible, watertightsilicone mold. A foil strain gauge wired into a Whet-stone bridge-based circuit was glued onto each fiber-glass strip near the base. The shape of the fiberglassstrip encouraged flexure (and sensitivity to current)along only 1 axis, and the degree of bending of thestrip (related monotonically to instantaneous currentstrength along that axis) determined resistance of thefoil strain gauge, which was translated by circuitry intoa potential measured by analog-to-digital converters inthe data logger. The sensitivity of these current sensorsto flow speed was tuned by gluing drag-producingbodies (plastic golf balls) near to the tip of each meter(Fig. 2).
Each current meter was calibrated individually atSkidaway Institute of Oceanography in a racetrackflume equipped with a laser-Doppler velocimeter(LDV). The LDV provided the ‘ground-truth’ standardmeasurement of velocity against which each meterwas compared. Responses of each current sensor tovelocity followed a power curve:
(1)
where u is velocity (cm s–1), x is a digital ‘count’ outputby the data logger that varies with flexure of the sensorin flow, x0 is the count logged at zero flow, and a and bare regression coefficients (b ≈ 0.5). Prior to calibrating
sensors, each was tuned to be sensitive to maximumspeeds of tidal currents and storm-generated waves(the latter approaching 200 cm s–1). A result of makingmeters sensitive to higher speeds was that they wereneither precise nor accurate in resolving currentspeeds <10 cm s–1. At least 6 different velocities>10 cm s–1 were used in each regression. The medianr2 of the 52 regressions calculated (±x and ±y directionfor each of 13 m used) was 0.994. Therefore, meterswere highly accurate at measuring flows above theminimum threshold of ~10 cm s–1.
Instrument complexes were secured directly to therock substratum using anchor bolts that had been setin the rock. Measurements of current velocity wereobtained approximately 20 to 30 cm above the sub-stratum, a height that closely matches that of thalli ofthe 3 species of understory kelp (Agarum fimbriatum,Costaria costata, Laminaria complanata) consideredin studies of kelp mortality, morphology and bio-mechanics (Duggins et al. 2003). Instruments wereprogrammed so that temperature, pressure and flowspeed were sampled at 2 Hz for 128 s every 15 min.The average current speed and direction, temperature,and pressure (translatable to depth) were recordedevery 15 min. In addition, the microcomputer was pro-grammed to examine the variance of the 2 Hz pressurefluctuations, and to record all of the high-frequencymeasurements of flow speed and pressure (translat-able to instantaneous wave signals) if pressure fluctua-tions indicated an influence by waves at depth. Thethreshold for a wave ‘event’ (that triggered recordingof high-frequency data) was exceeded if the root-mean-square pressure fluctuation exceeded the stan-dard deviation of a sine wave with an amplitude (atdepth) of 28.3 cm (equivalent to a pressure fluctuationof 2.83 × 10⁴ dyn cm–2). At these depths, storm-generated pressure fluctuations produced a mono-
u a x xb
= − 0
47
Fig. 2. Instrument complex used to measure current flow,temperature, and pressure (depth and wave-generated
pressure fluctuations)
Mar Ecol Prog Ser 265: 45–56, 2003
chromatic wave pattern with a period typically 5 to 6 s(see ‘Results’). Linear wave theory (e.g. Denny 1988)predicts that pressure signals of that amplitude, at 8 mdepth and with a period of 5 s, would be associatedwith maximum horizontal flow speeds of ~26 cm s–1.This is less than the maxima in tidal current speeds atmost sites (see ‘Results’). Therefore, this thresholdensured that all important wave-dominated flows wererecorded.
At least 1 instrument was deployed continuously ateach site (2 at Sites W and L, which are the more wave-exposed sites) throughout the duration of plant popula-tion studies, beginning in September, 1995 and endingin December 1996. In addition, to more fully categorizethe variability in hydrodynamics within each site dueto natural topographic exposure and shadowing, 2 to5 additional meters were deployed within each sitefor periods ranging from 1 to 3 wk. These additionalmeters were rotated among sites throughout the studyso that local (within-site) variability in currents wasmeasured at all sites. The deployment of 4 to 6 metersfor 1 to 3 wk within each site ensured that much of thevariability in the spring neap cycle of the mixed semi-diurnal tide was included. Therefore, flow variabilityboth within and among sites was well characterized.
Analysis of hydrodynamic data. Several hydrody-namic statistics pertinent to kelp ecology and popula-tion dynamics were extracted from the instrumentdata. First, it is worth noting that because meters wereinaccurate at flow speeds <10 cm s–1 it would be mis-leading to compare mean current speeds within andamong sites. We therefore report percentile scoreswhich are unaffected by the sensitivity threshold. The75th, 90th, 95th and 99th percentiles of the 2 min aver-age current strength are reported for each instrumentduring each deployment period. These statistics reportthe intensity of the strongest flows of importance tokelp, and should accurately reflect the relative vari-ability in strengths of tidal signals within and amongsites. In addition, for each instrument and deploymentperiod, a frequency distribution of ‘duration of calm’was generated. Duration of calm is defined as the timeinterval during which current speed remained below athreshold value, selected as 20 cm s–1. This thresholdand frequency distribution may relate to the ability ofmesograzers (browsing gastropods and isopods) to for-age on and damage plant stipes (Duggins et al. 2001),for example. To compare variability within and amongsites, percentile scores for current speed (99th per-centile) and duration of calm (50th and 75th per-centiles) were analyzed using 1-way ANOVA, withvariance partitioning and a posteriori multiple compar-isons tests using the GT2 method (Sokal & Rohlf 1981).
The 2 Hz data from the pressure sensor were usedto record the number of times during a deployment
period that significant storm wave signals weredetected. A storm wave ‘event’ was defined by thevariance in the pressure signal, as described above. Inaddition to the number of wave ‘events’, high-fre-quency current-sensor data were analyzed to calcu-late the maximum wave velocity (Uw-max) recordedduring each 128 s wave record, and the maximumrecorded during each instrument deployment period.The 128 s mean current was subtracted from the high-frequency wave data in calculating the maximumwave velocities.
Linear wave theory (e.g. Denny 1988) was used tofurther analyze the high-frequency pressure signalsrecorded during wave events. From sensor depth,wave period and pressure fluctuations, the predictedmaximum horizontal flow speed during a 128 s waverecord (Uw-pred) was calculated according to:
Uw-pred = (πH�T )(cosh(ks)�sinh(kd)) (2)
where H is wave height,T is wave period, s is elevationabove the bottom (here s = 25 cm, the height of flowsensors), d is depth, and k is wave number (calculablefrom T and d); and
H = 2 pmax (cosh(kd)�(ρ g cosh(ks)) (3)
where pmax is the maximum fluctuation in pressurefrom the mean during a wave event, ρ the water den-sity, and g the gravitational acceleration.
Uw-pred was compared with Uw-max, measured by thecurrent sensors. This comparison was made to assessthe accuracy with which in situ flow speeds can bepredicted in shallow, topographically complex, subti-dal environments using theory coupled with compara-tively economical underwater wave (pressure) sensors.
RESULTS
In addition to the temporal variability in currentsinherent to tides, there was substantial spatial variabil-ity in current speed within this topographically com-plex, shallow subtidal region. This variability wasmanifested both within sites (at scales ≤10s of meters)as well as among them (scales > km). All sites exceptSite C experience occasional periods where tidal cur-rent strengths are strong (>30 cm s–1) at heights ofunderstory kelps (Table 1, Fig. 3). Maximum tidal cur-rents exhibit considerable variability among plotswithin most sites (at most sites a range of ~2×). Thiswithin-site variability largely obscures differencesamong widely separated sites in strengths of tidal cur-rent near the substratum. One-way ANOVA showsthat the 99th percentile tidal currents varied signifi-cantly among sites (F5, 23 = 4.58, p = 0.005); however,only Site C and Site W differed significantly (p < 0.05).
48
Eckman et al.: Subtidal flow dynamics and kelps
All other site pairs were statistically indistinguishable.Variance partitioning indicates that variability withina site (at scales ≤10s of meters) accounted for 57.3% oftotal variability in the 99th percentile of tidal currents,with 42.7% of total variance related to variabilityamong sites.
Slack periods in the tidal cycle combined with topo-graphically produced shading (e.g. up-current rockyshallows) are responsible for all sites experiencingperiods of protracted calm flow (Fig. 4, Table 1). At allsites except Site C, 50% of the periods of calm flow(<20 cm s–1) lasted less than 1 tidal cycle (~12.2 h or
49
Date Location Mean depth Percentile (speed, cm s–1) Percentile (duration of calm, min)(cm) 75th 90th 95th 99th 50th 75th 90th
Longer-term records (mm/dd)09/26–12/04 B (A-L-1) 900 <10 17.2 26.4 37.3 270 840 141009/27–12/04 C (A-1) 917 <10 <10 <10 12.4 270 825 144009/25–12/05 L (old bolt) 767 11.0 17.9 21.6 33.4 120 232 31509/27–12/04 M (C-1) 615 18.4 32.1 39.3 49.3 67 105 15009/25–12/05 W (L-1) 882 43.2 58.6 66.1 77.6 187 450 55009/25–11/21a W (C-2) 827 38.9 55.4 63.7 76.2 90 180 34509/26–12/06 Y (L-2 ) 917 <10 30.1 37.3 49.4 382 577 63009/26–12/06 Y (A-1) 813 <10 24.0 28.9 39.2 600 615 645
Table 1. Tidal current statistics. For location, letter code outside of parentheses refers to site (C: Cantilever Point; B: Brown Is-land; M: Minnesota Reef; Y: Yellow Island; L: Long Island; W: Whale Rocks); letter and number codes within parentheses describe
a plot or location within site (kelp species and replicate number). NA: data not available
Mar Ecol Prog Ser 265: 45–56, 2003
730 min), and 75% lasted less than 2 tidal cycles. Mostlocations within Site C showed far longer periods ofcalm than occurred at other sites: 50% lasted morethan 2 tidal cycles within 3 of 4 plots at Site C, andwithin 2 of 4 plots, 25% of calm periods (75th per-centile) lasted more than 1 wk (10 080 min). Variancepartitioning indicates that the larger-scale (>km) sitefactor contributed far more to variability in the dura-tion of calm than it did to variability in current speednear the substratum. Site differences explained 68.5%of variance in the 50th percentile, and 55.7% of vari-ance in the 75th percentile, of the duration of calm.Nevertheless, 1 of the 4 plots at Site C experiencedconsiderably stronger currents than its nominal repli-cates (Fig. 3, Table 1), and it showed patterns of calmflow more like those recorded at the other 5 sites. Thisis more evidence of the high spatial variability in cur-rent strength exhibited within sites at heights perti-nent to understory plants.
There was considerable variability among sites inexposure to storm-generated wave energy. On severaloccasions during fall through early spring, Sites W andL experienced significant wave energy continuously,from periods of hours to a few days (Table 2, Fig. 5). Atlevels of kelps, instantaneous flow speeds during waveevents often exceeded 100 cm s–1 at Sites W and L, andsometimes exceeded 150 cm s–1. Sites at Cantilever Pt.,Brown I. and Minnesota Reef never experienced sig-nificant wave activity (Table 2). Only 1 wave event(therefore lasting <30 min at the 822 cm depth of thesensor) was detected at Yellow Island, and the maxi-mum instantaneous flow speed recorded during thisevent was only 54 cm s–1.
When significant wave energy was detected at SiteW or L, it was recorded similarly by replicate instru-ments (Table 2, Fig. 5). There was, at times, up to 2×variability among replicate meters in maximum flow
speeds produced by waves near the substratum. How-ever, this level of variability was far less than thatobserved among sites.
High-frequency data recorded during storm eventsindicate that maxima in horizontal flow speeds matchwell with the peaks in instantaneous pressure fluctua-tions (Fig. 6). These plots illustrate that fluctuationsin flow speeds at levels of kelps are extremely rapidduring wave events — variations from zero net flow to≈100 cm s–1 occur within 2 to 3 s. Periods of storm-generated waves typically were 5 to 6 s.
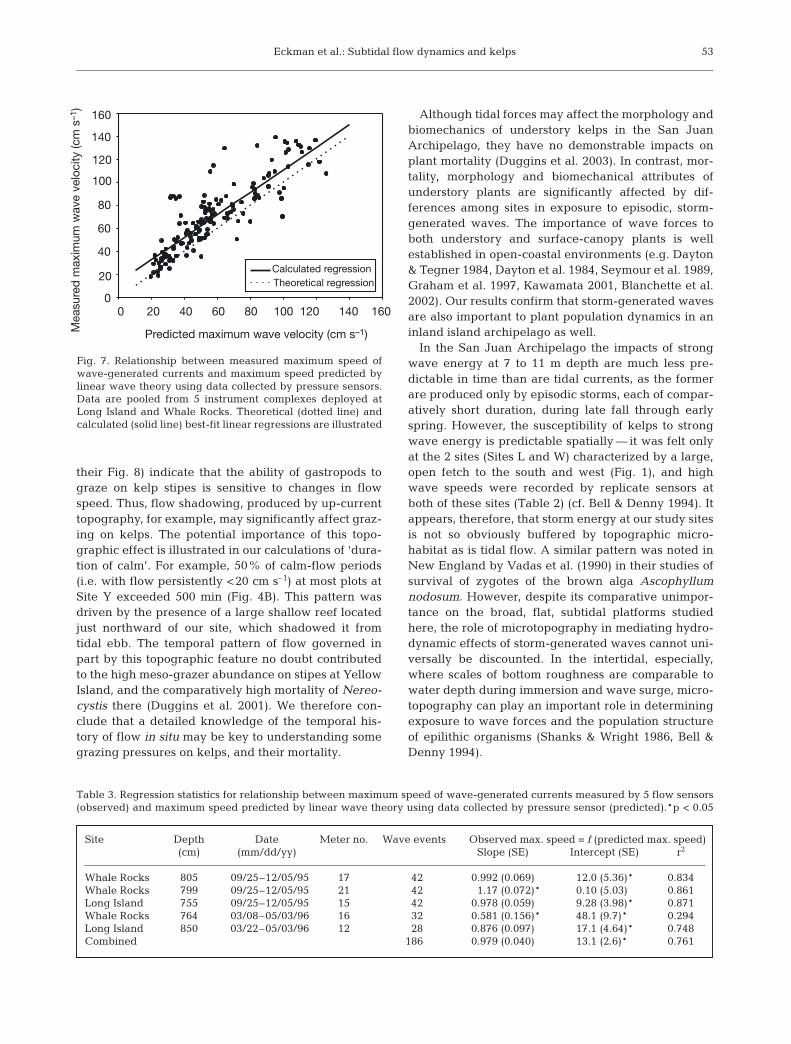
Overall, maximum wave speeds measured by cur-rent sensors during wave events (Uw-max) closelymatched speeds predicted using pressure sensor dataand linear wave theory (Uw-pred) (Fig. 7, Table 3). Datacombined from 5 sensors deployed during 2 time peri-ods at Sites W and L exhibit the expected linear rela-tionship between the 2 parameters with a slope of 1(Table 3, r2 = 0.76). It is noteworthy, however, that 24%of the total variance in Uw-max was not predictableusing pressure data and linear wave theory, and therewas a significant intercept to the regression (p =
50
10 000
1 000
100
10
2 500
2 000
1 500
1 000
500
0
75th percentile - duration of calm
50th percentile - duration of calm
B C L M W Y
B C L M W Y
Dur
atio
n (m
in)
Dur
atio
n (m
in)
Fig. 4. 50th and 75th percentiles of the duration of periods ofcalm flow (mean current speed remaining <20 cm s–1) mea-sured within plots at each site. See Fig. 1 for site abbreviations
B C L M W Y
120
100
80
60
40
20
099th
per
cent
ile c
urre
nt s
pee
d (c
m s
–1)
Fig. 3. 99th percentile of mean tidal current speed measuredwithin plots at each site. See Fig. 1 for site abbreviations
Eckman et al.: Subtidal flow dynamics and kelps
0.0001); observed maximum wave speeds were onaverage ~13 cm s–1 higher than those predicted by the-ory. The fidelity of the match between observed andpredicted wave speeds was strong generally, but var-ied greatly among plots and deployment periods(Table 3). In 3 of 5 instances, the 2 parameters matchedclosely (r2 ≈ 0.85), whereas in 1 instance the matchbetween the 2 terms was comparatively poor (r2 =0.29), though still statistically significant.
DISCUSSION
The plots set up for our studies of hydrodynamics(this paper), kelp morphology, biomechanics and pop-ulation dynamics (Duggins et al. 2001, 2003) wereestablished on broad, comparatively flat, and nearlyhorizontal rock platforms. Our methods attempted tominimize within-site variability in flow and variabilityboth within and among sites in other environmentalparameters (depth, light intensity, and presumablynutrient concentrations, given the strong tidal mixingin the San Juan Archipelago). It was therefore surpris-ing to discover that ~25 cm above the substratum,>50% of the spatial variability in maximum tidal cur-
rent speed, and 31 to 44% of the variance in durationof calm flow periods, was exhibited at scales of metersand not at the larger (km) scales that separated sites.Rough topography has been shown to be responsible
51
Site (–meter no.) Date deployed Date retrieved Mean depth No. of Max. velocity (cm s–1)(dd/mm/yy) (dd/mm/yy) (cm) wave events (wave component)
Table 2. Summary of wave statistics. Site names abbreviated as C: Cantilever Point; B: Brown Island; M: Minnesota Reef; Y: Yellow Island; L: Long Island; W: Whale Rocks
220
200
180
160
140
120
100
80
60
40
20
0260 280 300 320 340 360
Day of Year (1995)
Meter 17Meter 21
Whale rocks - wave events
Max
imum
wav
e sp
eed
(cm
s–1
)
Fig. 5. Maximum wave speeds recorded during 2 min periodsof wave-dominated flow by 2 instrument complexes deployed
at Whale Rocks in the autumn of 1995
Mar Ecol Prog Ser 265: 45–56, 2003
for high local variability in exposure to wave-drivenflows in the highly rugose, rocky intertidal region(Shanks & Wright 1986, Bell & Denny 1994), but it wasremarkable to discover a similarly high variance intidal flow energy in a narrow depth range of the sub-tidal, nominally selected to minimize such effects. Thishigh local variability in flow close to the substratum,which can be expected to be relevant to understoryplants and their macrobenthic predators (Duggins etal. 2001), is undoubtedly caused by local topographicvariability within sites — either shadowing or channel-ing of flow caused by up-current topography. Far moreextreme spatial variability in local topography is exhib-ited within our sites than existed among our nominalreplicate plots. It should be obvious from our results,therefore, that local variability in topography cancreate flow microhabitat that can largely amelioratedifferences in gross tidal energy imposed on widely
spaced locales, and that microhabitat inshallow subtidal environments has thepotential to greatly affect interactionsbetween currents and a suite of macro-benthic organisms, including understorykelps, other macroalgae, and their preda-tors.
Evidence that such effects can beimportant to kelps is obvious from ourown studies. The rate of mortality of 3understory species we studied (Agarumfimbriatum, Costaria costata, Laminariacomplanata) was not related to differencesamong sites in tidal currents (Duggins etal. 2003), despite the fact that tides pro-vided a regular, intense source of energyat some plots within several sites (Fig. 3).We suspect that a refuge from strongtidal flows, created by microhabitat, con-tributes to this decoupling. However, tidalenergy does have a demonstrable impacton the structural morphology of 2 of these3 species (Agarum and Costaria; Dugginset al. 2003).
The proposed importance of tidal-flowmicrohabitat to understory kelps is furthersupported by the contrasting patterns ofmortality exhibited by the surface canopyplant, Nereocystis luetkeana, in the SanJuan Archipelago. Small Nereocystis spo-rophytes rapidly grow too large to beinfluenced by the tidal flow microhabitatswe detected just 25 cm above the substra-tum. It is therefore noteworthy that popu-lations of Nereocystis are highly sensitiveto tidal energy; they show patterns ofmortality directly related to the interaction
of tidal currents with mesograzers upon them (Dugginset al. 2001). Our data indicate that differences in tidalcurrents among sites determine strong differences inabundance of small gastropods (Lacuna vincta) thatgraze on, and weaken, Nereocystis stipes, and that thismay govern the observed variability among sites inmortality rates of Nereocystis. Therefore, when lookedat together our data are consistent with the hypothesisthat local flow microhabitats, particularly in regionssubjected to strong tidal currents, may contribute tothe structure and population dynamics of understoryplants.
The importance of meso-grazer foraging to damageand mortality of Nereocystis (Duggins et al. 2001)highlights the value of our detailed documentation ofnot only the upper bound of current strength imposedby tides (Fig. 3, Table 1), but also its temporal pattern(Fig. 4, Table 1). Flume studies (Duggins et al. 2001,
52
Whale rocks - Meter 17 - 2 Dec 1995 (23:30 PST)
Long Island - Meter 15 - 2 Dec 1995 (23:45 PST)
Time (s)
120100
806040
20
0
-20
-40
-60
Sp
eed
(cm
s–1
) or
pre
ssur
e d
iffer
entia
l (∆p
/ρg)
(cm
H2O
)
-80
10080
60
40
20
0
-20
-40
-60
-80
0 20 40 60 80 100 120
0 20 40 60 80 100 120
Fig. 6. High-frequency (2 Hz) records of wave-driven current speeds (solidlines) and pressure fluctuations (relative to a zero mean, dotted lines)recorded over separate 128 s periods by instrument complexes at Long
Island and Whale Rocks. PST: Pacific Standard Time
Eckman et al.: Subtidal flow dynamics and kelps
their Fig. 8) indicate that the ability of gastropods tograze on kelp stipes is sensitive to changes in flowspeed. Thus, flow shadowing, produced by up-currenttopography, for example, may significantly affect graz-ing on kelps. The potential importance of this topo-graphic effect is illustrated in our calculations of ‘dura-tion of calm’. For example, 50% of calm-flow periods(i.e. with flow persistently <20 cm s–1) at most plots atSite Y exceeded 500 min (Fig. 4B). This pattern wasdriven by the presence of a large shallow reef locatedjust northward of our site, which shadowed it fromtidal ebb. The temporal pattern of flow governed inpart by this topographic feature no doubt contributedto the high meso-grazer abundance on stipes at YellowIsland, and the comparatively high mortality of Nereo-cystis there (Duggins et al. 2001). We therefore con-clude that a detailed knowledge of the temporal his-tory of flow in situ may be key to understanding somegrazing pressures on kelps, and their mortality.
Although tidal forces may affect the morphology andbiomechanics of understory kelps in the San JuanArchipelago, they have no demonstrable impacts onplant mortality (Duggins et al. 2003). In contrast, mor-tality, morphology and biomechanical attributes ofunderstory plants are significantly affected by dif-ferences among sites in exposure to episodic, storm-generated waves. The importance of wave forces toboth understory and surface-canopy plants is wellestablished in open-coastal environments (e.g. Dayton& Tegner 1984, Dayton et al. 1984, Seymour et al. 1989,Graham et al. 1997, Kawamata 2001, Blanchette et al.2002). Our results confirm that storm-generated wavesare also important to plant population dynamics in aninland island archipelago as well.
In the San Juan Archipelago the impacts of strongwave energy at 7 to 11 m depth are much less pre-dictable in time than are tidal currents, as the formerare produced only by episodic storms, each of compar-atively short duration, during late fall through earlyspring. However, the susceptibility of kelps to strongwave energy is predictable spatially — it was felt onlyat the 2 sites (Sites L and W) characterized by a large,open fetch to the south and west (Fig. 1), and highwave speeds were recorded by replicate sensors atboth of these sites (Table 2) (cf. Bell & Denny 1994). Itappears, therefore, that storm energy at our study sitesis not so obviously buffered by topographic micro-habitat as is tidal flow. A similar pattern was noted inNew England by Vadas et al. (1990) in their studies ofsurvival of zygotes of the brown alga Ascophyllumnodosum. However, despite its comparative unimpor-tance on the broad, flat, subtidal platforms studiedhere, the role of microtopography in mediating hydro-dynamic effects of storm-generated waves cannot uni-versally be discounted. In the intertidal, especially,where scales of bottom roughness are comparable towater depth during immersion and wave surge, micro-topography can play an important role in determiningexposure to wave forces and the population structureof epilithic organisms (Shanks & Wright 1986, Bell &Denny 1994).
53
Site Depth Date Meter no. Wave events Observed max. speed = f (predicted max. speed)(cm) (mm/dd/yy) Slope (SE) Intercept (SE) r2
Table 3. Regression statistics for relationship between maximum speed of wave-generated currents measured by 5 flow sensors(observed) and maximum speed predicted by linear wave theory using data collected by pressure sensor (predicted).*p < 0.05
0 20 40 60 80 100 120 140 160
Calculated regression Theoretical regression
160
140
120
100
80
60
40
20
0
Predicted maximum wave velocity (cm s–1)Mea
sure
d m
axim
um w
ave
velo
city
(cm
s–1
)
Fig. 7. Relationship between measured maximum speed ofwave-generated currents and maximum speed predicted bylinear wave theory using data collected by pressure sensors.Data are pooled from 5 instrument complexes deployed atLong Island and Whale Rocks. Theoretical (dotted line) andcalculated (solid line) best-fit linear regressions are illustrated
Mar Ecol Prog Ser 265: 45–56, 2003
The maximum wave-generated speeds recorded at 7to 11 m depth were ~2 to 3× the maximum tidal cur-rents recorded just above the substratum (Tables 1 &2). Because drag forces on plants should scale to thesquare of flow speed (Schlichting 1979, Vogel 1981),this suggests that the strongest storm waves at Sites Wand L should impose drag forces on understory plants~4 to 9× those created by the strongest tidal currents.In addition, storm waves at these sites produce flowaccelerations from essentially zero to as high as 150 to200 cm s–1 within 1 to 2 s (Fig. 6), adding an additionalacceleration force (though probably of smaller magni-tude than the drag force, e.g. Denny 1988, Gaylord etal. 1994, their Table 2) to the potentially large wave-driven drag forces on plants. Therefore, it is hardlysurprising that wave forces were important to the mor-tality and morphology of 2 species of understory kelps(Agarum fimbriatum, Costaria costata) in the San JuanArchipelago (Duggins et al. 2001), as has been demon-strated for understory and surface-canopy plants alongmore exposed coastlines (Dayton & Tegner 1984, Day-ton et al. 1984, Harris et al. 1984, Ebeling at al. 1985,Seymour et al. 1989, Molloy & Bolton 1996, Grahamet al. 1997, Blanchette et al. 2002). A similarly decisiverole for waves in the dynamics of epilithic intertidalpopulations is, of course, well established (e.g. Dayton1971, Paine & Levin 1981, Sousa 1984, 1985, Shanks& Wright 1986, Barry 1989, Etter 1989).
Although our data suggest that topographically cre-ated flow microhabitat may considerably ameliorateinfluences of tidal currents on understory plants in theSan Juan Archipelago, depth should provide the pri-mary refuge from wave exposure available for under-
story plants. This has been demonstrated in opencoastal locales as well (Dayton & Tegner 1984, Daytonet al. 1984, Dayton 1985, Seymour et al. 1989). Thedepth refuge occurs because the maximum horizontalcurrent speed produced by waves falls off non-linearlywith depth (Fig. 8). This means of minimizing exposureof understory plants to wave-generated flow would,of course, ultimately be limited by the penetration oflight, which declines exponentially with depth. Con-sequently, understory plants escaping storm wave-generated forces at depth in more exposed locales mayexperience lower growth rates, and reproductivetiming or output may thereby be delayed or reduced,potentially reducing plant fitness. Moreover, sus-ceptibility to grazing attacks can also be expectedto increase for plants inhabiting deeper waters (e.g.Lissner 1980, Witman 1987, Tegner et al. 1995, Kawa-mata 1998), and damage caused by grazers is an im-portant cause of mortality of some kelps (Koehl & Wain-wright 1977, Tegner et al. 1995, Duggins et al. 2001).
It is worth noting that kelp sporophytes in the SanJuan Archipelago germinate primarily during latespring and summer. This is a period during which aninfluence of waves is not felt at any of our sites anddepths studied. Therefore, during their first severalmonths of growth, kelp sporophytes have no exposureor capacity to respond to wave-generated forces. Con-sequently, it can be expected that only tidal signals,which are subject to strong microhabitat variability,would affect the relative investment by young kelpsporophytes in structural versus productive tissues. Infact, we noted a distinct dependence of plant morpho-logy on current strength for the understory speciesstudied (Duggins et al. 2003). Ultimately, therefore,many of the young plants growing in environmentssusceptible to waves may be poorly adapted to with-stand winter storms due to an initial under-investmentin structural tissue.
Our results (here, and in Duggins et al. 2001, 2003)help to reinforce the value of obtaining spatially andtemporally detailed measurements of flow to help ininterpreting biological patterns in shallow subtidalmarine environments. The suite of paired, orthogonal,strain-gauge current sensors we used provided invalu-able information on in situ microhabitat variability, aswell as patterns of variability among widely spacedsites. However, these sensor systems are not availablecommercially, and are therefore unavailable to thegeneral scientific community (nor are comparable,modestly priced sensors, to our knowledge). Withrespect to the critically important measures of wave-driven flow, our data indicate that a reasonable alter-native to velocity sensors is to use bottom-mountedpressure sensors (sampled at high frequency) com-bined with wave theory. We noted a strong relation-
Fig. 8. Maximum horizontal current speed as a function ofdepth, predicted using linear wave theory for a hypotheticalstorm-generated wave typical of conditions measured atwave-exposed sites in the San Juan Archipelago. T: wave
period; k: wave number; H: wave height
Eckman et al.: Subtidal flow dynamics and kelps
ship between directly measured wave speeds andthose predicted from pressure fluctuations and wavetheory (Fig. 7). The scatter (variance) in the relation-ship illustrated in Fig. 7 probably was caused bytopographically produced shadowing or channeling ofwaves, similar to that noted for tidal currents. Thistopographic effect may have been responsible for thepoor correlation between predicted and observedwave speeds in 1 of 5 cases examined (Table 3). How-ever, in general the fidelity of the match betweenobserved and predicted wave speeds was strong. Be-cause wave (pressure) sensors are commercially avail-able, and affordable, this should be considered a use-ful alternative means of predicting wave impacts insubtidal environments. We expect, however, that thisalternative and indirect means of predicting wavevelocities and wave-generated forces would not workwell in the intertidal (Denny et al. 1985), where thescale of bottom roughness is more comparable toflow depth during immersion, and where wave-drivenflows will therefore be far more complex.
Acknowledgements. This research was supported by NSFaward OCE-9314694 and ONR grant N00014-98-1-0260. Wethank Dr. A. O. D. Willows (Director) and the staff of theFriday Harbor Laboratories for their support. Dr. Andy Trivett(Trivett Technologies) designed and built the wave andcurrent sensors, and instructed the senior author in theiruse. Kamille Hammerstrom assisted greatly with diving.
LITERATURE CITED
Barry JP (1989) Reproductive response of a marine annelid towinter storms: an analog to fire adaptation in plants? MarEcol Prog Ser 54:99–107
Bell EC, Denny MW (1994) Quantifying ‘wave exposure’: asimple device for recording maximum velocity and resultsof its use at several field sites. J Exp Mar Biol Ecol 181:9–29
Blanchette CA, BG Miner and SD Gaines (2002) Geographicvariability in form, size and survival of Egregia menziesiiaround Point Conception, California. Mar Ecol Prog Ser239:69–82
Dayton PK (1971) Competition, disturbance, and communityorganization: the provision and subsequent utilization ofspace in a rocky intertidal community. Ecol Monogr 41:351–389
Dayton PK (1985) Ecology of kelp communities. Annu RevEcol Syst 16:215–245
Dayton PK, Tegner MJ (1984) Catastrophic storms, El Niño,and patch stability in a southern California kelp commu-nity. Science 224:283–285
Dayton PK, Currie V, Gerrodette T, Keller BD, Rosenthal R,Ven Tresca D (1984) Patch dynamics and stability of someCalifornia kelp communities. Ecol Monogr 54:253–289
Dayton PK, Tegner MJ, Edwards PB, Riser KL (1999) Tempo-ral and spatial scales of kelp demography: the role ofoceanographic climate. Ecol Monogr 69:219–250
Denny MW (1985) Wave forces on intertidal organisms: a casestudy. Limnol Oceanogr 30:1171–1187
Denny MW (1988) Biology and the mechanics of the wave-swept environment. Princeton University Press, Princeton,NJ
Denny MW (2000) Limits to optimization: fluid dynamics,adhesive strength and the evolution of shape in limpetshells. J Exp Biol 203:2603–2622
Denny MW, Blanchette CA (2000) Hydrodynamics, shellshape, behavior and survivorship in the owl limpet Lottiagigantea. J Exp Biol 203:2623–2639
Denny MW, Daniel TL, Koehl MAR (1985) Mechanical limits to size in wave-swept organisms. Ecol Monogr 55:69–102
Denny MW, Gaylord BP, Cowen EA (1997) Flow and flexi-bility. II. The roles of size and shape in determining waveforces on the bull kelp Nereocystis luetkeana. J Exp Biol200:3165–3183
Duggins DO, Eckman JE, Siddon CE, Klinger T (2001) Theinteractive roles of mesograzers and current flow insurvival of kelps. Mar Ecol Prog Ser 223:143–155
Duggins DO, Eckman JE, Siddon CE, Klinger T (2003) Popu-lation, morphometric and biomechanical studies of threeunderstory kelps along a hydrodynamic gradient. MarEcol Prog Ser 264:57–76
Ebeling AW, Laur DR, Rowley RJ (1985) Severe strom distur-bances and reversal of community structure in a southernCalifornia kelp forest. Mar Biol 84:287–294
Etter RJ (1989) Life history variation in the intertidal snailNucella lapillus across a wave-exposure gradient. Ecology70:1857–1876
Gaylord B, Denny MW (1997) Flow and flexibility. I. Effects ofsize, shape and stiffness in determining wave forces on thestipitate kelps Eisenia arborea and Pterygophora califor-nica. J Exp Biol 200:3141–3164
Gaylord B, Blanchette CA, Denny MW (1994) Mechanicalconsequences of size in wave-swept algae. Ecol Monogr64:287–313
Graham MH, Harrold C, Lisin S, Light K, Watanabe JM,Foster MS (1997) Population dynamics of giant kelpMacrocystis pyrifera along a wave exposure gradient.Mar Ecol Prog Ser 148:269–279
Harris LG, Ebeling AW, Laur DR, Rowley RJ (1984) Commu-nity recovery after storm damage: a case of facilitation inprimary succession. Science 224:1336–1338
Johnson AS, Koehl MAR (1994) Maintenance of dynamicstrain similarity and environmental stress factor in differ-ent flow habitats: thallus allometry and material proper-ties of a giant kelp. J Exp Biol 195:381–410
Kawamata S (1998) Effect of wave-induced oscillatory flow ongrazing by a subtidal sea urchin Strongylocentrotus nudus(A. Agassiz). J Exp Mar Biol Ecol 224:31–48
Kawamata S (2001) Adaptive mechanical tolerance and dis-lodgement velocity of the kelp Laminaria japonica inwave-induced water motion. Mar Ecol Prog Ser 211:89–104
Koehl MAR, Alberte RS (1988) Flow, flapping, and photosyn-thesis of Nereocystis luetkeana — a functional comparisonof undulate and flat blade morphologies. Mar Biol 99:435–444
Koehl MAR, Wainwright SA (1977) Mechanical adaptations ofa giant kelp. Limnol Oceanogr 22:1067–1071
Lissner AL (1980) Some effects of turbulence on the activity ofthe sea urchin Centrostephanus coronatus Verrill. J ExpMar Biol Ecol 48:185–193
Molloy FJ, Bolton JJ (1996) The effects of wave exposure anddepth on the morphology of inshore populations of theNamibian kelp, Laminaria schinzii Foslie. Bot Mar 39:525–531
55
Mar Ecol Prog Ser 265: 45–56, 2003
Paine RT, Levin SA (1981) Intertidal landscapes: disturbanceand the dynamics of pattern. Ecol Monogr 51:145–178
Pentcheff ND (1991) Resistance to crushing from wave-bornedebris in the barnacle Balanus glandula. Mar Biol 110:399–408
Schlichting H (1979) Boundary-layer theory. McGraw-Hill,New York
Seymour RJ, Tegner MJ, Dayton PK, Parnell PE (1989) Stormwave induced mortality of giant kelp, Macrocystis pyri-fera, in southern California. Estuar Coast Shelf Sci 28:277–292
Shanks AL, Wright WG (1986) Adding teeth to wave action —the destructive effects of wave-borne rocks on intertidalorganisms. Oecologia (Berl) 69:420–428
availability, and spatially variable patterns of succession.Ecology 65(6):1918–1935
Sousa WP (1985) The role of disturbance in natural communi-ties. Annu Rev Ecol Syst 15:353–391
Tegner MJ, Dayton PK, Edwards PB, Riser KL (1995) Seaurchin cavitation of giant kelp (Macrocystis pyrifera C.Agardh) holdfasts and its effects on kelp mortality acrossa large California forest. J Exp Mar Biol Ecol 191:83–99
Vadas RL, Wright WA, Miller SL (1990) Recruitment of Asco-phyllum nodosum — wave action as a source of mortality.Mar Ecol Prog Ser 61:263–272
Vogel S (1981) Life in moving fluids. Princeton UniversityPress, Princeton, NJ
Witman JD (1987) Subtidal coexistence: storms, grazing,mutualism, and the zonation of kelps and mussels. EcolMonogr 57(2):167–187
56
Editorial responsibility: Kenneth Tenore (Contributing Editor), Solomons, Maryland, USA
Submitted: November 3, 2002; Accepted: August 18, 2003Proofs received from author(s): December 1, 2003