81
K38d: Current Climate Change: Other Effects

K38d: Current Climate Change: Other Effects
• 1. Global phytoplankton decline • 2. Slowdown of Ocean Currents • 3. Declining oxygen in air and oceans • 4. Rising nighttime vs daytime temps • 5. Stronger hurricane force winds • 6. Mass extinctions • 7. Ocean acidification and death of coral
reefs • 8. Rising methane levels • 9. Poleward expansion of deserts • 10. Tropical diseases spreading north
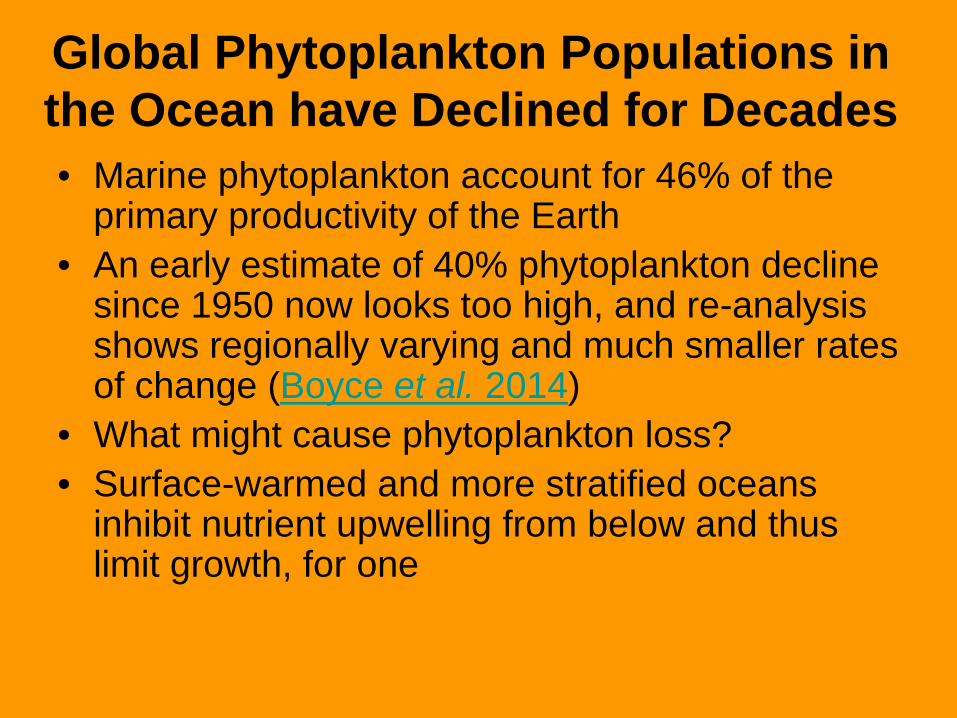
Global Phytoplankton Populations in the Ocean have Declined for Decades • Marine phytoplankton account for 46% of the
primary productivity of the Earth • An early estimate of 40% phytoplankton decline
since 1950 now looks too high, and re-analysis shows regionally varying and much smaller rates of change (Boyce et al. 2014)
• What might cause phytoplankton loss? • Surface-warmed and more stratified oceans
inhibit nutrient upwelling from below and thus limit growth, for one

Fresh Meltwater is 2.7% Less Dense than Seawater, Inhibiting Polar Sinking and Global Conveyor Currents

Boyce et al. 2014: Most Oceans Show Declining Chlorophyll in Surface Waters
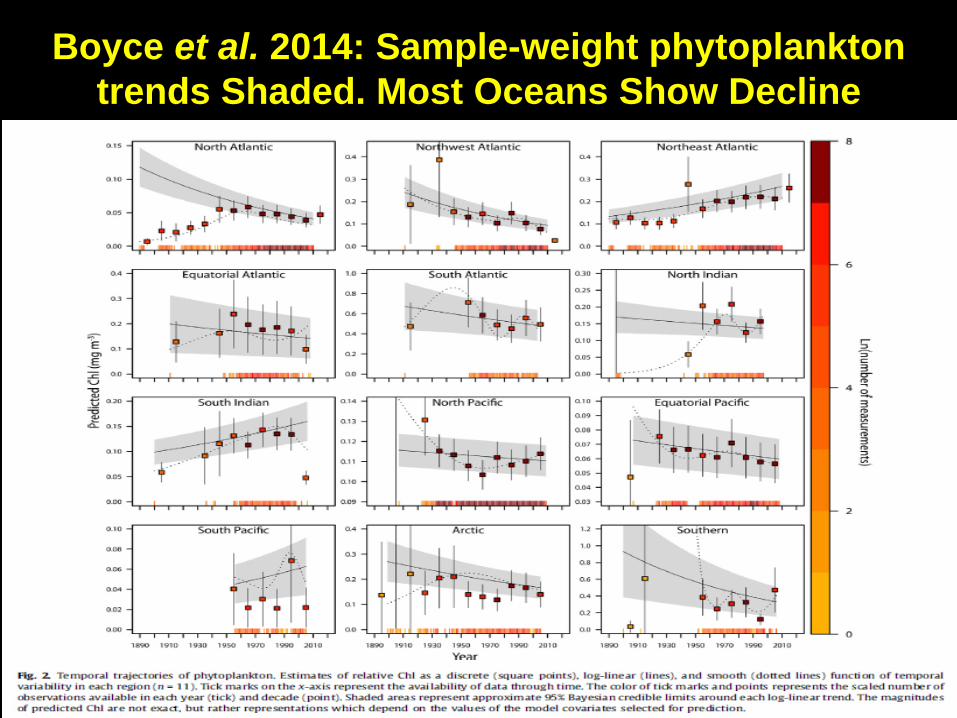
Boyce et al. 2014: Sample-weight phytoplankton trends Shaded. Most Oceans Show Decline

AMOC Slowdown: Another Predicted Effect of Polar Melt and Increasingly
Stratified Oceans • Since 2004 we’ve had a set of 22 sensors deployed in
the tropical Atlantic to monitor the strength of the AMOC (Atlantic Meridional Overturning Current).
• They find a large 3% per year decline in the strength of the AMOC current (linked to polar climate scientist Stefan Rahmstorff in RealClimate.org)
• “If our analysis is correct, then this indicates that climate models underestimate the weakening of the Atlantic circulation in response to global warming – probably because the flow in these models is too stable (see Hofmann and Rahmstorf 2009). Although these models predict a significant weakening for the future, they do not suggest this as early as the observations show it (see Fig. 2 of our paper). That the real flow may be more unstable than previously thought would be bad news for the future.”
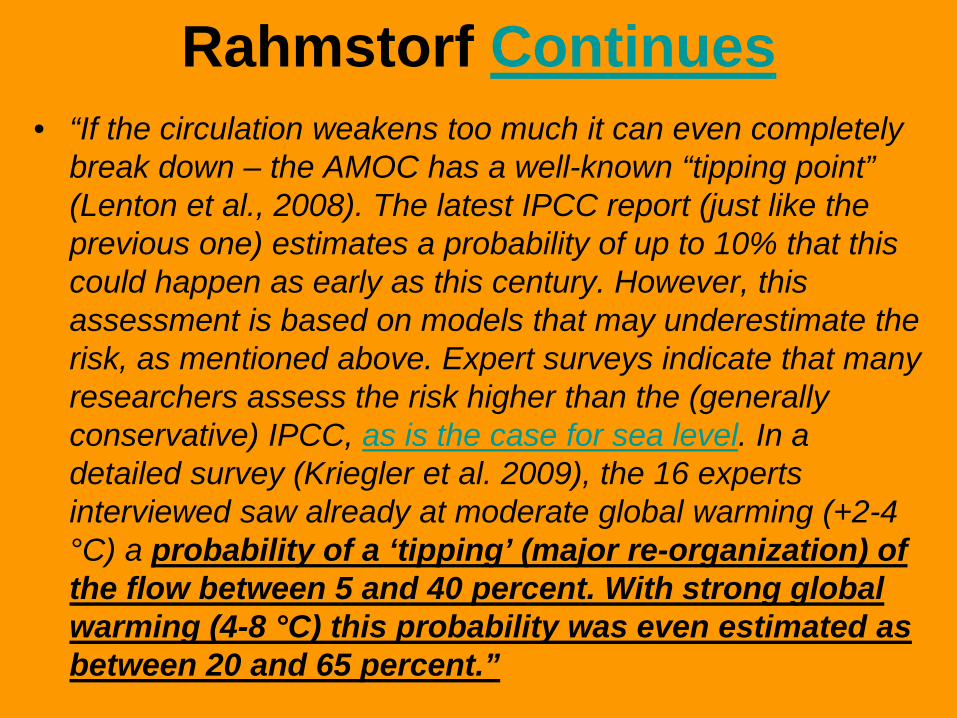
Rahmstorf Continues • “If the circulation weakens too much it can even completely
break down – the AMOC has a well-known “tipping point” (Lenton et al., 2008). The latest IPCC report (just like the previous one) estimates a probability of up to 10% that this could happen as early as this century. However, this assessment is based on models that may underestimate the risk, as mentioned above. Expert surveys indicate that many researchers assess the risk higher than the (generally conservative) IPCC, as is the case for sea level. In a detailed survey (Kriegler et al. 2009), the 16 experts interviewed saw already at moderate global warming (+2-4 °C) a probability of a ‘tipping’ (major re-organization) of the flow between 5 and 40 percent. With strong global warming (4-8 °C) this probability was even estimated as between 20 and 65 percent.”

The strength of the AMOC is declining, and predicted to
continue (Rahmstorf et al. 2015)
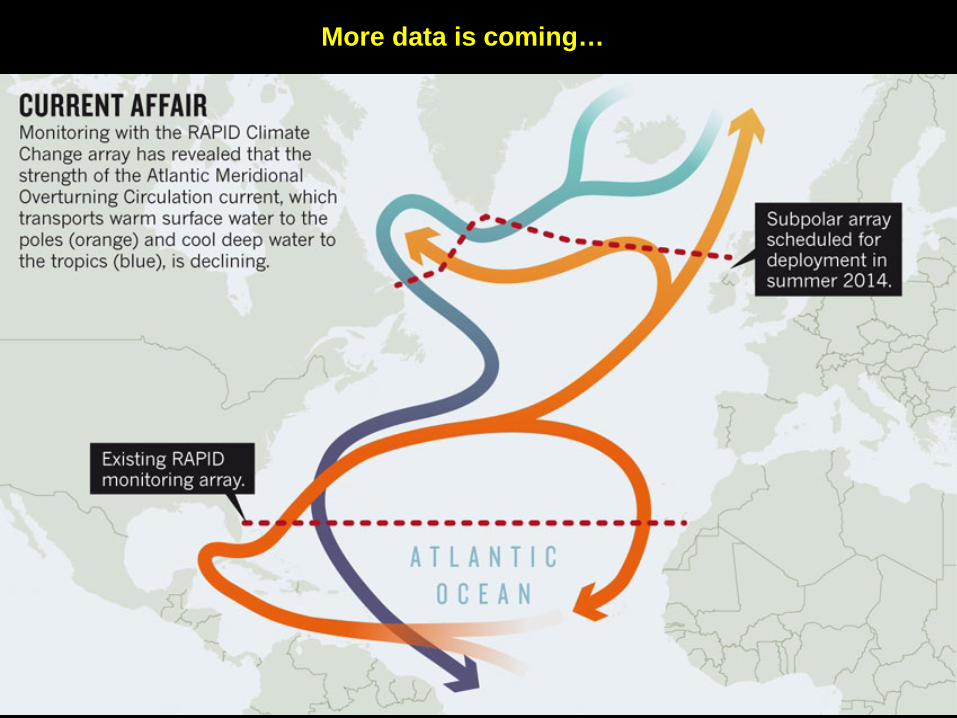
More data is coming…
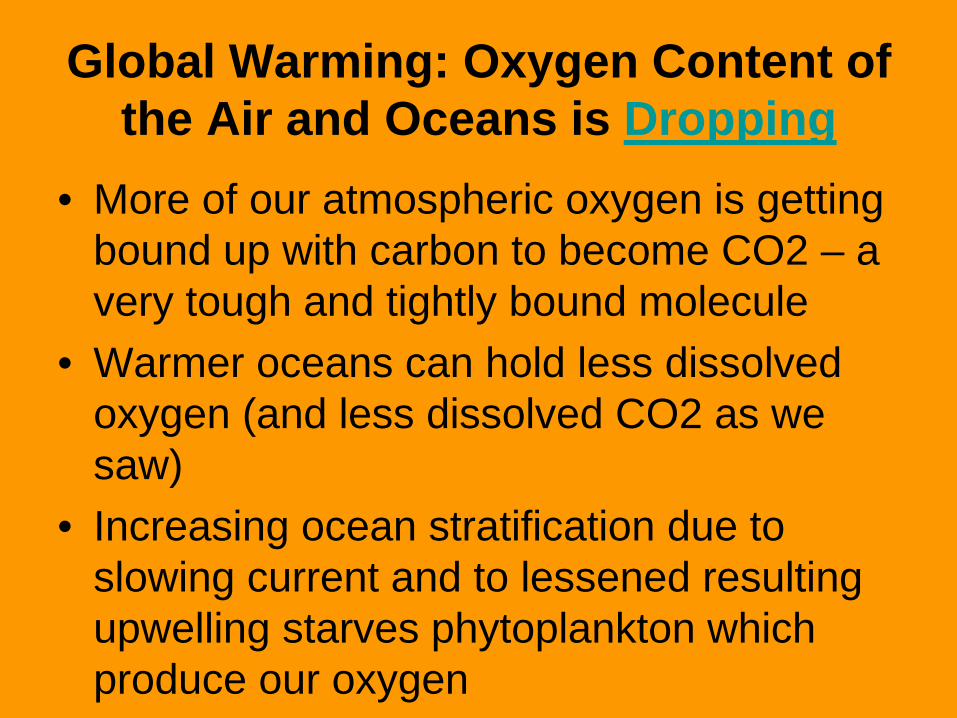
Global Warming: Oxygen Content of the Air and Oceans is Dropping
• More of our atmospheric oxygen is getting bound up with carbon to become CO2 – a very tough and tightly bound molecule
• Warmer oceans can hold less dissolved oxygen (and less dissolved CO2 as we saw)
• Increasing ocean stratification due to slowing current and to lessened resulting upwelling starves phytoplankton which produce our oxygen

Bottom axis= time 1960-2007. Vertical axes: Fraction of total emission of carbon which remains in the atmosphere (top), taken up by land biosphere (middle), and taken up by ocean (bottom). Note as the ocean absorbs more CO2 and warms, it is becoming less effective at soaking up
additional CO2. Land more complicated, as CO2 helps plants early on, but eventually dries soils and rapid growing zone shifts cripples plants (sorry for the terrible copy of this tiny graph.)
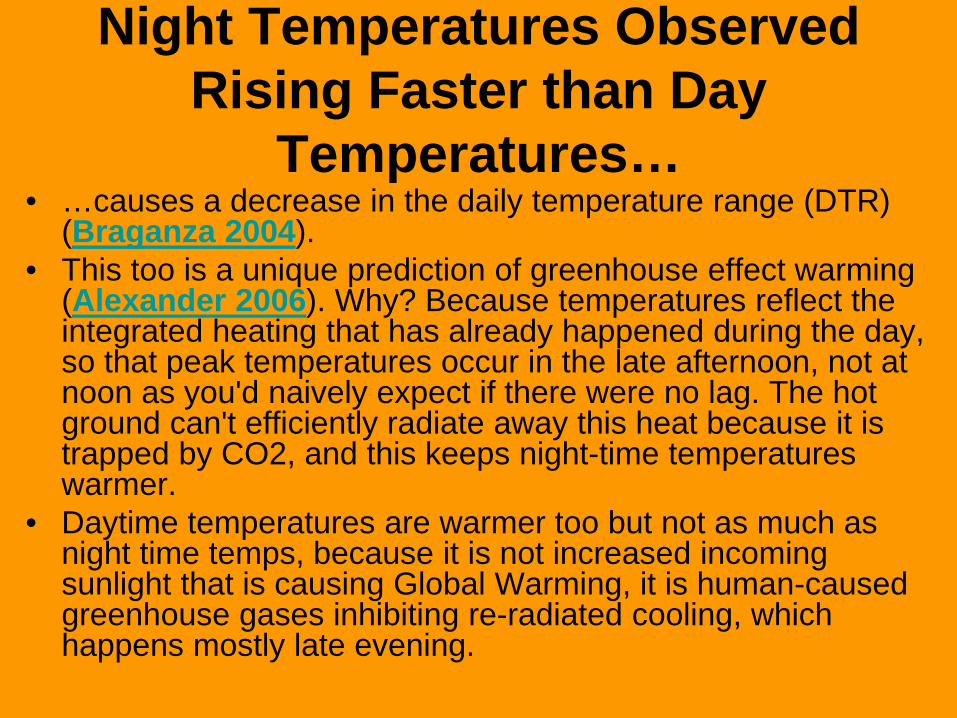
Night Temperatures Observed Rising Faster than Day
Temperatures… • …causes a decrease in the daily temperature range (DTR)
(Braganza 2004). • This too is a unique prediction of greenhouse effect warming
(Alexander 2006). Why? Because temperatures reflect the integrated heating that has already happened during the day, so that peak temperatures occur in the late afternoon, not at noon as you'd naively expect if there were no lag. The hot ground can't efficiently radiate away this heat because it is trapped by CO2, and this keeps night-time temperatures warmer.
• Daytime temperatures are warmer too but not as much as night time temps, because it is not increased incoming sunlight that is causing Global Warming, it is human-caused greenhouse gases inhibiting re-radiated cooling, which happens mostly late evening.
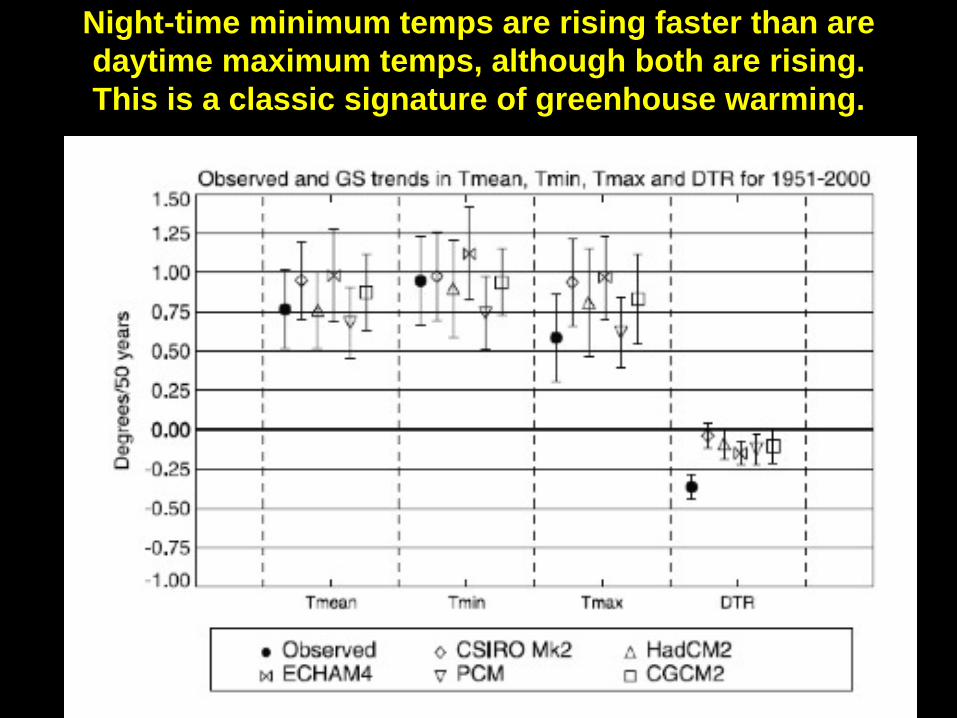
Night-time minimum temps are rising faster than are daytime maximum temps, although both are rising. This is a classic signature of greenhouse warming.
This effect is unfortunate. • Since it is the cold temperatures at night which
controlled pine bark beetles, zika mosquitoes, and many other pests
• Note in the mid/late 20th century data cooling by human-generated aerosol pollution and the PDO cool phase caused daytime temperatures to stay roughly constant in spite of increasing CO2, while nighttime temperature increased (Wild, Ohmura, and Makowski 2007).
• This data, however, is not quite as conclusive as it might appear. The DTR is a subtraction of two datasets which have noise, and is therefore noisier. Also, rising human-caused aerosols also affect night vs day temperatures in ways not well quantified yet.

Preferentially Rising Night Temps: Implications
• A study in 2015 shows that rising night time temperatures will decrease the amount by which forests can sequester CO2
• Plants and trees give back some photosynthesized CO2 to the atmosphere at night, and the higher temperatures will alter the balance between photosynthesis and respiration at night, and may even cause forests to stop their net sequestering carbon entirely in the future
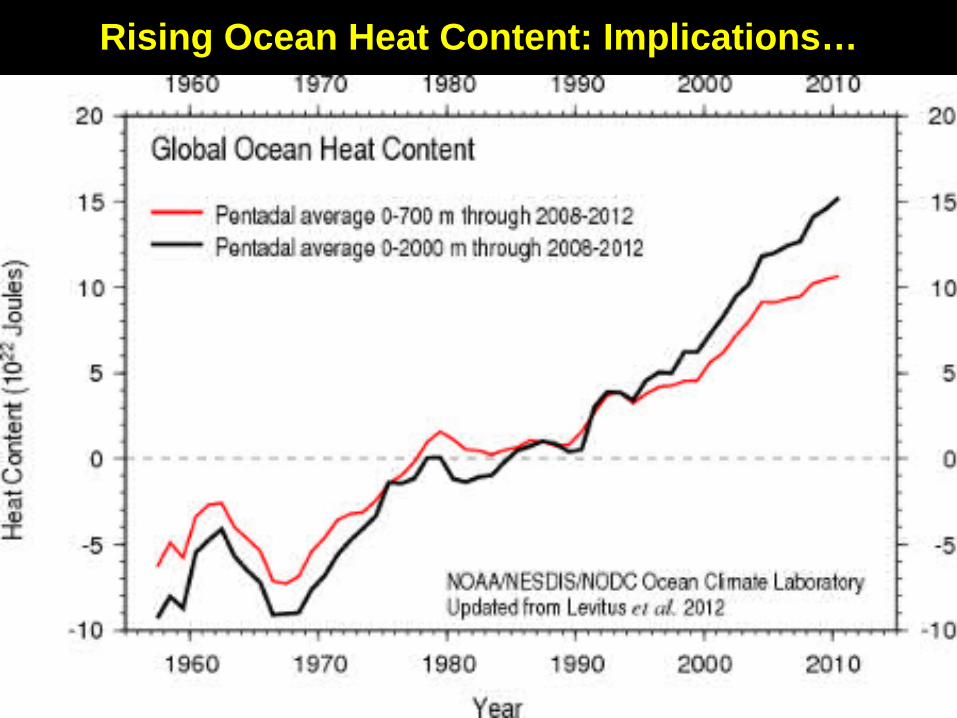
Rising Ocean Heat Content: Implications…
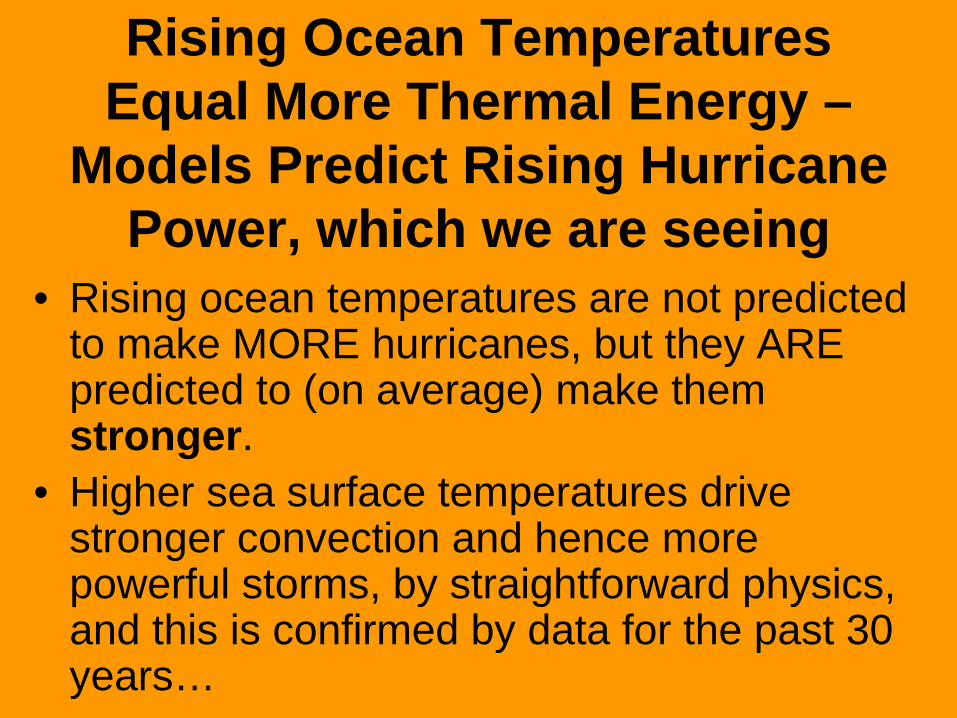
Rising Ocean Temperatures Equal More Thermal Energy –
Models Predict Rising Hurricane Power, which we are seeing
• Rising ocean temperatures are not predicted to make MORE hurricanes, but they ARE predicted to (on average) make them stronger.
• Higher sea surface temperatures drive stronger convection and hence more powerful storms, by straightforward physics, and this is confirmed by data for the past 30 years…
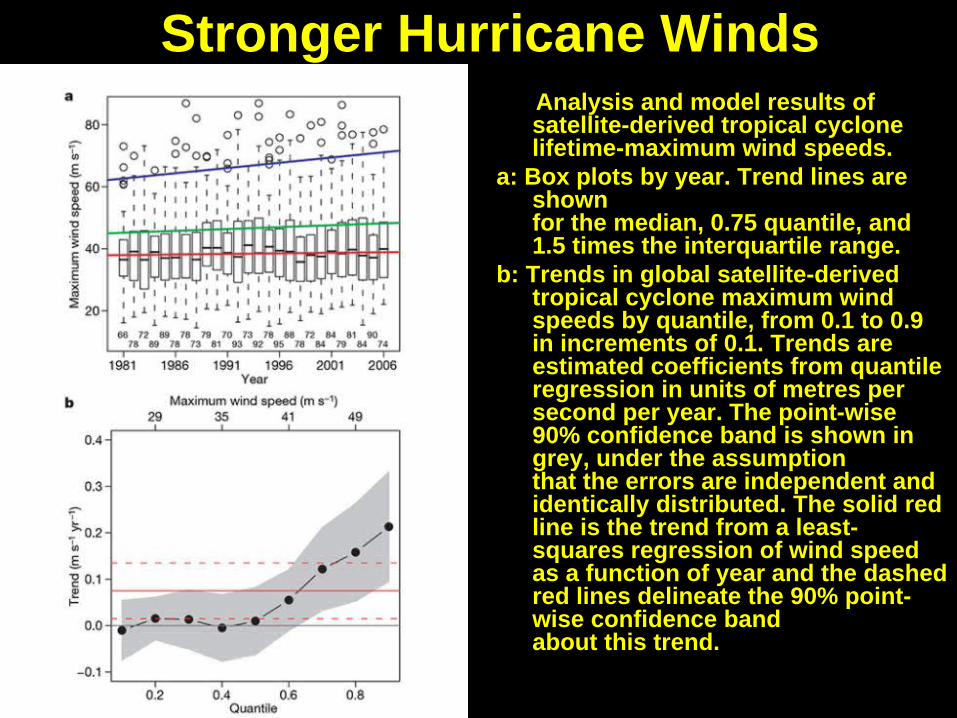
Stronger Hurricane Winds | Analysis and model results of
satellite-derived tropical cyclone lifetime-maximum wind speeds.
a: Box plots by year. Trend lines are shown for the median, 0.75 quantile, and 1.5 times the interquartile range.
b: Trends in global satellite-derived tropical cyclone maximum wind speeds by quantile, from 0.1 to 0.9 in increments of 0.1. Trends are estimated coefficients from quantile regression in units of metres per second per year. The point-wise 90% confidence band is shown in grey, under the assumption that the errors are independent and identically distributed. The solid red line is the trend from a least-squares regression of wind speed as a function of year and the dashed red lines delineate the 90% point-wise confidence band about this trend.
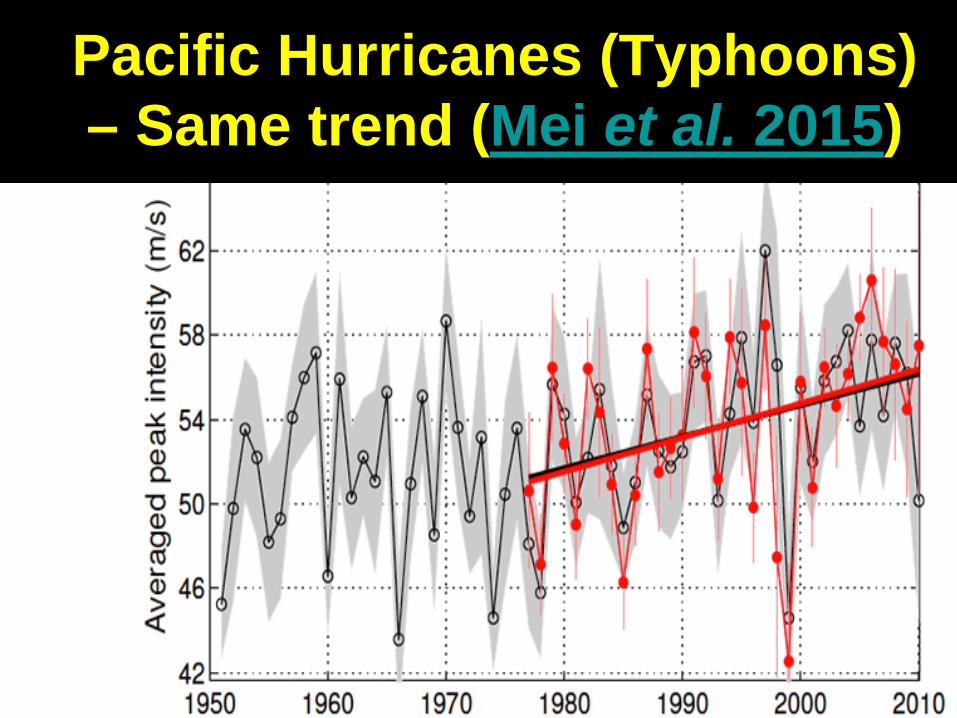
Pacific Hurricanes (Typhoons) – Same trend (Mei et al. 2015)

Stronger Convection -> Low Pressure Eye of Storm Deepens (gray) -> Driving Stronger Winds (dots)

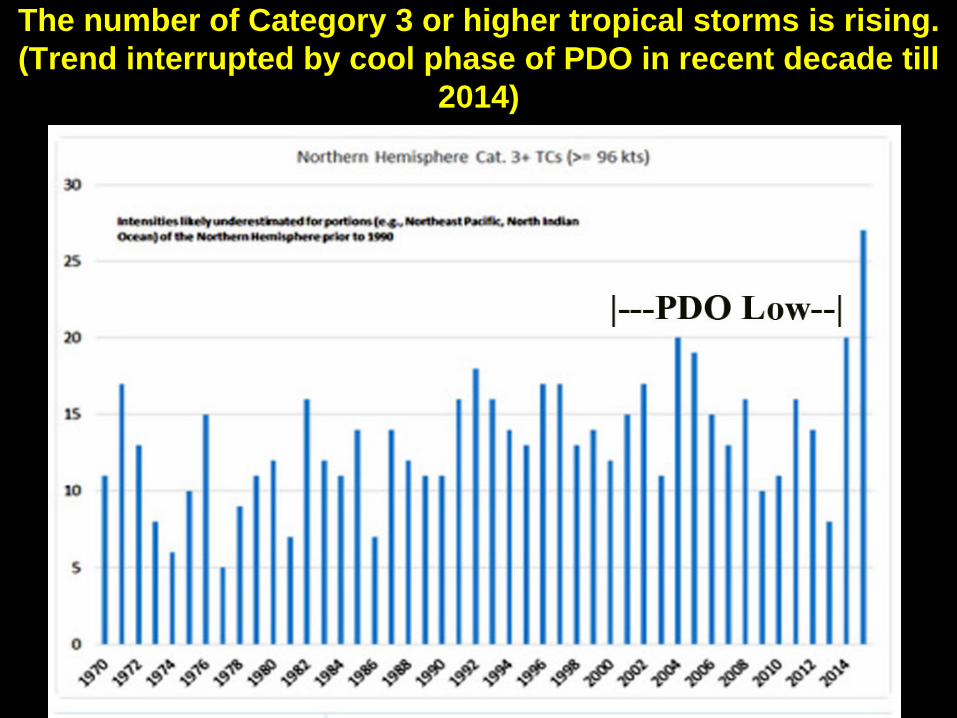
The number of Category 3 or higher tropical storms is rising. (Trend interrupted by cool phase of PDO in recent decade till
2014)
With stronger winds, higher humidities, and deeper hurricane
pressure gradients… • … no surprise that we’re seeing storms of
unprecedented power. • Hurricane Harvey in 2017 delivered a once-in-
25,000 year deluge to SE Texas. • What’s more, this same area had a once-in-500
year storm just a year earlier in 2016, and another once-in-500 year storm the year before that – in 2015
• But, as always… we pay attention only for as long as the news cycle, then tune out.

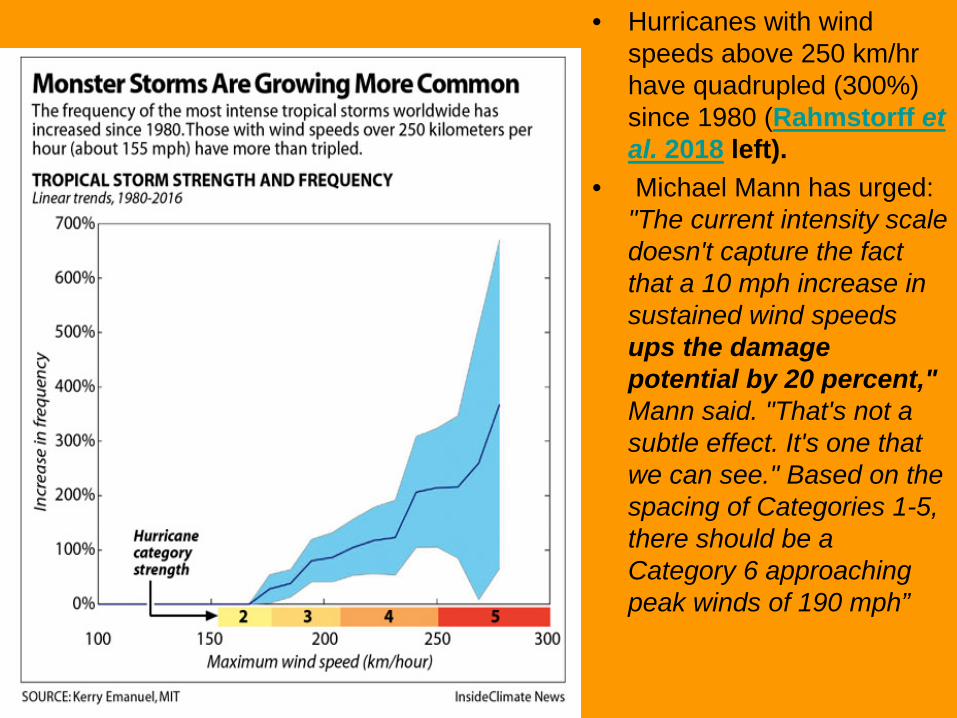
• Hurricanes with wind
speeds above 250 km/hr have quadrupled (300%) since 1980 (Rahmstorff et al. 2018 left).
• Michael Mann has urged: "The current intensity scale doesn't capture the fact that a 10 mph increase in sustained wind speeds ups the damage potential by 20 percent," Mann said. "That's not a subtle effect. It's one that we can see." Based on the spacing of Categories 1-5, there should be a Category 6 approaching peak winds of 190 mph”
What About Tornadoes? • Tornadoes are smaller and occur over land, w/o
the same water-condensation energy driver as hurricanes.
• Data is not good enough yet to say whether we see, or expect to see, stronger tornadoes as global warming ramps up.
• Disregard Richard Muller’s simplistic claim that tornadoes are perhaps weakening with global warming – he doesn’t seem to understand how to interpret the data. See links within story above.
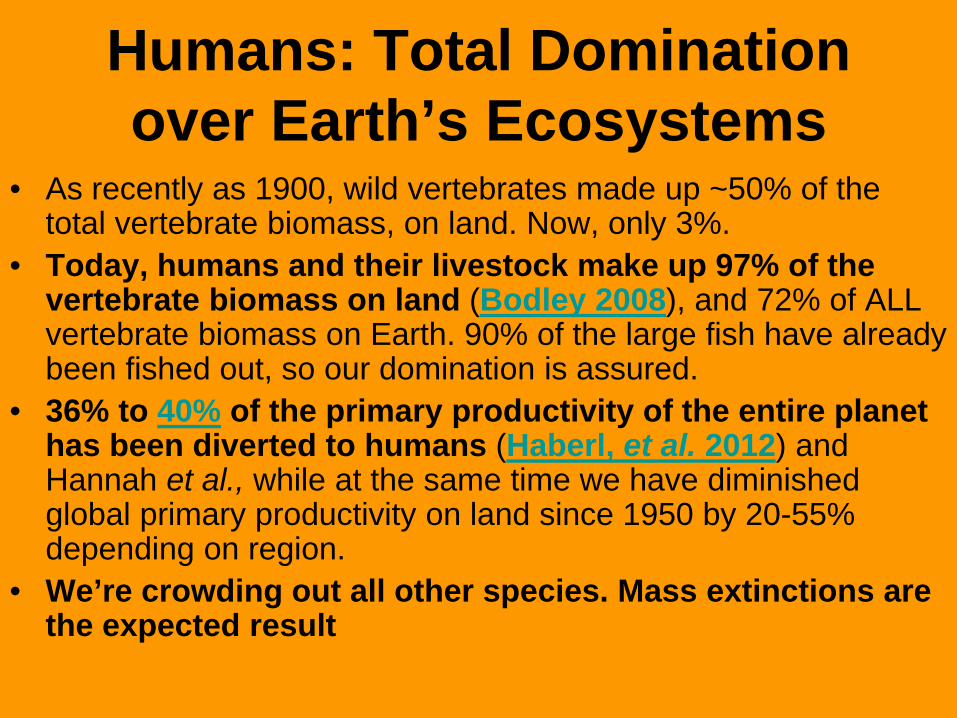
Humans: Total Domination over Earth’s Ecosystems
• As recently as 1900, wild vertebrates made up ~50% of the total vertebrate biomass, on land. Now, only 3%.
• Today, humans and their livestock make up 97% of the vertebrate biomass on land (Bodley 2008), and 72% of ALL vertebrate biomass on Earth. 90% of the large fish have already been fished out, so our domination is assured.
• 36% to 40% of the primary productivity of the entire planet has been diverted to humans (Haberl, et al. 2012) and Hannah et al., while at the same time we have diminished global primary productivity on land since 1950 by 20-55% depending on region.
• We’re crowding out all other species. Mass extinctions are the expected result
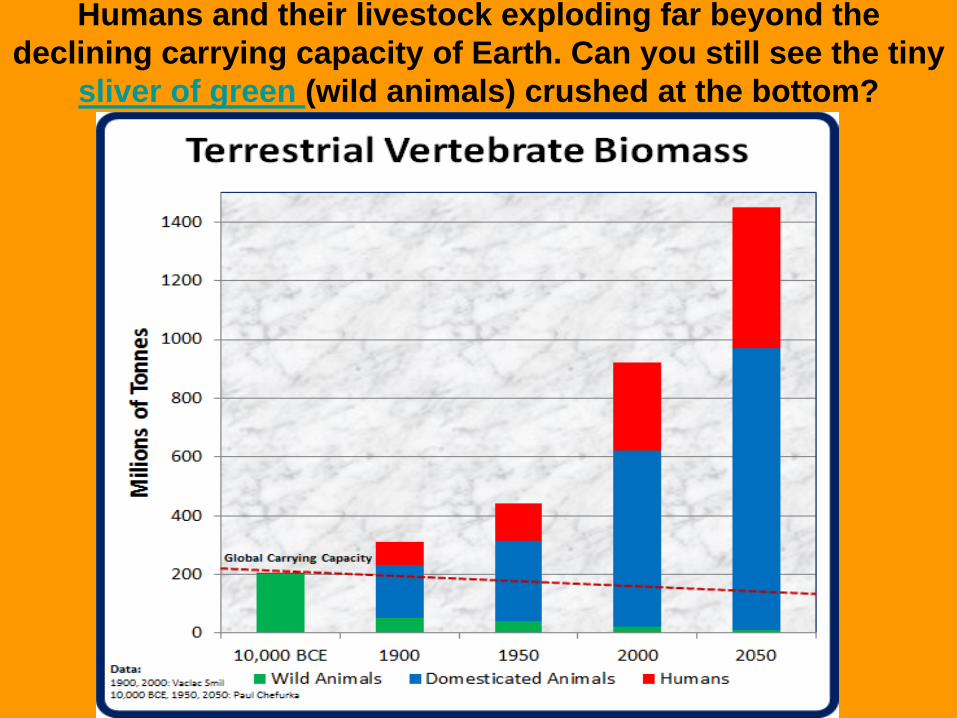
Humans and their livestock exploding far beyond the declining carrying capacity of Earth. Can you still see the tiny
sliver of green (wild animals) crushed at the bottom?

This 2008 graph is already out of date. Population passed 7 billion in 2012, at graph top. Human population is rising now at an unsustainable
rate of 1 billion additional people every 13 years. Mostly since fossil carbon energy was discovered and powered our domination

Humans – Multiplying. Other Species – Driven to Extinction. From U.S. Geologic Survey Data
Corals suffer from climate change for two reasons
• 1. Rising heat causes the corals to lose their colorful symbiotic algae, which produce oxygen and other nutrients for the coral polyps
• 2. Rising acidity is hurting the ability of aragonite corals and other aragonite species to pull CO2 out of the ocean and create the CaCO3 which constitute their exoskeleton
• This inability to create CaCO3 raises the saturation of CO2 in the ocean and hurts the ability of the oceans to absorb atmospheric CO2

Rising Acidity of the Oceans is Expected to Kill ~all
Aragonite Corals by 2050
• Aragonite corals are the beautiful multi-varied tropical corals we all think of, and which provide habitat for most of the ocean’s fish at some point in the fish’s life cycle (There are also soft corals, which are not threatened) (EarthTouch video 12:39)
• Already, 83% of the original Caribbean coral reefs have died


It may be happening faster… 2016’s record heat is bleaching virtually all of the aragonite coral Northern Great Barrier Reef – a thousand kilometers long – this is the largest coral reef in
the world, now bleached white …
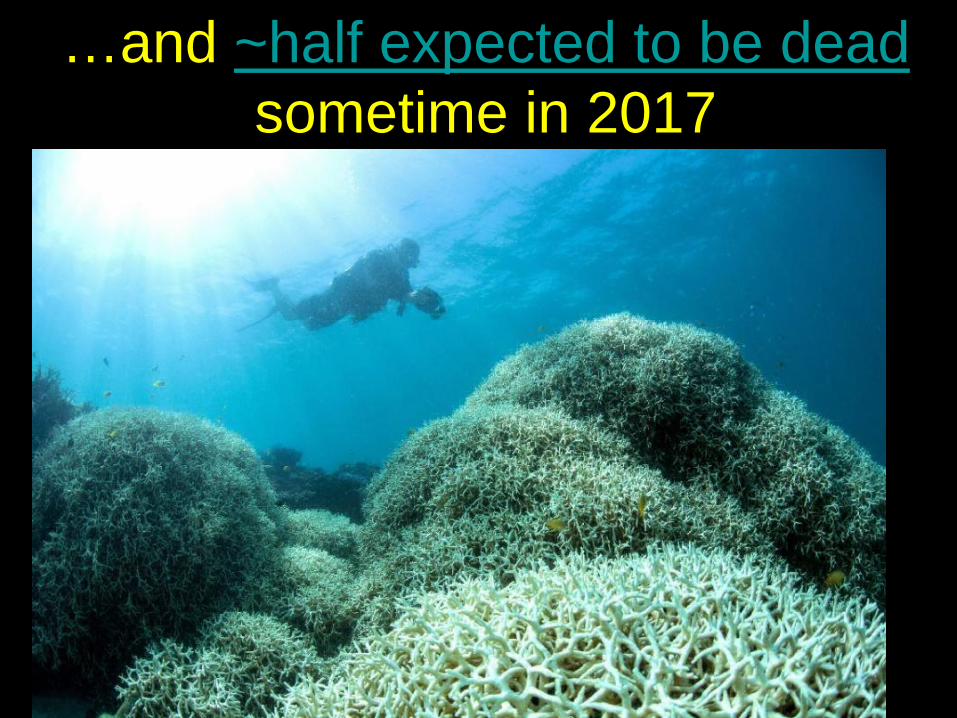
…and ~half expected to be dead sometime in 2017
And now, near the end of 2016: • "The Great Barrier Reef of Australia passed away
in 2016, after a long illness. It was 25 million years old." • That startling first sentence leads a must-read obituary by Rowan
Jacobsen for Outside Magazine online. • "For most of its life, the reef was the world’s largest living structure, and
the only one visible from space. It was 1,400 miles long, with 2,900 individual reefs and 1,050 islands. In total area, it was larger than the United Kingdom, and it contained more biodiversity than all of Europe combined. It harbored 1,625 species of fish, 3,000 species of mollusk, 450 species of coral, 220 species of birds, and 30 species of whales and dolphins. Among its many other achievements, the reef was home to one of the world’s largest populations of dugong and the largest breeding ground of green turtles.“
• However, in fairness, the reef is not quite dead, only 93% of the reef has been bleached in 2016, mostly at the warmer northern end.
• Now in 2017, the Reef’s again being bleached, now reaching the middle, with recovery less likely (video 1:20)
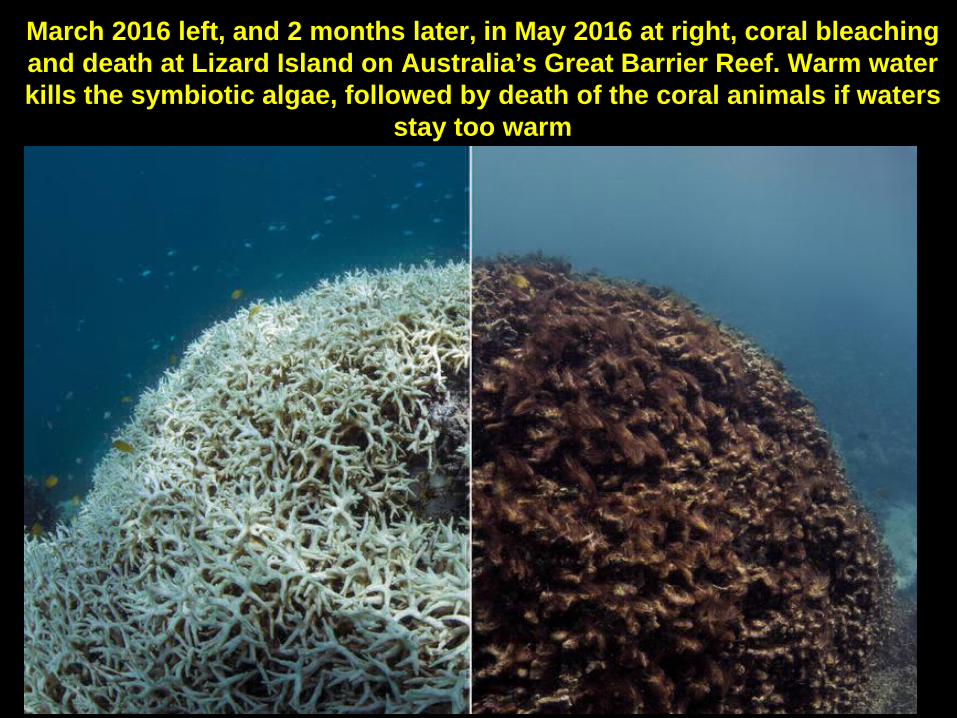
March 2016 left, and 2 months later, in May 2016 at right, coral bleaching and death at Lizard Island on Australia’s Great Barrier Reef. Warm water kills the symbiotic algae, followed by death of the coral animals if waters
stay too warm
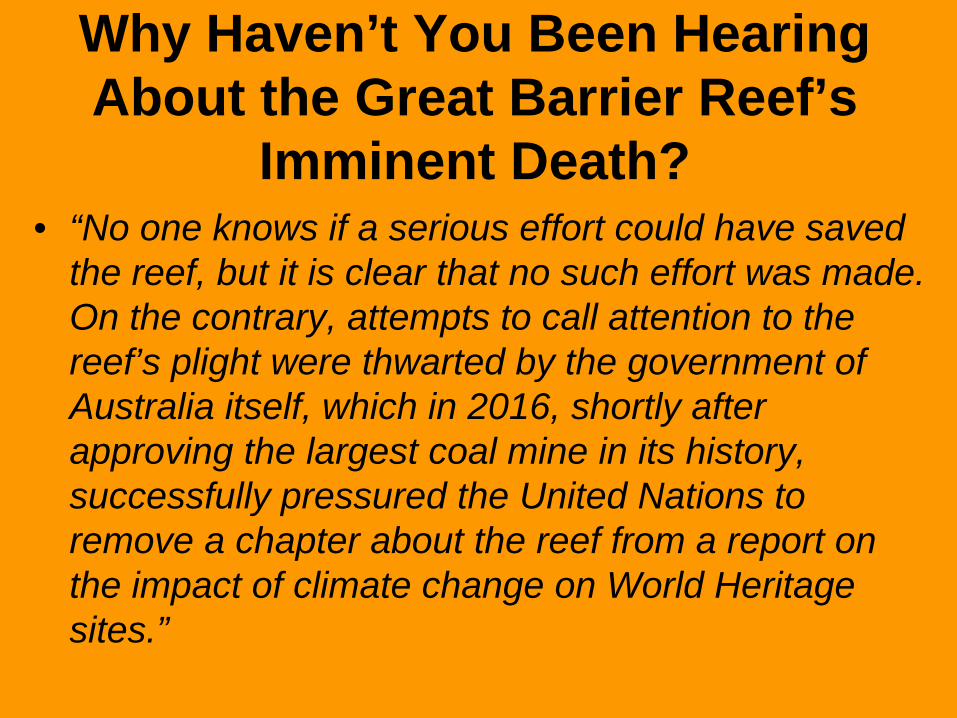
Why Haven’t You Been Hearing About the Great Barrier Reef’s
Imminent Death? • “No one knows if a serious effort could have saved
the reef, but it is clear that no such effort was made. On the contrary, attempts to call attention to the reef’s plight were thwarted by the government of Australia itself, which in 2016, shortly after approving the largest coal mine in its history, successfully pressured the United Nations to remove a chapter about the reef from a report on the impact of climate change on World Heritage sites.”

It’s Just Business • Australia’s Department of the
Environment explained the move by saying, ‘experience had shown that negative comments about the status of World Heritage-listed properties impacted on tourism.’ In other words, if you tell people the reef is dying, they might stop coming.”
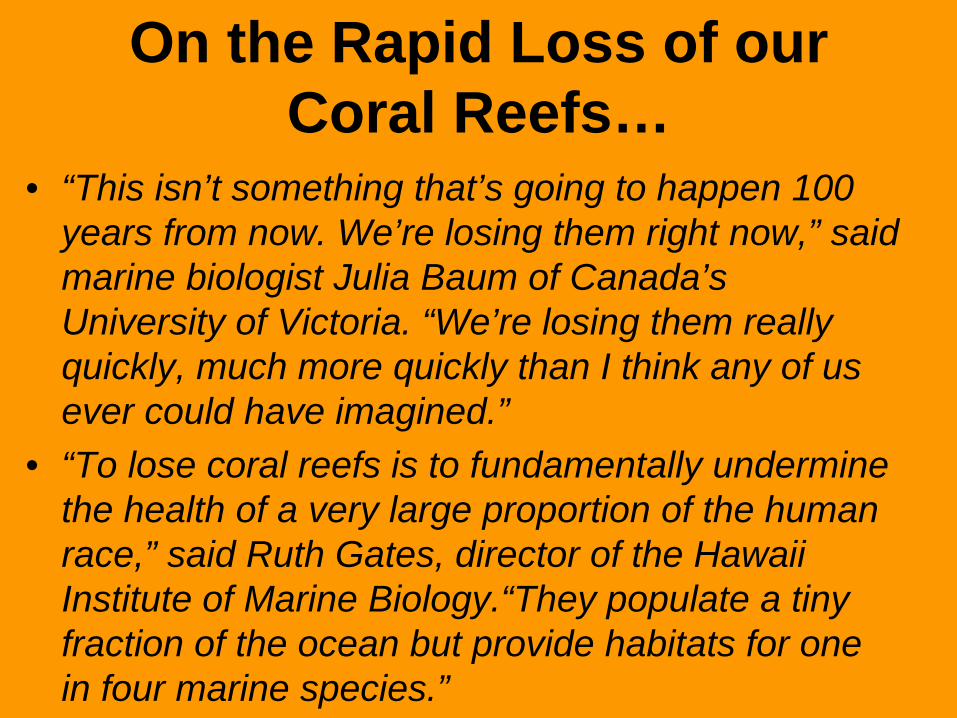
On the Rapid Loss of our Coral Reefs…
• “This isn’t something that’s going to happen 100 years from now. We’re losing them right now,” said marine biologist Julia Baum of Canada’s University of Victoria. “We’re losing them really quickly, much more quickly than I think any of us ever could have imagined.”
• “To lose coral reefs is to fundamentally undermine the health of a very large proportion of the human race,” said Ruth Gates, director of the Hawaii Institute of Marine Biology.“They populate a tiny fraction of the ocean but provide habitats for one in four marine species.”
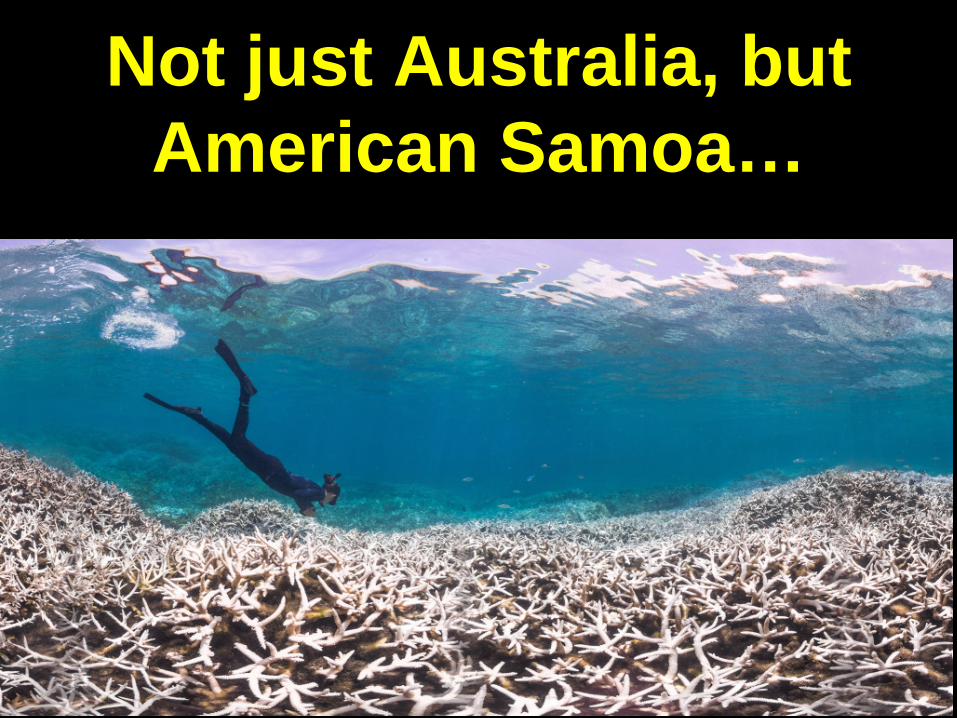
Not just Australia, but American Samoa…
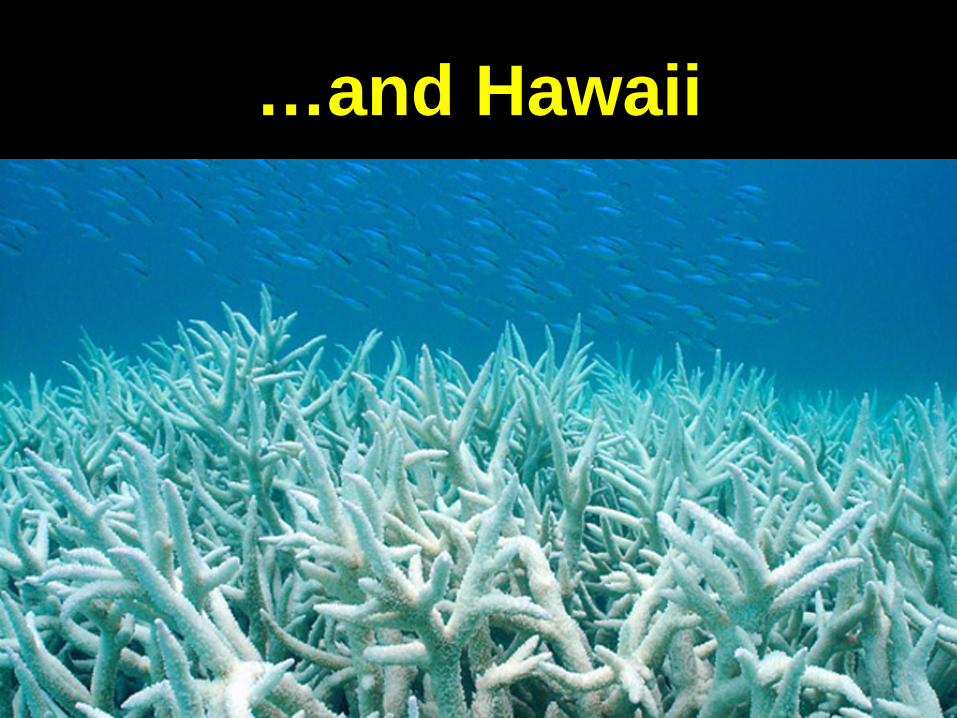
…and Hawaii

Current Extinction Rate: Estimated at 1,000 Times the Normal Historical Background Rate, Rising to
10,000 Times (de Vos et al. 2014)
90% of all large fish are already gone.
• Why? Over-fishing, death of coral reefs (needed by ~half of all fish species at some point in their life cycle) dying due to CO2 induced ocean acidification and warming. Phytoplankton at base of food chain in decline
• McClennahan (2009) has documented how the loss of coral reef systems has affected the size and species mix of fish using historical photographs from Florida “trophy” fishing businesses over the past 50 years. The progression is startling…
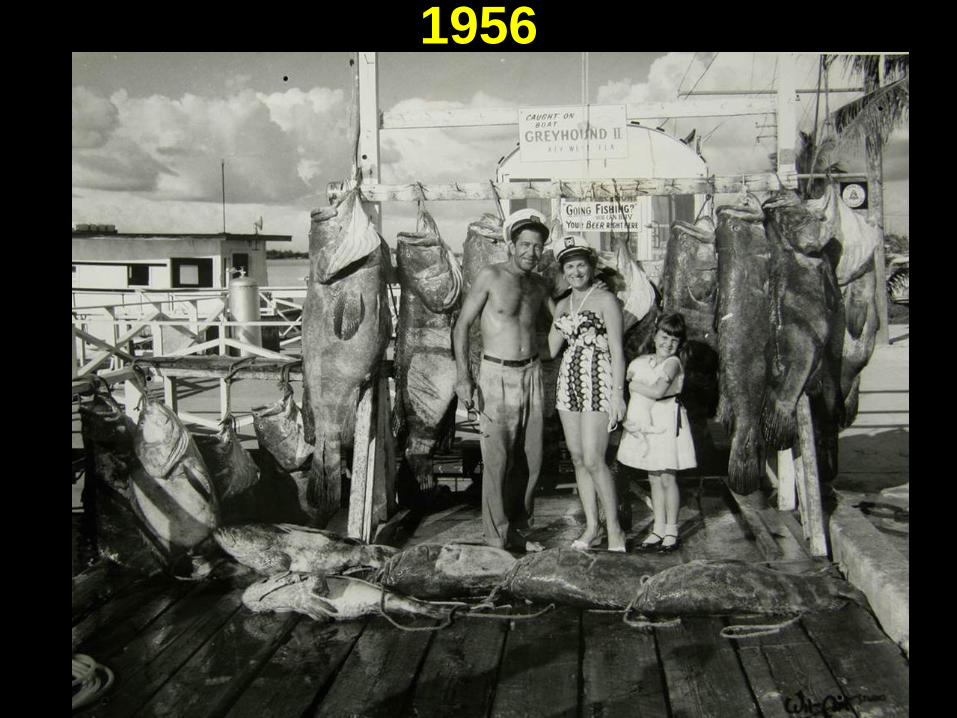
1956
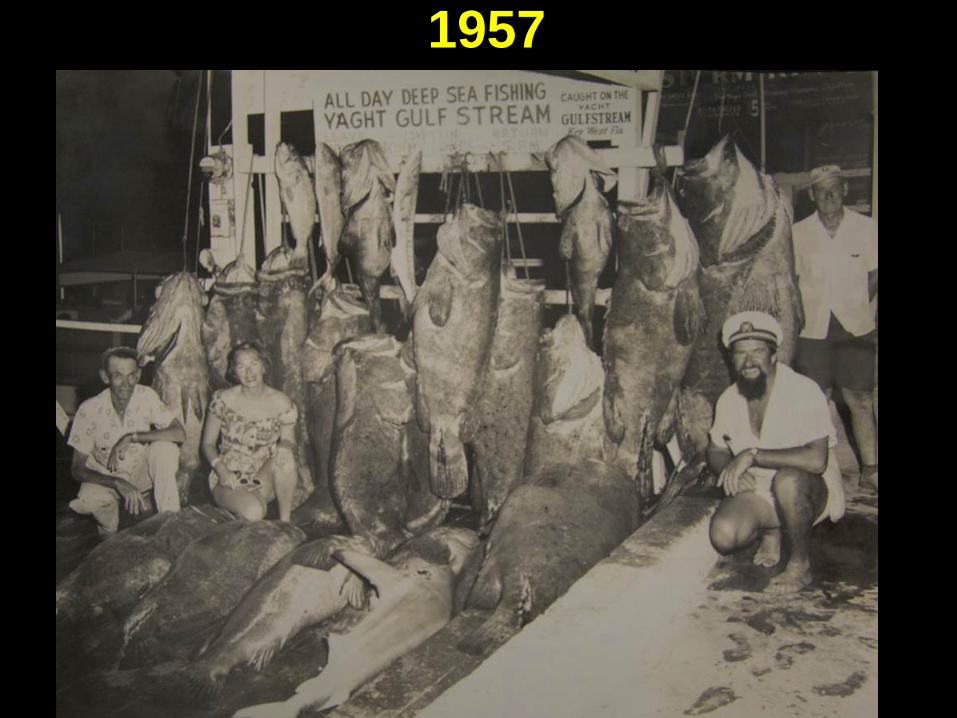
1957

1965
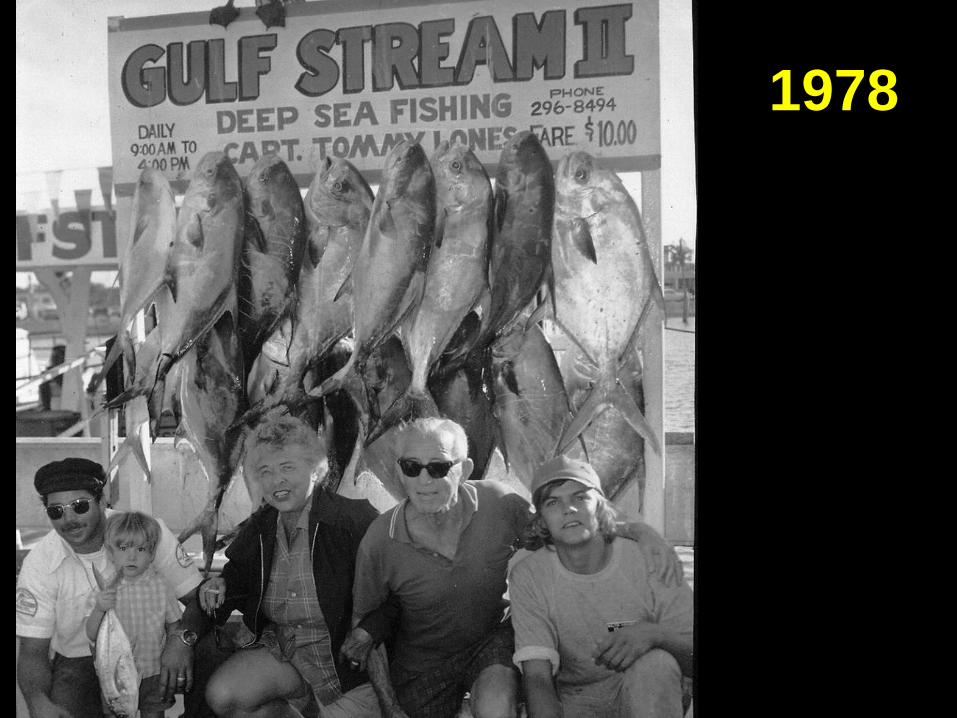
1978
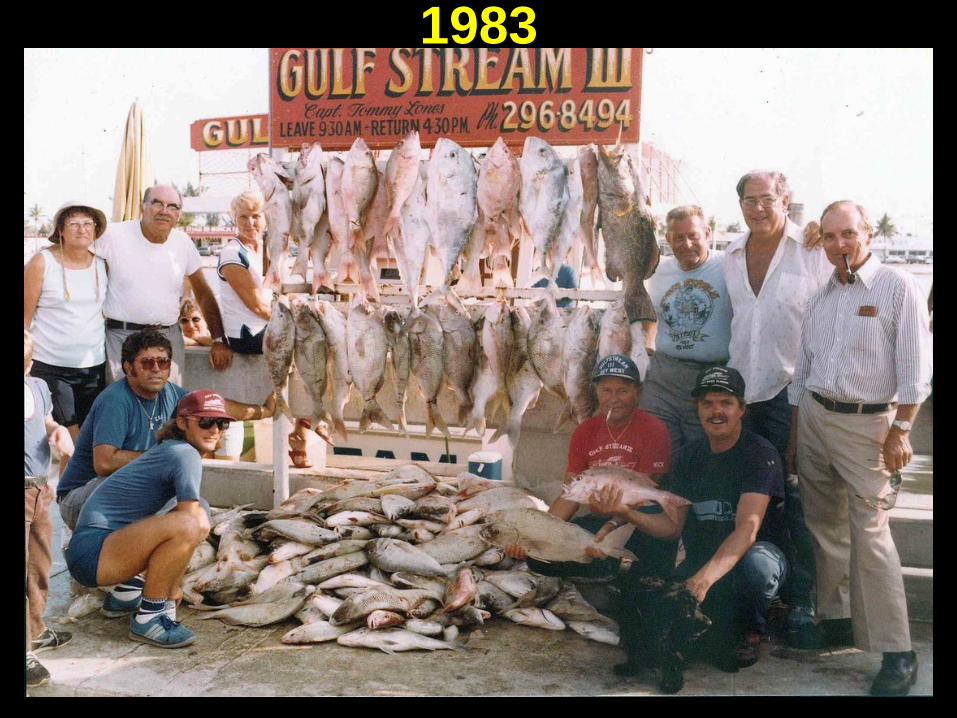
1983
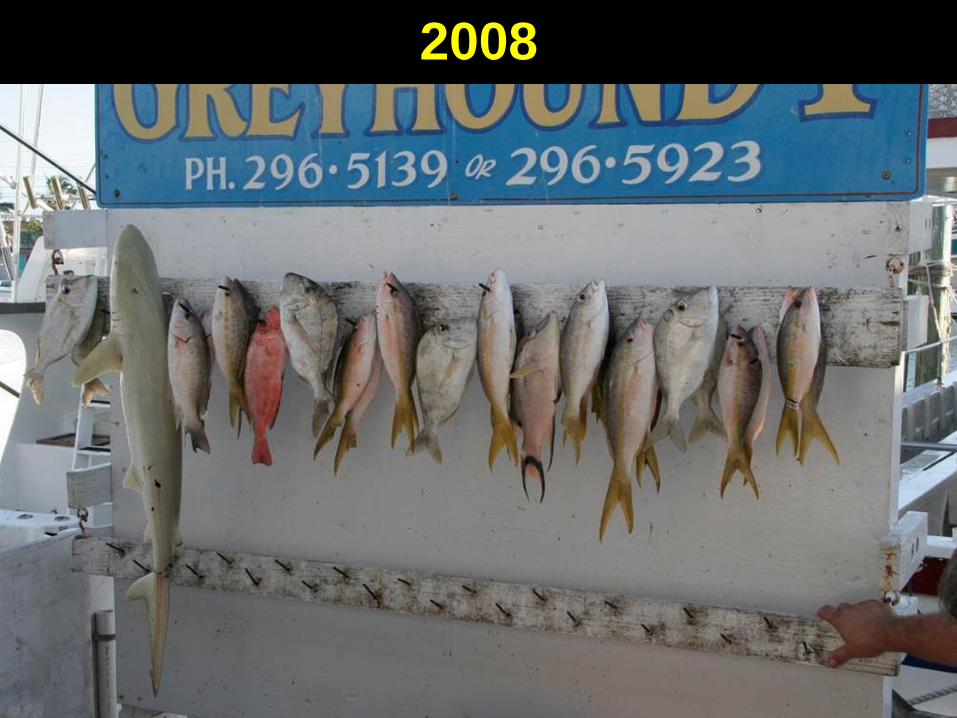
2008
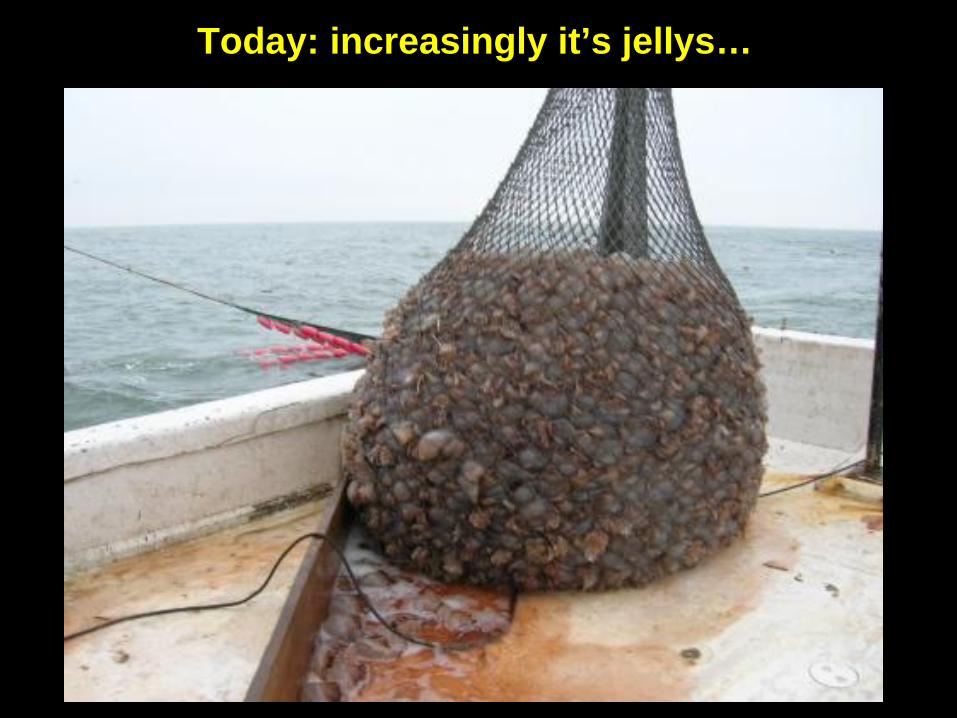
Today: increasingly it’s jellys…

There are people trying to figure out how to eat them. They already do, in some poor
Asian countries.
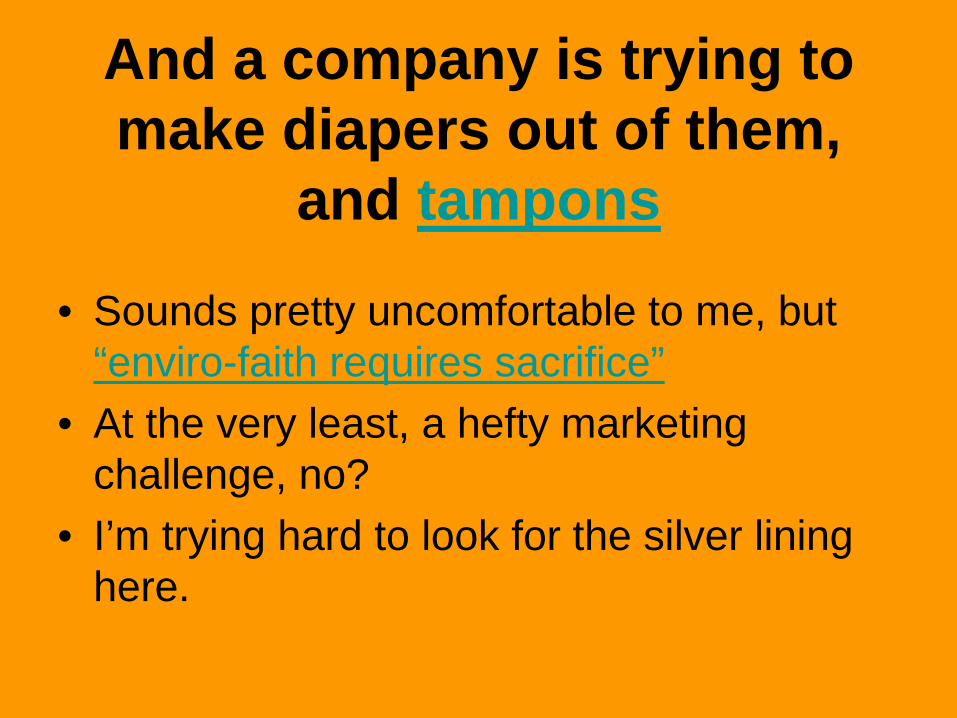
And a company is trying to make diapers out of them,
and tampons
• Sounds pretty uncomfortable to me, but “enviro-faith requires sacrifice”
• At the very least, a hefty marketing challenge, no?
• I’m trying hard to look for the silver lining here.

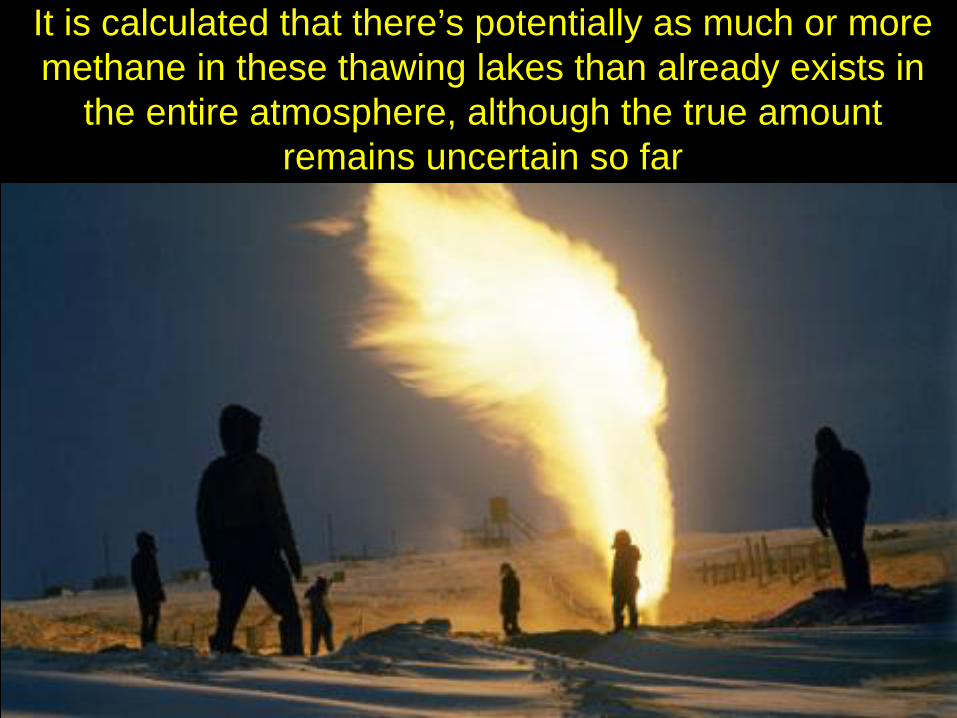
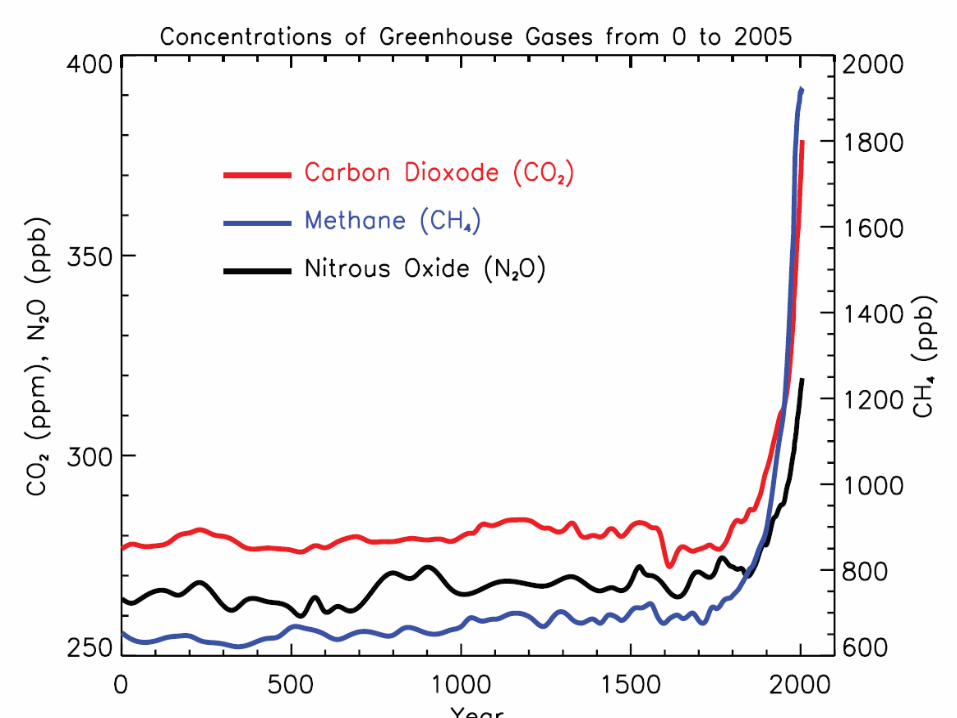
Methane=CH4: From domesticated cattle, from melting permafrost, and peat, is ~25x more
powerful as a greenhouse gas than CO2, pound for pound (avg’ed over 100 yrs)
• Melting Permafrost Accelerating Global Warming –
methane trapped in melting Arctic Lakes is being released. Still a minor source of global methane emission today, but rising, and a long term major threat (see “K42: the Future)
• K. Anthony (U. Fairbanks) on Arctic lake methane
• Note, Methane oxidizes to water + CO2. The half-life residence time of a CH4 molecule in the atmosphere is about 10 years. Both water and CO2 are less powerful greenhouse gases than methane.
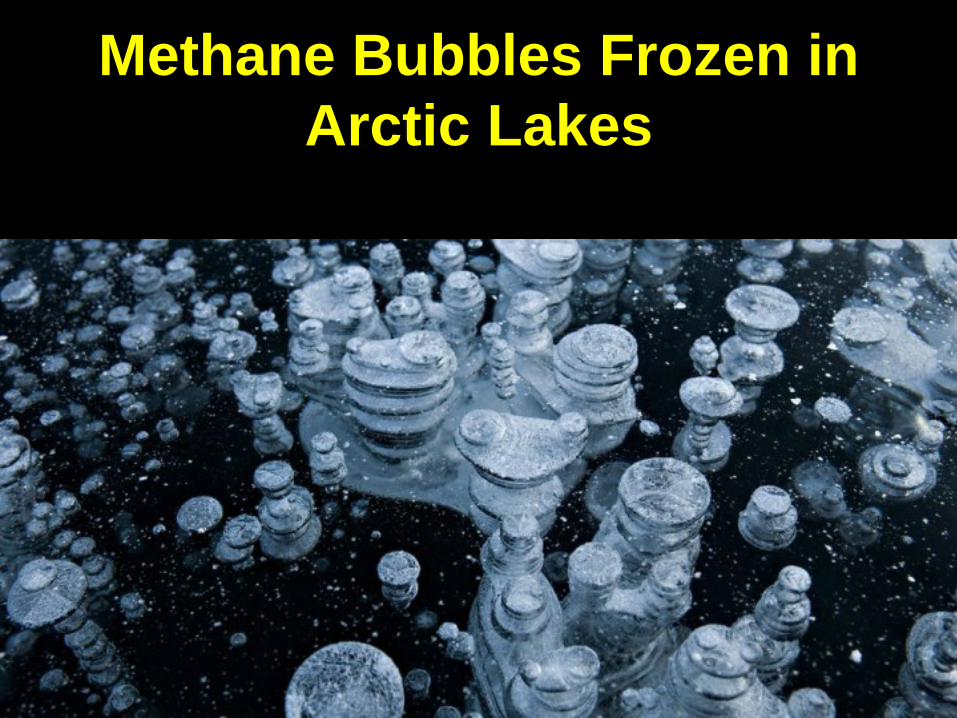
Methane Bubbles Frozen in Arctic Lakes
It is calculated that there’s potentially as much or more methane in these thawing lakes than already exists in
the entire atmosphere, although the true amount remains uncertain so far
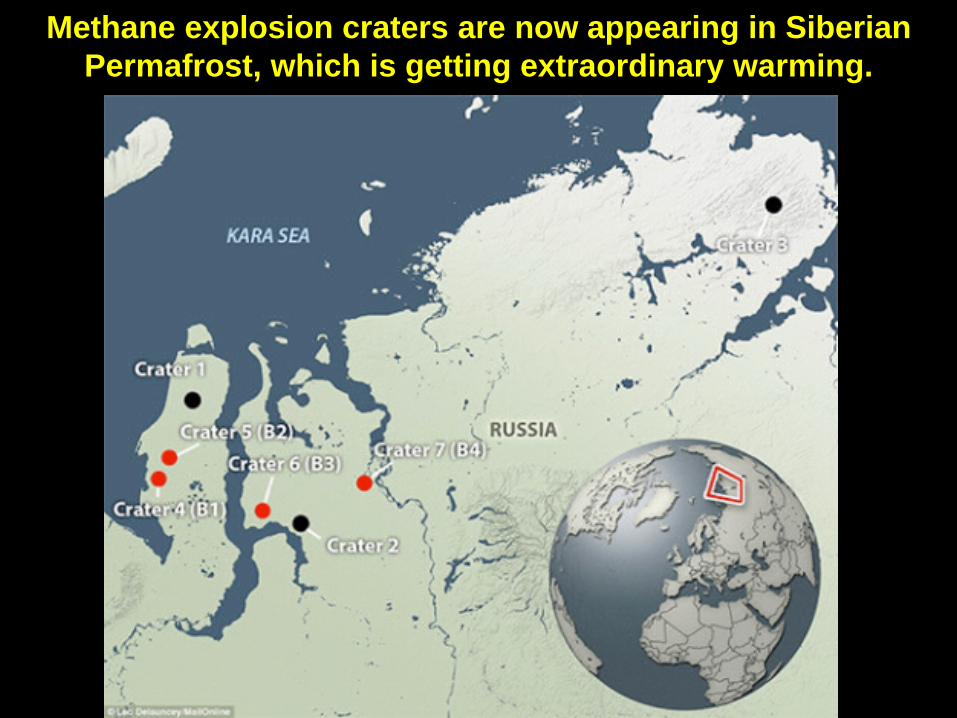
Methane explosion craters are now appearing in Siberian Permafrost, which is getting extraordinary warming.
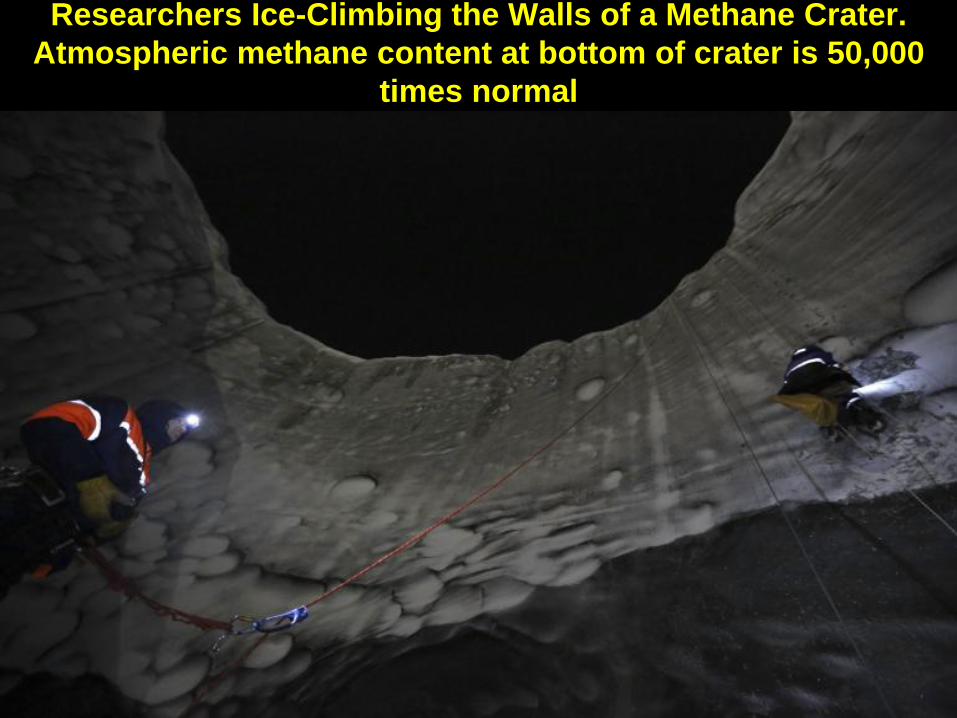
Researchers Ice-Climbing the Walls of a Methane Crater. Atmospheric methane content at bottom of crater is 50,000
times normal
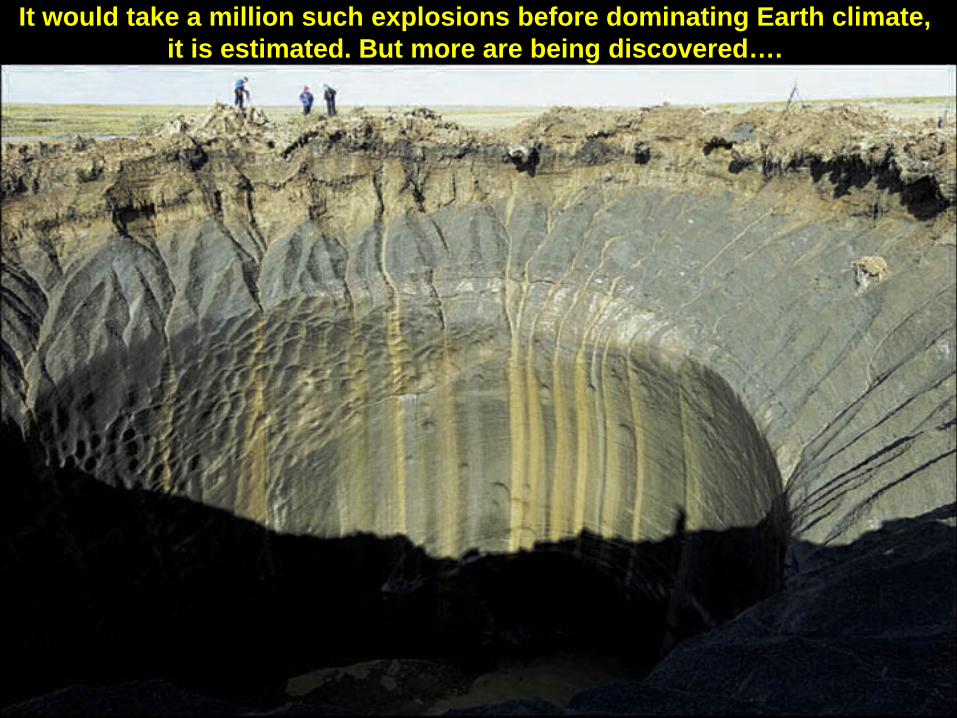
It would take a million such explosions before dominating Earth climate, it is estimated. But more are being discovered….

The amount of additional greenhouse warming is uncertain; but certainly significant if injection becomes rapid, since
methane is ~100 times more powerful than CO2, pound for pound as emitted. Ongoing research hopefully will clarify
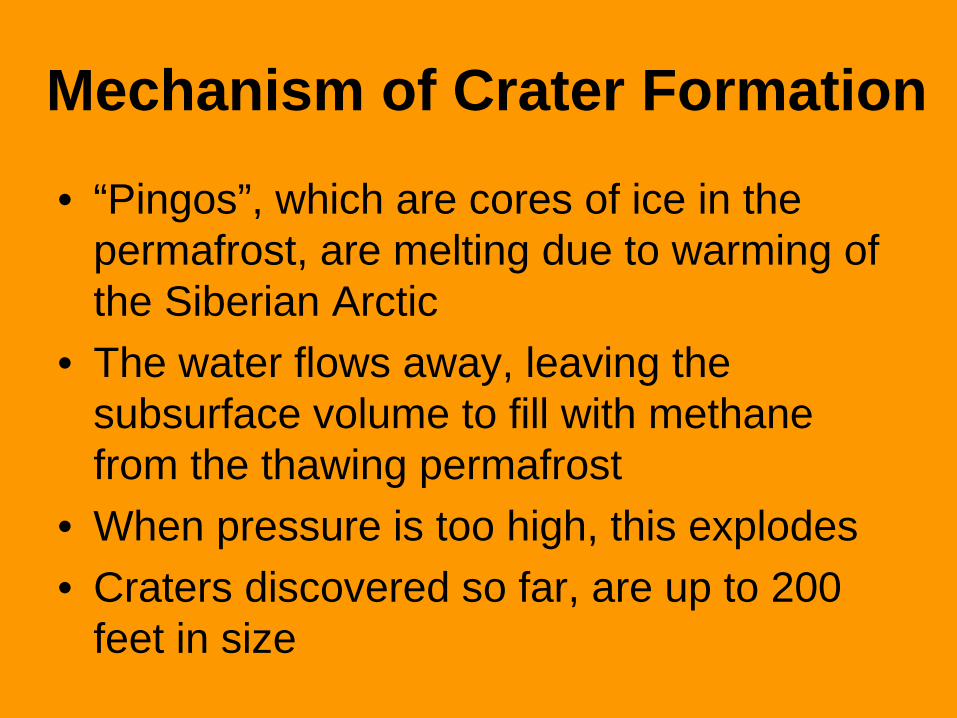
Mechanism of Crater Formation
• “Pingos”, which are cores of ice in the permafrost, are melting due to warming of the Siberian Arctic
• The water flows away, leaving the subsurface volume to fill with methane from the thawing permafrost
• When pressure is too high, this explodes • Craters discovered so far, are up to 200
feet in size
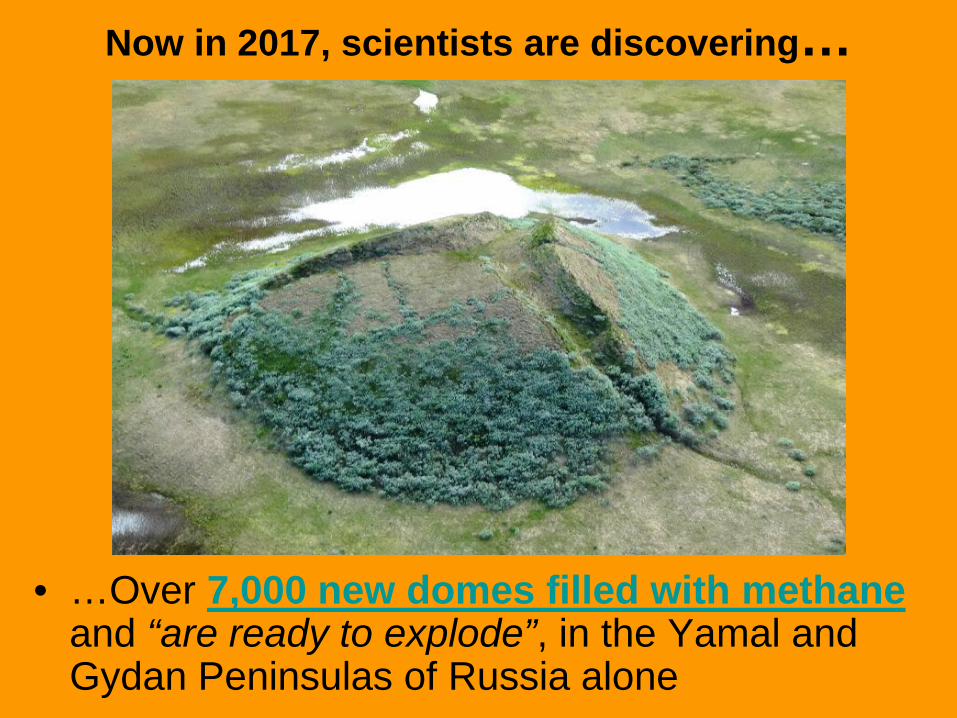
Now in 2017, scientists are discovering…
• …Over 7,000 new domes filled with methane and “are ready to explode”, in the Yamal and Gydan Peninsulas of Russia alone

Disturbing as the future rise of permafrost CO2 and methane is (see separate powerpoint on “Post IPCC Climate Science”) currently the
evidence is that it is a very minor part of our methane rise. Mostly it is due to tropical wetlands and our agriculture and livestock
The Boundary Between the Polar Cell and the Ferrel Cell is the
Polar Jet Stream • The steep temperature gradient between
these cells means a steep pressure gradient (density difference between cold dense air and warmer less dense air)
• This causes high winds in the upper troposphere – the Jet Stream (short video animation)
• The jet stream guides mid-latitude low-pressure (storm) systems.

The boundaries between cells, where air pressure differences can drive fast winds, are called the “Jet Streams”. If the winds are
fast, the streams tend to be straighter-going west-to-east. If they weaken, they can meander north and
south more (as seems to be happening with current climate change). They also tend to get “stuck” for long
periods; even years

Weakening Jet Stream means Meandering, means longer lasting storms and droughts
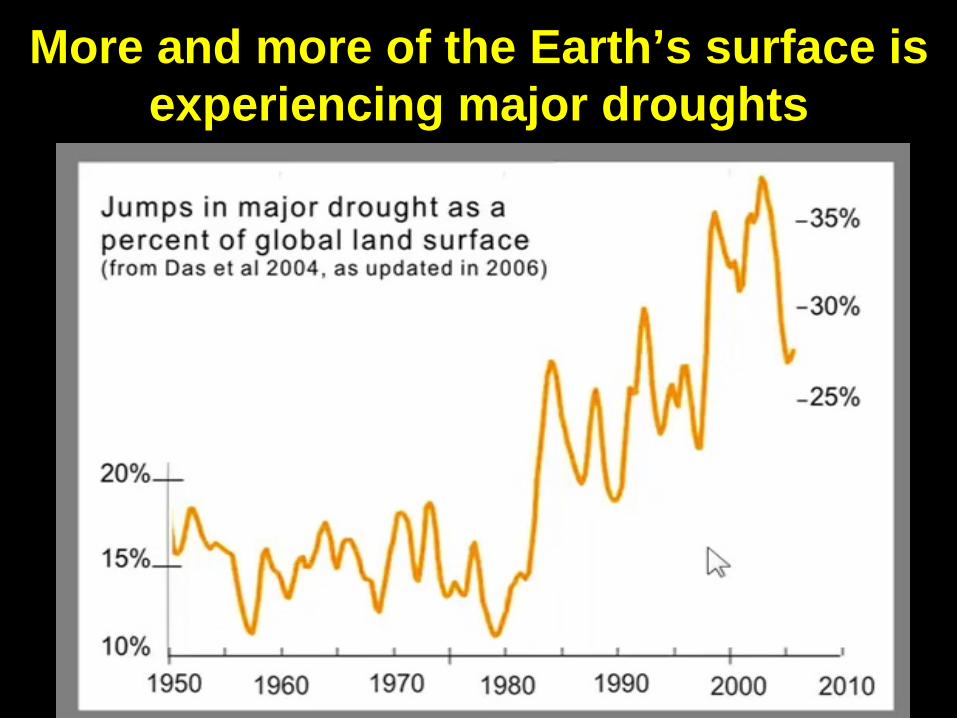
More and more of the Earth’s surface is experiencing major droughts
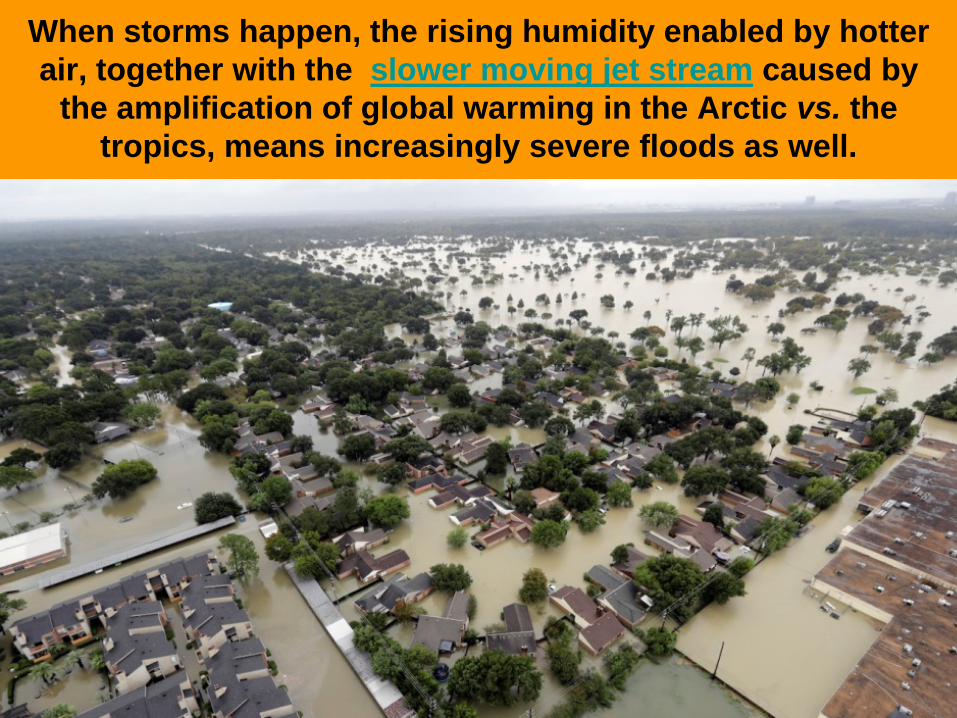
When storms happen, the rising humidity enabled by hotter air, together with the slower moving jet stream caused by
the amplification of global warming in the Arctic vs. the tropics, means increasingly severe floods as well.
If the temperature gradient between the Polar and Ferrel cells in the Pacific decreases
• … it makes for a weaker Polar Cell • … it makes for a weaker Polar Jet Stream, which
then meanders more in latitude but on average migrates poleward.
• It will also cause the tropical cell to expand (more heating) and the desert band to migrate northward in the Northern Hemisphere.
• This has already been observed.
Expansion of the Hadley Tropical Cell
• In a variety of climate models (Barnes and Polvani 2013, a doubling of CO2 from 280 ppm to 560 ppm, (which seems virtually unavoidable) indicates the northern hemisphere jet stream boundary migrates north by 1 degree (112 km), and twice that in the Southern Hemisphere (Bengtsson et al. 2005) .
• However, Hansen says observations actually indicate as much as a 4 degrees (270 miles) of north shift has already happened (17 min into this talk)
• Currently, at 410 ppm, we’re 46% of the way towards a doubling of pre-industrial level CO2 concentrations.
• Observations are outpacing the models’ northward migration by a factor of 3.

Hadley Cells and the Rising Temperature of the Oceans
• Rising ocean temperatures is raising the energy of the Tropical Cell by 570 billion watts per year, since 1979 (Huang & McIlroy 2014)
• Combined with the weakening cold of the Arctic polar cell, this is causing the polar cell boundary (polar jet stream) to migrate poleward, carrying “horse latitude” desert northward as well
• Southern California’s climate will become Northern California’s climate, it is predicted.
Tropical Diseases Spreading North
• As hot temperatures rise in the tropics and spread north and south to formerly temperate latitudes, tropical disease rates are rising steeply…
• Dengue fever cases have risen 2000% in Brazil since 1990
• Tropical diseases are spreading north into the U.S. (Scientific American article)
• Dengue fever, malaria, Lyme disease, chagas disease, among others
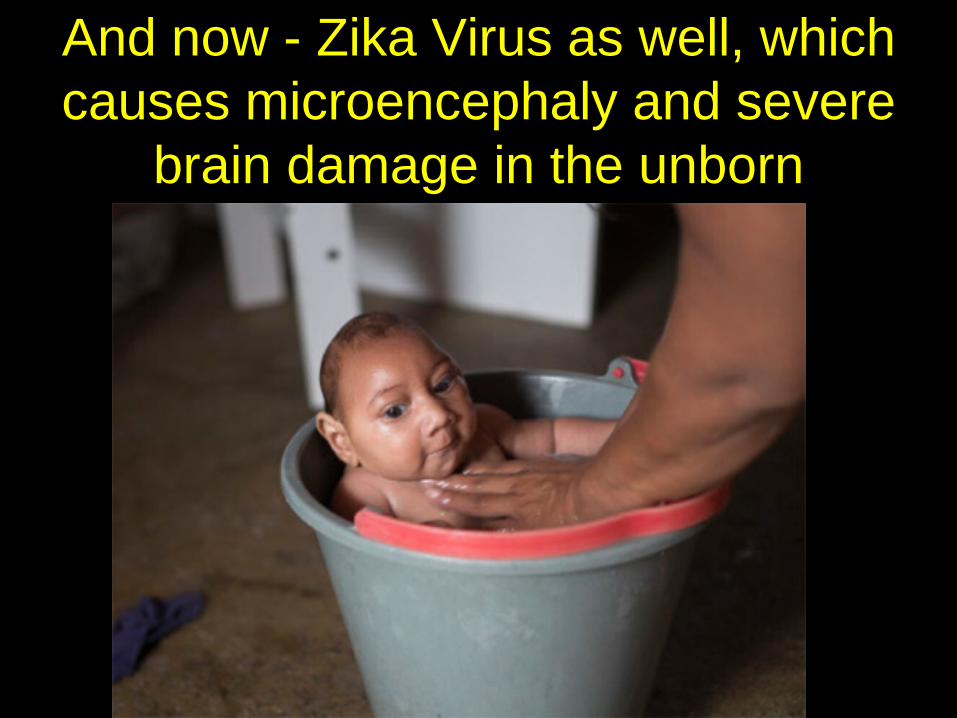
And now - Zika Virus as well, which causes microencephaly and severe
brain damage in the unborn

It isn’t just these tragic Zika victims who will suffer mental handicaps
• Satish et al. 2012 (and discussed further here) show that all of us will suffer a strikingly large 21% reduction in decision-making ability when CO2 levels reach 560ppm, and accelerating worse with higher levels.
• When we need clear thinking most, we will be even less able to pick competent leaders, if that is possible.
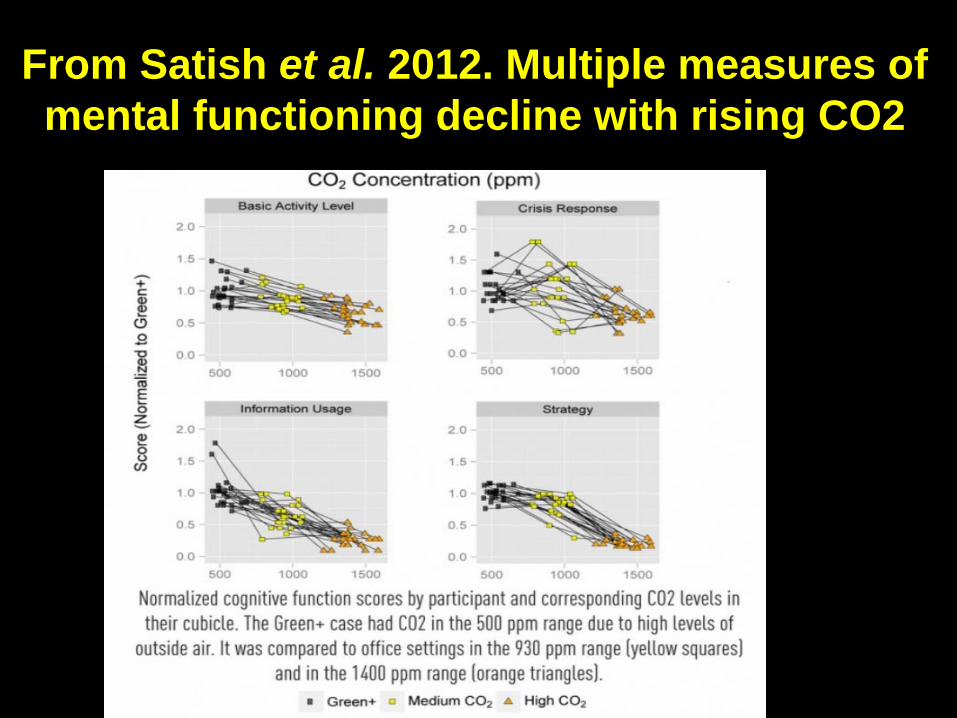
From Satish et al. 2012. Multiple measures of mental functioning decline with rising CO2

Bees suffering as well. Protein content of pollen is dropping due to rising CO2
Compounding Pollution from Rising Seas
• Louisiana’s Big Oil counted on barrier islands and swamps to prevent exposure of oil pipeline infrastructure from corrosive seawater and storm surges
• Maybe they should have thought about rising sea levels caused by their business models destroying that “protection” – and the looming $100 billion nightmare now just beginning to unfold
• Stories like this will multiply of course. Not time in this course to list them all

Key Points: K38d – Current Climate Change: Other Effects
• Ocean phytoplankton in decline since 1950, and continuing to worsen • Hurricane wind speeds are rising, as predicted • Stratosphere cooling while troposphere warming: a signature of greenhouse
warming • Night temps rising faster than day temps: a signature of greenhouse
warming • Aragonite corals to disappear by ~2050 with unknown but significant
extinctions of fish populations which depend on them, due to ocean acidification
• Most large wild fish – gone. Most vertebrate wild animals – gone. We and our livestock are 97% of all global land vertebrates today.
• Methane at 2x pre-industrial levels, mostly from livestock and tropical swamps from e.g. new dams, but rapidly rising fraction from fracking, and from melting permafrost
• Methane emissions rising rapidly, and need much more research • Mental abilities decline with rising CO2 • Tropical diseases moving north as Earth warms


