24
Current Economic Climate of the Cattle Business Derrell S. Peel Breedlove Professor of Agribusiness and Extension Livestock Marketing Specialist
| Date post: | 20-Dec-2015 |
| Category: |
Documents |
| View: | 216 times |
| Download: | 0 times |
Current Economic Climate of the Cattle Business
Derrell S. PeelBreedlove Professor of Agribusiness and Extension Livestock Marketing Specialist
Oklahoma State University

Current Economic Climate
• Short and Medium Term– Current market situation– Industry and external factors
• Long Term– Industry structural change

Major Market Factors
• Cattle Inventory and Beef Production• Beef Demand• International Trade• Feed and Input Markets• Forage Conditions

BOXED BEEF CUTOUT VALUEChoice 600-900 Lbs. Carcass, Weekly
135
145
155
165
175
185
195
JAN APR JUL OCT
$ Per Cwt.
Avg.2005-09
2010
2011
C-P-6210/31/11Livestock Marketing Information Center
Data Source: USDA-AMS
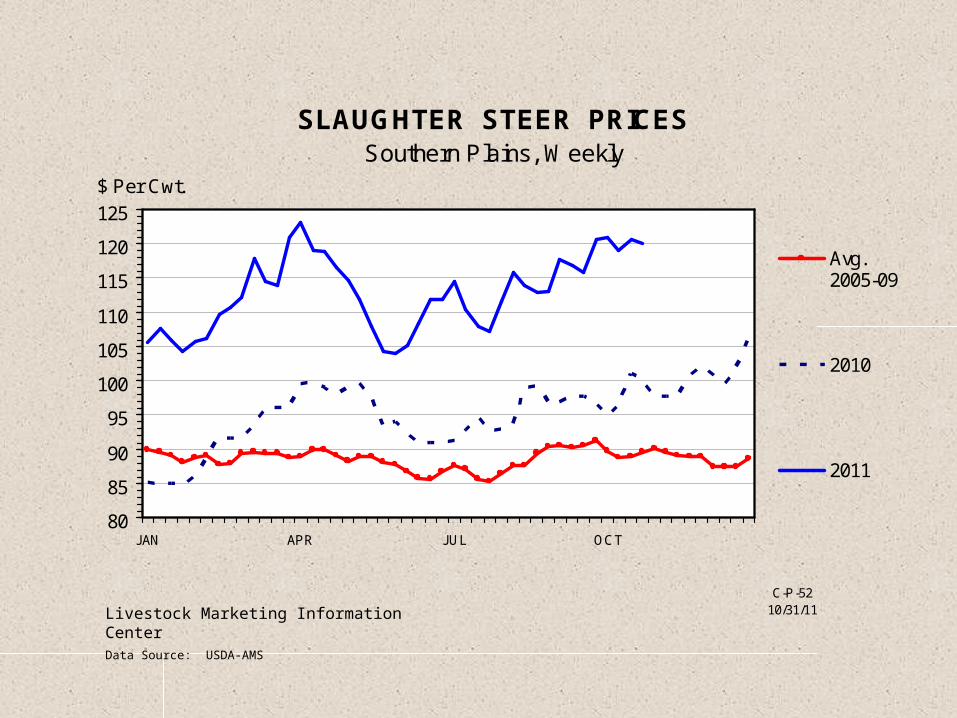
SLAUGHTER STEER PRICESSouthern Plains, Weekly
80
85
90
95
100
105
110
115
120
125
JAN APR JUL OCT
$ Per Cwt.
Avg.2005-09
2010
2011
C-P-5210/31/11Livestock Marketing Information Center
Data Source: USDA-AMS
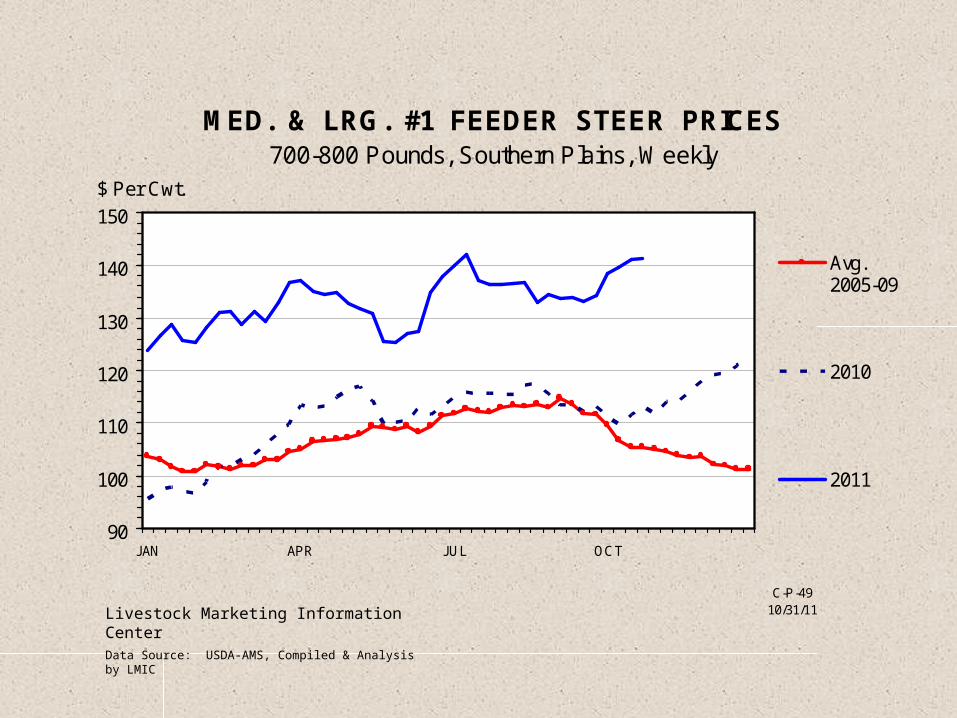
MED. & LRG. #1 FEEDER STEER PRICES700-800 Pounds, Southern Plains, Weekly
90
100
110
120
130
140
150
JAN APR JUL OCT
$ Per Cwt.
Avg.2005-09
2010
2011
C-P-4910/31/11Livestock Marketing Information Center
Data Source: USDA-AMS, Compiled & Analysis by LMIC

MED. & LRG. #1 STEER CALF PRICES400-500 Pounds, Southern Plains, Weekly
115
125
135
145
155
165
175
JAN APR JUL OCT
$ Per Cwt.
Avg.2005-09
2010
2011
C-P-49A10/31/11Livestock Marketing Information Center
Data Source: USDA-AMS, Compiled & Analysis by LMIC

SLAUGHTER COW PRICESSouthern Plains, 85-90% Lean, Weekly
40
45
50
55
60
65
70
75
80
85
JAN APR JUL OCT
$ Per Cwt.
Avg.2005-09
2010
2011
C-P-3510/31/11Livestock Marketing Information Center
Data Source: USDA-AMS

Oklahoma Cattle Inventory, January 12012 Forecast
2011 2012 %
Head Head Change Change
Beef Cows 2,036,000 1,780,000 -256,000 -12.6%
Beef Heifers 355,000 239,000 -116,000 -32.7%
Feeder Supply 2,120,000 1,102,000 -1,018,000 -48.0%All Cattle and Calves 5,100,000 3,723,000 -1,377,000 -27.0%

Oklahoma and U.S. Cattle Cycles: Beef Cow Inventory, January 1
1500
1700
1900
2100
2300
2500
2700
2900
1970 1973 1976 1979 1982 1985 1988 1991 1994 1997 2000 2003 2006 2009 2012
29000
31000
33000
35000
37000
39000
41000
43000
45000
47000
OKLA US

Oklahoma All Cattle and Calves
1000
2000
3000
4000
5000
6000
7000
1920
1930
1940
1950
1960
1970
1980
1990
2000
2010
1000
Hea
d

Oklahoma Cattle Inventory by Agricultural Statistics District, January 1, 2012 Forecast
All Cattle and Calves Beef Cows % %
2011 2012 Change 2011 2012 ChangePANHANDLE 629,000 452,000 -28.1% 88,500 69,000 -22.0%WEST CENTRAL 443,500 248,500 -44.0% 167,000 129,000 -22.8%SOUTHWEST 495,000 251,000 -49.3% 180,000 137,500 -23.6%NORTH CENTRAL 572,000 305,000 -46.7% 177,000 143,500 -18.9%CENTRAL 758,400 526,000 -30.6% 324,000 273,000 -15.7%SOUTH CENTRAL 675,700 447,000 -33.8% 319,000 276,500 -13.3%NORTHEAST 750,900 755,500 0.6% 353,500 345,000 -2.4%EAST CENTRAL 499,500 498,500 -0.2% 280,000 266,000 -5.0%SOUTHEAST 276,000 239,500 -13.2% 147,000 140,500 -4.4%Total 5,100,000 3,723,000 -27.0% 2,036,000 1,780,000 -12.6%

Estimated Change in Grazing Animal Density, Head/Sq. mile, Jan. 1,2011 to 2012
State Ave. 130 => 91
Panhandle 70 => 29
W. Cent. 112 => 58
S. W. 143 => 71
N. Cent. 136 => 70
Central 147 => 100
N. East. 150 => 150
E. Cent. 155 => 155
S. East. 155 => 135
S. Cent. 127 => 84
OKLAHOMA

NATIONAL AVERAGE CORN PRICECrop Year, Received by Farmers
1.00
2.00
3.00
4.00
5.00
6.00
7.00
1987 1989 1991 1993 1995 1997 1999 2001 2003 2005 2007 2009 2011
$ Per Bushel
G-NP-0310/12/11Livestock Marketing Information Center
Data Source: USDA-NASS, Compiled & Forecasts by LMIC

Feedlot Cost of GainKansas, $/cwt.
Jan-
90
Jan-
92
Jan-
94
Jan-
96
Jan-
98
Jan-
00
Jan-
02
Jan-
04
Jan-
06
Jan-
08
Jan-
10
40.00
50.00
60.00
70.00
80.00
90.00
100.00
110.00
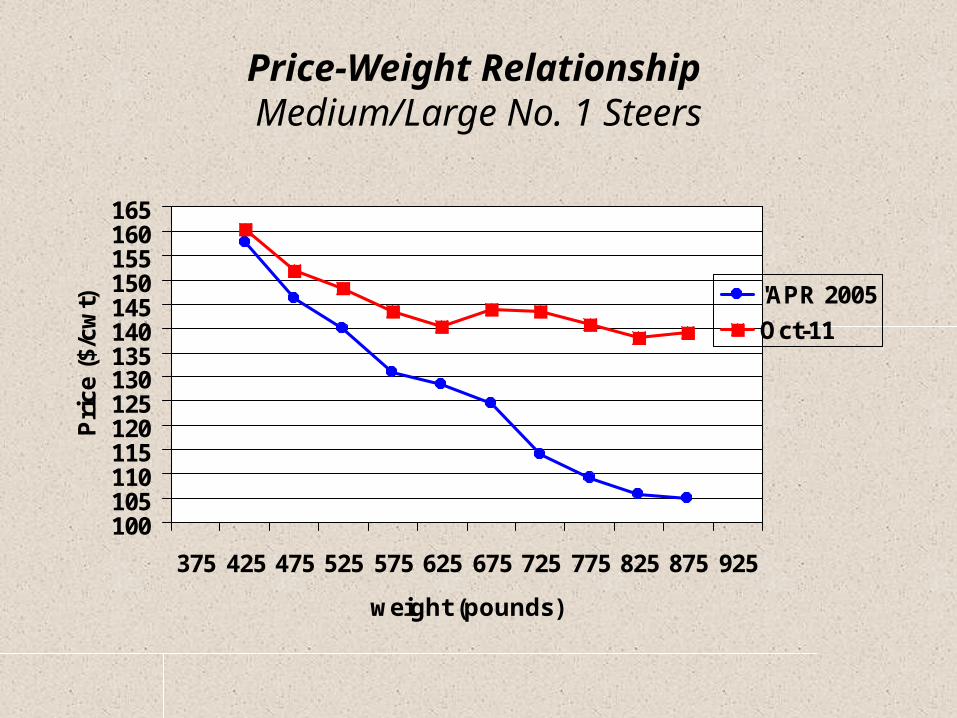
Price-Weight Relationship Medium/Large No. 1 Steers
100105110115120125130135140145150155160165
375 425 475 525 575 625 675 725 775 825 875 925
weight (pounds)
Pri
ce (
$/cw
t) 'APR 2005
Oct-11
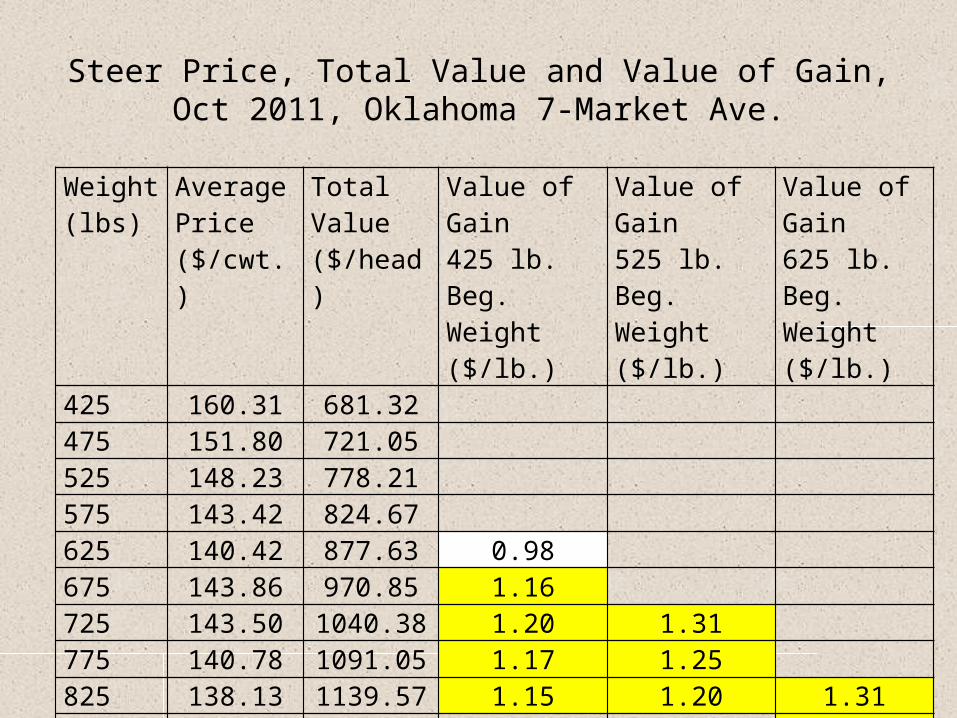
Steer Price, Total Value and Value of Gain, Oct 2011, Oklahoma 7-Market Ave.
Weight (lbs)
Average Price ($/cwt.)
Total Value ($/head)
Value of Gain425 lb. Beg. Weight($/lb.)
Value of Gain525 lb. Beg. Weight($/lb.)
Value of Gain625 lb. Beg. Weight($/lb.)
425 160.31 681.32475 151.80 721.05525 148.23 778.21575 143.42 824.67625 140.42 877.63 0.98675 143.86 970.85 1.16725 143.50 1040.38 1.20 1.31775 140.78 1091.05 1.17 1.25825 138.13 1139.57 1.15 1.20 1.31875 139.03 1216.51 1.36925 134.65 1245.51 1.23

Cattle Markets are Providing Twin Signals to Producers
• Increase Calf Production– Herd Expansion
• More Stocker Production– Keep feeder cattle on forage longer
• Both Signals Imply Increased Demand for Forage
• Different From History When Cow-Calf and Stocker Production was a Tradeoff

Total Meat Supplies Down in 2012
2011 2012• Beef ↓0.25% ↓3.5%• Pork ↑1.5% ↑0.5%• Broilers ↑0.8% ↓2.5%• Total Meat ↑0.8% ↓1.9%
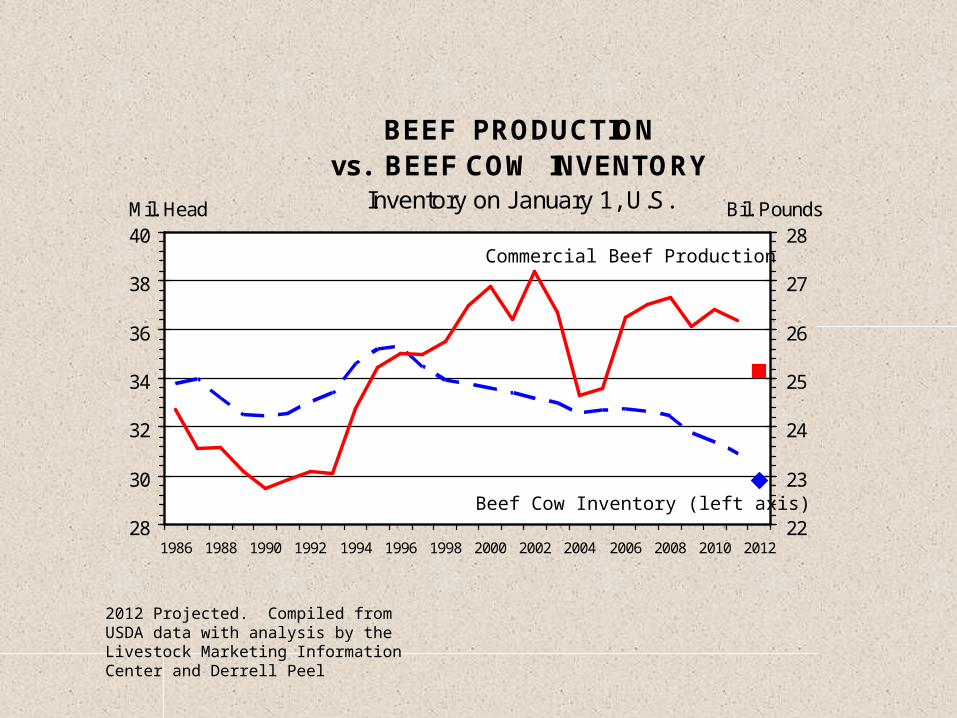
BEEF PRODUCTION vs. BEEF COW INVENTORY
Inventory on January 1, U.S.
28
30
32
34
36
38
40
1986 1988 1990 1992 1994 1996 1998 2000 2002 2004 2006 2008 2010 2012
Mil. Head
22
23
24
25
26
27
28Bil. Pounds
Commercial Beef Production
Beef Cow Inventory (left axis)
2012 Projected. Compiled from USDA data with analysis by the Livestock Marketing Information Center and Derrell Peel
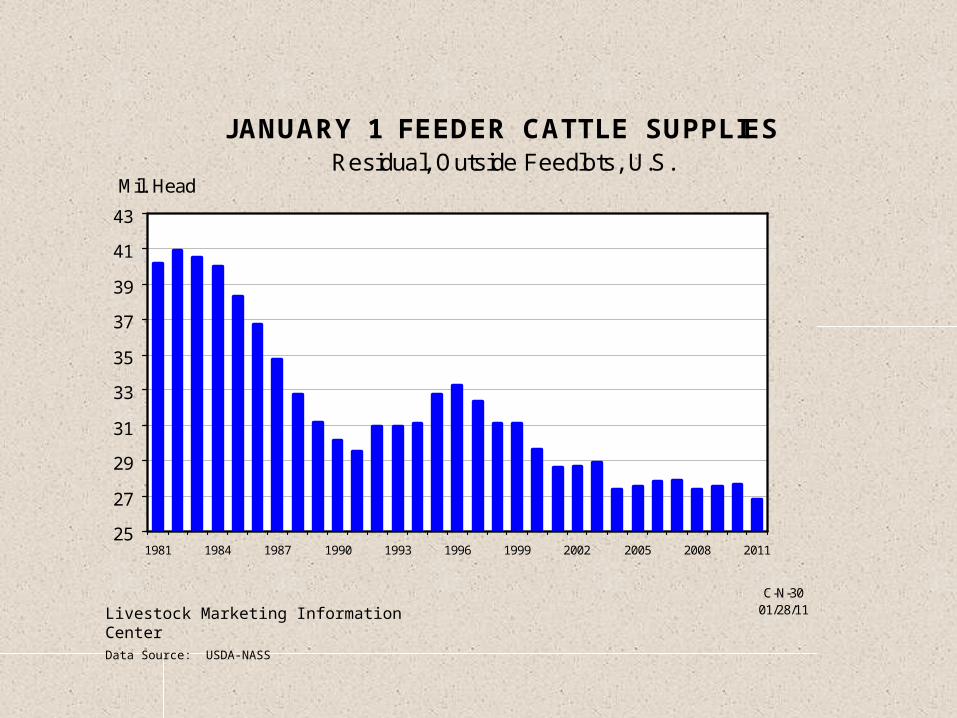
JANUARY 1 FEEDER CATTLE SUPPLIESResidual, Outside Feedlots, U.S.
25
27
29
31
33
35
37
39
41
43
1981 1984 1987 1990 1993 1996 1999 2002 2005 2008 2011
Mil. Head
C-N-3001/28/11Livestock Marketing Information Center
Data Source: USDA-NASS

ANNUAL AVERAGE CATTLE PRICESSouthern Plains
55
75
95
115
135
155
1983 1985 1987 1989 1991 1993 1995 1997 1999 2001 2003 2005 2007 2009 2011 2013
$ Per Cwt
500-600lbSteerCalves
700-800lbFeederSteers
FedSteers
C-P-0610/05/11Livestock Marketing Information Center
Data Source: USDA-AMS, Compiled & Analysis by LMIC

The Weekly Email NewsletterFrom OSU Animal Science and Agricultural Economics
Send Email to [email protected]
THANK YOU!


