Current Events In the Dynamic World of Healthcare Valuations 2008 AICPA/ASA Business Valuation Conference November 10-12, 2008 Las Vegas, NV Sessions #18 & #23 Presenters: Mark O. Dietrich, CPA/ABV Don Barbo, CPA/ABV (508) 877-1999 Hill Schwartz Spilker Keller, LLC [email protected](214) 741-5360 [email protected]
Transcript
Current Events In the Dynamic World of Healthcare Valuations
2008 AICPA/ASA Business Valuation ConferenceNovember 10-12, 2008 Las Vegas, NV
Sessions #18 & #23
Presenters:Mark O. Dietrich, CPA/ABV Don Barbo, CPA/ABV(508) 877-1999 Hill Schwartz Spilker Keller, LLC [email protected] (214) 741-5360
Presentation OverviewI. MedPAC’s Crystal Ball: What’s on the horizon for
Physicians, Imaging, ASCs and Hospitals?II. Understanding differences in Geographic Market
PricingIII. Hospital-Physician Transactions and Joint
Ventures: What’s in/outIV. Standing Firm: When the Deal Heats Up or Blows
Up, Real World “Hypothetical Examples”V. Ask the Experts
2
I. MedPAC’s Crystal Ball: What’s on the horizon for Physicians, Imaging, ASCs and Hospitals?
4
MEDPAC: Why do we Care?
MedPAC or the Medicare Payment Advisory Commission is an independent body formed to advise Congress about the Medicare Program and its benefits, payment mechanisms and annual changes in how much should be paid providers for the various covered services.
5
DRAMATIC SHORTAGES IN MEDICARE PAYMENT LEVELS
MEI and MPFS
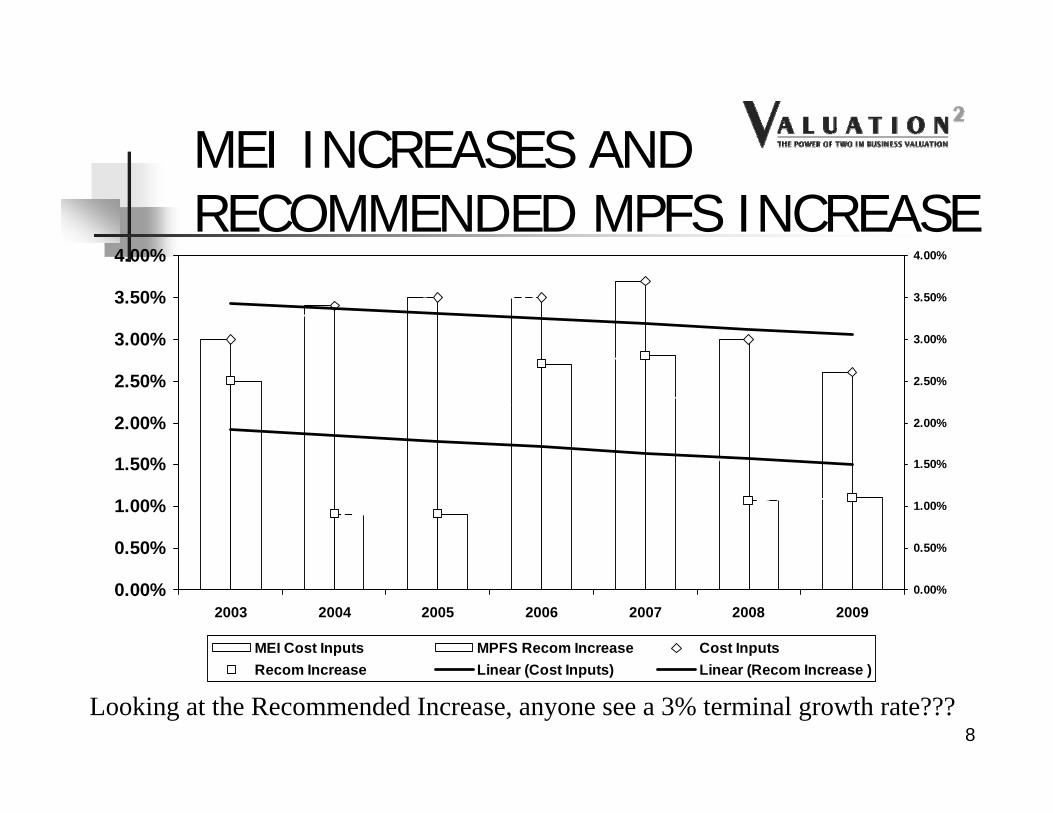
The Chart on the next slide compares the Medicare Economic Index – a measure of the annual cost increases for physicians similar to the market basket for hospitals – to the increases in the Medicare Physician Fee Schedule (MPFS) recommended by MedPAC. Recommended increases are consistently below cost increases.
7
MEI INCREASES AND RECOMMENDED MPFS INCREASE
0.00%
0.50%
1.00%
1.50%
2.00%
2.50%
3.00%
3.50%
4.00%
2003 2004 2005 2006 2007 2008 20090.00%
0.50%
1.00%
1.50%
2.00%
2.50%
3.00%
3.50%
4.00%
MEI Cost Inputs MPFS Recom Increase Cost InputsRecom Increase Linear (Cost Inputs) Linear (Recom Increase )
Looking at the Recommended Increase, anyone see a 3% terminal growth rate???8
MPFS Increases
Actual Increases in the MPFS fee schedule are shown on the next slide and are consistently below the recommended increases –which are already well under inflation!
9
MEDICARE PAYMENTHow It Works - or Doesn’t!
Two Key Items Conversion Factor
multiplied by RVUs equals Fee
RVUs - 3 Components Physician Work Practice Expense Malpractice
In prior years, the Budget Neutrality Adjustment reduced Work RVUs prorata; this year, a legislative change required it to be applied to the Conversion Factor. Thus, the Conversion Factor is lower even though there was a 1.1% increase! RVUs are higher, and thus fees went up as shown on the next slide. Confused?
MEDICARE PAYMENTWhat happened in 2009?
Significance of Facility vs Non-Facility is whether or not certain practice expense RVUs of RBRVS are in Fees
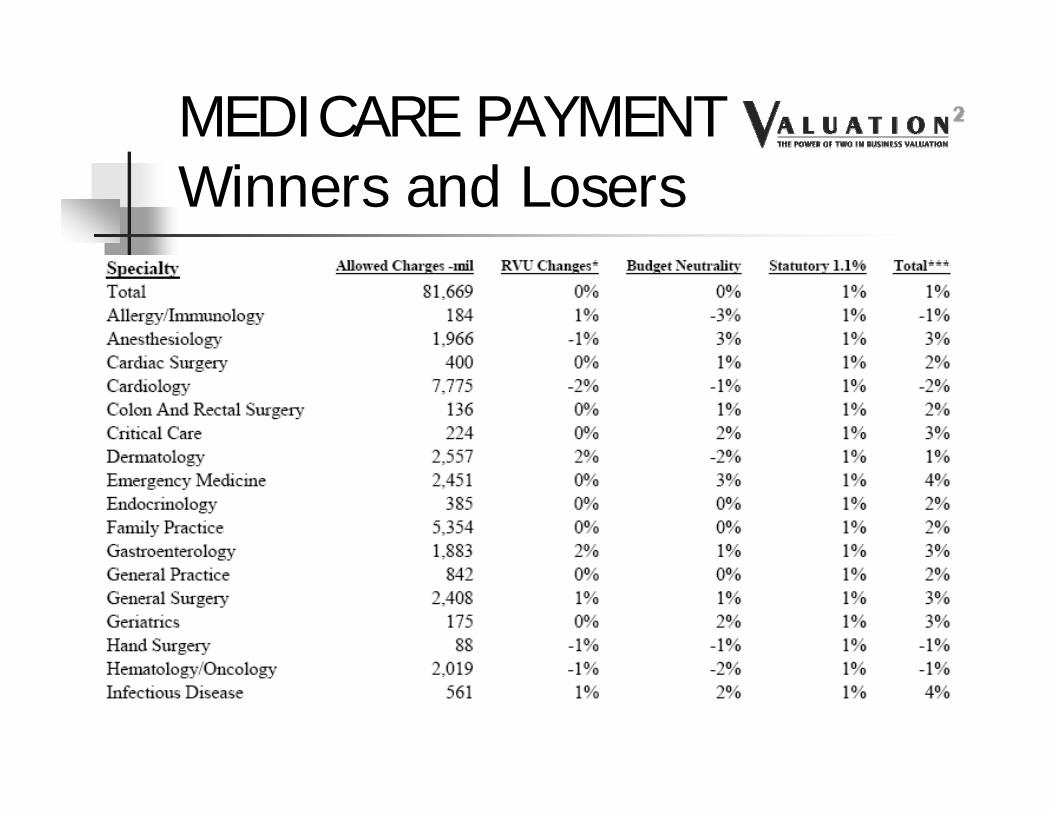
MEDICARE PAYMENTWinners and Losers
MEDICARE PAYMENTWinners and Losers
MEDICARE PAYMENTWinners and Losers
MedPAC Physician Cost Analysis
Anyone see a 3% terminal growth rate here???17
UNDERSTANDINGGROWTH RATES
“With the current estimate of input cost changes in 2009 of 2.6 percent and the Commission’s productivity adjustment of 1.5 percent, the Commission’s [MedPAC] recommended 2009 update would be 1.1 percent.”
Quoted from MedPAC 2008 Report to CongressAnyone see a 3% terminal growth rate here???
18
WHAT DOES THIS MEAN? The Table on the previous slide and the
increase recommendation are what drive reimbursement decisions and therefore potential future cashflow growth rates. Bottom line is that the indicated 2.6% estimated increase in costs leads to a 1.1% increase in fees because of increased utilization; thus, increased utilization is offset by decreased fees because costs are (allegedly) recovered over a higher volume!
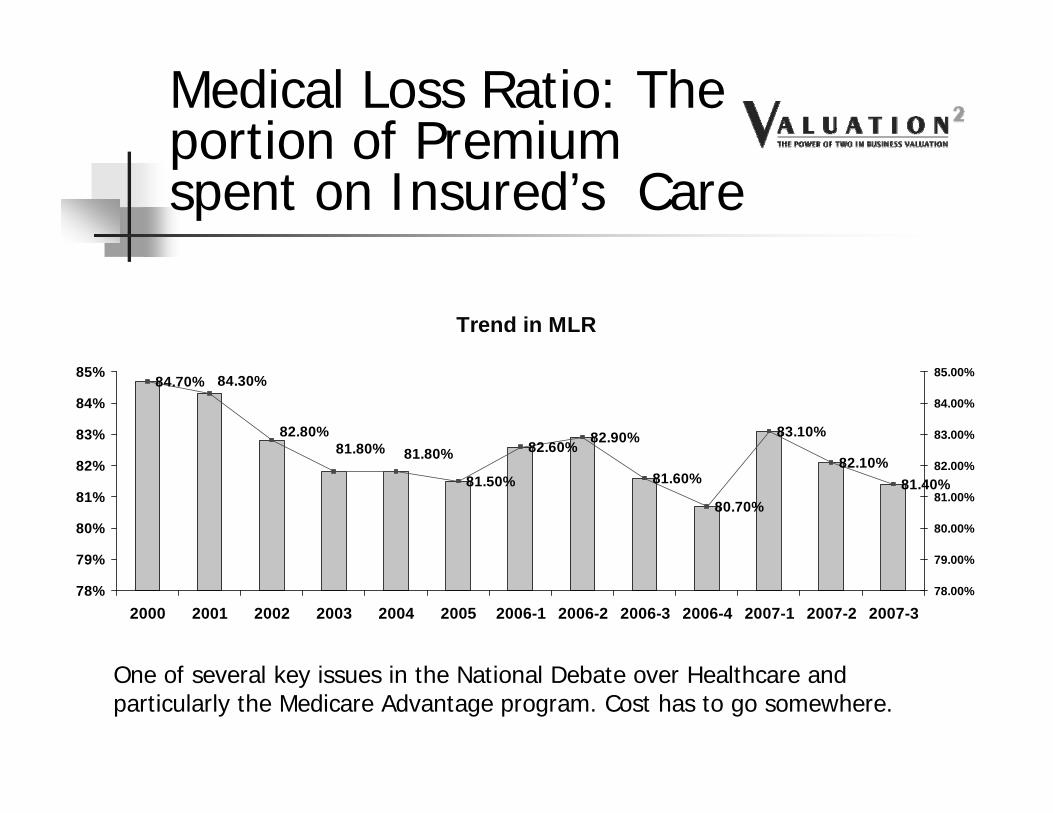
One of several key issues in the National Debate over Healthcare and particularly the Medicare Advantage program. Cost has to go somewhere.
EQUALLY DRAMATIC PHYSICIAN SHORTAGES COMING
25
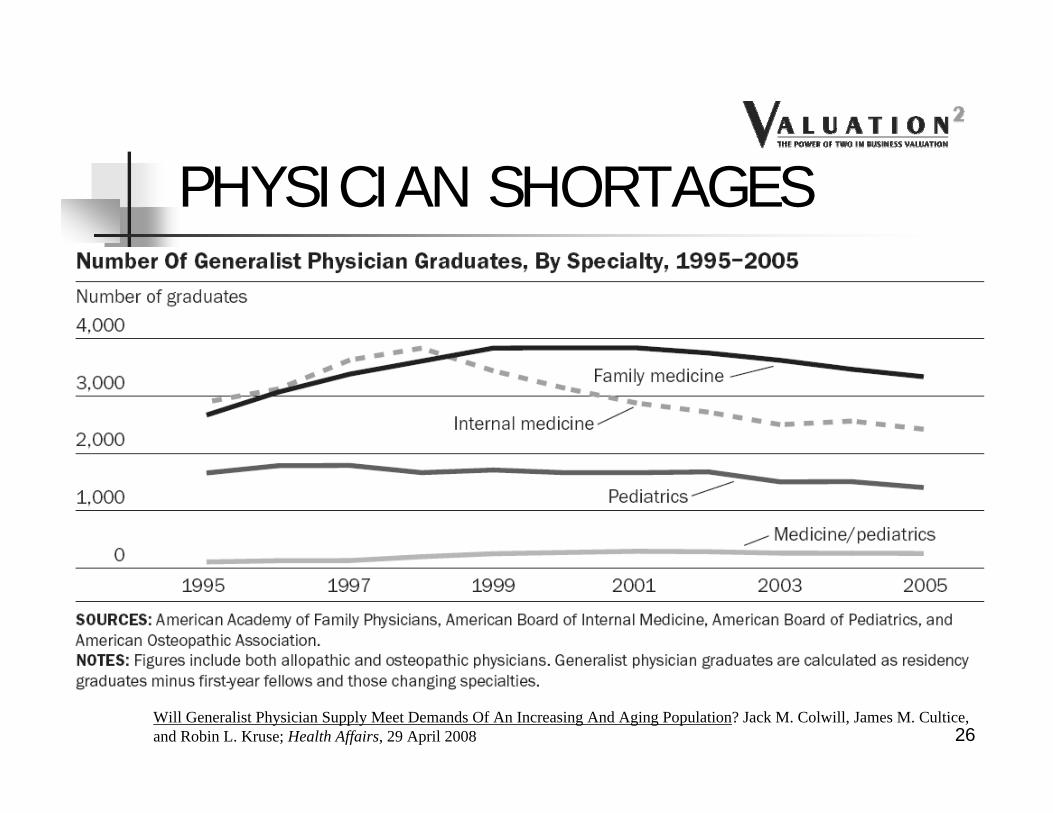
PHYSICIAN SHORTAGES
Will Generalist Physician Supply Meet Demands Of An Increasing And Aging Population? Jack M. Colwill, James M. Cultice, and Robin L. Kruse; Health Affairs, 29 April 2008 26
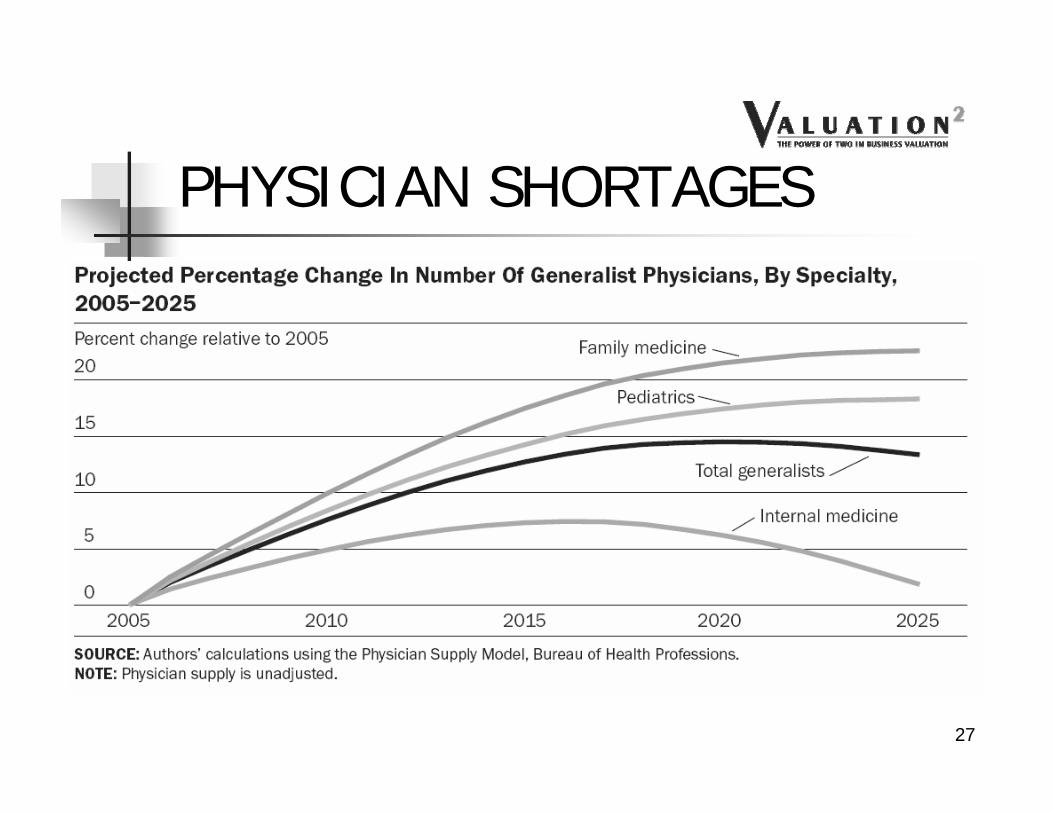
PHYSICIAN SHORTAGES
27
PHYSICIAN SHORTAGES
28
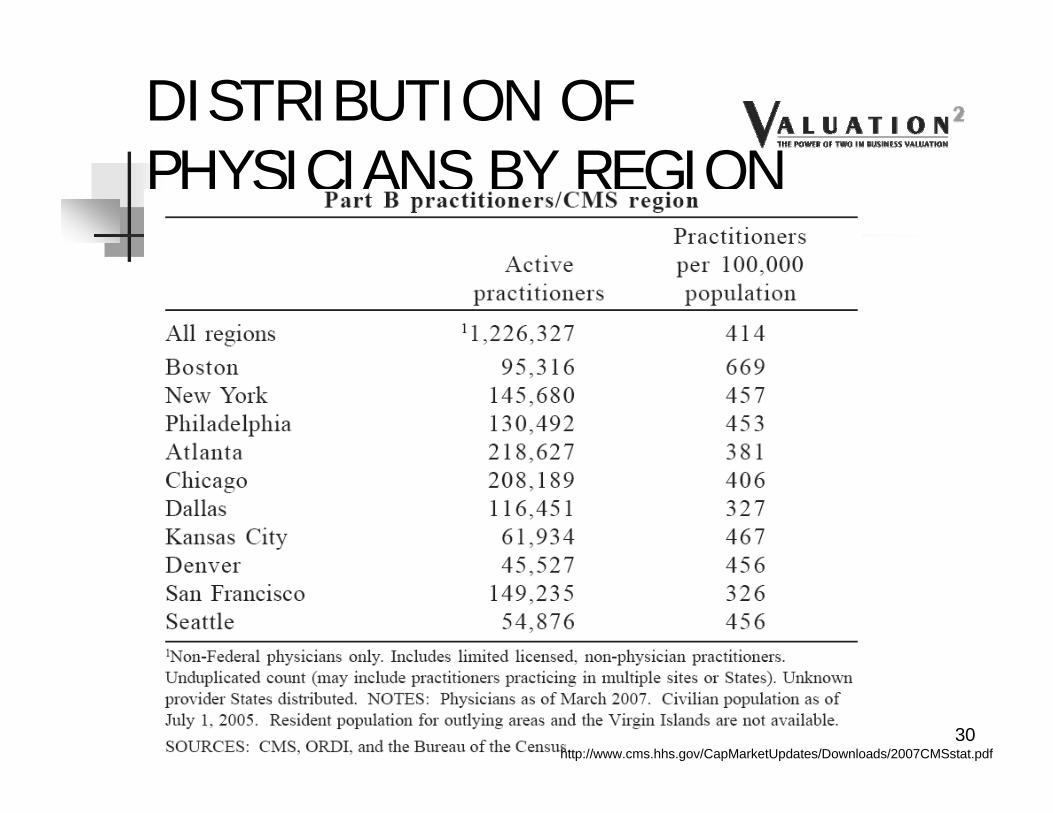
CHANGES IN DISTRIBUTION OF PHYSICIANS BY SPECIALTY
In standard Economic Theory, what happens when there is a shortage of buyers for a product? Price drops to meet available demand!
In business in general, Value is also driven by such factors, as well as ease of entry into the market – a high demand for services and few providers leads to long waits and ease of entry –developing a patient base is easier!
High recruiting salaries and incentives decrease the potential “profit” or added earnings from buying a practice!
31
MERRITT HAWKINS 2008 SURVEY
Hospitals represent an increasing share of the recruitment market
32
MERRITT HAWKINS 2008 SURVEY
Primary care MDs represent an increasing share of the recruitment market
33
MERRITT HAWKINS 2008 SURVEY
Curiously, Cardiologist recruitment at this firm has dropped considerably
34
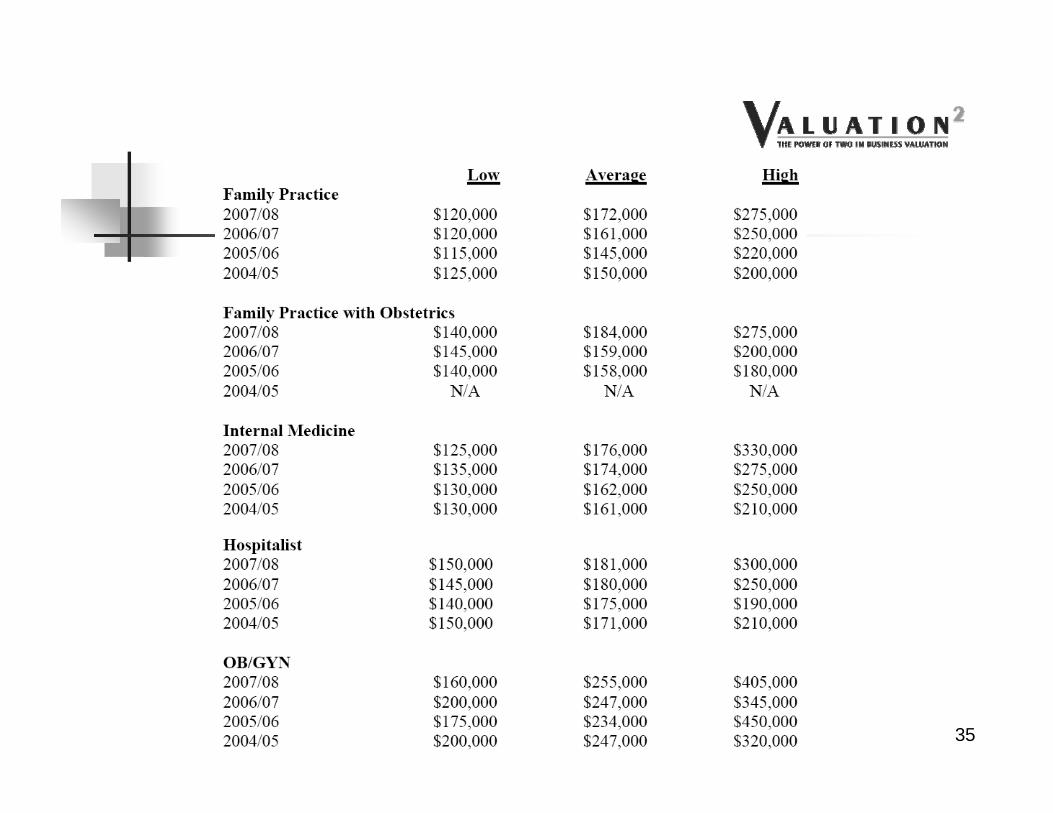
35
OPPORTUNITIES TO ENHANCE INCOME THROUGH ANCILLARIES ARE DECLINING
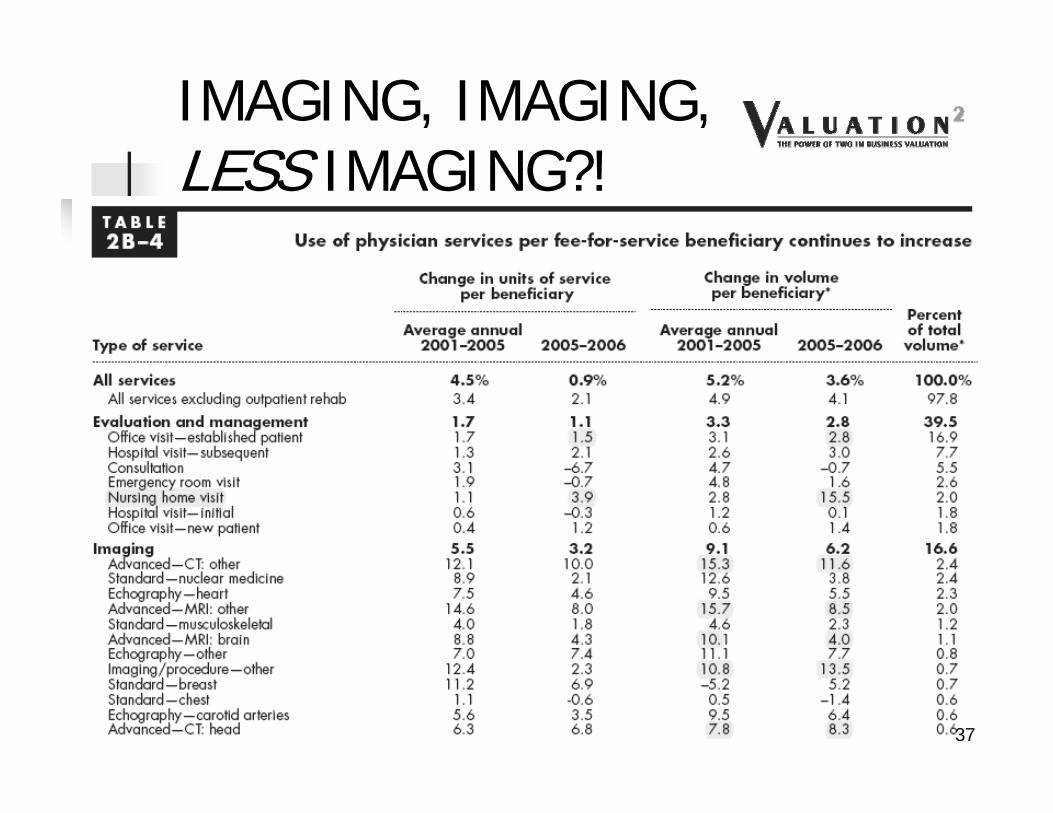
IMAGING, IMAGING, LESS IMAGING?!
37
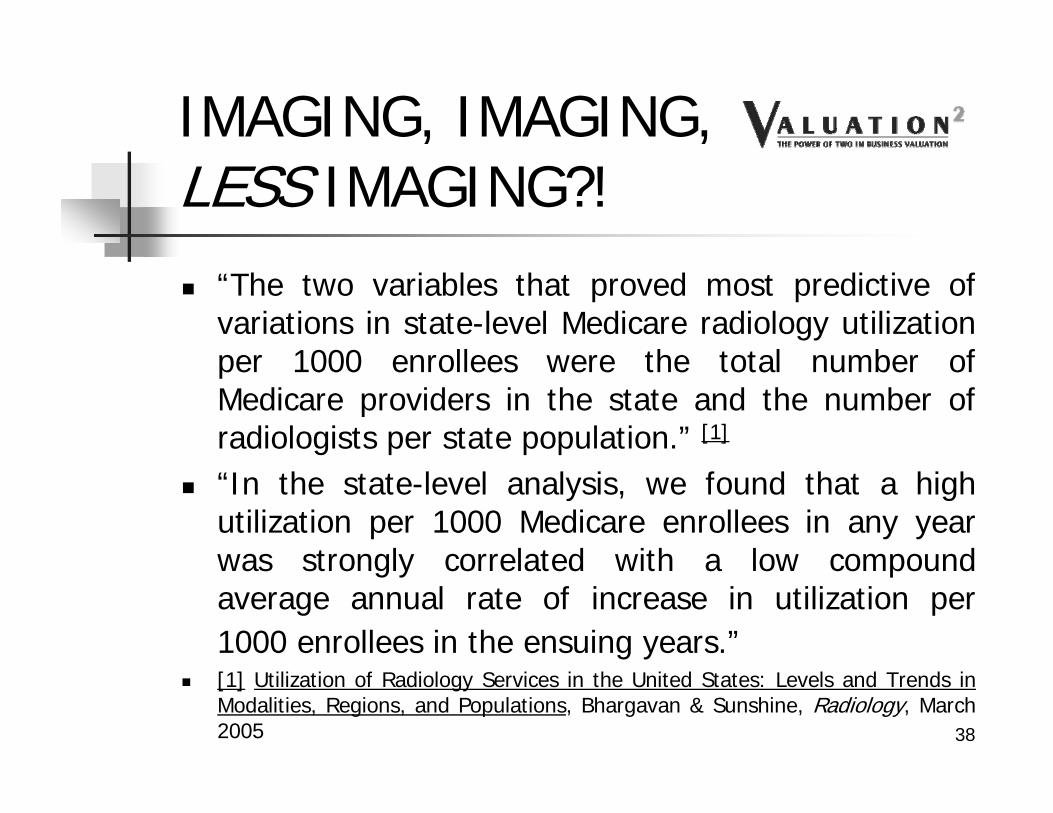
IMAGING, IMAGING, LESS IMAGING?! “The two variables that proved most predictive of
variations in state-level Medicare radiology utilization per 1000 enrollees were the total number of Medicare providers in the state and the number of radiologists per state population.” [1]
“In the state-level analysis, we found that a high utilization per 1000 Medicare enrollees in any year was strongly correlated with a low compound average annual rate of increase in utilization per 1000 enrollees in the ensuing years.”
[1] Utilization of Radiology Services in the United States: Levels and Trends in Modalities, Regions, and Populations, Bhargavan & Sunshine, Radiology, March 2005 38
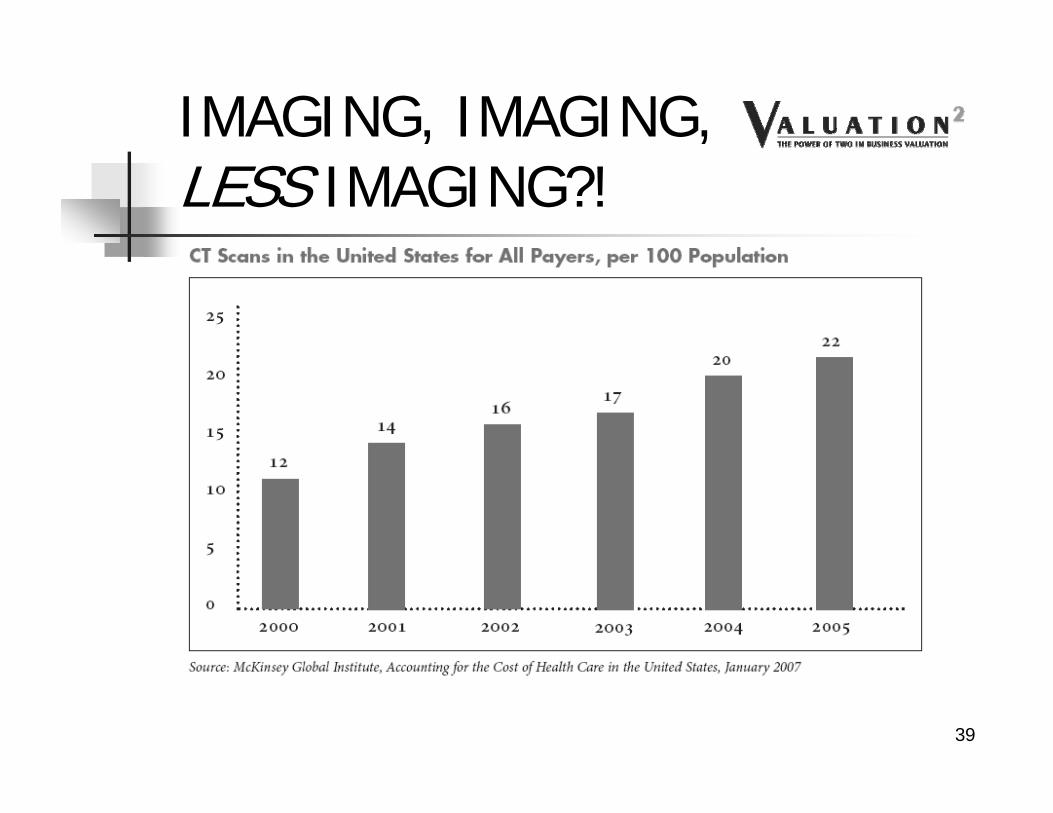
IMAGING, IMAGING, LESS IMAGING?!
39
Nonradiologist Usage Driving Growth Rates Due To Incentives From Self-referrals
From Recent Trends in Utilization of the MajorImaging Modalities, David Levin, MD
RBMA 2007 Summit, St Louis
IMAGING, IMAGING, LESS IMAGING?! “Utilization of CT in the Medicare population grew from
slightly more than 300/1000 beneficiaries in 2000 to about 473/1000, a 49% growth rate, in 2004
Radiologist utilization of CT in the Medicare population grew 53% between 2000 and 2004 (from under 300/1000 to about 450/1000
Nonradiologist utilization of CT in the Medicare population grew 92% between 2000 and 2004 (from a little more than 6/1000 to just under 12/1000)
Independent diagnostic testing facility (IDTF) share of the Medicare CT market grew 338% between 2000 and 2004 (from less than 2/1000 to less than 8/1000)
41
IMAGING, IMAGING, LESS IMAGING?! Radiologist utilization of MRI examinations in the
Medicare population grew by 68% between 2000 and 2004 (from about 80/1000 to just under 140/1000)
Nonradiologist utilization of MRI examinations in the Medicare population grew 119% between 2000 and 2004 (from less than 4/1000 to nearly 8/1000)
IDTF share of the Medicare MRI market grew 175% from 2000 to 2004 (from about 5/1000 to just less than 14/1000
42
IMAGING, IMAGING, LESS IMAGING?!
Growth Rates in In-Office MRI Radiologists: 80% Orthopedists: 408% Neurologists: 170% PCPs: 250% Internal Medicine sub-specialists (excluding
cardiologists): 2100%
43
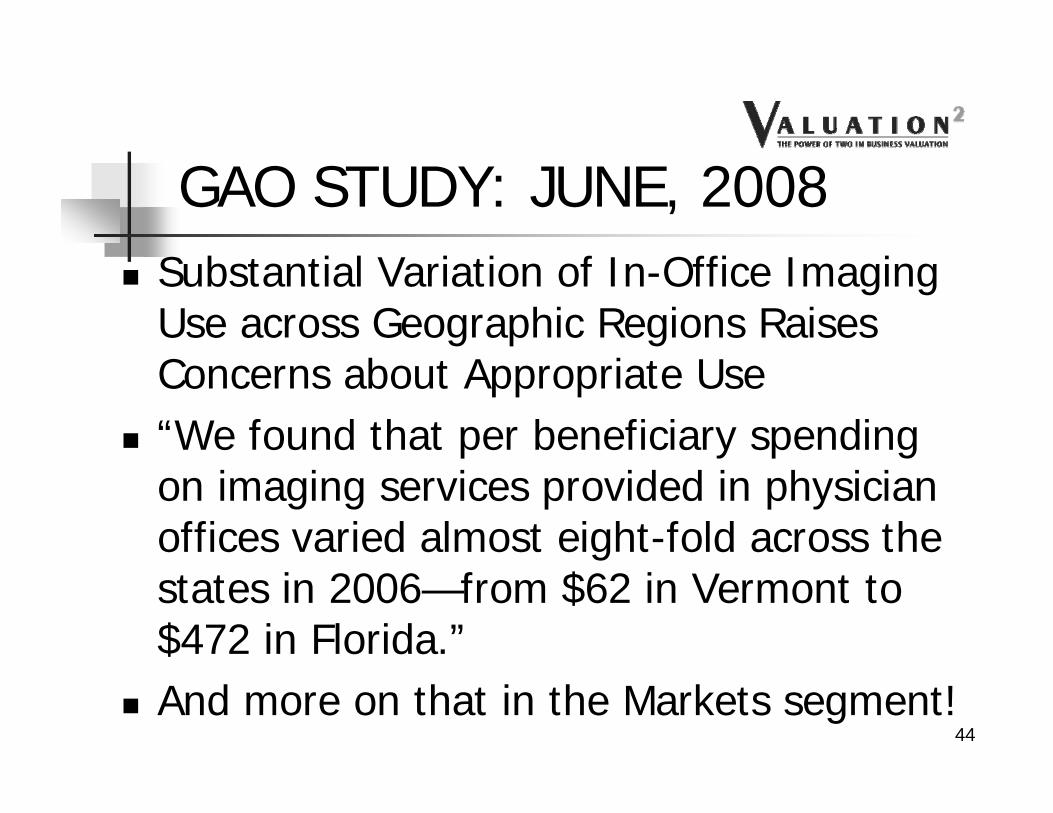
GAO STUDY: JUNE, 2008 Substantial Variation of In-Office Imaging
Use across Geographic Regions Raises Concerns about Appropriate Use
“We found that per beneficiary spending on imaging services provided in physician offices varied almost eight-fold across the states in 2006—from $62 in Vermont to $472 in Florida.”
And more on that in the Markets segment!44
GAO June, 2008
45
More later!
46
Medicare Spending on Imaging Services Paid for under the Physician Fee Schedule by Modality, 2000 through 2006
47
48
AMBULATORY SURGERY CENTERS
For the Surgical Specialties, Something Worth Considering
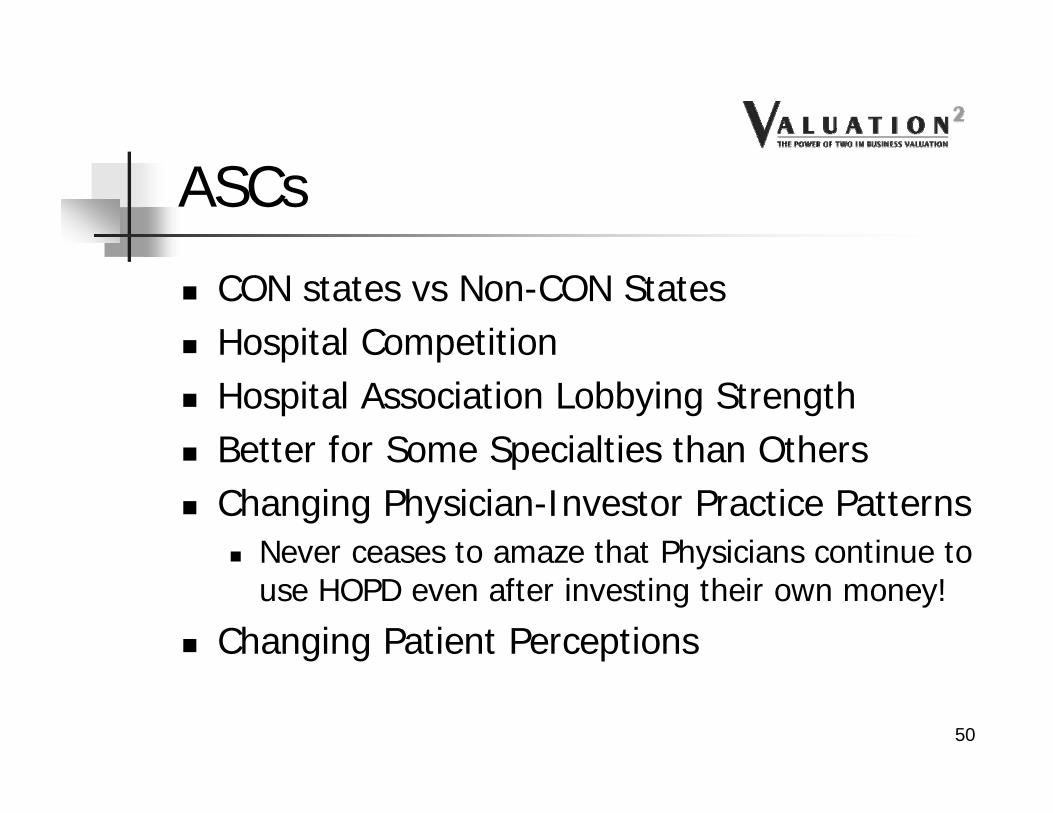
ASCs
CON states vs Non-CON States Hospital Competition Hospital Association Lobbying Strength Better for Some Specialties than Others Changing Physician-Investor Practice Patterns
Never ceases to amaze that Physicians continue to use HOPD even after investing their own money!
Changing Patient Perceptions
50
WINNERS & LOSERS
51
From Todd Sorensen’s ASC Chapter in BVR’s Guide to Healthcare Valuation
Healthcare Industry strategies tend to originate in one area and spread to others: Managed Care & Integrated Delivery Systems started on the West Coast, for example. Sort of an “Old Economy” version of Viral Marketing.
Although Strategies, like Viruses, may be successful at their origin point, they are not always successful everywhere!
In the Business of Healthcare, specific Market Conditions suggest whether a Strategy can be replicated, much the same way that Environmental Conditions affect the ability of a Virus to replicate and spread.
59
The Factors
High Medicare Spending
Presence and market strength of Blue Cross plans
Overall Health Insurer Concentration
Degree of market strength of local Nonprofit HealthInsurers versus For-profit Health Insurers
The degree of market strength of local NonprofitHospitals versus For-profit Hospitals
Certificate of Need laws and
Other local demographic and economic factors60
20 Largest Counties for 2005 Medicare Spending ($Billions)
5,388
4,503
2,237
2,186
2,121
2,018
1,741
1,644
1,638
1,638
1,529
1,472
1,389
1,360
1,285
1,231
1,206
1,189
1,120
1,076
$0
$1,000
$2,000
$3,000
$4,000
$5,000
$6,000
Los Angele
s, CA
Cook, ILDad
e, FL
Kings, NY
Wayne,
MIHarr
is, TX
Queens,
NYMari
copa,
AZ
Palm B
each, F
LNas
sau, N
YNew
YorkOran
ge, CA
Dallas
, TX
Suffolk,
MA
Cuyahoga, O
H
San D
iego, C
ABro
ward, F
LOak
land, C
A
Middlesex, M
APinella
s, FL
High Medicare Spending
61California, Florida, New York, Texas, Massachusetts
# of Top 200 Counties for Part A & B Total Spending
Florida, 25
California, 19
Texas, 14
Other, 142
62
Market Strength Of Blue Cross Plans & Overall
Health Insurer Concentration
Market Concentration is defined here as the total market share of the Blue Plans, Public
Health Insurers and large local health insurers
And a Tip of the Hat to JD Epstein!
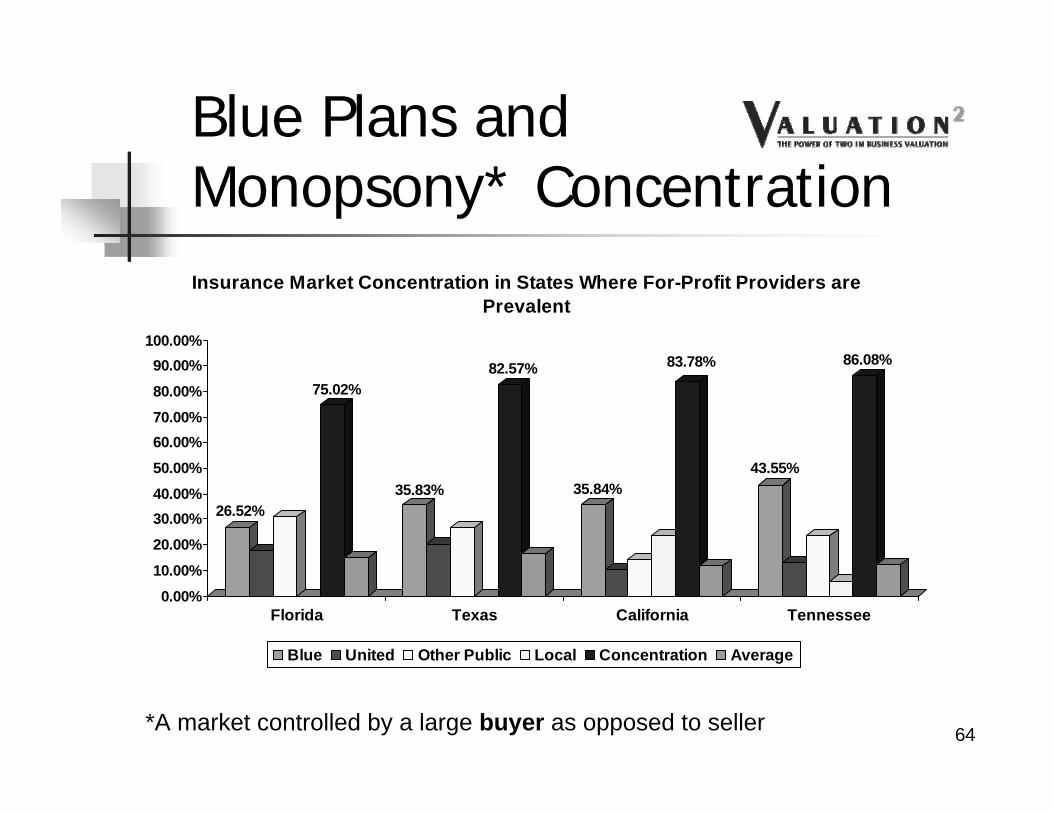
Blue Plans and Monopsony* Concentration
26.52%
75.02%
35.83%
82.57%
35.84%
83.78%
43.55%
86.08%
0.00%10.00%
20.00%30.00%40.00%50.00%60.00%70.00%80.00%
90.00%100.00%
Florida Texas California Tennessee
Insurance Market Concentration in States Where For-Profit Providers are Prevalent
Blue United Other Public Local Concentration Average
*A market controlled by a large buyer as opposed to seller 64
Insurance Market Concentration States Where For-Profit Providers are not Prevalent
Blue United Other Public Local Concentration Average
65
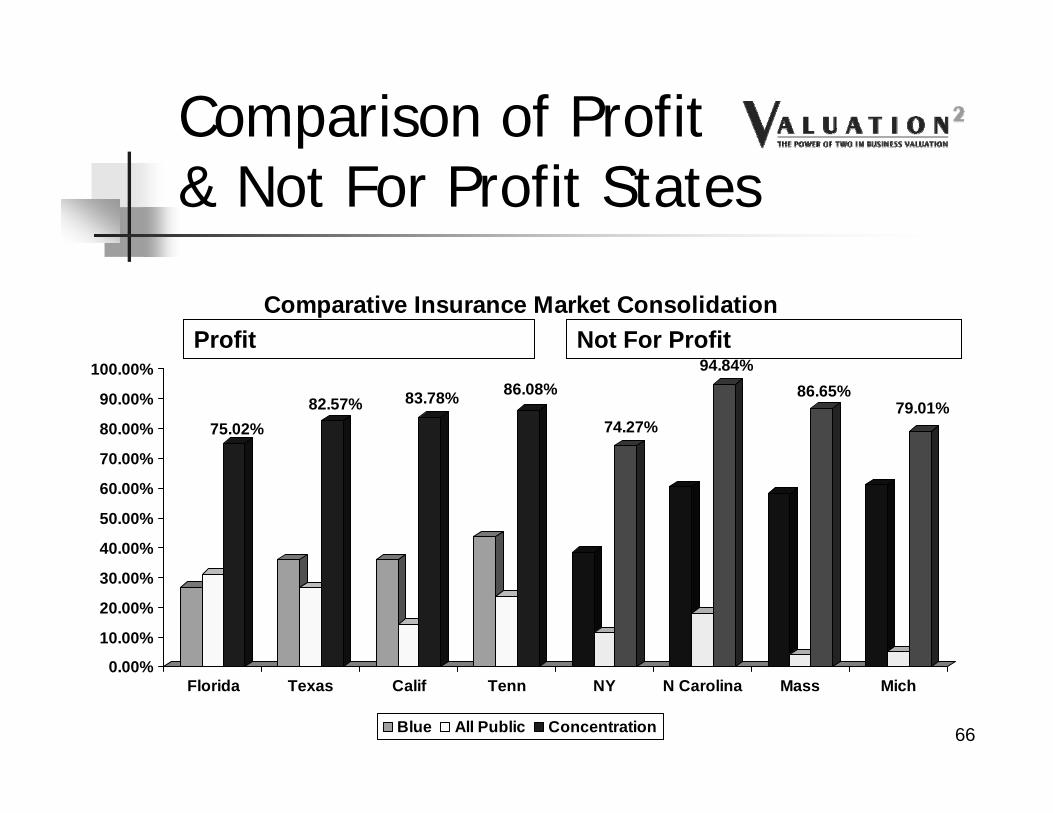
Not For Profit
Comparison of Profit& Not For Profit States
75.02%82.57% 83.78% 86.08%
74.27%
94.84%86.65%
79.01%
0.00%
10.00%
20.00%
30.00%
40.00%
50.00%
60.00%
70.00%
80.00%
90.00%
100.00%
Florida Texas Calif Tenn NY N Carolina Mass Mich
Comparative Insurance Market Consolidation
Blue All Public Concentration
Profit
66
For Profit Hospital States
Florida Texas California Tennessee Others primarily south of the Mason-
Dixon Line Exceptions, of course!
67
Representative For Profit Hospital Chains
0
5,000
10,000
15,000
20,000
25,000
Florida Texas California Mississippi Other
Number of Beds by State
HCA Tenet Vanguard HMA 68
NonProfit Hospital States
New York North Carolina Massachusetts Michigan Illinois North Dakota, Iowa Exceptions, of course, but less than you
would expect!69
“Wealthy” Teaching Hospitals Harvard-Affiliated Partners Health System in Boston Baylor Health Care System in Dallas Yale-New Haven Hospital New York City: Mt. Sinai Hospital, Beth Israel Medical
Center and NYU Medical Center The University of Chicago Health System and
Northwestern Memorial Hospital and Health System Johns Hopkins Hospital and Health System in
Baltimore
70
Query
When Will a For Profit Hospital Locate in Boston?
When Pigs Fly!
71
Hospital Market Data As Reed Tinsley and I asked in a co-authored article
in the December 2006 American Bar Association’s The Heath Lawyer: “What does [out of market] transaction data say or reveal
about the value of a hospital with EBITDA of $1.0 million located in North Carolina? Does it tell a valuator that it couldbe worth the median [multiple] value of $5 million or the [average multiple] value of $7.5 million – the average being 50% greater than the median? Could it be worth [the highest multiple value of] $18.2 million? Given the Stark regulations requirement that comparable transactions be in a particular market at the time of acquisition, can any of these [out of market] multiples be used?”
72
Certificates of Need
State-issued facility license Highly politicized Florida, Texas, Pennsylvania and
California do not require a CON for an ASC! (Recognize those Bold States?)
Many of ASC-Consolidator AmSurg’sfacilities are located in these states!
73
AMSG ORs by StateFlorida
19%
Tennessee9%
California7%
Maryland6%
Ohio6%Arizona
5%
Texas5%
New Jersey4%
Pennsylvania4%
Kansas3%
Other (23 states)32%
74
# of Top 200 Counties for Part B Per Capita SpendingF lo rida, 9
T ennessee, 8
C alifo rnia, 9
M aryland, 7
Ohio , 3
A rizo na, 0
T exas, 37
N ew Jersey, 13
P ennsylvania, 9
Kansas, 6
Other, 99
75
Other Factors
Bold Red items are consistent with AMSG locations 76
Explanations of Factors For-Profit Beds %: The percentage of all hospitals beds owned
by for-profit hospitals MD Spending %: The portion of the state’s healthcare spending
that goes to physician services Rankings For Profit Beds: The rank based on total for-profit beds, with 1
being highest Total Healthcare Spending: The rank based upon total dollars
spent Metropolitan Population: The rank based upon the percentage
of the states population located in Metropolitan areas (as opposed to rural)
MD Spending: The rank based upon total dollars spent Per Capita: The rank based upon per capita income
77
Other Factor Impact on AMSG
FL, 46.30%
TN, 33.80%
CA, 23.50%
MD, 4.00% OH, 5.90%
AZ, 32.80% TX, 33.50%
NJ, 5.00%
PA, 12.60%
KS, 9.20%
United States, 17.60%
0.00%
5.00%
10.00%
15.00%
20.00%
25.00%
30.00%
35.00%
40.00%
45.00%
50.00%
Prevalence of For Profit Hospitals For AMSG's Major States
78
Strategy and Value Implications
Does the Enterprise operate in a market with factors analogous to those where acquirers or for-profits are active?
If there are no or few for-profit providers in a valuation subject’s service area, are those transactions or Guideline Public multiples relevant?
Can acquirer multiples be adjusted to exclude acquisition growth inherent in public company strategies and values?
If, in fact, relevant, would value determined be accretive to earnings to a public acquirer
79
Conclusion
Don’t forget the Stark Regulations limitations on use of out-of-market transactions!
80
Take Away
“For having lived long, I have experienced many instances of being obliged, by better information or fuller consideration, to change opinions, even on important subjects, which I once thought right but found to be otherwise.”
Benjamin Franklin81
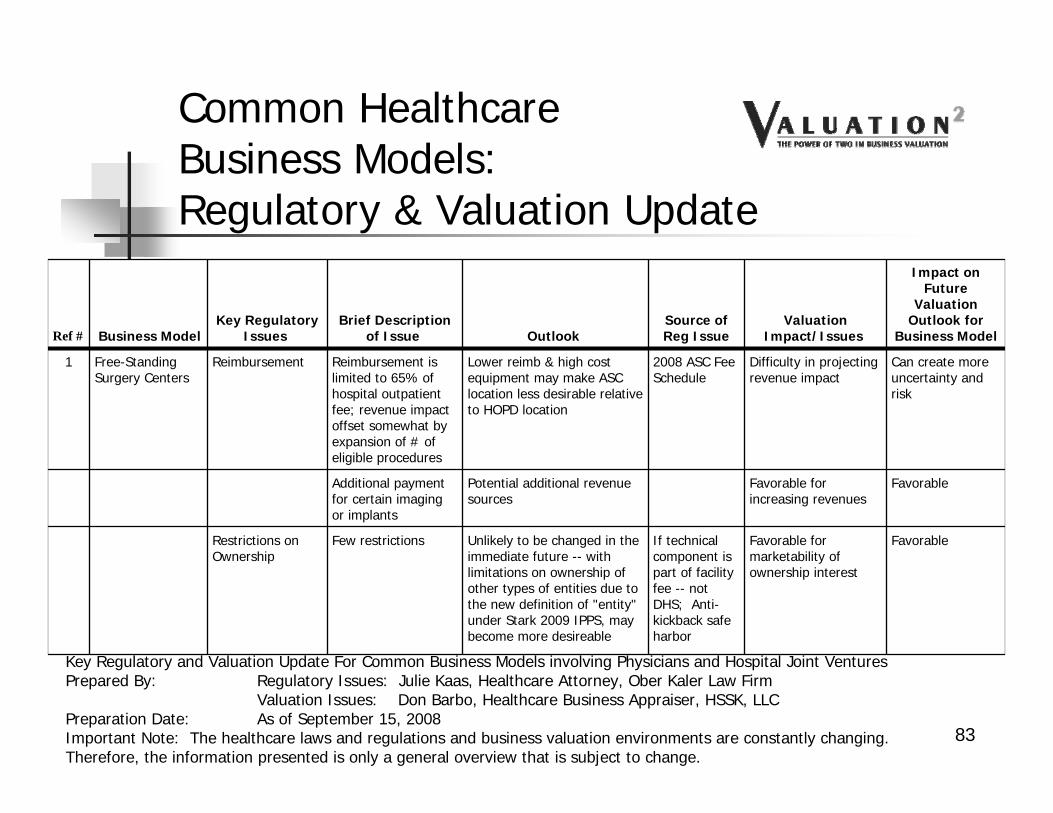
III. Hospital-Physician Transactions and Joint Ventures: What’s in/out
82
Ref # Business ModelKey Regulatory
IssuesBrief Description
of Issue OutlookSource of Reg Issue
Valuation Impact/Issues
Impact on Future
Valuation Outlook for
Business Model
1 Free-Standing Surgery Centers
Reimbursement Reimbursement is limited to 65% of hospital outpatient fee; revenue impact offset somewhat by expansion of # of eligible procedures
Lower reimb & high cost equipment may make ASC location less desirable relative to HOPD location
2008 ASC Fee Schedule
Difficulty in projecting revenue impact
Can create more uncertainty and risk
Additional payment for certain imaging or implants
Potential additional revenue sources
Favorable for increasing revenues
Favorable
Restrictions on Ownership
Few restrictions Unlikely to be changed in the immediate future -- with limitations on ownership of other types of entities due to the new definition of "entity" under Stark 2009 IPPS, may become more desireable
If technical component is part of facility fee -- not DHS; Anti-kickback safe harbor
Favorable for marketability of ownership interest
Favorable
83
Common HealthcareBusiness Models:Regulatory & Valuation Update
Key Regulatory and Valuation Update For Common Business Models involving Physicians and Hospital Joint VenturesPrepared By: Regulatory Issues: Julie Kaas, Healthcare Attorney, Ober Kaler Law Firm
Valuation Issues: Don Barbo, Healthcare Business Appraiser, HSSK, LLCPreparation Date: As of September 15, 2008Important Note: The healthcare laws and regulations and business valuation environments are constantly changing. Therefore, the information presented is only a general overview that is subject to change.
Ref # Business ModelKey Regulatory
IssuesBrief Description
of Issue OutlookSource of Reg Issue
Valuation Impact/Issues
Impact on Future
Valuation Outlook for
Business Model
2 Specialty Hospitals Reimbursement Currently reimbursement equal to acute care hospital reimbursement
May be changed by legislation
Hospital outpatient prospective payment system
Negative if reimbursement rates are decreased
Potentially unfavorable
Restrictions on Ownership Stark -- Meets whole hospital exception
Current regulatory exception; unlikely to change without new legislation
Favorable for marketability of ownership interest
Favorable
Moratoriums, other restrictions
Reporting by hospital of physician ownership to all patients
Potential for effective date in 2009
IPPS Final rule 2008 and revisions in IPPS 2009
Reporting requirement not expected to have impact
Neutral
Other issues Attempts by Congress to limit physician-owned speciality hospitals; Attempts by Congress and agency to reduce payments to specialty hospitals
Several congressional attempts; difficult to predict outcome in election year
Various industry data
Can create uncertainty and added risk
Potentially unfavorable
84
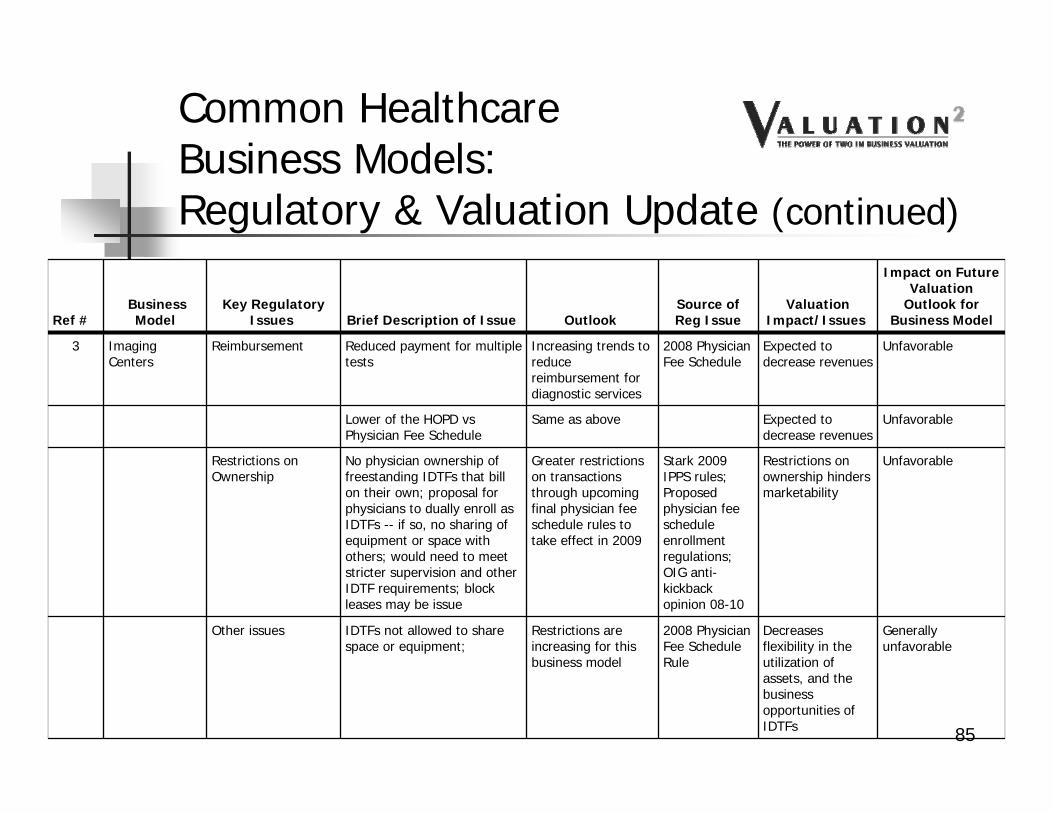
Common HealthcareBusiness Models:Regulatory & Valuation Update (continued)
Ref #Business Model
Key RegulatoryIssues Brief Description of Issue Outlook
Source of Reg Issue
Valuation Impact/Issues
Impact on Future Valuation
Outlook for Business Model
3 Imaging Centers
Reimbursement Reduced payment for multiple tests
Increasing trends to reduce reimbursement for diagnostic services
2008 Physician Fee Schedule
Expected to decrease revenues
Unfavorable
Lower of the HOPD vsPhysician Fee Schedule
Same as above Expected to decrease revenues
Unfavorable
Restrictions on Ownership
No physician ownership of freestanding IDTFs that bill on their own; proposal for physicians to dually enroll as IDTFs -- if so, no sharing of equipment or space with others; would need to meet stricter supervision and other IDTF requirements; block leases may be issue
Greater restrictions on transactions through upcoming final physician fee schedule rules to take effect in 2009
Other issues IDTFs not allowed to share space or equipment;
Restrictions are increasing for this business model
2008 Physician Fee Schedule Rule
Decreases flexibility in the utilization of assets, and the business opportunities of IDTFs
Generally unfavorable
85
Common HealthcareBusiness Models:Regulatory & Valuation Update (continued)
Ref #Business Model
Key Regulatory
Issues Brief Description of Issue OutlookSource of Reg Issue
Valuation Impact/Issues
Impact on Future
Valuation Outlook for
Business Model
4 Cancer Treatment Centers
Reimbursement Dependent on setting or place of service and nature of service (Ex: Cyberknife vs IMRT/EBRT)
Reimbursement outlook depends on the particular business model
Depends on the business model
Seeing an increase in activity
Restrictions on Ownership
Ownership by hospitals and radiation oncologists allowed; different rules for medical oncologists; For physician-owned centers, different tests for radiation oncologists and medical oncologists or multi-specialty group ownership--Need to meet Stark in-office ancillary services exception; No more under arrangments between physician joint ventures and hospitals; no per click or percentage leasing arrangments for office space or equipment
Dependent on type of physician providing service and hospital involvement; no changes where radiation oncologists only speciality; must restructuring must occur
Stark 2009 IPPS regulations
Marketability of interests: can be favorable as long as legally compliant
Seeing an increase in activity
Other issues No more under arrangments between physician joint ventures and hospitals; no per click or percentage leasing arrangments for office space or equipment
Increasing restrictions
Stark 2009 IPPS regulations
Reduces business opportunities of the model
Generally unfavorable
86
Common HealthcareBusiness Models:Regulatory & Valuation Update (continued)
Ref #Business Model
Key Regulatory
Issues Brief Description of Issue OutlookSource of Reg Issue
Valuation Impact/Issues
Impact on Future
Valuation Outlook for
Business Model
5 Cardiac Cath Labs
Reimbursement Free-standing reimbursement generally limited to diagnostic procedures only; interventional procedures require an "under arrangements or provide-based model"; "under arrangements" model for interventional procedures require location in hospital; under arrangments with physician-owned joint venture no longer allowed due to change of "entity" definition
At this time, unable to predict if/when interventionals will ever be reimbursable in a free-standing cathlab
Stark 2009 IPPS regulations
Use of free-standing cathlab may be limited if restricted to diagnostic procedures only; may be difficult to attract sufficient volumes to support high capital expenditures
Generally unfavorable
Restrictions on Ownership
When intervention cath billed as hospital service issue for Stark; also focus on anti-kickback statute
Marketability of interests: generally only involve a limited types of specialties (cardiology, radiologists)
Generally unfavorable
Moratoriums, other restrictions
New Stark rules create issue for interventional cath joint ventures of "under arrangement" and provider-based rules
New clarifications will generally restrict the types of procedures that can be performed in a cath lab.
Stark 2009 IPPS regulations
Potentially reduce volumes and revenues
Unfavorable
Other issues Diagnostic vs therapeutic catheterization
Regulatory Outlook -Uncertain
May restrict free-standing to diagnostic procedures only
Unfavorable87
Common HealthcareBusiness Models:Regulatory & Valuation Update (continued)
IV. Standing Firm: When the Deal Heats Up or Blows Up, Real World “Hypothetical Examples”
88
a. Keeping our Eyes on the Ball: Healthcare Fair Market Value Definitions
Fair Market Value Definitions: Commonly Used
1. Per IRS Revenue Ruling 59-60:“The price at which the property would change hands between a willing buyer and a willing seller
when the former is not under any compulsion to buy and the latter is not under any compulsion to sell, both parties having reasonable knowledge of relevant facts.”
2. Per the American Society of Appraisers, Business Valuation Standards:"The price, expressed in terms of cash equivalents, at which property would change hands
between a hypothetical willing and able buyer and a hypothetical willing and able seller, acting at arm’s length in an open and unrestricted market, when neither is under compulsion to buy or sell and when both have reasonable knowledge of the relevant facts.”
Investment Value
1. Per Financial Valuation Applications and Models, 2nd Edition, J. Hitchner“The value to a particular investor based on individual investment requirements and
expectations.” 89
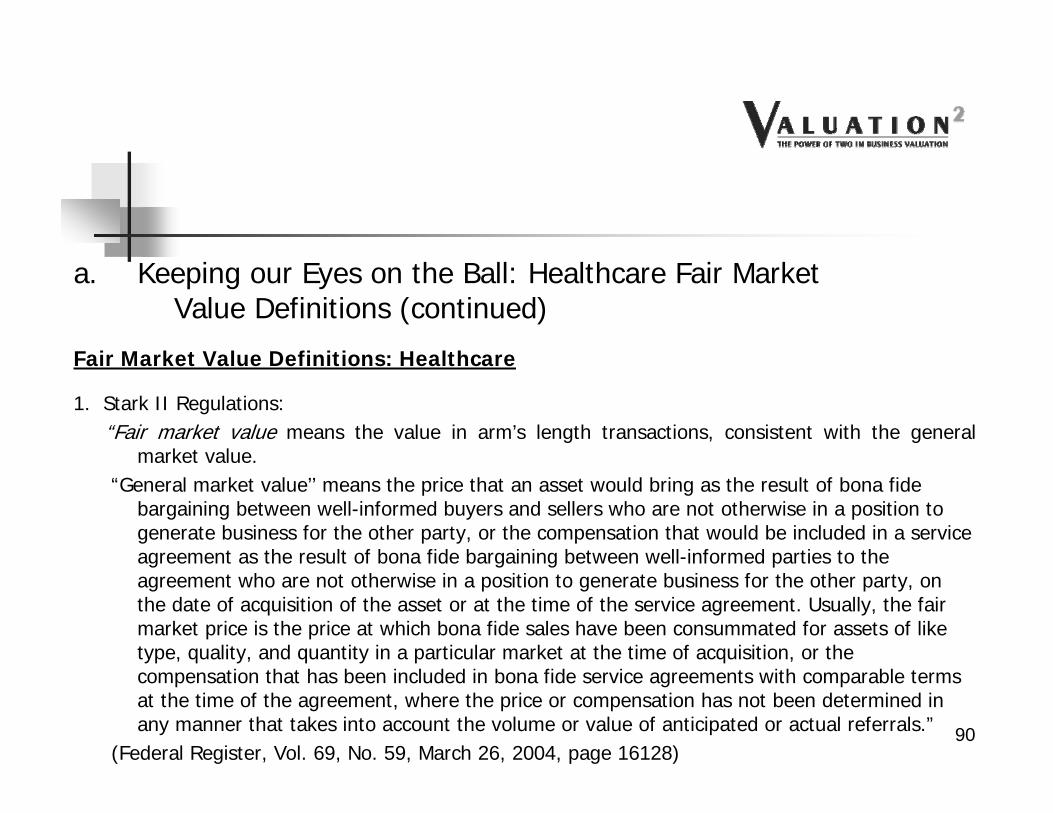
a. Keeping our Eyes on the Ball: Healthcare Fair Market Value Definitions (continued)
Fair Market Value Definitions: Healthcare
1. Stark II Regulations:“Fair market value means the value in arm’s length transactions, consistent with the general
market value.“General market value’’ means the price that an asset would bring as the result of bona fide
bargaining between well-informed buyers and sellers who are not otherwise in a position to generate business for the other party, or the compensation that would be included in a service agreement as the result of bona fide bargaining between well-informed parties to the agreement who are not otherwise in a position to generate business for the other party, on the date of acquisition of the asset or at the time of the service agreement. Usually, the fair market price is the price at which bona fide sales have been consummated for assets of like type, quality, and quantity in a particular market at the time of acquisition, or the compensation that has been included in bona fide service agreements with comparable terms at the time of the agreement, where the price or compensation has not been determined in any manner that takes into account the volume or value of anticipated or actual referrals.”
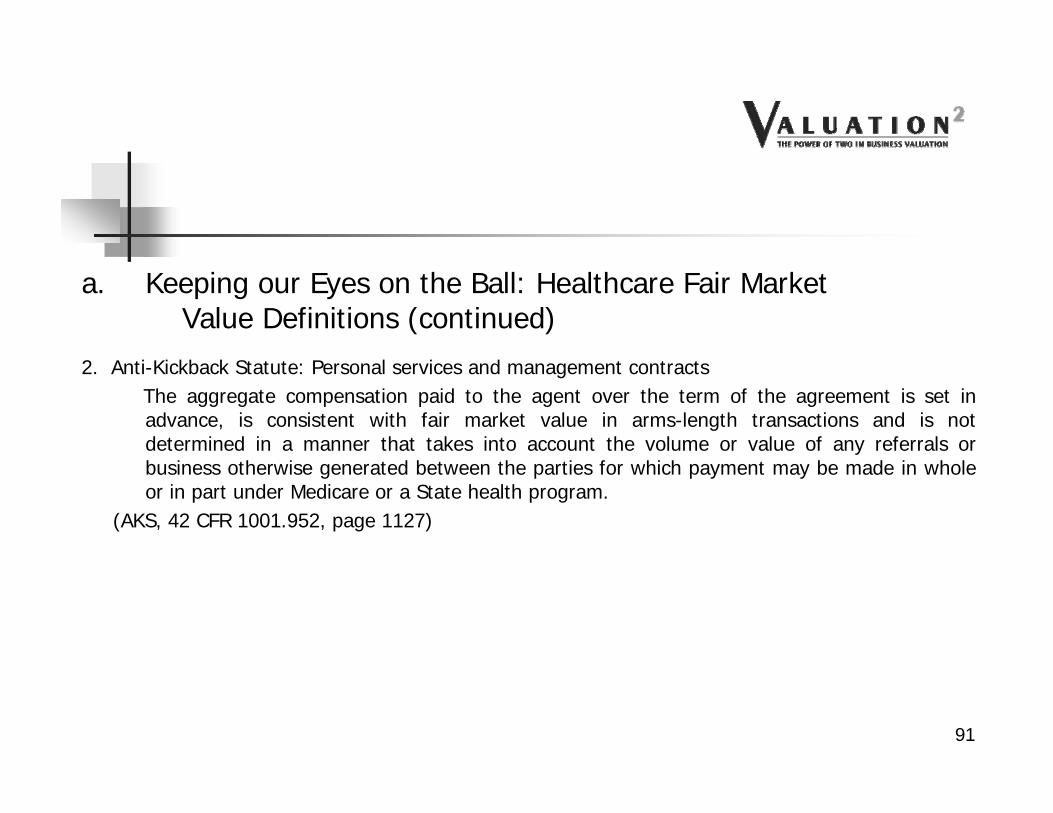
a. Keeping our Eyes on the Ball: Healthcare Fair Market Value Definitions (continued)
2. Anti-Kickback Statute: Personal services and management contractsThe aggregate compensation paid to the agent over the term of the agreement is set in advance, is consistent with fair market value in arms-length transactions and is not determined in a manner that takes into account the volume or value of any referrals or business otherwise generated between the parties for which payment may be made in whole or in part under Medicare or a State health program.
(AKS, 42 CFR 1001.952, page 1127)
91
a. Keeping our Eyes on the Ball: Healthcare Fair Market Value Definitions (continued)
Commercial Reasonableness: Healthcare
1. Per Stark I regulations:“With respect to determining what is “commercially reasonable,” any reasonable method of
valuation is acceptable, and the determination should be based upon the specific business in which the parties are involved, not business in general. In addition, we strongly suggest that the parties maintain good documentation supporting valuation.”
2. Per Stark II regulations:“An arrangement will be considered “commercially reasonable” in the absence of referrals if the
arrangement would make commercial sense if entered into by a reasonable entity of similar type and size and a reasonable physician (or family member or group practice) of similar scope and specialty, even if there were no potential DHS referrals.”