Pacific Disaster Center Area Brief: General Executive Summary HONOLULU 16:48:00 03 May 2017 LIMA 21:48:00 03 May 2017 WASH.D.C. 22:48:00 03 May 2017 ZULU 02:48:00 04 May 2017 NAIROBI 05:48:00 04 May 2017 BANGKOK 09:48:00 04 May 2017 Region Selected » Lower Left Latitude/Longitude: -11.6125 N˚ , -77.35 E˚ Upper Right Latitude/Longitude: -5.612500000000001 N˚ , -71.35 E˚ Current Hazards: Active Floods Event Severity Date (UTC) Name Lat/Long 27-Jan-2017 16:23:20 Flood - Peru 8.75° S / 75.55° W Recent Earthquakes Event Severity Date (UTC) Magnitude Depth (km) Location Lat/Long 04-May-2017 02:47:35 5.3 149.26 34km SE of Pucallpa, Peru 8.61° S / 74.35° W Source: PDC Lack of Resilience Index: Lack of Resilience represents the combination of susceptibility to impact and the relative inability to absorb, respond to, and recover from negative impacts that do occur over the short term. Brazil ranks 105 out of 165 on the Lack of Resilience index with a score of 0.37. Peru ranks 64 out of 165 on the Lack of Resilience index with a score of 0.46. Brazil ranks 105 out of 165 on the Lack of Resilience Index. Based on the sub-component scores related to Vulnerability and Coping Capacity, the three thematic areas with the weakest relative scores are Marginalization, Governance and Infrastructure. Peru ranks 64 out of 165 on the Lack of Resilience Index. Based on the sub-component scores related to Vulnerability and Coping Capacity, the three thematic areas with the weakest relative scores are Recent Disaster Impacts, Infrastructure and Governance. 170,000 Legend Population Density (person/sqkm) 0 Additional information and analysis is available for Disaster Management Professionals. If you are a Disaster Management Professional and would like to apply for access, please register here . Validation of registration information may take 24-48 hours. Flood - Peru Location: Ucayali, Peru Severity Level: Warning Earthquake - 5.3 - 34km SE... Location: Ucayali, Peru Severity Level: Advisory Situational Awareness Lowest (0) Highest (1) Peru Russia United States Brazil Australia China Nigeria
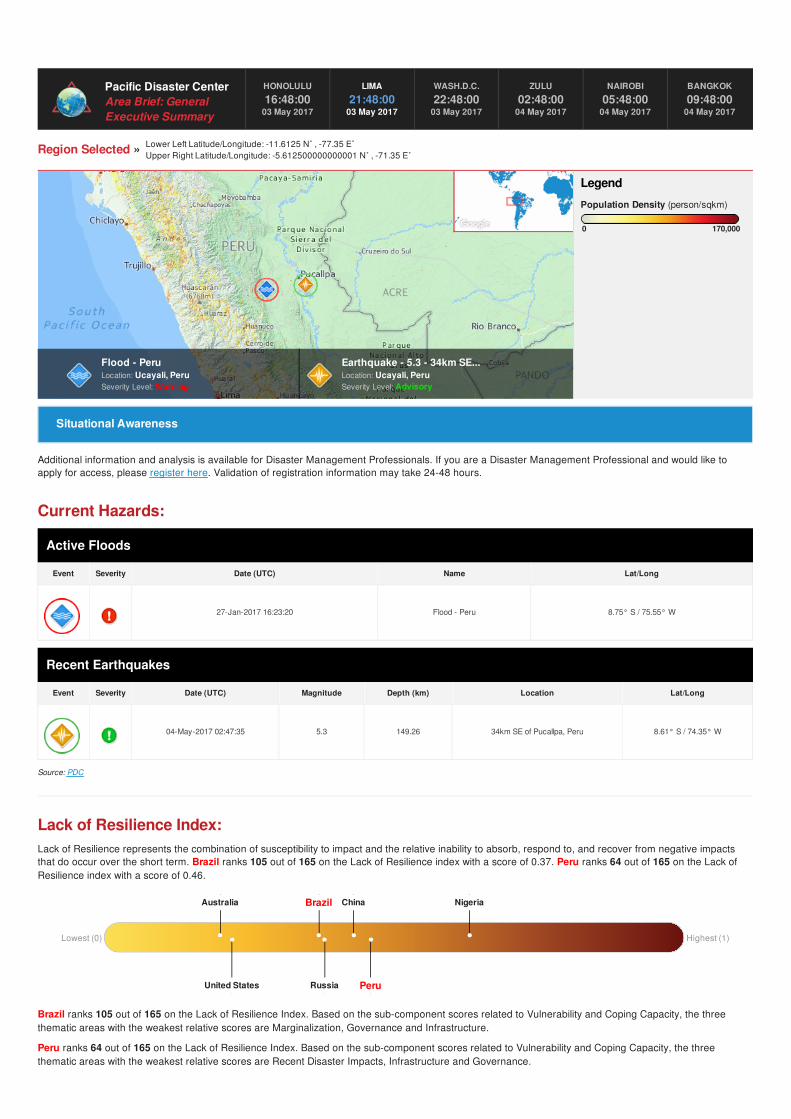
Region Selected » Lower Left Latitude/Longitude: -11.6125 N˚ , -77.35 E˚Upper Right Latitude/Longitude: -5.612500000000001 N˚ , -71.35 E˚
Current Hazards:
Active Floods
Event Severity Date (UTC) Name Lat/Long
27-Jan-2017 16:23:20 Flood - Peru 8.75° S / 75.55° W
Recent Earthquakes
Event Severity Date (UTC) Magnitude Depth (km) Location Lat/Long
04-May-2017 02:47:35 5.3 149.26 34km SE of Pucallpa, Peru 8.61° S / 74.35° W
Source: PDC
Lack of Resilience Index:Lack of Resilience represents the combination of susceptibility to impact and the relative inability to absorb, respond to, and recover from negative impactsthat do occur over the short term. Brazil ranks 105 out of 165 on the Lack of Resilience index with a score of 0.37. Peru ranks 64 out of 165 on the Lack ofResilience index with a score of 0.46.
Brazil ranks 105 out of 165 on the Lack of Resilience Index. Based on the sub-component scores related to Vulnerability and Coping Capacity, the threethematic areas with the weakest relative scores are Marginalization, Governance and Infrastructure.
Peru ranks 64 out of 165 on the Lack of Resilience Index. Based on the sub-component scores related to Vulnerability and Coping Capacity, the threethematic areas with the weakest relative scores are Recent Disaster Impacts, Infrastructure and Governance.
170,000
Legend
Population Density (person/sqkm)
0
Additional information and analysis is available for Disaster Management Professionals. If you are a Disaster Management Professional and would like toapply for access, please register here. Validation of registration information may take 24-48 hours.
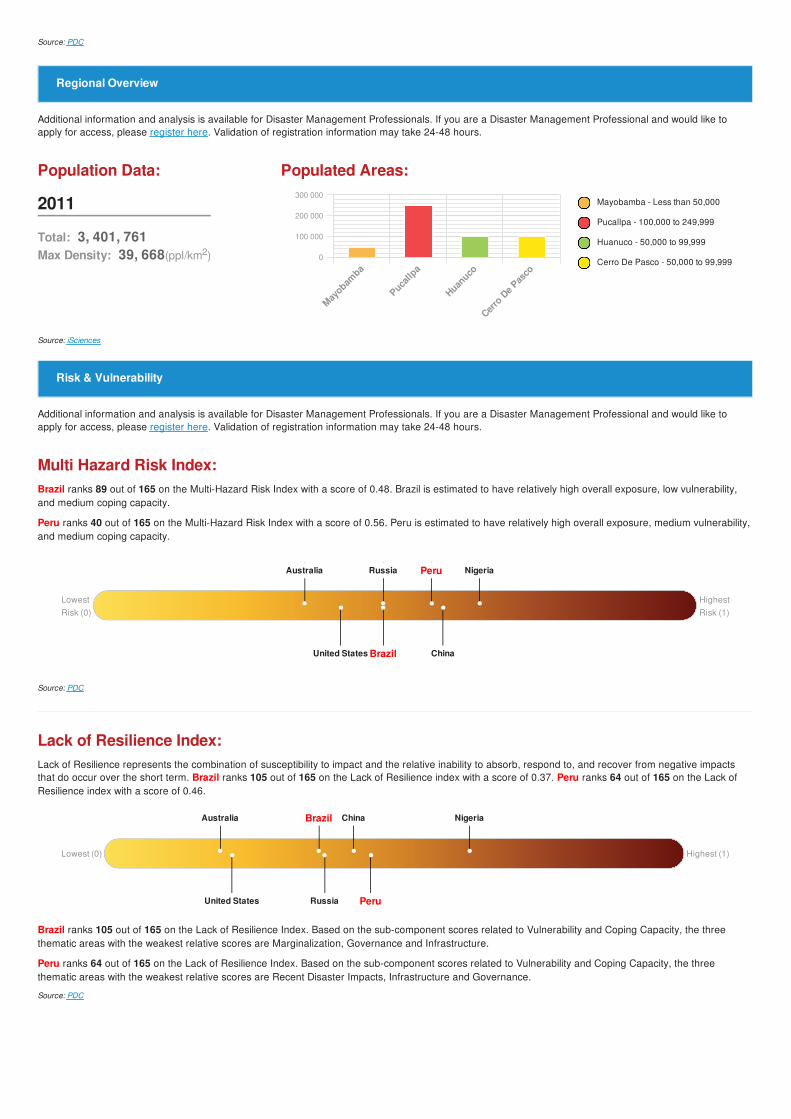
Multi Hazard Risk Index:Brazil ranks 89 out of 165 on the Multi-Hazard Risk Index with a score of 0.48. Brazil is estimated to have relatively high overall exposure, low vulnerability,and medium coping capacity.
Peru ranks 40 out of 165 on the Multi-Hazard Risk Index with a score of 0.56. Peru is estimated to have relatively high overall exposure, medium vulnerability,and medium coping capacity.
Source: PDC
Lack of Resilience Index:Lack of Resilience represents the combination of susceptibility to impact and the relative inability to absorb, respond to, and recover from negative impactsthat do occur over the short term. Brazil ranks 105 out of 165 on the Lack of Resilience index with a score of 0.37. Peru ranks 64 out of 165 on the Lack ofResilience index with a score of 0.46.
Brazil ranks 105 out of 165 on the Lack of Resilience Index. Based on the sub-component scores related to Vulnerability and Coping Capacity, the threethematic areas with the weakest relative scores are Marginalization, Governance and Infrastructure.
Peru ranks 64 out of 165 on the Lack of Resilience Index. Based on the sub-component scores related to Vulnerability and Coping Capacity, the threethematic areas with the weakest relative scores are Recent Disaster Impacts, Infrastructure and Governance.
Source: PDC
Additional information and analysis is available for Disaster Management Professionals. If you are a Disaster Management Professional and would like toapply for access, please register here. Validation of registration information may take 24-48 hours.
Additional information and analysis is available for Disaster Management Professionals. If you are a Disaster Management Professional and would like toapply for access, please register here. Validation of registration information may take 24-48 hours.
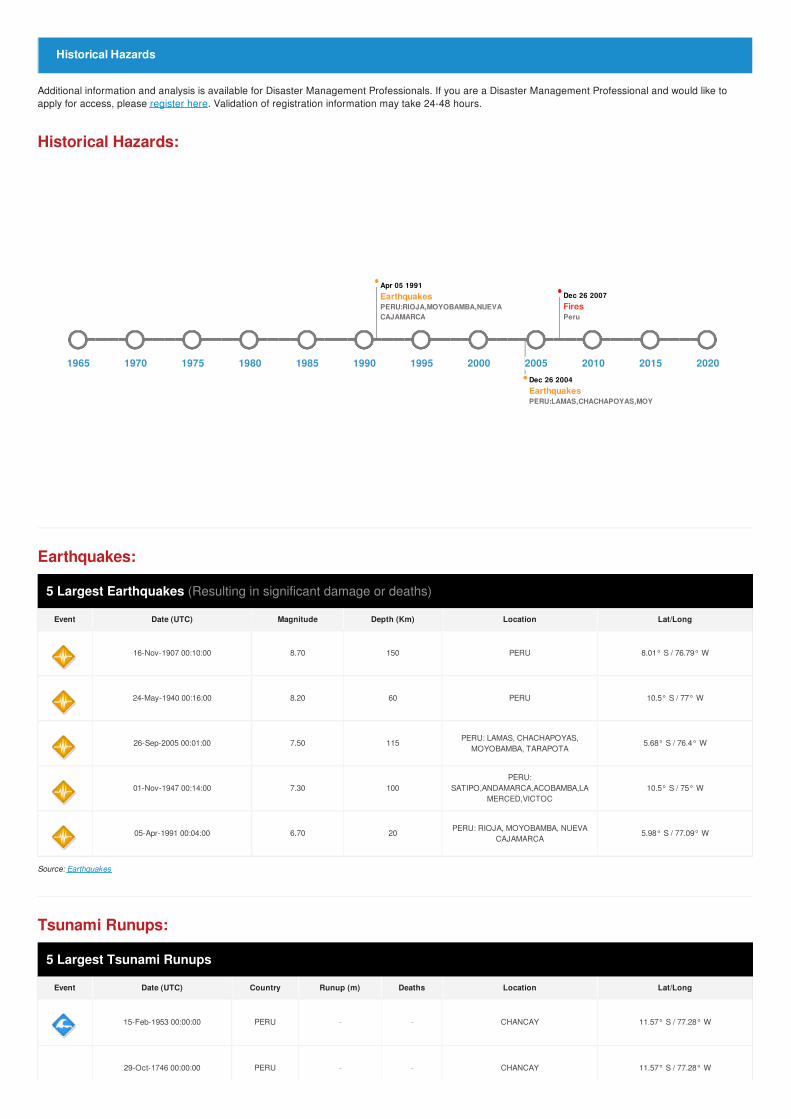
05-Apr-1991 00:04:00 6.70 20PERU: RIOJA, MOYOBAMBA, NUEVA
CAJAMARCA5.98° S / 77.09° W
Source: Earthquakes
Tsunami Runups:
5 Largest Tsunami Runups
Event Date (UTC) Country Runup (m) Deaths Location Lat/Long
15-Feb-1953 00:00:00 PERU - - CHANCAY 11.57° S / 77.28° W
29-Oct-1746 00:00:00 PERU - - CHANCAY 11.57° S / 77.28° W
Additional information and analysis is available for Disaster Management Professionals. If you are a Disaster Management Professional and would like toapply for access, please register here. Validation of registration information may take 24-48 hours.
Historical Hazards
Dec 26 2004EarthquakesPERU:LAMAS,CHACHAPOYAS,MOYOBAMBA,TARAPOTA
20-Oct-1687 00:00:00 PERU - - CHANCAY 11.57° S / 77.28° W
Event Date (UTC) Country Runup (m) Deaths Location Lat/Long
Source: Tsunamis
Wildfires:
5 Largest Wildfires
Event Start/End Date(UTC) Size (sq. km.) Location Mean Lat/Long
01-Sep-2008 18:50:00 - 26-Sep-2008 18:45:00 8.70 Peru 9.36° S / 75.11° W
Source: Wildfires
* As defined by the source (Dartmouth Flood Observatory, University of Colorado), Flood Magnitude = LOG(Duration x Severity x Affected Area). Severityclasses are based on estimated recurrence intervals and other criteria.
The information and data contained in this product are for reference only. Pacific Disaster Center (PDC) does not guarantee the accuracy of this data. Refer tooriginal sources for any legal restrictions. Please refer to PDC Terms of Use for PDC generated information and products. The names, boundaries, colors,denominations and any other information shown on the associated maps do not imply, on the part of PDC, any judgment on the legal status of any territory, orany endorsement or acceptance of such boundaries.