Current knowledge, key uncertainties and future research directions for defining the stock structure of skipjack, yellowfin, bigeye and South Pacific albacore tunas in the Pacific Ocean Final Report for SAN 6004150 (CI-3) Identifying the Spatial Stock Structure of Tropical Pacific Tuna Stocks Developed for Conservation International (CI) as part of the GEF-funded, World Bank- implemented Ocean Partnerships for sustainable fisheries and biodiversity conservation (OPP), a sub-project of the Common Oceans ABNJ Program led by UN-FAO. Prepared by Bradley R. Moore (UTAS), John Hampton, Graham M. Pilling, Neville Smith (SPC), and partners November 2018
Transcript
Current knowledge, key uncertainties and future
research directions for defining the stock structure
of skipjack, yellowfin, bigeye and South Pacific
albacore tunas in the Pacific Ocean
Final Report for SAN 6004150 (CI-3)
Identifying the Spatial Stock Structure of Tropical Pacific Tuna
Stocks
Developed for Conservation International (CI) as part of the GEF-funded, World Bank-
implemented Ocean Partnerships for sustainable fisheries and biodiversity conservation (OPP), a
sub-project of the Common Oceans ABNJ Program led by UN-FAO.
Prepared by Bradley R. Moore (UTAS), John Hampton, Graham M. Pilling, Neville Smith (SPC),
and partners
November 2018
1
Current knowledge, key uncertainties and future
research directions for defining the stock structure
of skipjack, yellowfin, bigeye and South Pacific
albacore tunas in the Pacific Ocean
Bradley R. Moore1, Johann Bell2,3, Karen Evans4, John Hampton5, Peter Grewe4, Amandine D.
Marie6, Carolina Minte-Vera7, Simon Nicol8, Joe Scutt Phillips9, Graham M. Pilling5, Laura
Tremblay-Boyer10, Ashley J. Williams6,11 and Neville Smith5
1Institute for Marine and Antarctic Studies, University of Tasmania, Hobart TAS 7001, Australia 2Conservational International, 2011 Crystal Drive, Suite 500, Arlington, VA 22202, USA
3Australian National Centre for Ocean Resources and Security, Wollongong NSW 2522, Australia 4CSIRO Oceans and Atmosphere, GPO Box 1538, Hobart Tasmania 7001, Australia
5Oceanic Fisheries Programme, Pacific Community (SPC), Noumea BP D5 98848, New Caledonia 6Panouna, Koumac 98850, New Caledonia
7Inter-American Tropical Tuna Commission, La Jolla, CA 92037-1509, USA 8Australian Bureau of Agriculture and Resource Economics and Sciences, Department of Agriculture
and Water Resources, Canberra, ACT 2601 Australia 9Institute for Marine and Atmospheric Research, Department of Physics, Utrecht University,
Netherlands 10Dragonfly Data Science, Te Aro, Wellington 6011, New Zealand
11Centre for Sustainable Tropical Fisheries and Aquaculture, College of Science and Engineering,
James Cook University, Townsville, QLD 4811, Australia
2
Report outline
Tuna are the focus of significant fisheries in the Pacific Ocean, with landings of four species
(skipjack tuna, yellowfin tuna, bigeye tuna and albacore tuna) constituting approximately 70% of
the global tuna catch. Stock assessments for skipjack, yellowfin, bigeye and South Pacific
albacore tunas in the Pacific Ocean currently assume eastern and western stocks, a split that
reflects historical development of fishery management in the region rather than biological
considerations. There is widespread agreement that uncertainties surrounding the stock structure
of the four main target species could have important impacts on population dynamics models
used to assess stock status and inform management options. Improved knowledge of stock
structure is also essential to modelling the effects of climate change on the distribution and
abundance of tuna species. This paper reviews current knowledge and understanding of the
stock structure of skipjack, yellowfin, bigeye and South Pacific albacore tunas in the Pacific
Ocean, through an exploration of available literature relating to movement, connectivity, and
spatial dynamics. Informed by an expert workshop, we then outline the key questions that need
to be addressed to determine the stock structure for each species, and propose some potential
sampling designs by which future studies may address these uncertainties and improve
understanding of stock structure of the four tuna species in the Pacific.
3
Introduction
Tuna (Family Scombridae, Tribe Thunnini) are ecologically important top-order predators in
pelagic ocean ecosystems. They occur across tropical to sub-polar habitats and support
extensive fisheries worldwide. In the Pacific Ocean, tuna support major industrial fisheries and a
variety of small-scale domestic and subsistence fisheries. The principal target species are
obesus), and albacore tuna (Thunnus alalunga). Combined, these four species comprise over
90% of industrial catches in the Pacific and approximately 70% of global catches, with
approximately 3.2 million metric tonnes (mt) harvested in 2017 (SPC-OFP 2018a).
Commercial catches of tuna in the Pacific result mainly from two separate fisheries: 1) a surface
fishery, that targets skipjack and juvenile yellowfin tunas using purse-seine and pole-and-line
fishing methods, primarily for the canning trade, and 2) a sub-surface longline fishery, that
targets mature bigeye and yellowfin tunas for the sashimi trade and other high-value markets,
and albacore tuna for canning.
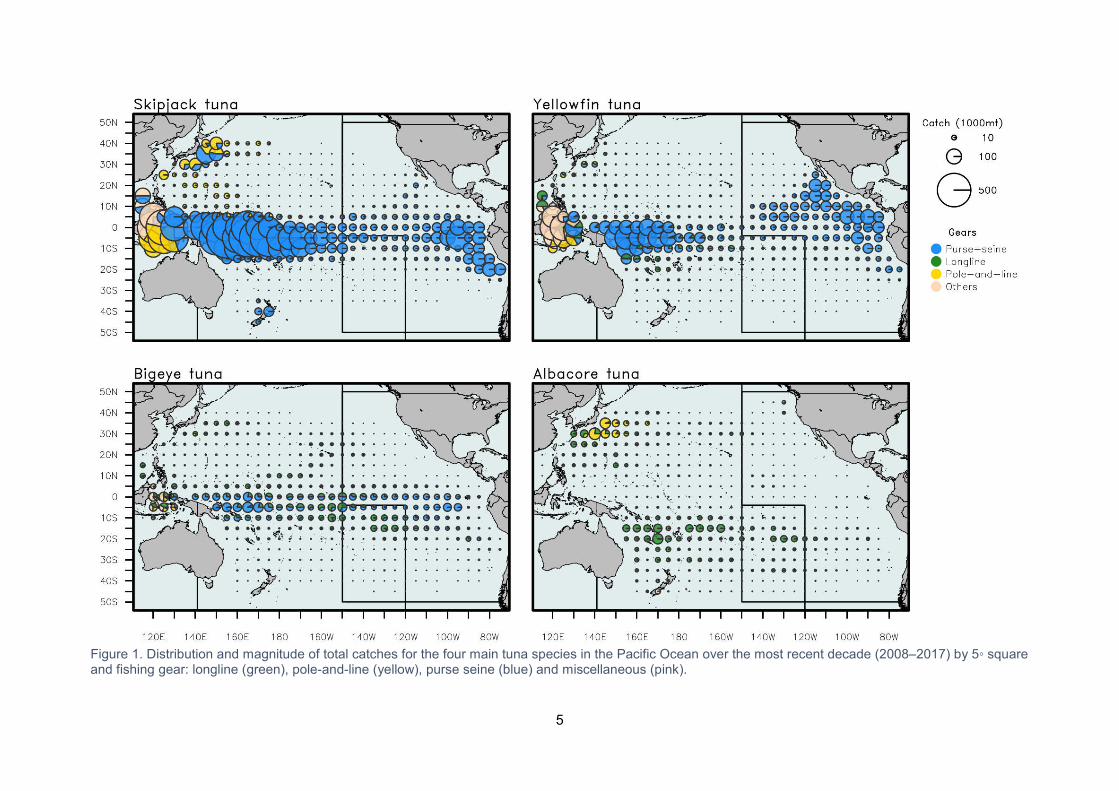
The majority of the catches of these four species in the Pacific Ocean comes from the waters of
the Western and Central Pacific Ocean (WCPO), with an estimated 2,539,950 mt harvested
commercially in 2017 (Figure 1) (SPC-OFP 2018a1). Around 60 per cent of this is taken within
the Exclusive Economic Zones (EEZs) of Pacific Island Countries and Territories2 (PICTs;
Williams and Reid 2018), including by foreign-flagged vessels that pay fees to PICTs in order to
access their EEZs. In addition, important harvests are made by artisanal and subsistence fishers
in nearshore waters of PICTs for domestic consumption (Bell et al. 2015, 2018a). As a
consequence, tuna fisheries make substantial contributions to government revenue, gross
domestic product, employment, livelihoods and food security in several PICTs (Gillett 2016;
Williams and Reid 2018; Bell et al. 2018a). Further west, large catches of tuna are also taken in
the waters surrounding Indonesia and the Philippines, representing around 35% of the total
WCPO catch (SPC-OFP 2018a). Smaller, and in some cases seasonal, catches of the four
species are taken in the EEZs of Australia, New Zealand, China, Japan, and Vietnam (SPC-OFP
2018a).
Substantial harvests of tuna are also made in the Eastern Pacific Ocean (EPO), with an
estimated 637,397 mt of skipjack, yellowfin and bigeye tunas caught in 2017 (IATTC 2018).
Historically, catches in the EPO have been dominated by yellowfin tuna, with catches for this
species peaking at around 440,000 t in 2002 (IATTC 2018). However, in recent years, catches of
skipjack tuna have exceeded those of yellowfin tuna, with an estimated 327,979 t of skipjack tuna
landed in 2017 (IATTC 2018).
Management of tuna stocks in the Pacific, which are assumed to straddle EEZs and the high
seas, occurs primarily through two international conventions: the Convention on the
Conservation and Management of High Migratory Fish Stocks in the Western and Central Pacific
Ocean; and the Antigua Convention (which revised the Convention for the establishment of an
Inter-American Tropical Tuna Commission). These conventions are operationalised by two
independent tuna Regional Fisheries Management Organizations (RFMOs): the Western and
Central Pacific Fisheries Commission (WCPFC) in the WCPO, and the Inter-American Tropical
1 Based on catch estimates for the Western and Central Pacific Fisheries Commission Statistical Area. 2 American Samoa, Cook Islands, Fiji, Federated State of Micronesia, French Polynesia, Guam, Kiribati, Marshall Islands, Nauru, New Caledonia, Niue, Northern Mariana Islands, Palau, Papua New Guinea, Pitcairn Islands, Samoa, Solomon Islands, Tokelau, Tonga, Tuvalu, Vanuatu, Wallis and Futuna.
4
Tuna Commission (IATTC) in the EPO. There is an overlap in the area of responsibility of the two
RFMOs, bounded by 150°W, 130°W, 4°S and 50°S, with this region considered part of the
WCPO in catch statistics (the WCPFC Statistical Area; Figure 1). Assessments of skipjack,
yellowfin and bigeye tunas have been conducted by the Pacific Community (SPC) in the WCPO,
and by the IATTC Secretariat in the EPO. The status of albacore tuna in the South Pacific is
assessed by SPC and in the North Pacific by the International Scientific Committee for Tuna and
Tuna-like Species in the North Pacific Ocean (ISC).
Despite their importance to fisheries across the Pacific and globally, and the regular population
assessments conducted as part of RFMO activities, a number of uncertainties associated with
the population connectivity and stock structure of skipjack, yellowfin, bigeye and South Pacific
albacore tunas exist. Current assessments for skipjack, yellowfin and bigeye tunas assume
eastern and western stocks of each species; a split that essentially reflects the history of fishery
management in the region rather than biological considerations. Similarly, regional structures in
stock assessments, when present, typically represent the spatial distribution of fishing gears with
differing selectivities, tag mixing assumptions, and management regimes. There is growing
evidence however, that suggests that the spatial structure and dynamics of populations of the
four target tuna species may be more complex than currently assumed, as highlighted across the
breadth of studies reviewed herein. There is widespread agreement that complexities in stock
structure, if present at levels beyond those currently incorporated in the population dynamics
models used to assess stock status, will have important impacts on assessments for the four
main target species. Depending on the degree of complexity present, there are also implications
for models used to assess the effects of climate change on the distribution and abundance of the
tropical Pacific tuna species (Lehodey et al. 2017; Senina et al. 2018). To date, such modelling
has assumed that each species of tuna is a panmictic population across the tropical Pacific
basin. For such models to be applied effectively in identifying potential adaptation scenarios that
may be uptaken to reduce the socio-economic risks associated with changes in the distribution
and abundance of tuna (Bell et al. 2018b), models need to be able to appropriately represent
each self-replenishing population (stock) of tuna. Accordingly, defining the stock structure of the
four species is considered a key research priority (Lewis 1990; Kolody and Hoyle 2015; Evans et
al. 2016).
This review adopts the approach that to the greatest extent possible self-replenishing populations
should be the basic unit of fisheries management and examines information published relating to
the stock structure of skipjack, yellowfin, bigeye and South Pacific albacore tunas in the Pacific
Ocean in this context. We first explore definitions of stock structure, in the context of highly
mobile species, and examine the techniques commonly used for discerning stock structure of
pelagic fishes. We then review those studies that have contributed to the current understanding
of the stock structure of the four tuna species in the Pacific. Last, based on information from an
expert workshop, we outline key knowledge gaps and questions to defining the stock structure of
each species, and outline potential sampling design approaches and considerations that could
be implemented to improve understanding of the stock structure of the four tropical tuna species
in the Pacific.
5
Figure 1. Distribution and magnitude of total catches for the four main tuna species in the Pacific Ocean over the most recent decade (2008–2017) by 5◦ square and fishing gear: longline (green), pole-and-line (yellow), purse seine (blue) and miscellaneous (pink).
6
The role of stock structure in fisheries management
Knowledge of a species’ stock structure is a fundamental component of single species and
ecosystem-based fisheries assessment and management. Fisheries management generally aims
to achieve objectives which may include maximising production whilst avoiding the
overexploitation of the units being harvested (Shaklee et al. 1990). To meet these goals fisheries
managers must acquire knowledge about the number, size and spatial extent of the stock(s)
being harvested. Most stock assessment models rely on the assumption that the group of
individuals being assessed (a unit stock) form a discrete entity, with its own origin,
demographics, and fate (Kutkuhn 1981; Begg et al. 1999a; Cadrin et al. 2005; Waldman et al.
2005). Accordingly, before any population parameters can be derived for use in stock
assessment models, the boundaries that characterise the stock in question must be defined,
otherwise the way a stock will respond to management decisions cannot be accurately predicted
(Begg et al. 1999a). Undertaking a single stock assessment on multiple individual stocks or on
only a portion of a larger stock may produce misleading results if a closed stock within the
assessment boundary is assumed (Begg et al. 1999a) (Figure 2). Failure to recognise stock
structure can lead to over- or under-fishing (Tuck and Possingham 2000). Where stocks may be
undergoing rebuilding, differential restoration between unidentified stock components can lead to
an inability to anticipate future recruitment to those stocks (Begg et al. 1999a; Kell et al. 2009).
Figure 2. Diagram of scenarios in which A) assessment boundaries (black rectangles) match stock unit (dashed blue ellipses); B) assessment boundaries smaller than stock unit (i.e. the modelled stock is not closed), and C) assessment boundaries encompass multiple stock units (i.e. model assumes exchange and same biological parameters across stocks).
7
Hypothetical stock structure scenarios for tuna in the Pacific Ocean
The first step in defining stock boundaries for a specific species is to consider which model best
describes the potential population structure (Baverstock and Moritz, 1996). Higher levels of
migration and gene flow are expected to result in greater similarity within and between
populations. Pelagic fishes such as tuna can exhibit complex spatial dynamics, owing to a range
of processes acting on all life history stages. Past and ongoing studies aiming to identify stock
structure for pelagic fish have generally attempted to address one of three main themes: i) the
conditions governing spawning (timing, location and behaviour; Figure 3), ii) the extent of
individual movement/mixing, including provenance, or where the individual is sourced from, and
iii) the existence of natal homing, or the tendency for individuals to return to their birth location to
spawn. For tunas, questions relating to these three themes are especially important. This is
because tropical tunas appear to have overlapping spawning and foraging areas, combined with
potentially high levels of juvenile movement, and consequently populations sampled from an
area may represent a mix of fish with different natal origins. These three themes can result in
different scenarios of population structure, outlined below, each with their own stock assessment
implications (Table 1). For example, in a hypothetical instance in which spawning is conducted in
discrete locations, with low post-larval mobility, and high degree of natal homing, there is a high
risk of overfishing less productive stocks if a single stock is assumed (Table 1). Hypotheses of
tuna stock structure in the Pacific Ocean that warrant consideration are summarised as follows:
1. Basin-wide Panmixia. A panmictic population is one where it is assumed that there are no
mating restrictions, neither genetic nor behavioural, upon the population, and that therefore all
recombination is possible (i.e. the mating between two organisms is not influenced by any
environmental, hereditary, or social interaction). This hypothesis assumes a single basin-wide
stock for the Pacific Ocean.
2. Isolation by Distance. This describes the process of increasing genetic differentiation
correlated with increasing geographic distance. (i.e. a continuous stock with organisms
exchanging genes from geographically close areas).
3. Metapopulations. This describes a series of small sub-stocks with small amounts of
connectivity between them, either through advection of eggs or larvae, or movement of post-
larval life history stages (juveniles and adults). Spatial and temporal isolation mechanisms may
restrict the gene flow within a population. This may result in differing levels of recruitment in an
area as a result of stochastic processes leading to the reproductive activity coinciding with the
oceanographic conditions conducive to spawning, fertilization, and larval survival. If favourable
(or unfavorable) environmental conditions persist this may lead to sufficient selection of alleles
that delineates sub-stocks. This may manifest in other traits such as differing growth rates and
maturity dynamics.
4. Closed populations. Each species is structured into multiple, reproductively isolated units, with
no gene flow between them.
8
Figure 3. Schematic of the range of conditions governing spawning in tunas, ranging from less restrictive, where spawning is opportunistic and limited by environmental conditions, to slightly more restrictive, where adults spawn in specific areas, to the most restrictive, in which adults undergo homing and only spawn in their area of natal origin.
9
Table 1. Summary of key research themes to gain understanding of stock structure for pelagic species: spawning conditions (opportunistic vs. discrete); post-larval mobility (low vs. high) and natal homing. The combination of these themes in turn yields different scenarios of stock structures (4th column; diagrams) associated with potential stock assessment concerns (5th column). The top row outlines the main tools available to study each of the three themes. The darker blue in the diagrams indicate an area where spawning occurs within the overall range (light blue).
10
Approaches for delineating stock structure of pelagic fishes
Molecular approaches
Molecular markers have been widely used in fisheries management to investigate the genetic
structuring of populations of fishes. In addition, they have been used for species identification,
provenance (e.g. for chain of custody determination) and for investigations of population
connectivity (Morin et al. 2004; Pecoraro et al. 2017). The continuous development of novel
techniques, combined with increasing accuracy and reliability, has seen the utility of molecular
markers in fisheries management applications increase over time. In particular, the development
of DNA-based markers in the early 1990s rapidly revolutionized population genetics. The
invention of a technique known as polymerase chain reaction (PCR) and more recently DNA
sequencing has further driven progress in approaches to investing the population genetics of
marine fish species.
Allozymes were the first molecular markers used in population genetics. They were used for
several decades due to their relative rapidity and ease to quantify genetic variation among
populations allowing the assessment of their genetic structure (Ward et al. 1997; González-
Wangüemert et al. 2007), as well as to underline evolutionary forces that promote differentiation
(Carvalho and Hauser 1995). However, the limited number of loci and the low level of variability
of allozymes resulted in low analytical power in terms of the comparison of allele frequencies,
estimation of population differentiation and basic mixed-stock analyses (Lewontin 1974; Ryman
and Utter 1987).
The development of DNA markers in the early 1990s rapidly revolutionized population genetic
structure analysis by allowing determination of gene flow and allele frequencies among
populations. The first widely used DNA marker was mitochondrial DNA (mtDNA), surveyed either
by fragment or direct sequencing analysis. Two main characteristics make mtDNA a particularly
useful marker in population studies. First, the mtDNA control region evolves rapidly, allowing for
detection of genetic differentiation over relatively small geographic and short evolutionary
timescales (Avise 1994). Second, mtDNA is maternally inherited, resulting in it having an
effective population size one fourth of that of nuclear markers, making it a more sensitive
detector of population subdivision and bottlenecks (Wilson et al. 1985). In addition, because of
this maternal inheritance, it can provide insight into the extent of female dispersal and spawning
dynamics (Avise 1994).
Microsatellite markers have been commonly used in population genetic studies of marine fishes
due to features including hypervariability, codominant inheritance, reproducibility, high mutation
rates and their multiallelic nature (Pompanon et al. 2005; Guichoux et al. 2011; Horreo et al.
2017). High mutation rates are of particular interest due to high levels of variation present in
marine fish populations. Microsatellite markers are considered to be more reliable than mtDNA
markers for identifying populations with recent divergence or that exhibit greater gene flow
(Ogden 2008). Their high mutation rates and presence of null alleles however, may cause
problems in population analysis (Morin et al. 2004; Pompanon et al. 2005), including producing
unreliable estimates of divergence times and gene flow among populations (Kalinowski 2002;
Morin et al. 2004; Pompanon et al. 2005). In addition, compared to allozymes and mtDNA
assays, microsatellite markers are species-specific, making their development and reproducibility
quite challenging (Zane et al. 2002; Pompanon et al. 2005; Guichoux et al. 2011).
In the last decade, the development of high-throughput (next-generation) sequencing technology
has allowed for the sequencing of DNA more rapidly and cheaply than previously. In particular,
11
this technology has facilitated the identification of single nucleotide polymorphisms (SNPs).
These markers consist of a single base change in a DNA sequence, with the least frequent allele
having a frequency of one percent or greater and are usually bi-allelic in nature. Single
nucleotide polymorphisms, which are linked to genes under selection, offer numerous
advantages over mtDNA and microsatellite-based approaches in population structure studies,
including the potential for higher genotyping efficiency, greater data quality and reliability,
genome-wide coverage and analytical simplicity (Morin et al. 2004; Corander et al. 2013). Use of
SNPs in fishery applications include investigation of population structure, determination of
species identification, traceability and provenance, and estimations of population size (Morin et
al. 2004; Nielsen et al. 2012; Bylemans et al. 2016; Grewe et al. 2015).
Non-molecular approaches
Tagging
A range of externally attached and internally placed tags can provide information on the
movements of individuals and have been used extensively throughout the Pacific on a range of
tuna species (e.g. Kleiber and Hampton 1994; Hampton and Gunn 1998; Labelle and Hampton
2003; Schaefer and Fuller 2007; Evans et al. 2008; Williams et al. 2015; Scutt Phillips et al.
2017). The simplest is a plastic, uniquely identifying, tag known as a conventional, mark-
recapture tag. Information on the location at which the tagged fish was released and recaptured
provide insights into dispersion of fish (e.g. Hampton and Gunn 1998). The advent of electronic
tagging now provides detailed information on the behaviour of pelagic species, and aspects of
their environment, on spatial and temporal scales largely independent from fisheries. The
deployment of an ever-evolving array of telemetry and data logging devices on a growing number
of marine species is rapidly increasing our understanding of the movement, behaviour and
physiology of these species and the complex, and often highly dynamic, environments they use
and respond to (e.g. Evans et al. 2013), with light-based geolocation approaches providing lower
resolution of movements and GPS tags providing higher resolution of movements (see Sibert et
al. 2003; Evans et al. 2011; Basson et al. 2016).
Life-history parameters
Variability in life history parameters, particularly those associated with age, growth, and
reproduction, and morphological and meristic characteristics, can provide some insights into the
potential structuring of pelagic fish populations (Jennings and Beverton 1991; Abaunza et al.
2008; Silva et al. 2008; Zischke et al. 2013) and the presence of geographic and / or reproductive
isolation (Ihssen et al. 1981; Begg et al. 1999b).
Analysis of body shape (morphometrics), or counts of morphological structures, such as fin rays,
gills rakers, or scales in rows (meristics) have long served as a basis for fish stock identification.
Variations in body morphometrics and meristics are widely acknowledged to be influenced by
both genetic and environmental factors, including temperature, salinity, depth, current flow and
dissolved oxygen (Robinson and Wilson 1994; Foote et al. 1999).
Chemical constituents of body parts
Examination of the chemical composition of inert body tissue has the potential to offer insights
into the movement and stock structure of pelagic fishes (Rooker et al. 2001, 2008; Shiao et al.
2010; Wells et al. 2015). A range of tissues have been used to provide information on movement
and stock structure (as reviewed by Tzadik et al. 2017), although otoliths are the most commonly
examined. As an otolith grows, elements are incorporated into its calcium carbonate structure at
rates largely mediated by both environmental and endogenous factors, including ambient
concentration, water temperature, salinity and diet (Fowler et al. 1995; Campana 1999). As
12
otoliths are metabolically inert (i.e. they are not subject to resorption, remodelling or
regeneration), the deposition of elements and resulting chemical signature remains unaltered
through time (Campana 1999). Consequently, otoliths retain a chronological record of the
environments experienced by a fish throughout its life (Campana 1999; Secor and Rooker 2000).
Historically, studies typically examined whole otoliths dissolved in solution providing a composite
chemical signal across a fish’s entire life (e.g. Newman et al. 2009). However, recent advances
in laser ablation and micro-milling technologies have allowed for examination of fine-scale
patterns in chemistry within defined areas of individual otoliths. When assessed in conjunction
with temporal references within otoliths, such as annual or daily growth increments (e.g. Rooker
et al. 2008; Moore and Simpfendorfer 2014), and/or an understanding of the potential source of
the chemical signature examined (e.g. Harwood et al. 2008), resulting chemical profiles can
facilitate examination of ontogenetic patterns of movement and determination of natal origin and
provenance thereby providing insights into potential differences between populations.
Recently, several studies have examined the chemical composition, and in particular isotopes of
δ13C and δ15N, of metabolically active tissues of pelagic fishes to examine the broad scale
foraging ecology of species (see review by Graham et al. 2010). In pelagic fishes, estimates
suggest isotopic signatures in metabolically active tissues such as muscle typically have turnover
rates of less than one year (e.g. Madigan et al. 2012), indicating they could provide inform on
short-term movements.
Parasites as biological tags
Several studies have used parasites as biological tags to elucidate movements and stock
structure of pelagic fishes, including skipjack tuna (Lester et al. 1985), albacore tuna (Jones
Molecular approaches, combined with conventional tagging and size distribution data, were used
to identify three sub-populations within the central-eastern Pacific population of Fujino (1970): the
central west Pacific, the central northeast Pacific, and the central southeast Pacific (Fujino 1996).
DNA isolation, mtDNA D-loop region amplification, and nucleotide sequence analyses failed to
detect any genetic differentiation between skipjack samples from the WCPO and EPO (Ely et al.
2005).
15
Non-molecular studies
Skipjack tuna has been the primary focus of a large number of dedicated, large-scale,
conventional tagging programmes conducted in both the WCPO and EPO. In the WCPO, these
studies date back to the 1970s, commencing with the Skipjack Survey and Assessment
Programme (SSAP; 1977–1981). Large numbers of skipjack tuna have since been tagged
through the Regional Tuna Tagging Programme (RTTP; 1991–1996), which operated in waters
between the Philippines east to Fiji, including off the east coast of Australia, and the Pacific Tuna
Tagging Programme (PTTP; 2006–present), operating in waters 10°N–10°S; 120°E–130°W
(Hampton and Gunn 1998; Leroy et al. 2015). Combined, these three programmes have tagged
over 469,000 individual skipjack tuna to date, with over 65,000 recoveries reported to June 2018,
including almost 47,000 recoveries of skipjack tagged in the PTTP alone (Leroy et al. 2015; SPC-
OFP 2018b). Within the WCPO, these programmes have been complemented by a number of
national-level tagging activities (Leroy et al. 2015). In the EPO, tagging operations have been
conducted by the IATTC since the 1950s, with around 130,000 skipjack tagged to 2015, with
1,426 recoveries included in analyses of movement by Fonteneau and Hallier (2015).
Results from these programmes demonstrate that the movement dynamics of skipjack tuna are
both spatially and temporally complex. In the WCPO, individual skipjack tuna have been shown
to be capable of extensive movement, with several displacements well in excess of 1,000 nm
from original tagging locations (Matsumoto et al. 1984). Seasonal migrations have also been
inferred from conventional tagging programs. For example, fish from the western-central Pacific
have been hypothesised to follow two migratory routes to feeding grounds near Japan, one from
Hawaii through the Midway Islands, and a second from the Mariana-Bonin-Izu archipelagos. Both
groups are then considered to return to tropical waters with the Kuroshio Current Extension in
late autumn (Fujino 1996). In the western South Pacific Ocean, skipjack migrate south along the
Australian coast during the austral summer, reaching as far as Tasmania before migrating back
into tropical waters across the late autumn and winter.
The majority of recaptures of skipjack tuna tagged in the WCPO, however, suggest that long-
distance movements are, however, uncommon, with 95% of fish tagged in the SSAP, for
example, being recaptured within 1,000 nm of their original release point (Figure 4) (Hilborn and
Sibert 1988). Sibert and Hampton (2003) estimated skipjack tuna tagged during the SSAP and
RTTP to have a median lifetime displacement ranging from 420–470 nm. Displacements of
skipjack tuna have been found to have a positive relationship with fish size (SPC-OFP 2015).
Modelling of the movement dynamics of skipjack tuna suggests comparatively low rates of
movement for tagged fish in the region surrounding the Solomon Islands archipelago (Kleiber
and Hampton 1994; SPC-OFP 2017). Notwithstanding issues surrounding time-at-liberty, the
distribution of tag release and the distribution and variability of fishing effort, observations from
these programmes suggest the potential for some degree of regional fidelity in skipjack tuna.
Tagging data from the EPO suggest a similar mix of seasonally cyclical movement, large-scale
displacements, and regional fidelity (Fink and Bayliff 1970; Bayliff 1984; Bayliff 1988b). On the
basis of tagging data, Fink and Bayliff (1970) concluded that there appear to be two main
‘groups’ of skipjack in the EPO: a northern group, occurring around Baja California, the Gulf of
California, and the Revillagigedo Islands off the coast of Mexico, and a southern group, occurring
from Central America (~Panama) south to northern Chile, with some exchange between groups.
The origins of the two groups are largely undefined, with some authors (e.g. Rothschild 1965)
hypothesising that they both originate from spawning in the central equatorial Pacific Ocean east
of 130°W. However, significant spawning is known to occur in waters of the EPO > 24°C, and
fish in spawning condition have been reported off the coasts of Panama and Ecuador (Schaefer
16
2001a; Schaefer and Fuller 2018), suggesting that at least some proportion of fish in both groups
may result from local spawning.
In general, fish in the northern group undertake a northern and then southern movement
between 20°N and 30°N coincident with the seasonal movement of the 20°C surface water
isotherm (Fink and Bayliff 1970). The movements of the southern group appear to be more
complex than those of the northern group, although are considered to be poorly delineated by
conventional tagging data (Fink and Bayliff 1970). Young fish that appear in the Panama Bight
appear to migrate either northward or southward along the coast, before returning to equatorial
waters as adults to spawn (Schaefer 2001a). Movements of skipjack tuna tagged in the EPO into
the WCPO have also been documented, although the proportion of fish observed to undertake
such displacements is low (Bayliff 1988b), with only 27 fish of the near 130,000 tagged in the
EPO having been recaptured in the WCPO, with 21 of these recaptured around Hawaii (Bayliff
1988b).
Several other features of the life history of skipjack suggest potential spatial structuring of
skipjack tuna populations across the Pacific Ocean. Differences in morphometrics and growth
rates of skipjack tuna between the EPO and WCPO have been reported (Hennemuth 1959;
Sibert et al. 1983; Bayliff 1988b), suggesting some variability in the biology of individuals derived
from the two areas. Ianelli (1993) observed differing patterns of recruitment between skipjack
tuna in EPO and in the waters around Hawaii, suggesting fish from this latter region had
originated under different spawning conditions than those from the EPO. Differences in growth
rates of larval and juvenile skipjack tuna collected from the Western Pacific Warm Pool and the
North Pacific Tropical Gyre have been observed, suggesting these fish had grown under differing
environmental conditions (Ashida et al. 2018).
To date, studies of parasites of skipjack tuna have found no evidence of more than one
parasitological stock of skipjack in the Pacific, although investigations have been limited to one
study (Lester et al. 1985).
Few studies have been conducted on the otolith chemistry of skipjack tuna. An investigation into
the ontogenetic patterns in otolith Sr:Ca ratios of skipjack tuna (32.2–58.2 cm fork length (FL))
collected from the tropical western Pacific (Marshall Islands and Palau) and off the coast of
Japan reported results consistent with a mix of individual movement behaviours (Arai et al.
2005). Most skipjack sampled from the Marshall Islands had a constant otolith Sr:Ca ratio,
suggesting continuous residence in tropical waters after hatching (Arai et al. 2005). One
individual was found to have a transition point in its otolith Sr:Ca ratio profile, which was
suggested to have resulted from this fish moving to a temperate region after hatching, and then
returning to a tropical region before capture. Most of the fish from Japan were found to have
transition points in their otolith Sr:Ca ratio profiles, suggesting migration northward from the
tropics to temperate waters (Arai et al. 2005), consistent with what is known from tagging data
(Aoki et al. 2017).
Based on tagging, size and CPUE data, the most recent stock assessment for skipjack tuna
predicts that populations in the assessment regions north of 20°N (east coast of Japan and the
North Pacific; Region 1) and west of 140°W (Indonesia and the Philippines; Region 4) result
largely from self-recruitment, while there is considerable exchange between the regions east of
140°W framing the equator (Figure 4; McKechnie et al. 2016). Of note, the lack of north-south
mixing predicted could be due to low tag reporting rates in the North Pacific from tropical release
sites, which would lower the number of recorded tag recoveries in that region.
17
The mean optimal spawning temperatures as modelled by SEAPODYM are estimated at 28.5–
29°C (Senina et al. 2016). These results generally match observations that skipjack spawn near
continuously in the Western Pacific Warm Pool, where such temperatures are most consistent
(e.g. Nishikawa et al. 1985). Seasonably favourable areas are estimated in the EPO by
SEAPODYM as occurring during April-June, partially matching observations of spawning in the
region (Schaefer and Orange 1956), the central equatorial Pacific in May-August, the north-west
East China Sea in August-October, and occasional seasonality of high and low larval densities in
the Bismarck Sea during May-November, and December-February, respectively.
Diffusive, non-directional movement is estimated to be high in young and adult skipjack by
SEAPODYM, and is near invariant across habitat quality index values. This high degree of
mixing by these age groups predicted under the SEAPODYM movement model was further
quantified using Ikamoana (Scutt Phillips et al. 2018). In particular, the Western Pacific Warm
Pool region appears to be an area of high transitivity for immature fish. Ikamoana demonstrated
that quarterly transfer rates between the Solomon and Bismarck Sea area to the oceanic
Western Pacific Warm Pool were potentially greater than 10% in both directions, with a transfer
of up to 42% from the former to the under an examined La Niña time period (Scutt Phillips et al.
2018). Simulated transfer of fish between the Western Pacific Warm Pool and central equatorial
Pacific under non-El Niño conditions was also high. Exchange between the EPO and the WCPO
convention area appeared to be relatively low, dominated by a quarterly influx of between 5% to
15% of this outside biomass migrating into the central equatorial region (Scutt Phillips et al.
2018).
18
Figure 4. Top left: The geographic area and regional structure for stock assessments of skipjack tuna in the WCPO (numbered areas) and EPO (line shaded area); bottom left: movements of tagged skipjack tuna tagged during the RTTP (red arrows) and PTTP (blue arrows) recaptured > 1,000 nm from their release point; top right: proportional distribution of total biomass (by weight) in each WCPO assessment region apportioned by the source regions; bottom right: distribution of observed tag displacements for skipjack tuna at liberty for > 3 months from RTTP and PTTP data. All tagging data shown is based on SPC holdings.
19
Yellowfin tuna
Yellowfin tuna are broadly distributed across the Pacific Ocean, inhabiting tropical to temperate
waters from approximately 30°N to 30°S, extending to 40° in both hemispheres seasonally (Sund
1981).The location and timing of spawning of yellowfin tuna in the Pacific have been inferred
from patterns of larval distribution and histological examination of gonad condition, which suggest
that spawning occurs year-round in tropical waters, and seasonally at higher latitudes when
surface water temperatures are generally above 24°C (Nishikawa et al. 1985; Schaefer 1998;
Itano 2000). The greatest proportion of spawning occurs in waters between 26°C and 30°C
(Schaefer 1998). A number of key spawning areas have been identified, including the Banda Sea
in Indonesia, the northern Coral Sea, waters to the east and south of the Philippines, northeast of
the Solomon Islands, and waters around Fiji (McPherson 1988, 1991; Gunn et al. 2002;
Servidad-Bacordo et al. 2012). On the basis of gonad maturity and larval distribution data, Suzuki
et al. (1978) identified three ‘relatively discrete areas of intensive spawning activity along the
equatorial zone’ – corresponding to the western Pacific (with spawning peaking in the third and
fourth quarters of the year), central Pacific (with spawning peaking in the second and third
quarters) and eastern Pacific (with spawning peaking in the first and second quarters). Juvenile
and sub-adult yellowfin tuna show a strong schooling tendency, which becomes less pronounced
with age. Mean length at 50% maturity of females is estimated to be ~108 cm in the WCPO, and
around 92 cm in the EPO. Yellowfin tuna are relatively fast growing, reaching a maximum fork
length (FL) of about 180 cm, and can live for at least 7 years (Lehodey and Leroy 1999).
Current stock assessments for yellowfin tuna are conducted in the WCPO and EPO separately
and assume a single stock in each region. The most recent assessment for the WCPO
(Tremblay-Boyer et al. 2017) incorporated a 9-region structure across the area 50°N–40°S
(Figure 5). Spatial structuring of the assessment was informed by the nature of the operating
fleets (longline vessels targeting larger individuals and operating primarily in temperate waters;
purse-seine vessels catching smaller individuals and operating almost exclusively in equatorial
waters), and tag mixing assumptions in the Coral Sea area, with additional spatial areas
introduced along the longitudinal axes. Assessment models used in the EPO do not incorporate
any spatial component explicitly but adopt a ‘fleets-as-areas’ approach, which includes the area
of operation on the definition of fisheries that can have different selectivity curves and
catchabilities (Minte-Vera et al. 2018).
Molecular studies
A number of studies have examined the genetic structure of yellowfin tuna in the Pacific Ocean.
Using allozymes, Barrett and Tsuyuki (1967) did not identify any heterogeneity among yellowfin
tuna in the EPO, while Fujino and Kang (1968) did not observe any significant heterogeneity
among samples collected from the EPO, Hawaii and Line Islands. At a broader spatial scale,
significant genetic differentiation between the WCPO and EPO at the Glucose Phosphate
Isomerase (GPI) locus was detected by Sharp (1978), with these results supported by Ward et
al. (1994). Scoles and Graves (1993) found no differences in restriction fragment length
polymorphism (RFLP) mtDNA markers between yellowfin tuna from five locations in the Pacific
Ocean (Australia, Papua New Guinea, Hawaii, Mexico and Ecuador), or between the Pacific
Ocean locations and the Atlantic Ocean. On the basis of allozyme and RFLP mtDNA markers,
Ward et al. (1997) proposed the existence of two distinct genetic populations in the Pacific
Ocean: the WCPO and eastern region. In several studies (Appleyard et al. 2001; Nomura et al.
2014) the use of microsatellite markers, as for most of the earlier allozyme and mtDNA studies,
did not provide any clear evidence of population heterogeneity in the Pacific Ocean. At a much
smaller spatial scale, Diaz-Jaimes and Uribe-Alcocer (2003) did not detect any significant genetic
20
differentiation in allozymes and Random Amplification of Polymorphic DNA (RAPD) markers
among yellowfin tuna around the Clipperton and Revillagigedo Islands and Baja California.
Recently, several studies have found evidence to support the hypothesis of several distinct
populations of yellowfin tuna within the Pacific. Using a larger number microsatellite markers
from samples taken around the same area as Diaz-Jaimes and Uribe-Alcocer (2003), Diaz-
Jaimes and Uribe-Alcocer (2006) identified two discrete populations of yellowfin tuna separated
by the equator, which according to the authors may have resulted from non-random sampling.
Examination of mtDNA cytochrome c oxidase subunit (COI) provided evidence for the possible
existence of sub-populations within the central Pacific Ocean (CPO) (Li et al. 2015), while
examination of microsatellite markers revealed population structuring in yellowfin tuna between
the Philippines and Bismarck Sea, Papua New Guinea (Aguila et al. 2015). Using SNPs, Grewe
et al. (2015) observed heterogeneous population structure between samples from Baja California
(eastern Pacific), Tokelau (central Pacific) and the Coral Sea (western Pacific), while Pecoraro et
al. (2018) identified significant genetic variation between yellowfin tuna from the EPO (Mexico)
and WCPO (around the Bismarck Sea and northeast of Solomon Islands).
Non-molecular studies
Large numbers of yellowfin tuna have been tagged in the WCPO using conventional tags through
the SSAP, RTTP and PTTP, and other local or regional initiatives. As with skipjack tuna,
analyses of tag recoveries suggest that while individual yellowfin tuna are capable of extensive
movements, the majority of recaptures have been made close to release sites, suggesting limited
movement and a degree of regional fidelity (Figure 5) (Itano and Williams 1992; Hampton and
Gunn 1998; Sibert and Hampton 2003; Fonteneau and Hallier 2015). For example, in their
analysis of conventional tagging returns from activities of the RTTP in the north-west Coral Sea,
Hampton and Gunn (1998) observed recaptures as far away as Fiji, Japan, Micronesia, Papua
New Guinea and Solomon Islands, suggesting individuals have the potential to mix across their
range. The majority of recaptures however, were in the release area or adjacent Coral Sea
(Hampton and Gunn 1998). Of the tags recovered from yellowfin tuna tagged during the RTTP,
most (~90%) have been within 1,000 nm of the point of release (SPC unpublished data, cited in
Hampton and Gunn 1998). Sibert and Hampton (2003) estimated yellowfin tuna tagged in the
WCPO during the SSAP and RTTP to have a median lifetime displacement ranging from
approximately 337–380 nm. Yellowfin tuna tagged around fish aggregating devices (FADs) and
in particular FADs and seamounts within the Hawaiian archipelago have been observed to
demonstrate high fidelity to these devices and features (Itano and Holland 2000).
While the majority of tags released on yellowfin tuna in the Pacific have been conventional tags,
acoustic and archival tags have also been deployed in yellowfin tuna across the western Pacific,
and archival tags also deployed in the CPO as part of the PTTP (SPC-OFP 2018b). Preliminary
analyses of archival tag data support that of conventional tag programs with some individuals
clearly capable of undertaking large scale movements, but for the majority, movement is limited
(Leroy et al. 2014; Leroy et al. 2015). Archival tag returns suggest a negative relationship
between dispersal distance and size of fish and a positive relationship with time at liberty (SPC-
OFP 2015). Similar to skipjack tuna, modelling of the movement dynamics of yellowfin tuna
suggests comparatively low rates of movement for tagged fish in the region surrounding the
Solomon Islands main archipelago group (SPC-OFP 2017).
The majority of tagging in the WCPO has focused on juvenile and sub-adult yellowfin tuna, with
few adults tagged. The only detailed investigation of movement of adult yellowfin tuna in the
WCPO to date is that of Evans et al. (2011), who examined data from 20 pop-up satellite archival
tags (PSATs) deployed on yellowfin tuna ranging 135–158 cm FL in the northern Tasman Sea /
21
southern Coral Sea. Similar to the results from tagging programmes on juveniles, adult yellowfin
showed a limited range of movements (estimated displacements of 54–1,463 km) with all tagged
fish remaining within the Coral and Tasman Seas. However, as noted by Evans et al. (2011), the
findings were somewhat limited by the short attachment duration of tags (2–168 days).
Results from conventional tagging studies on yellowfin tuna in the EPO suggest movements of
tagged fish at liberty for more than 30 days tend to be restricted to less than 1,000 nm of their
original release positions, with little exchange of fish between northern and southern regions
(Fink and Bayliff 1970; Bayliff 1979, 1984). Similarly, data from archival tags indicate that 95% of
individuals tagged remained within 1,358 km of their release points, with little movement from the
northern to the southern regions of the EPO (Schaefer et al. 2011; Schaefer et al. 2014), with
Schaefer (2008) concluding yellowfin tuna in these regions probably represent spatially-
segregated sub-stocks.
Spatial variation in life history and morphometrics has been observed for yellowfin tuna in the
Pacific, suggesting potential structuring within the region. For example, length at 50% (L50)
maturity for female yellowfin tuna has been shown to differ between fish in the WCPO and EPO,
ranging from 96.5–99.5 cm FL for females in Indonesia and Philippines, 107.9–120.0 FL for
females in the Coral Sea, 98.1–112.5 cm FL for females from the WCPO and 79.1–98.1 cm FL
for females in the EPO (Schaefer 1998; Itano 2000). Regional differences in growth have also
been observed, with fish from Indonesia and the Philippines having slower growth rates than
those in the wider WCPO (Hoyle et al. 2009), suggesting a non-random distribution, although it is
unclear to what degree this variation results from methodological differences in the preparation
and interpretation of otoliths (Farley et al. 2018a). In the EPO, morphometric and meristic
analyses suggest significant differences between fish sampled north and south of 15°N. Schaefer
(1992) found that yellowfin caught around Manta (Ecuador) have deeper bodies, and have on
average one more gill-raker, than those sampled around the Revillagigedo Islands off the coast
of Mexico.
Moore et al. (in press) examined parasite fauna of juvenile yellowfin tuna collected from locations
within the Indonesian EEZ and two outlier locations - Maldives in the Indian Ocean and Solomon
Islands in the western Pacific. Their results suggest little mixing of fish between Indonesia waters
and the two outlier locations. Within the Indonesian EEZ, parasite data, and particularly
abundances and prevalences of didymozoid species, suggested little movement from the
western Pacific into the Indonesian archipelago or from the Indonesia archipelago to the eastern
Indian Ocean.
Several studies have used otolith chemistry to determine the relationships between the chemical
markers in natal regions of otoliths (assumed to represent spawning regions) from differing areas
to determine nursery origins of yellowfin tuna in the Pacific. Gunn et al. (2002) examined otolith
microchemistry to investigate the probable origins of yellowfin tuna caught off the east coast of
Australia. Otoliths of the majority of fish caught in the Tasman Sea most closely resembled those
originating from the Coral Sea than any other sampling site. Combined with broader
understanding of biology, fisheries data, oceanography and tagging, the results suggest that in
some years at least, yellowfin tuna caught in the Tasman Sea derive predominantly from the
Coral Sea, with lower numbers originating from the broader western Pacific (Gunn et al. 2002).
Wells et al. (2012) used stable isotopes in otoliths as natural tracers to predict the nursery origin
of yellowfin tuna around the Hawaiian Islands. They examined δ13C and δ18O in otolith cores of
juveniles (within their first two months of age) collected from nursery areas throughout the WCPO
in 2008–2009, including Hawaii, the Line Islands of Kiribati, Marshall Islands, Solomon Islands
22
and the Philippines, and of sub-adults (age-1) collected from Hawaii in 2009 and 2010, to
investigate nursery-specific contribution rates. Mixed-stock analysis revealed that the majority of
sub-adults in the Hawaiian fishery had core chemistries suggestive of originating from nursery
areas within Hawaii, while < 10% had core chemistries that indicated they had originated from
equatorial nurseries outside of Hawaii (Wells et al. 2012).
Using trace elements in addition to stable isotopes, the same otoliths examined by Wells et al.
(2012) were reanalysed along with additional samples from 1–2 year-old fish caught in the
Marshall Islands by Rooker et al. (2016). Results suggested that fish caught in Marshall Islands
waters were almost entirely derived from local production, with only a minor contribution of
recruits from the central equatorial Pacific, and that all yellowfin tuna from Hawaii were deemed
to have originated locally (Rooker et al. 2016).
Houssard et al. (2017) examined stable isotope ratios of nitrogen to assess the trophic position of
yellowfin tuna in the WCPO. Strong spatial trends were evident in muscle δ15N values,
suggesting restricted movement of individuals and high regional residency, at least over the
scale of their muscle nitrogen turnover rate (i.e. half-life = 167 days).
The latest stock assessment estimated that yellowfin tuna in the two northernmost assessment
regions (north of 20°N) and those from the westernmost assessment region (around Indonesia
and the Philippines) result largely from self-recruitment, (Figure 5). The two southernmost
regions (south of 10°S) were also estimated to result largely from self-recruitment but also had
some exchange of biomass with the neighbouring equatorial regions (Figure 5; Tremblay-Boyer
et al. 2017). In contrast, the remaining tropical regions were estimated to have half to two-thirds
of their biomass initially recruited in other regions along the equatorial axis. The same caveats
applied to recruitment of skipjack tuna from the assessment model also apply to yellowfin tuna,
with potentially low tag reporting rates from tropical tagging programs in the North Pacific, as well
as fewer tagging data available outside of the equator to inform movement between temperate
regions (Tremblay-Boyer et al. 2017).
Simulation studies using SEAPODYM indicate a distribution of yellowfin larvae that is strongly
contrasted between the two sides of the Pacific Ocean. Large areas of high larval density are
estimated in the Western Pacific Warm Pool around the Solomon Islands and Papua New
Guinea during the beginning of the third quarter, and within the East China Sea during August-
September, with smaller high density areas in the EPO around the Peru and Costa Rica, peaking
in March-April (Senina et al. 2015; Lehodey et al. 2017). Assessments of connectivity of yellowfin
tuna across the WCPO using SEAPODYM suggest, in the absence of fishing, a near-even
exchange of biomass between Papua New Guinea and Indonesia, with recruits moving east but
not west. Papua New Guinea was also identified as a key source of recruits for the WCPO,
evidenced by a 23.6% reduction in adult biomass in the WCPO when recruitment from Papua
New Guinea was removed (Senina et al. 2015).
23
Figure 5. Top left: The geographic area and regional structure for stock assessments of yellowfin tuna in the WCPO (numbered areas) and EPO (line shaded area); bottom left: movements of tagged yellowfin tuna tagged during the RTTP (red arrows) and PTTP (blue arrows) recaptured > 1,000 nm from their release point; top right: proportional distribution of total biomass (by weight) in each WCPO assessment region apportioned by the source regions; bottom right: distribution of observed tag displacements for yellowfin tuna at liberty for > 3 months from RTTP and PTTP data. All tagging data shown is based on SPC holdings.
24
Bigeye tuna
Bigeye tuna are broadly distributed across the Pacific Ocean, inhabiting tropical to temperate
waters from approximately 45°N to 40°S in the western Pacific, and from approximately 40°N to
30°S in the eastern Pacific (Calkins 1980). On the basis of gonad condition of mature fish and
observed distributions of larvae, spawning of bigeye tuna is considered to occur year-round in
tropical equatorial waters of the Pacific Ocean and seasonally in subtropical waters when water
temperatures exceed 24°C (Schaefer 2001a; Schaefer et al. 2005). Farley et al. (2018) observed
spawning capable females (only) between 12°N and 12°N and between 137°E and 130°W, in
water temperatures between 27.7°C and 30.3°C, suggesting central equatorial waters may be an
area spawning region for bigeye tuna. Nishikawa et al. (1985) suggest the region between Japan
and the Philippines is particularly important spawning area for bigeye in the western Pacific
Ocean, with spawning occurring in that region during spring and early summer. Spawning
aggregations have also been reported in the Coral Sea (McPherson 1988; Farley et al. 2003). As
with yellowfin tuna, juvenile and sub-adult bigeye tuna show a strong schooling tendency which
becomes less pronounced with age. Mean length at 50% maturity of females has been estimated
to be ~118 cm in the CPO and EPO. Bigeye tuna are considered to be slower growing than
yellowfin tuna, reaching a maximum age of around 16 years (Farley et al. 2006), and a maximum
FL of 180 cm in the WCPO (Farley et al. 2018b) and 200 cm in the EPO (Aires-da-Silva et al.
2015).
Current stock assessments for bigeye tuna are conducted in the WCPO and EPO separately and
assume single stock within each of those areas. Similar to yellowfin tuna, stock assessments for
bigeye tuna in the WCPO incorporate a 9-region structure across the region 40°S–50°N (Figure
6). This spatial structuring is informed by the nature of the operating fleets (longline vessels
targeting larger individuals and operating primarily in more temperate waters; purse-seine
vessels catching smaller individuals and operating almost exclusively in equatorial waters) and
tag mixing assumptions in the Coral Sea area, with additional splits along the longitudinal axes
(McKechnie et al. 2017a). Introducing shifts to the regional structure (e.g. shifting the northern
edge of the equatorial region from 20°N to 10°N) has been found to produce varying outcomes
(McKechnie et al. 2017b; Vincent et al. 2018), suggesting the assessment is sensitive to the
configuration of regional structure. The EPO assessments for bigeye tuna do not include a sub-
regional population structure explicitly, but similarly to yellowfin tuna adopt a ‘fleets-as-areas’
approach, which includes the area of operation on the definition of fisheries that can have
different selectivity curves and catchabilities (Xu et al. 2018).
A Pacific-wide assessment for bigeye tuna encompassing both the WCPO and the EPO was
conducted in 2015 and included sub-regional splits that matched the WCPO and the EPO
assessments at the time. This assessment assumed ‘EPO-style growth patterns across the
Pacific. The resulting predictions of stock status aggregated over the sub-regions within each
RFMO convention area were in agreement with the assessments conducted in each of the
regions, so it was concluded that it was appropriate to proceed with separate assessments in the
WCPO and the EPO (McKechnie et al. 2015).
Molecular studies
To date, molecular studies based in allozymes, mtDNA and microsatellites have generally found
little evidence of structuring in bigeye tuna in the Pacific Ocean, suggesting broad scale panmixia
among bigeye tuna in the region (Fujino and Kang 1968; Bremer et al. 1998; Chow et al. 2000;
Wu et al. 2014). However, Grewe and Hampton (1998) found some evidence of restricted gene
flow between Philippines and Ecuador, their two most widely separated sampling areas. Further
25
differentiation, however, was limited by small sample sizes, and Grewe and Hampton (1998)
recommended larger sample sizes and additional loci be examined to adequately determine the
population structure of bigeye tuna in the Pacific.
Non-molecular studies
Similar to yellowfin tuna, large numbers of bigeye tuna have been tagged under a number of
tagging programmes across the Pacific. The bulk of tagging studies, particularly in the WCPO,
have focused on juveniles and sub-adults, typically less than 70 cm FL (Leroy et al. 2015).
Recaptures of conventional tags on bigeye tuna across the WCPO have revealed a range of
movements, with some individuals dispersing large distances (e.g. two bigeye tuna were
recaptured over 2,500 nm from their release points in the CPO 2.5 and 3.5 years after release),
but the vast majority dispersing less than 1,000 nm from release points (Figure 6) (Miyabe 1994;
Hampton and Gunn 1998; Gunn et al. 2005). Conventionally-tagged fish released in the CPO
that were at liberty for > 30 days were predominantly recaptured within approximately 1,000 nm
of their original release point (although these percentages varied between release sites) with
most limited to 10° of latitude from the equator, suggesting constrained latitudinal dispersion
(Schaefer et al. 2015). Dispersal across all release sites was predominantly eastward in nature
and there was substantial mixing of bigeye tuna between release longitudes (140˚W, 150˚W,
170˚W and 180˚). Bigeye tuna tagged around fish aggregating devices and in particular FADs
and seamounts within the Hawaiian archipelago have been observed to demonstrate high fidelity
to these devices and features (Itano and Holland 2000).
Archival tagging studies conducted in the WCPO primarily on juveniles support the findings of
conventional tagging programmes, with a range of movements observed. Bigeye tuna tagged in
the Coral Sea demonstrated local residence, cyclical movements between the Coral Sea and
western Pacific Ocean, and potentially broad-scale longitudinal dispersal eastwards into the
wider WCPO (Gunn et al. 2005; Evans et al. 2008). Bigeye tuna tagged in the Bismarck and
Solomon Seas similarly have demonstrated limited movements (Leroy et al. 2014; Abascal et al.
2018). Across the CPO, depending on the release location, tagged bigeye tuna demonstrated
varying degrees of regional fidelity. Bigeye tuna tagged at 155°W demonstrated fairly strong
regional fidelity to release location, while those released at 140°W and 170°W demonstrated less
regional fidelity, but more eastward movements (Schaefer et al. 2015). Most of the fish tagged
were juveniles.
Similar to the WCPO, regional fidelity and limited latitudinal movement has been observed in
bigeye tuna tagged in the equatorial EPO at 95°W (Schaefer and Fuller 2009), while those
released at 140°W showed marked eastward movement (Schaefer et al. 2015). Bigeye tuna at
liberty for > 30 days were predominantly recaptured within approximately 1,000 nm of their
original release point with limited latitudinal displacement (Schaefer and Fuller 2009). Dispersal
was predominantly westward in nature and the distance dispersed appeared to be positively
related to fish size and time at liberty (Schaefer and Fuller 2009). Archival tag data retrieved from
bigeye tuna tagged in the EPO also indicated strong regional fidelity, with restricted westward
movements (Schaefer and Fuller 2009). Of note, of the 96 bigeye tuna tagged in the EPO with
archival tags that were analysed by Schaefer and Fuller (2010), one individual at liberty for 4.1
years undertook two very similar cyclical movements during its third and fourth years at liberty,
moving into the CPO between ~150°W and ~160°W in November-December, before returning to
~84°W in early May in each year. potentially indicating spawning area fidelity. As with the WCPO
studies, most of the fish were juveniles when initially tagged.
On the basis of archival tagging data from the three regions, Schaefer et al. (2015) proposed that
bigeye tuna demonstrated three types of movement behaviours: (1) fish that are residents within
26
an area (<1,000 nm of release location), (2) fish that are residents, yet undertake cyclical
excursions outside the area of residency, and (3) fish that are nomadic and do not demonstrate
type 1 or type 2 movement patterns. They further proposed, on the degree of mixing observed in
association with these behaviours, three putative stocks of bigeye tuna in the equatorial Pacific
Ocean – eastern, central, and western stocks – with stock boundaries at about 120°W and 180°,
and constrained between 10°N and 10°S. On the basis on constrained latitudinal movement
evident in each region, they suggested that six additional stocks should be considered; three
northward and three southward of the equatorial stocks.
Recent analyses of a large collection of bigeye tuna otoliths across the WCPO and EPO have
resulted in a revised growth curve for the species (Farley et al. 2018b). Spatial analysis of length-
at-age data from these otoliths suggest significant differences in the growth rates of bigeye tuna
across the Pacific, with greater length-at-age in the far eastern and far western Pacific, compared
to central longitudes (Farley et al. 2017; Farley et al. 2018b). Examination of spatial patterns in
otolith weight-at-length data revealed very similar spatial patterns (Farley et al. 2018b). There is
ongoing work to clarify whether this growth difference between the two regions is a result of
separate populations or due to methodological differences in the preparation and interpretation of
otoliths (Farley et al. 2018b). Farley et al. (2017) identified four broad areas in the WCPO with
differing growth profiles, corresponding roughly to areas i) west of ~140°E (encompassing
Indonesia and Philippines, ii) east of ~140°E to ~150°W and north to ~5°N, iii) north of 5°N, and
iv) east of ~150°W (encompassing French Polynesia samples).
Moore et al. (in press) examined parasite fauna of bigeye tuna collected from locations within the
Indonesian EEZ and two outlier locations - Maldives and Solomon Islands. Consistent with their
results for yellowfin tuna, parasites suggested little mixing of bigeye tuna between Indonesia
waters and the two outlier locations. Within the Indonesian EEZ, the parasite data again
suggested little movement from the western Pacific into the Indonesian archipelago or from the
Indonesia archipelago to the eastern Indian Ocean.
Studies of the otolith chemistry of bigeye tuna in the Pacific have been limited. Comparisons of
stable isotopes (δ13C and δ18O) and chemical signatures of the natal regions of otoliths from
young of the year collected from four regions throughout the WCPO revealed spatial variability,
particularly in the depletion of δ18O (Rooker et al. 2016). When compared with the stable isotope
and chemical signatures of natal regions of otoliths from 1–2 year-old bigeye tuna from the
Marshall Islands and Hawaii, Rooker et al. (2016) concluded that bigeye tuna from the Marshall
Islands were almost entirely derived from local production, with a minor contribution of recruits
from the central equatorial Pacific. In contrast, a large fraction of bigeye tuna from Hawaii were
deemed to have originated from the central equatorial region (Rooker et al. 2016), contrasting
with the results from tagging studies that suggested limited dispersal of bigeye tuna from
Hawaiian waters (Itano and Holland 2000) and constrained latitudinal dispersion of bigeye tuna
within equatorial waters (Schaefer et al. 2015).
Examination of muscle chemistry also suggests some structuring in bigeye tuna in the Pacific.
Similar to their findings for yellowfin tuna, Houssard et al. (2017) observed strong spatial trends
in muscle δ15N values for bigeye tuna sampled across the WCPO, suggesting restricted
movement of individuals and a degree of regional residency regional residency, at least over the
scale of their muscle nitrogen turnover rate (i.e. half-life = 167 days).
For the WCPO, the most recent stock assessment estimates some north-south exchange
between equatorial regions and the North Pacific, as well as a movement of recruits from west to
east in the North Pacific (Figure 6). The same general trend as with the other tropical tuna
27
species is otherwise predicted, i.e. mixing throughout the equatorial regions but higher retention
of recruits in the westernmost tropical region. Bigeye tuna in the southernmost assessment
regions were estimated to result mostly from self-recruitment self-recruited, with a small
proportion of recruits predicted to move west to east (Figure 6; McKechnie et al. 2017a).
Recent outputs from SEAPODYM estimate an optimum mean spawning temperature of 26.8°C
for bigeye tuna, resulting in peak larval distributions between 26° to 28°C (Lehodey et al. 2017).
Model simulations estimate a large spawning area in the central equatorial region, with juvenile
bigeye tuna concentrated mainly in the wider tropical central Pacific, and adults extending from
this zone into more temperate latitudes following the Kuroshio extension to the north and Eastern
Australian Current to the south. Bigeye tuna movement parameters appear to have varied
considerably across parameter optimisations (e.g. Lehodey et al. 2017; Senina et al. 2018),
suggesting very low to moderate diffusion in response to habitat quality, potentially affecting
mixing.
28
Figure 6. Top left: The geographic area and regional structure for stock assessments of bigeye tuna in the WCPO (numbered areas) and EPO (line shaded area); bottom left: movements of tagged bigeye tuna tagged during the RTTP (red arrows) and PTTP (blue arrows) recaptured > 1,000 nm from their release point; top right: proportional distribution of total biomass (by weight) in each WCPO assessment region apportioned by the source regions; bottom right: distribution of observed tag displacements for bigeye tuna at liberty for > 3 months from RTTP and PTTP data. All tagging data shown is based on SPC holdings.
29
South Pacific albacore tuna
Albacore tuna are widely distributed in the Pacific Ocean between approximately 50°N and 40°S,
although fisheries catch and tagging data suggest limited occurrence in equatorial waters
between 5°N and 5°S (Lewis 1990; Williams et al. 2012; Nikolic et al. 2017). Historically, two
stocks have been recognised in the Pacific, located in the North Pacific Ocean and the South
Pacific Ocean. However, several recent studies report apparent genetic homogeneity in fish
caught in the northern and southern hemispheres, casting some doubt on separation of stocks in
the two areas (e.g. Montes et al. 2012; Albaina et al. 2013).
In contrast to tropical tunas, South Pacific albacore tuna have a relatively discrete spawning
season, with spawning occuring in tropical and sub-tropical waters between 10°S and 25°S
between September and May, with a peak between October and December (Ramon and Bailey
1996; Farley et al. 2013). Females in spawning condition have been observed over a broad area
of longitude. Juveniles (45–50 cm FL) are thought to move south from their spawning grounds
into the surface waters around New Zealand and in the vicinity of the subtropical convergence
zone in the central Pacific, where they are caught by longline and troll-fisheries when they are
around one year old. As they age, South Pacific albacore tuna gradually disperse into lower
latitudes being distributed throughout waters north of 30°S as adults (Tremblay-Boyer et al.
2018). Longline catch data indicates that adult South Pacific albacore tuna migrate seasonally
between tropical and subtropical waters, moving south during early summer, and north during
winter (Langley 2004; Langley and Hampton 2005), coincident with the seasonal shift in the 20–
28°C sea surface temperature isotherm (Langley 2006). Latitudinal variability in maturity at age
and fatty acid trophic markers support assumptions derived from fisheries catches on latitudinal
separation of age groups (Farley et al. 2014; Parrish et al. 2015). Mean length at 50% maturity of
females has been estimated to be ~87 cm in the WCPO, when fish are around 4.5. years of age.
Albacore tuna in the South Pacific can live for at least 14 years, and reach a maximum FL of 103
cm (Williams et al. 2012).
While South Pacific-wide assessments were performed historically, the most recent stock
assessments for South Pacific albacore tuna assume a single discrete stock west of 130°W and
from 50°S to the equator between 140°E and 150°W, and from 50°S to 5°S between 150°W and
130°W (Figure 7; Tremblay-Boyer et al. 2018). The eastern Pacific component of the stock has
not been included in recent assessments, due to low catches and poor data quality, although
increasing catches in recent years have resulted in requests for a Pacific-wide assessment of the
species (Pilling and Brouwer 2018). Spatial structuring of the assessment model used in the
WCPO has varied through time with the structure informed by biological hypotheses of seasonal
movement, spatial structuring of the population by age, and patterns of fishing activity. The
distribution of recruitment in the assessment was constrained in the most recent assessment to
the two southernmost regions based on the distribution of newly-recruited fish in the catch,
precluding model predictions on the source of recruits to adult biomass.
Molecular studies
Few studies have used molecular approaches to examine the presence of population structuring
within South Pacific albacore tuna. Those studies that have been conducted have reported
evidence of genetic differentiation between the western Pacific Ocean (Australia) and EPO (Chile
and Peru; Takagi et al. 2001) and the western Pacific Ocean (between New Caledonia and
Vanuatu) and central Pacific Ocean (French Polynesia; Montes et al. 2012).
30
Non-molecular studies
Albacore tuna are considered more challenging to tag than other species of commercial tuna and
as a result, comparatively fewer conventional tags have been released on albacore tuna in the
Pacific Ocean in comparison to skipjack, bigeye and yellowfin tunas. Nevertheless, some tagging
of South Pacific albacore tuna has been undertaken by SPC’s Oceanic Fisheries Programme,
primarily to inform stock assessments for this species with respect to growth, movement, and
mortality. Although recapture rates have been low (1%), those that have been made support
connectivity between high and low latitudes and highlight the potential for individual fish to
undertake long-range dispersion, with some individuals being recaptured several thousands of
kilometres from their release sites (Figure 7) (Labelle and Hampton 2003; SPC-OFP 2017; SPC-
OFP 2018b). There have been few releases of electronic tags on albacore tuna, with only 19
pop-up satellite archival tags deployed on albacore tuna in New Caledonia, Tonga and New
Zealand waters (Williams et al. 2015). Although tag deployments of recaptured individuals were
limited in duration (< 50 days), displacements varied between release sites, with those fish
tagged in New Zealand waters displacing further than those tagged in New Caledonian and
Tongan waters (Williams et al. 2015).
Spatial variability in growth has been reported within South Pacific albacore tuna, with both
females and males reaching greater length-at-age at easterly longitudes than at westerly
longitudes (Williams et al. 2012). Longitudinal differences have also been observed in gonad
development, with mature albacore tuna in the east having heavier gonads in relation to their
length than those in the west (Farley et al. 2013). Together, these results suggest some
structuring at broad spatial scales within the WCPO.
Jones (1991) examined parasites of albacore tuna from locations in the south-western Pacific.
From the abundances of 10 species of didymozoid he concluded that juvenile albacore tuna
moved south from the tropics to New Zealand and then return north to spawn with the onset of
sexual maturity, a result that is consistent with tagging and fishery catch data. In addition, a
decline in prevalence and abundance of two other parasites, Anisakis simplex and Hepatoxylon
trichiuri between New Zealand and the central South Pacific and the presence of only dead H.
trichiuri in the central South Pacific led Jones (1991) to conclude that fish were moving
longitudinally along the subtropical convergence zone.
Studies of the otolith microchemistry of albacore tuna have been limited, with only one study
examining the chemical signatures of the natal region of otoliths from fish captured around New
Caledonia, New Zealand and French Polynesia (Macdonald et al. 2013). Albacore tuna caught
off New Caledonia and New Zealand were found to have similar chemical signatures, suggesting
they had originated from areas of similar water chemistry. In contrast, those from French
Polynesia were significantly different, suggesting they had originated from a separate larval
source (Macdonald et al. 2013). Although the locations of larval origins were not identified, these
results suggest the potential for some degree of spatial structuring of spawning populations of
albacore tuna within the South Pacific.
Simulations using SEAPODYM estimate an optimal spawning SST for South Pacific albacore
tuna of 28°C, with the northward spawning migration peaking in early May (Senina et al. 2018).
Optimal temperatures for foraging habitats for the species were estimated as ranging from 11.8–
23.5°C. Little evidence on connectivity and stock structure per se is available from SEAPODYM,
with the model predicting broad scale movement of albacore tuna corresponding with a seasonal
shift of the 23° to 28°C SST isotherm location (Senina et al. 2018).
31
Figure 7. Top left: The geographic area and regional structure for stock assessments for South Pacific albacore tuna in the WCPO (numbered areas); bottom left: movements of tagged albacore tuna tagged during the RTTP (red arrows) and PTTP (blue arrows); bottom right: distribution of observed tag displacements for albacore tuna at liberty for > 3 months from RTTP and PTTP data. All tagging data shown is based on SPC holdings. Note predictions of total biomass distributions are not available from the assessment model (see text).
32
Key uncertainties and future directions to understanding the stock structure of skipjack,
yellowfin, bigeye and South Pacific albacore tunas
Recent findings from research studies across the Pacific Ocean have increased our knowledge
of the spatial dynamics of the four main target tuna species. They suggest a complex stock
structure rather than panmixia, at least for yellowfin, bigeye and South Pacific albacore tunas.
However, to date no single study, or combination of studies, have clearly defined the stock
structure of any of the four species at scales relevant to regional management. Studies
conducted in the Pacific to date have typically been constrained by effects of scale (both spatial
and temporal), sampling design, limitations of the techniques, availability of samples or data, and
potentially the behaviour of the tuna species themselves. For example, while a large amount of
tagging data exists, particularly for skipjack tuna and yellowfin tuna, most tagging studies have
been focused on juvenile fish, and spatially limited, with releases largely conducted in areas of
high abundance and concentrated fishing effort. This is partly because these studies were not
designed solely to provide information on movement and mixing, but to assess a range of
parameters for use in stock assessments, including estimations of growth rates, natural and
fishing mortality, and abundance (Leroy et al. 2015). Furthermore, inferences of movement and
mixing are inherently biased by the point-to-point nature of resulting data, the number of
recaptures and the time at liberty of those individuals, the distribution of tagging and recapture
effort, varying tag reporting rates and uncertainties around the population representativeness of
tagged individuals (Ward and Caton 1992; Leroy et al. 2015). Historically, most genetic studies
have used markers that are extremely sensitive to the movement of individuals between
populations (Slatkin 1987), or that have low levels of genetic differentiation resulting from large
populations sizes, such as estimated for skipjack, yellowfin, bigeye and South Pacific albacore
tunas (Palumbi 2003; Ely et al. 2003). Some genetic studies have shown that genetically-distinct
assemblages may occur in the same area (e.g. skipjack tuna off the coast of Japan; Fujino
1990), potentially as small spatial units (Sharp 1978). Grouping such assemblages together in
location-based analyses may mask any differentiation. Elsewhere, studies have been limited by
sample sizes (e.g. Grewe and Hampton 1998), or by widely-separated sampling locations (e.g.
Grewe et al. 2015; Pecoraro et al. 2018).
As a consequence, several key uncertainties regarding the stock structure exist for each species,
outlined below. In the following section, we outline some specific questions designed to address
these uncertainties for each species, and outline potential sampling strategies that may help
answer them.
1. Fidelity to spawning areas. The degree of fidelity of individuals to spawning areas is still
largely unknown, and likely to vary between species. In instances where discrete
spawning areas have been identified (in particular for yellowfin tuna and bigeye tuna), it
is currently unknown whether individuals maintain a general close proximity to, or, for
apparently transient fish, return to, the same particular spawning area each year, and, if
they do, whether these movements represent fish returning to their natal spawning areas.
Most tagging studies in the Pacific have focused on juveniles and as a result,
understanding of adult movement, including the degree of spawning area fidelity, is
limited. Although some efforts have been made to examine movement of adults via
electronic tagging approaches (e.g. Schaefer et al. 2007; Evans et al. 2011; Schaefer et
al. 2011), current data are largely inadequate for assessing any potential spawning area
fidelity.
33
2. Natal origins, the degree of mixing of post-juvenile fish and proportional contributions of
each spawning unit to fishery catches. A key challenge for management of tuna fisheries
in the Pacific is an understanding of the proportion each potential spawning unit
contributes to harvested assemblages. This is particularly of relevance given that i)
fishery mortality is unevenly distributed across the Pacific, ii) there is the potential for
fisheries to exploit individuals from several spawning units more-or-less simultaneously,
iii) different spawning units likely have differing levels of productivity and iv) there is a
potential for local depletion. While some studies have tackled this issue across small
spatial scales (e.g. Gunn et al. 2002; Wells et al. 2012; Rooker et al. 2016), scaling this
work up to scales relevant for regional fisheries management has not yet been
undertaken.
3. The management implications of an improved understanding of tuna stock structure - i.e.
in the event that multiple stocks of each species are present, would management be
done differently? The spatial scale and structure of Pacific tuna assessments have been
defined on the basis of management boundaries, the nature of the fishing fleets
exploiting each stock, and settings required to achieve a robust model. While better
knowledge of stock structure can improve assessments, the need to develop
management systems that are robust to the uncertainties in our understanding of the
biology, stock structure and environmental drivers such as climate change is important.
The WCPFC is currently in the process of developing management procedures for the
main tuna species that will allow for pre-agreed decisions for management action to be
tested for robustness to plausible hypotheses of stock structure and connectivity, such as
those raised in this paper. The process can also examine the value of new information in
terms of its potential to improve decision making, thereby providing further support for
undertaking research activities. Prior to the commencement of a sampling program for
each of the four species, it would first be prudent to undertake simulations to determine
whether different stock structure hypotheses actually make a difference to the stock
assessment outputs and management of stocks before embarking on expensive
sampling activities and analyses.
4. Effects of climate change on overall stock structure and proportional contributions of
spawning units to fisheries. Recent modelling using SEAPODYM suggests that under
climate change alone, a change in the distribution of skipjack and yellowfin tuna is likely
to occur. This will result in increases in abundance in some areas and decreases in
abundance in others (Lehodey et al. 2013; Dueri et al. 2014; Senina et al. 2016; Bell et
al. 2018b). Understanding how these changes will affect processes mediating the
dynamics, and overall structure, of tropical tuna stocks, in the Pacific is a key challenge
to climate change and stock assessment modelling, and is contingent of obtaining a
better understanding of the uncertainties described above.
Overcoming uncertainties about the stock structure of Pacific tunas: suggestions for
future research
Careful sampling design is critical to any assessment of the spatial dynamics of broadly
distributed species. Here, we outline several key questions relating to better defining the stock
structure of the four tuna species and potential sampling design approaches and contingencies
that could be adopted to answer these questions, informed by expert input. We start by
addressing two considerations that have relevance across all of the proposed methodological
approaches to answer key questions.
34
Sample size considerations
Consideration of sample sizes is of critical importance in stock structure studies Inadequate
sample sizes may preclude the detection of differences where they occur (i.e a Type II error),
while excessive sample sizes may prevent additional sampling in different strata, locations or
periods due to budget limitations. For analysis of parasites and otolith chemistry, previous
studies have generally targeted around 50 fish per sample. For population genetics, larger
sample sizes are recommended (i.e. around 50–100 individuals per sample). Overall, it would be
more advantageous to over-sample and choose which fish to analyse than under-sample,
although sample sizes should ideally be determined via experiment-specific simulation and
power analyses3. Until these analyses are complete, we recommend a sample size of at least
100 fish per spatio-temporal stratum (i.e. fish from Location A in Sampling Period B).
Multidisciplinary approaches to determining stock structure
In general, a multidisciplinary approach, incorporating two or more complementary techniques, is
recommended as the most suitable approach for addressing questions regarding stock structure
and mixing of the four tuna species in the Pacific. The use of a multidisciplinary approach is
generally regarded as more effective in determining stock structure than any one technique
alone, because it not only gives greater confidence to the results of any one technique where
consistent results are obtained (i.e. a weight of evidence approach), but also allows for the
limitations of each technique to be resolved, effectively increasing the chances of identifying
differences between spatially-distinct populations (Begg and Waldman 1999). A key advantage
of using a multi-technique approach to identify stock structure is that each method is informative
about the fish’s life history at different spatial and temporal scales. For example, genetic
approaches have the potential to inform about rates of mixing of fish from different regions as
well as evolutionary patterns of gene flow, whereas parasites and otolith microchemistry are
directly influenced by the environment and so could inform on the patterns of movement during a
fish’s lifetime. The use of these complementary techniques in a multidisciplinary study increases
the chance of detecting separate stocks where they exist (Moore 2011; Welch et al. 2015) and
our recommended approach to answer the questions outlined below thus by default uses, at the
very least, a genetic sample combined with at least otolith chemistry.
Skipjack tuna
Key questions regarding the stock structure of skipjack tuna in the Pacific that warrant
addressing include:
1. Is there panmixia in skipjack tuna across the equatorial Pacific?
2. Is the occurrence of skipjack tuna in subtropical and temperate waters independent of the
equatorial stock?
Question 1: Is there panmixia in skipjack tuna across the equatorial Pacific?
Addressing this question requires simultaneous sampling of similarly-sized fish (e.g. 40 cm FL) at
locations across the species’ equatorial distribution.
Where and when to sample: Sampling should be conducted over the full geographical range of
skipjack tuna in the equatorial Pacific i.e. Indonesia to Ecuador, and including the high seas.
Outlier locations (i.e. locations within the Atlantic and Indian Oceans) should be included for
contrast, and to aid determination of provenance for traceability purposes. Sampling should
adopt a phased approach across both spatial and temporal scales. Broad-scale, low resolution
3 Such analyses are currently being conducted for the four tuna species reviewed here for a stock structure study in the Indian Ocean, and results from these analyses may help provide guidance here.
35
sampling should be conducted in Phase I (e.g. covering widely spaced locations across the
equatorial region). Should no structuring be observed, no further spatial sampling should be
conducted. If spatial structuring is observed, finer-scale spatial sampling, targeting key areas of
interest, should be conducted in Phase II. Repeated sampling of the locations sampled in Phase
I should also be conducted in Phase II to assess the temporal stability of examined signal(s).
Repeated sampling of all locations sampled in Phases I and II should be conducted in a third
phase to further assess the temporal stability of examined signal(s). To avoid the potential for
repeated sampling of the same group of fish at different locations, sampling of locations in each
phase should be conducted across a restricted temporal window (e.g. within a four-week period),
to ensure that spawning individuals have not had time to move between locations. In order to
reduce the effects of ENSO, sampling should be conducted during ENSO-neutral periods.
Repeated sampling during El Niño or La Niña events would then allow for examination of their
effect on stock structure of skipjack tuna.
How to obtain samples: In both the WCPO and EPO, sampling could be achieved via observers
or dedicated sampling personnel on purse seine and pole-and-line vessels.
What to collect: A multidisciplinary approach, involving modern molecular markers such as
SNPs, otolith chemistry and shape, and parasites as biologicals tags, may prove the most useful
for determining the existence of panmixia in skipjack tuna in the Pacific. At least 100 fish should
be collected per stratum (i.e. a spatially or temporally distinct group of fish – i.e. fish from
Location A in Phase II), and fish should be sampled for a range of biological material (i.e. muscle
samples for genetics and stable isotope analyses, otoliths for chemical and shape analyses as
well as ageing, gonads, and gill rakers and viscera for parasite analyses). Given the small size
and low cost of skipjack tuna relative to other tropical tunas, it may be possible to purchase entire
fish for sampling. If purchasing whole fish is not possible for budget or operational reasons,
priority should be given to collecting biological material that has multiple uses, in particular
muscle and otoliths. If sampling from purse-seine vessels, it would be better, to avoid issues of
kinship, to sample a few individuals per set, and sample multiple sets per location, than sampling
all individuals from a single set.
Question 2: Is the occurrence of skipjack tuna in subtropical/temperate waters independent of the
equatorial stock?
Preliminary investigations using otolith chemistry (Arai et al. 2005) and parasites (Lester et al.
1985) indicate that skipjack tuna at the extremities of their distribution have spent some time in
tropical waters, however, their relationships with individuals within the tropics is poorly
understood. Spawning of skipjack at the extremities of their distribution has also been reported
(e.g. Yabe 1954), leading some to conclude fish in these areas potentially form separate stocks
to those in equatorial waters.
Where and when to sample: Addressing this question requires simultaneous sampling of skipjack
from the subtropical/temperate waters and the equatorial Pacific. Sampling will need to be
conducted twice per year (i.e. during each of the austral and northern hemisphere summers,
when skipjack are present at the extremities of their range), with samples taken from equatorial
waters in each sampling event.
How to obtain samples: Sampling to address this question could be achieved via observers in
both EPO and WCPO, particularly on purse seine, pole-and-line, and troll vessels. In certain
locations (e.g. east coast of Australia, New Zealand), it may be necessary to sample from the
recreational fleet and charter vessels.
36
What to collect: A multidisciplinary approach, involving modern molecular markers such as
SNPs, otolith chemistry and shape, and parasites as biologicals tags, may prove the most useful
for determining relationships between skipjack tuna across latitudes. Approaches that allow for
resolution of movement from one environment to another, such as otolith chemistry and parasites
as biological tags (i.e. to assess whether fish have moved from the tropics, and not just that they
are related to fish from the tropics), may prove the most useful in this instance. As above, given
the small size and low cost of skipjack tuna relative to other tropical tunas, it may be possible to
purchase entire fish for sampling. If purchasing whole fish is not possible, again priority should be
given to collecting biological material that has multiple uses, in particular muscle and otoliths.
Yellowfin tuna and bigeye tuna
Specific questions regarding the stock structure of yellowfin tuna and bigeye tuna in the Pacific
that warrant addressing include:
1. Do mature yellowfin tuna or bigeye tuna show fidelity to spawning locations?
2. Is there connectivity between equatorial and sub-equatorial spawning groups of yellowfin
tuna or bigeye tuna, including Hawaii?
3. Is there mixing of non-spawning populations/stocks of yellowfin tuna or bigeye tuna?
4. Is there a genetic basis for the different movement phenotypes observed (i.e. resident,
transitory, migratory/homing)?
Question 1: Do mature yellowfin tuna or bigeye tuna show fidelity to spawning areas?
Determining whether yellowfin tuna or bigeye show fidelity to spawning areas and the degree of
reproductive stock structure across the Pacific distribution of yellowfin tuna and bigeye tuna
preferentially requires an examination of adult fish in spawning condition from different spawning
areas, with samples collected on an annual basis during peak spawning times over multiple
spawning seasons. Should sampling of adults be impractical, or yield insufficient samples,
young-of-the-year (YOY) individuals may be sampled to use as proxy for patterns of behaviour of
spawning adults, although a key challenge in this instance would be to obtain fish as small as
possible to ensure that we can assume that the location of sampling is close or coincides with
their natal area. Larval dispersal or active movement models could be used to back-calculate the
origin of YOY to estimate putative areas of origin. Distinct, temporally stable, spawning-area
signals suggest that fish are using the same area for spawning, while non-distinct spawning-area
signals suggest that fish may be moving between and utilising different spawning areas during
their lives.
The first task to addressing whether mature yellowfin tuna or bigeye tuna show fidelity to
spawning areas would be to identify existing samples of actively spawning fish, or YOY
individuals, stored with the WCPFC tuna tissue bank, to determine whether there is sufficient
material on hand to provide evidence for population structure. If sufficient material exists (i.e.
muscle and otolith samples from ~100 fish in spawning condition per spawning area per year),
these could be used to provide a preliminary examination of potential structuring within each
species during the spawning season.
If existing material is insufficient, a dedicated sampling program will be required. Areas of
spawning activity to target sampling towards should first be identified. Areas and times known to
contain fish in running ripe state (e.g. Philippines, Coral Sea, and areas across the equatorial
band) should be targeted as a priority while several additional lines of evidence could be
examined to determine other areas where fish in spawning condition may occur, including:
37
● Observer data from the commercial purse-seine and longline fleets for fish in spawning
state;
● Catch and effort data (high catches during peak spawning periods may indicate an
aggregation of spawning fish, while spatio-temporal patterns in length/weight data from
the longline fishery, the purse-seine fishery associated with dolphins in the EPO, or free
school sets in the CPO, may indicate when large fish congregate in a particular area);
● Current collections of gonad material stored in the WCPFC tuna tissue bank (via
histology);
● Areas with high occurrence of larval or early juvenile tunas in stomach contents of
predators, including other tunas;
● Areas of high larval recruitment success as estimated by SEAPODYM.
Where and when to sample: Sampling should be phased across both spatial and temporal
scales. Broad-scale, low resolution sampling should be conducted in Phase I (e.g. covering
widely-spaced areas spanning the Pacific distribution of yellowfin tuna and bigeye tuna, such as
Coral Sea, Indonesia, western equatorial Pacific, central equatorial Pacific, Hawaii, and the
EPO). Outlier areas (i.e. areas within the Atlantic and Indian Oceans) should be included for
contrast, and to aid determination of provenance for traceability purposes. Should no structuring
be observed between areas in Phase I, no further spatial sampling may be required. If spatial
structuring is observed, finer-scale spatial sampling targeting key areas of interest between the
Phase I areas should be conducted in Phase II. Repeated sampling of areas sampled in Phase I
should also be conducted in Phase II to assess the temporal stability of examined signal(s).
Repeated sampling of all areas sampled in Phases I and II should be conducted in a third phase
to further assess the temporal stability of examined signal(s). As best as possible, spawning
areas should be sampled at around the same time (i.e. within a four-week window), to ensure
that spawning individuals have not had time to move between areas and therefore limit the
possibility that fish are sampled twice. Given that peak spawning times vary between areas, the
best way to achieve this will need careful consideration.
How and what to sample: In both the WCPO and EPO, sampling could be achieved via
observers or dedicated sampling personnel. To obtain adult yellowfin tuna and bigeye tuna,
sampling could be conducted by observers on purse-seine vessels targeting free school sets in
the CPO and the purse-seine catches associated with dolphins in the EPO, or via dedicated
samplers on longline vessels. Port sampling of longline catches may also be possible within
several countries and territories in the WCPO. Sampling of YOY yellowfin tuna and bigeye tuna
may be achieved via observers on purse seine or pole-and-line vessels. Opportunities to
collaborate with / leverage off other ongoing or planned projects, such as the recent ACIAR-
funded population biology project in Indonesia (targeting skipjack, yellowfin and bigeye tunas),
should be sought.
What to collect: What biological material to collect depends largely on the life history stage is
being sampled. If spawning adults are sampled, sampling should ideally cover a range of
biological material, including muscle samples for genetics and stable isotope analyses, otoliths
for chemical and shape analyses as well as ageing, and gonads, but if required, priority should
be given to material that has multiple uses, in particular muscle and otoliths. Gonads should also
be collected as a priority to confirm spawning condition via histology. If sampling of adults is
deemed not possible or practical, and YOY fish are sampled as a proxy, it is likely that only
genetic signals (e.g. SNPs) may be worth investigating if addressing Question 1 in isolation.
However, if the collected material is to be used as a starting point to address mixing outside of
the spawning season or of immature fish (see Question 3 below), other biological material,
including otoliths and material for parasite analysis (stomachs, gill rakers), should also be
38
collected given their value in providing baseline signatures of natal areas in mixed stock
analyses.
Question 2: Is there connectivity between equatorial and sub-equatorial spawning groups of
yellowfin tuna or bigeye tuna, including Hawaii?
Although currently considered a single stock in the WCPO for assessment and management
purposes, there is preliminary evidence to suggest that yellowfin tuna or bigeye tuna in sub-
equatorial regions such as Hawaii may constitute separate reproductive units to those in
equatorial regions of the WCPO (Schaefer et al. 2015; Rooker et al. 2016; P. Grewe,
unpublished data). Accordingly, structured studies are required to formally assess the
relationships between fish spawning in equatorial regions (i.e. those between 10°N and 10°S)
and sub-equatorial waters. Relationships between spawning units of both yellowfin tuna and
bigeye tuna within these regions could be addressed using the design outlined above, provided
adequate sampling locations are included in sub-equatorial and adjacent equatorial waters. As
discussed above, care would have to be taken to ensure that fish are sampled simultaneously
during the respective peak spawning time for the respective sampling areas, noting that given
differences in the timing of peak spawning between areas this will likely require that each area be
sampled on multiple occasions in an annual cycle.
Question 3: Is there mixing of non-spawning populations/stocks of yellowfin tuna or bigeye tuna?
Addressing this question requires an initial understanding of how yellowfin tuna and bigeye tuna
are structured during the spawning season, and the natal origins of new recruits to the fishery, as
a starting point from which to evaluate the degree of mixing. This could be achieved using the
same design proposed for Question 1 above. Subsequent mixing of both adults and
juveniles/sub-adults should be examined to account for any variation in mixing as a result of
ontogenetic and/or environmental influences. Two potential options for determining mixing of
juveniles/sub-adult or non-spawning adults for yellowfin tuna and bigeye tuna are proposed
below, depending on what life history stages are sampled initially (i.e. adults on spawning
grounds or larvae/YOY individuals in natal areas):
I. Options based on initial sampling of adults on spawning grounds
If sampling of adults on spawning grounds was conducted to assess how fish are structured
during spawning, such as using the design proposed for Question 1 above, and clear,
temporally stable, differences in signal(s) between different spawning areas found to exist, a
second temporal sampling should be conducted. To assess movement and mixing of adults,
this second sampling should ideally occur as far outside of the spawning season for each
area as possible, to allow the maximum time for fish to mix between spawning events. To
assess movement and mixing of juvenile/sub-adult fish, this should occur when fish are
around 6–12 months old i.e. when fish recruit to commercial purse seine and pole-and-line
fisheries.
In this option, the choice of techniques to use to assess mixing would largely depend on the
life history stage being examined. For assessing movements and mixing of adult fish
following spawning, the same material as that examined in adults at spawning areas should
be examined (i.e. a complementary approach incorporating at least modern molecular
markers such as SNPs, and otolith elemental and isotopic signatures, otolith shape, and
potentially isotopic signatures in muscle tissue). This approach would provide direct evidence
of mixing of adults (i.e. as animals from the same cohort and spawning unit are tracked over
time). For juveniles/sub-adults, genetic markets such as SNP markers should be examined to
classify juveniles/sub-adults back to their likely spawning unit of origin based on their
relatedness to sampled adults, providing an indirect account of mixing (in that animals from a
39
different cohort to that originally sampled are being examined). Due to the lack of a direct
baseline natal environmental signal (resulting from a lack of sampling larvae or YOY fish on
the natal grounds in this option), techniques such as otolith chemistry may be less useful in
this instance, as core signatures in juveniles/sub-adult may not necessarily reflect those in
adult fish, even if originating from the same area, due to inter-annual differences in
environmental variables (in particular ambient chemistry, temperature and salinity; Campana
1999; Elsdon and Gillanders 2004).
II. Options based on the initial sampling of larvae or YOY individuals in natal areas
If sampling of larvae or YOY fish (as small as possible) on their natal grounds was achieved,
and clear, temporally stable, differences in signal(s) between fish from different natal areas
were found to exist, two potential approaches could be used to assess movement and mixing
of juveniles/sub-adults and adult fish outside of the spawning season:
A) Immediate sampling of juveniles/sub-adults and adults. Following characterisation of
genetic signatures of larval/YOY fish in their natal areas, sampling of juveniles/sub-
adults and adults within the same annual cycle could be conducted. Sampling should
be conducted at least six months from the peak spawning season in each area, to
enable adults time to move away from spawning areas and potentially mix. Genetic
markers such as SNPs would provide an ideal tool for assessing movement and
mixing using this approach. This approach would provide indirect evidence of mixing
across all life history stages (in that patterns of mixing in one cohort are inferred from
another cohort).
B) Cohort-specific sampling of juveniles and adults. In this approach, the same cohort
would be sampled over time to assess movement and mixing as fish age and mature,
following the approach conducted for yellowfin tuna and bigeye tuna by Rooker et al.
(2016). For example, if larvae/YOY fish were initially sampled from different natal
areas in 2020, and distinct natal area signatures found to exist, juveniles from the
same cohort should be sampled in 2021 and again in 2022 (i.e. when they are 1 and
2 years of age, respectively), while adults resulting from this cohort should be
sampled in 2025 (at five years of age). A multidisciplinary approach, involving
complementary techniques such as examination of SNPs and otolith chemistry,
would likely prove the most useful for assessing the degree of mixing in this
approach. Larval/YOY fish should be sampled for genetic material (for SNP analyses)
and otoliths (for elemental and/or isotopic analyses of the otolith core region).
Subsequent samples of juveniles/sub-adults, and adults, should then be surveyed for
the same markers. Techniques such as examination of parasites or isotopic
signatures in muscle tissue may be less appropriate in this instance, particularly in
larval fish, as these individuals will likely not have had sufficient time to accumulate a
distinct natal-area signature, or, in the case of muscle isotopic signatures, the natal
signature may be altered by the time subsequent sampling of older life history stages
is conducted. Genetic and otolith elemental or isotopic signals observed in the
juveniles/sub-adult and adult samples should be examined with reference to those of
the larval/YOY fish to re-classify fish back to their natal area of origin, for example via
a mixed-stock analysis (see boxed text). This approach would thus provide direct
evidence of mixing across all life history stages (in that patterns of mixing are
examined in the same cohort across time).
How to sample: As per questions 1 and 2 above, as best as possible, locations should be
sampled at around the same time and over a short temporal period (i.e. within four weeks) in
40
each successive year, to reduce the possibility that the same group of fish has moved between
locations and thus is sampled on multiple occasions, and to ensure patterns between years are
comparable. Sampling, including both of adults during spawning or larval/YOY in their natal
areas, and subsequent sampling of non-spawning components, should be repeated over multiple
(e.g. three successive) years, to assess the temporal stability of the examined signal(s).
For both options I and II above, samples of adult yellowfin tuna or bigeye tuna both within and
outside of the spawning seasons could be obtained by observers on purse-seine vessels
targeting free school sets in the CPO and the purse-seine fishery associated with dolphins in the
EPO, or via dedicated samplers on longline vessels. Port sampling of adult yellowfin tuna and
bigeye tuna from longline catches may also be possible within several countries and territories in
the WCPO. Sampling of YOY and juveniles/sub-adult yellowfin tuna and bigeye tuna may be
achieved via observers on purse seine or pole-and-line vessels. A key challenge here would be
to obtain YOY as young as possible from the commercial fleet, to ensure they are as close to
their natal areas as possible (and that no mixing between reproductive units had occurred).
Larval dispersal or movement models could be used to investigate how likely YOY are
associated with the areas in which they are caught, or to back-calculate dispersion of sampled
YOY to estimate their putative areas of origin. Fisheries-independent approaches would be
required to sample larvae. Given the need for simultaneous, repeated sampling, this would be at
high cost and effort.
Question 4: Is there a genetic basis for the different movement phenotypes observed (i.e.
resident, transitory, nomadic)?
For each yellowfin tuna or bigeye tuna tagged during tagging operations, and particularly those
tagged with archival tags, a biopsy of muscle tissue should be taken. Examining displacements
from tagging data in conjunction with genetic signals would then facilitate whether observed
movement patterns have a genetic basis, and potentially whether individuals of some stocks are
more mobile than others.
South Pacific albacore tuna
Specific questions regarding the stock structure of South Pacific albacore tuna that warrant
addressing include:
1. Are there separate reproductive stocks of albacore across the South Pacific with discrete
spawning areas?
2. Do South Pacific albacore tuna show fidelity to these spawning areas?
3. Is there mixing of South Pacific albacore tuna during non-spawning periods?
4. Is there connectivity between reproductive populations of North Pacific and South Pacific
albacore tuna?
Question 1: Are there separate reproductive stocks of albacore across the South Pacific with
discrete spawning areas? and
Question 2: Do South Pacific albacore tuna show fidelity to these spawning areas?
Determining whether there are separate reproductive stocks of albacore tuna across the
spawning latitudes in the South Pacific and whether mature South Pacific albacore tuna show
fidelity to discrete spawning areas will require examination of adult fish (i.e. > 90 cm FL) in
spawning condition from different areas distributed across spawning latitudes (10–25°S), with
samples collected on an annual basis over multiple spawning seasons. Distinct and temporally
stable spawning-area signals at the time of spawning suggest that fish are using the same area
for spawning, while non-distinct spawning-area signals suggest that fish may move between and
41
utilise different spawning areas during their lives. Should sampling of adult South Pacific
albacore tuna not be practical, or insufficient sample sizes be obtained, sampling of larvae or
YOY fish as small as possible (so they are as close to their natal areas as possible) could be
conducted to infer adult movement and behaviour. However, it should be noted that as YOY
albacore tuna < 45 cm FL are not commercially harvested, such sampling would have to be
based on fisheries-independent approaches, which can be more costly.
The first task to addressing these two questions would be to identify existing samples of actively
spawning fish, or collections of larvae or YOY individuals stored with the WCPFC tuna tissue
bank, to determine whether there is sufficient material on hand to provide evidence for population
structure. If sufficient material exists (i.e. samples from ~100 fish per spawning area per year),
these could then be used to provide a preliminary examination of potential structuring within the
South Pacific albacore population during the spawning season.
If existing material is insufficient, additional sampling will be required. Previous reproductive work
(e.g. Farley et al. 2013) could be used to determine spatial areas and months to direct sampling
effort. In addition, several other lines of evidence could be examined to determine areas to
sample to obtain fish in spawning condition, including:
● Observer data from the commercial longline fleet for fish in spawning state;
● Catch and effort data (high catches during the spawning period may indicate an
aggregation of spawning fish);
● Areas with high occurrence of larval or early juvenile albacore tuna in stomach contents
of predators, including other tunas;
● Areas of high larval recruitment success as estimated by SEAPODYM.
As with the three tropical tunas, sampling should adopt a phased approach at both spatial and
temporal scales. Broad-scale, low-resolution sampling of spawning adults should be conducted
in Phase I to determine whether there are spatial differences in the signal(s) examined, covering
widely spaced areas across the spawning latitudes, such as the western Pacific (e.g. Coral Sea),
central Pacific (e.g. French Polynesia) and eastern Pacific (e.g. around 120°W and 90°W), during
peak spawning season (October to December). Should spatial structuring be observed, finer-
scale sampling, targeting key areas of interest should be conducted in Phase II. Also in Phase II,
repeated sampling of areas sampled in Phase I should be conducted to assess the temporal
stability of the examined signal(s). Repeated sampling of all areas sampled in Phases I and II
should be conducted in a third phase to further explore the stability of the examined signal(s) at
all sampling areas. As best as possible, spawning areas should be sampled at around the same
time (i.e. within a four-week window), to ensure that spawning individuals have not had time to
move between areas and therefore limit the possibility that fish are sampled twice.
What to sample: A multidisciplinary approach, involving modern molecular markers such as
SNPs, otolith chemistry and shape analysis, and parasites as biologicals tags, may prove the
most useful for elucidating whether there are separate reproductive stocks and the existence of
spawning area fidelity for South Pacific albacore. At least 100 fish should be sampled per
stratum, with muscle, otolith, gill raker and stomach samples collected from each adult fish. If
sampling adult fish, gonads should be collected from each fish to validate spawning condition via
histology. Archival tagging would also provide evidence of albacore behaviour, and potential for
natal homing if tags could be deployed over multiple years. However, as noted above, albacore
are very difficult to tag, with high mortality and low tag recapture rates, so a very large population
would need to be tagged, at a high cost.
42
How to sample: In both the WCPO and EPO, sampling of adult fish could be achieved by placing
observers and dedicated sampling personnel on longline vessels operating between ~10–25°S
within the peak spawning season (October to December). Sampling of larvae or YOY fish, if
necessary, could be achieved via fisheries-independent sampling at selected areas within the
same latitudes during the peak spawning season.
Question 3: Is there mixing of South Pacific albacore tuna during non-spawning periods?
As with yellowfin tuna and bigeye tuna, addressing this question in South Pacific albacore tuna
requires an initial understanding of how South Pacific albacore tuna are structured during the
spawning season, and the natal origins of new recruits to the fishery, to provide a starting point
from which to evaluate the degree of mixing. Mixing of both adults inhabiting tropical waters, and
juveniles/sub-adults inhibiting temperate waters, should be examined to account for any variation
in mixing as a result of ontogenetic and/or environmental influences. Two potential options exist
for determining mixing of juveniles or adults outside of the spawning season for South Pacific
albacore tuna, depending on what life history stages are initially sampled (i.e. adults on spawning
grounds or larvae/YOY individuals in natal areas):
I. Options based on initial sampling of adults on spawning grounds
If sampling of adults on the spawning grounds was conducted to assess how fish are
structured during spawning, such as using the design proposed for Question 1 above, and
clear, temporally stable, differences in signal(s) between different spawning areas found to
exist, a second temporal sampling should be conducted. To assess movement and mixing of
adults, this second sampling should ideally occur as far outside of the spawning season as
possible (i.e. around May-June for the South Pacific population) to allow fish the maximum
time to mix between spawning events. To assess movement and mixing of juvenile/sub-adult
fish, this should occur when fish are around 12 months old i.e. when fish recruit to
commercial and recreational troll fisheries in temperate waters.
In this option, the choice of techniques used to assess mixing would largely depend on the
life history stage being examined. For assessing movements and mixing of adult fish
following spawning, the same material as that examined in adults at spawning areas should
be examined (i.e. modern molecular markers such as SNPs, otolith chemistry and parasite
loadings). If attempting to track mixing of juveniles based on signals evident from adult fish
on spawning areas, SNP markers should be examined to trace fish back to their spawning
unit of origin based on their relatedness to sampled adults. Due to the lack of a direct
baseline natal environmental signal (resulting from a lack of sampling larvae or YOY fish on
the natal grounds in this approach), techniques such as otolith chemistry may prove less
useful in this instance.
II. Options based on the initial sampling of larvae or YOY individuals in natal areas.
If sampling of larvae or YOY fish (as small as possible) on their natal grounds was
conducted, and clear, temporally stable, differences in signal(s) of South Pacific albacore
between different spawning locations / natal areas were found to exist using the sampling
design proposed for Question 1, two potential approaches could be used to assess
movement and mixing of juveniles and adult fish outside of the spawning season:
A) Immediate sampling of juveniles and adults (using genetic markers): Following
characterisation of genetic signatures of fish in their natal areas, sampling of
juveniles/sub-adults and adults within the same annual cycle could be conducted.
Sampling should be conducted at least six months from the peak spawning season,
to enable adults time to move away from spawning areas and potentially mix.
43
Genetic markers such as SNPs would provide an ideal tool for assessing movement
and mixing using this approach.
B) Cohort-specific sampling of juveniles and adults (using multiple markers): In this
approach, the same cohort would be sampled over time, to assess movement and
mixing as fish age and mature, following the approach conducted for yellowfin tuna
and bigeye tuna by Rooker et al. (2016). For example, if larvae/YOY fish were initially
sampled from different natal areas in 2020, and distinct natal area signatures found
to exist, juveniles from the same cohort should be sampled in 2021 and again in 2022
(i.e. when they are 1 and 2 years of age, respectively, while adults resulting from this
cohort should be sampled in 2025 (at five years of age). A multidisciplinary approach,
involving complementary techniques such as examination of SNPs and otolith
chemistry, would likely prove the most useful for assessing the degree of mixing in
this approach. Larval/YOY fish should be sampled for genetic material (for SNP
analyses) and otoliths (for elemental and/or isotopic analyses of the otolith core
region). Subsequent samples of juveniles/sub-adults in temperate waters, and adults
in tropical and sub-tropical waters, should then be surveyed for the same markers.
Techniques such as examination of parasites or fatty acid profiles may be less
appropriate in this instance, particularly in larval fish, as these individuals may not
have had sufficient time for a distinct natal-area signature to develop in the fish, or
the natal signature may be altered by the time subsequent sampling of older life
history stages is conducted. Genetic and otolith elemental or isotopic signals
observed in the juveniles/sub-adult and adult samples should be examined to re-
classify fish back to their natal area of origin based on their natal profile (i.e. the
signature evident in YOY fish on the spawning ground), for example via a mixed-
stock analysis (see boxed text).
How to sample: For both options I and II (A and B) above, as best as possible, locations should
be sampled at around the same time and over a short temporal period (i.e. within four weeks) in
each successive year, to reduce the possibility that the same group of fish has moved between
locations and thus is sampled on multiple occasions, and to ensure patterns between years are
comparable. Sampling of adults during peak spawning, or larval/YOY in their natal areas, and
subsequent of post-recruitment life history stages, should be repeated over multiple (e.g. three
successive) years, to assess the temporal stability of the examined signal(s).
In both the WCPO and EPO, sampling of adult fish could be achieved by observers and
dedicated sampling personnel on longline vessels operating between ~10–25°S. Sampling of
juveniles/sub-adults could be achieved from commercial troll fisheries and potentially recreational
fishers in Australian and New Zealand waters. As discussed above, sampling of larvae or YOY
South Pacific albacore tuna, if deemed necessary, would require fisheries-independent sampling.
Given the need for simultaneous, repeated sampling, this would be at high cost and effort. If
sampling YOY fish, an additional challenge would be to ensure fish are as close to their natal
areas as possible. Again, larval transport or movement models could be used to identify areas
most likely to host high larval densities for a given natal area.
Question 4: Is there connectivity between reproductive populations of North Pacific and South
Pacific albacore tuna?
Historically, the South Pacific albacore tuna population was considered to be distinct from that of
the North Pacific. However, recent evidence, suggests that some gene flow may occur between
these regions (Montes et al. 2012; Albaina et al. 2013). Relationships between these two putative
populations should be able to be addressed using the design outlined above provided adequate
44
sampling locations across both the North Pacific and South Pacific are included. However,
spawning times are reported to be different between the North Pacific population and the South
Pacific population, with spawning in the North Pacific extending from March to September, and
likely peaking between March and April (Chen et al. 2010). Accordingly, at least two sampling
periods will be required in each year (i.e. one during the peak spawning period in each
hemisphere), with both North Pacific and South Pacific areas sampled in each sampling period.
Mixed stock analysis for assessing natal origins and mixing of tropical tunas
One potentially viable approach for testing specific hypotheses on natal origins and the degree of mixing of sub-adult and adult fish is via a mixed stock analysis framework. The first step in a mixed stock analysis to determine natal origins of the four tuna species would be to sample larvae or fish as young as possible (so they are as close to their original spawning areas as possible) from as many spawning sites or nursery areas as can feasibility be conducted, to identify characteristic ‘natal’ profiles based on, for example, genetic profiles, chemical constituents of otoliths, or parasites). In an ideal world, this sampling should cover as many known areas of spawning as possible. If distinct natal profiles are identified, the second step is to sample sub-adult and adults in the fishery to re-classify these back to their natal origin based of their natal
profile (Figure 1).
Figure 1. Theoretical depiction of a mixed-stock analyses in skipjack tuna. Here, juveniles from three nursey areas, and three mixed adult assemblages, have been surveyed for a hypothetical genetic marker influencing stripe colour, allowing an examination of natal origins and degree of mixing of adult fish.
For a marker to be used successfully in a mixed stock analysis, it must be i) uniquely representative of the spawning ground / nursery site, and ii) stable over the interval between natal characterisation and sub adult / adult mixing, and ideally for the fish’s entire life (Lester 1990; Campana 1999). Modern molecular markers such as SNPs provide ideal candidates for use in a mixed-stock analysis because they are i) present in every individual, ii) not modified in the interval between natal characterisation and the mixing of adults, iii) relatively cost effective, meaning a large number of individuals can be screened, iv) logistically feasible to implement, v) most likely to be able to detect differentiation between discrete spawning groups, and iv) able to be used to prove additional insight, including provenance determination for chain-of-custody analyses, and determination of effective population sizes (Laconcha et al. 2015). Additionally, otolith chemistry and parasites have both been used successfully in mixed stock analyses to assess natal origins and relative contributions of nursery areas to adult assemblages (e.g. MacKenzie 1985; Rooker et al. 2008).
45
Conclusions
While current assessments typically assume single stocks of skipjack, yellowfin, bigeye and
South Pacific albacore tunas within each of the WPCFC and IATTC convention areas, several
lines of evidence reviewed here suggest the potential occurrence of multiple stocks within the
Pacific Ocean basin at varying spatial scales. In order to better define the stock structure of
skipjack, yellowfin, bigeye and South Pacific albacore tunas in the Pacific, and to better
understand the underlying biological mechanisms by which observed spatial structuring occurs,
key uncertainties surrounding spawning locations and behaviour (including the degree of fidelity
to natal spawning grounds), and the origins and mixing of post-juvenile assemblages, and
proportional contributions of spawning units to mixed fisheries assemblages, need be addressed.
Emerging technologies, in particular modern molecular markers such as SNPs, combined with
complementary approaches such as otolith microchemistry or parasites as biological tags, may
prove useful for testing specific hypotheses regarding uncertainties around spatial structuring of
reproductive units and proportional contributions of spawning units to fished populations, as well
as providing a framework to answering questions beyond those relating to stock structure, such
as provenance determination for chain of custody documentation. However, before embarking on
a large, expensive sampling program, it is recommended that management strategy simulations,
assessing various hypothetical scenarios of stock structure, be evaluated to determine whether
an improved understanding of stock structure would result in improved management of stocks.
Acknowledgments
We thanks participants at the ‘Identifying the spatial structure of Pacific tuna stocks’ workshop
held in Noumea, 8-12 October 2018, in particular Valerie Allain, Mark Bigler, Don Bromhead,