Current methods for detecting ethylene in plants. Artículo científico.
14
INVITED REVIEW Current methods for detecting ethylene in plants Simona M. Cristescu 1, *, Julien Mandon 1 , Denis Arslanov 1 , Je ´ ro ˆ me De Pessemier 2 , Christian Hermans 2 and Frans J. M. Harren 1 1 Department of Molecular and Laser Physics, Institute for Molecules and Materials, Radboud University, Heyendaalseweg 135, NL 6525 AJ Nijmegen, The Netherlands and2 Laboratory of Plant Physiology and Molecular Genetics, Universite ´Libre de Bruxelles, Campus Plaine CP 242, Bd du Triomphe, 1050 Brussels, Belgium * For correspondence. E-mail [email protected]Receiv ed: 29 Augu st 2012 Rev isio n reque sted : 1 October 2012 Acce pted : 30 Octobe r 2012 Publ ishe d elect ron ical ly: 12 December 2012 †Backgro undIn view of ethylene’s critical developmental and physiological roles the gaseous hormone remains an active research topic for plant biologists. Progress has been made to understand the ethylene biosynthesis pathway and the mechanisms of perception and action. Still numerous questions need to be answered and findings to be validated. Monitoring gas production will very often complete the picture of any ethylene research topic. Therefore the search for suitable ethylene measuring methods for various plant samples either in the field, green- houses, laboratories or storage facilities is strongly motivated. †Scope This review presents an update of the current methods for ethylene monitoring in plants. It focuses on the thre e most-used methods – gas chromat ogra phy detectio n, electro chemi cal sensing and optica l detec tion – and compares them in terms of sensitivity, selectivity, time response and price. Guidelines are provided for proper selection and application of the described sensor methodologies and some specific applications are illustrated of laser-based detect or for monitorin g ethyl ene given off by Arabidopsis thaliana upon variou s nutri tional treatments. †Conclusions Each method has its advantages and limitations. The choice for the suitable ethylene sensor needs careful consideration and is driven by the requirements for a specific application. Key words : Ethylene, Arabidop sis thaliana, gas sampli ng, gas chromatogr aphy, electroc hemic al sensing , laser-based detector. INTRODUCTION For a long time plants were known to emit ethylene; it is con- sider ed a gaseou s phyto hormo ne regu lati ng vario us gro wth and development processes (Abeles et al., 1992; Adams and Yang, 1979), synergistically or antagonistically with other hor- mon es (Linki es and Leubne r-Met zger, 2012 ; Muday et al ., 2012). Biotic factors can modify endogenous ethylene produc- tion, such as pathogen attack (Cristescuet al., 2002), herbivor- o us pre dat i on (Schroder et al., 2007), and abiotic envir onmen tal fact ors inclu ding floodi ng (Voeseneket al ., 1993), che mic al expos ur e (Tuomainen et al ., 1997), O 2 or CO 2 levels (Dhawan et al., 1981; Vergara et al., 2012), day length and lig ht int ens ity (Thain et al ., 2004), temperatur e (Wang and Adams, 1982; Orihuel-Iranzo et al., 2010) or nutri- ent availability (Borchet al., 1999; Junget al., 2009; Hermans et al., 2010a). Moreover, the emissions may vary according to the plant species, organ type (e.g. root, leaf and flower) and developmental stage of the plant. It is demonstrated that ethylene can stimulate fruit ripening even at levels of tens of nL L 21 (Pranamornkithet al., 2012). The re for e, it is of par amo unt imp ort ance to mon ito r and contr ol the eth yle ne emi ssio n in gr owth cha mbe rs, gr een - houses and stora ge fa cil ities to optimize fru it fr eshnes s. Cont ro ll ed at mosphere was deve loped to al low longer storage periods and, subsequently, to provide a wide variety of fruits to the consumers over the entire year. Hence, there is an increased demand for simple, affordable and reliable ethylene sensors that could be used in conjunction wit h equipment for con tro lli ng ethyle ne concentr at ions. Several sensor technologies have been proposed and their per- formance tested for different species in storage facilities. Apart from the agricultural- and industrial-related involve- men t of eth yle ne in con tro lli ng fruit qua lit y, a lot of eff ort has been dedicated to understanding the physiological mech- ani sm of ethyle ne biosyn the sis , act ion and per ceptio n in plants. To this end, the biosynthesis pathway has been clarified (Zarembinski and Theologis, 1994) and valuable insights into the signalling mechanisms have been achieved over the years (Cha ng, 1996). Also in this field of re sea rc h, ther e is an increased demand for suitable ethylene detectors. In spite ofgreat achievements at both the plant’s molecular and physio- logical levels, many ethylene-related plant events remain unre- ve ale d, mai nly due to a la ck of fas t and sensit ive eth yle ne detection. Here , an overvie w is pres ented on the current methods used to sample and detect ethylene in plants. In particular, three cat- egori es are discussed: gas chr omat ogra phy (GC) detection, ele ctr ochemi cal sens ing and opt ica l sens ing. The wor king principle for each type of sensor is briefly described, with em- pha sis on advantages and dis advant age s. App licati on of a las er- bas ed det ect or use d to monito r eth yle ne giv en off by the model species Arabidopsis thaliana under various nutrient conditions is used to illustrate the suitability of such a sensor in # The Author 2012. Published by Oxford University Press on behalf of the Annals of Botany Company. All rights reserved. For Permissions, please email: [email protected]Annals of Botany 111 : 347–360, 2013 doi:10.1093/aob/mcs259, available online at www.aob.oxfordjournals.org by g u esto n Febru ary 5, 2016http ://ao b. o x fo rdjo u rn als. o rg /D o w n lo adedfro m
Transcript
7/21/2019 Current methods for detecting ethylene in plants
Simona M. Cristescu1,*, Julien Mandon1, Denis Arslanov1, Jero ˆme De Pessemier2, Christian Hermans2
and Frans J. M. Harren1
1 Department of Molecular and Laser Physics, Institute for Molecules and Materials, Radboud University, Heyendaalseweg 135, NL 6525 AJ Nijmegen, The Netherlands and
2 Laboratory of Plant Physiology and Molecular Genetics, Universite Libre de
Bruxelles, Campus Plaine CP 242, Bd du Triomphe, 1050 Brussels, Belgium* For correspondence. E-mail [email protected]
Received: 29 August 2012 Revision requested: 1 October 2012 Accepted: 30 October 2012 Published electronically: 12 December 2012
† Background In view of ethylene’s critical developmental and physiological roles the gaseous hormone remainsan active research topic for plant biologists. Progress has been made to understand the ethylene biosynthesispathway and the mechanisms of perception and action. Still numerous questions need to be answered and findingsto be validated. Monitoring gas production will very often complete the picture of any ethylene research topic.Therefore the search for suitable ethylene measuring methods for various plant samples either in the field, green-houses, laboratories or storage facilities is strongly motivated.† Scope This review presents an update of the current methods for ethylene monitoring in plants. It focuses on thethree most-used methods – gas chromatography detection, electrochemical sensing and optical detection – andcompares them in terms of sensitivity, selectivity, time response and price. Guidelines are provided for properselection and application of the described sensor methodologies and some specific applications are illustratedof laser-based detector for monitoring ethylene given off by Arabidopsis thaliana upon various nutritionaltreatments.†Conclusions Each method has its advantages and limitations. The choice for the suitable ethylene sensor needscareful consideration and is driven by the requirements for a specific application.
Key words: Ethylene, Arabidopsis thaliana, gas sampling, gas chromatography, electrochemical sensing,laser-based detector.
I N TR O D U C TI O N
For a long time plants were known to emit ethylene; it is con-sidered a gaseous phytohormone regulating various growthand development processes (Abeles et al., 1992; Adams andYang, 1979), synergistically or antagonistically with other hor-mones (Linkies and Leubner-Metzger, 2012; Muday et al.,2012). Biotic factors can modify endogenous ethylene produc-tion, such as pathogen attack (Cristescu et al., 2002), herbivor-ous predation (Schroder et al., 2007), and abioticenvironmental factors including flooding (Voesenek et al.,1993), chemical exposure (Tuomainen et al., 1997), O2 orCO2 levels (Dhawan et al., 1981; Vergara et al., 2012), daylength and light intensity (Thain et al., 2004), temperature(Wang and Adams, 1982; Orihuel-Iranzo et al., 2010) or nutri-
ent availability (Borch et al., 1999; Jung et al., 2009; Hermanset al., 2010a). Moreover, the emissions may vary according tothe plant species, organ type (e.g. root, leaf and flower) anddevelopmental stage of the plant.
It is demonstrated that ethylene can stimulate fruit ripeningeven at levels of tens of nL L21 (Pranamornkith et al., 2012).Therefore, it is of paramount importance to monitor andcontrol the ethylene emission in growth chambers, green-houses and storage facilities to optimize fruit freshness.Controlled atmosphere was developed to allow longerstorage periods and, subsequently, to provide a wide varietyof fruits to the consumers over the entire year.
Hence, there is an increased demand for simple, affordableand reliable ethylene sensors that could be used in conjunctionwith equipment for controlling ethylene concentrations.Several sensor technologies have been proposed and their per-formance tested for different species in storage facilities.
Apart from the agricultural- and industrial-related involve-ment of ethylene in controlling fruit quality, a lot of efforthas been dedicated to understanding the physiological mech-anism of ethylene biosynthesis, action and perception inplants. To this end, the biosynthesis pathway has been clarified(Zarembinski and Theologis, 1994) and valuable insights intothe signalling mechanisms have been achieved over the years(Chang, 1996). Also in this field of research, there is anincreased demand for suitable ethylene detectors. In spite ofgreat achievements at both the plant’s molecular and physio-
logical levels, many ethylene-related plant events remain unre-vealed, mainly due to a lack of fast and sensitive ethylenedetection.
Here, an overview is presented on the current methods usedto sample and detect ethylene in plants. In particular, three cat-egories are discussed: gas chromatography (GC) detection,electrochemical sensing and optical sensing. The workingprinciple for each type of sensor is briefly described, with em-phasis on advantages and disadvantages. Application of alaser-based detector used to monitor ethylene given off bythe model species Arabidopsis thaliana under various nutrientconditions is used to illustrate the suitability of such a sensor in
# The Author 2012. Published by Oxford University Press on behalf of the Annals of Botany Company. All rights reserved.
plant-physiology research. Finally, the sensors are compared interms of sensitivity, response time and price.
M E T H O D S F O R E T H Y L E N E D E T E C T I O NI N P L A N T S
This review plans to cover the three main categories of methods commonly used (or having the potential to be used)for ethylene detection in plants: (1) GC detection, (2) electro-chemical sensing, and (3) optical detection.
GC detection
GC is a common detection technique for separation and ana-lysis of volatile compounds in many research and industrial la-boratories (James and Martin, 1952). Fundamentally, GC canseparate components from complex mixtures by using a specif-ic column and then analyse and quantify them individually(Schomburg, 1990). The gas sample is carried through a sta-tionary phase of the column by a carrier gas (known as the
mobile phase) which is usually an inert/non-reactive gassuch as helium, argon, nitrogen, etc. The stationary phase isa microscopic layer of liquid or polymer on an inert solidsupport which interacts with the components of the sampleand is located inside the column, e.g. a film coated on theinner wall of the column. The speed with which the moleculesprogress along the column is influenced by the strength of ad-sorption on the surface of the stationary phase. Compoundsthat are strongly retained remain attached to the stationaryphase longer and take more time to go through the column,i.e. they have a longer retention time (RT) (Phillips, 1949).A detector placed at the end of the column measures the result-ant signal which produces a series of peaks forming a chro-matogram. Each individual compound can be identified based
on its arrival time (the RT) at the detector. Furthermore, thearea under the resultant peak represents a quantitativemeasure of that compound’s concentration.
The separation of different components and the RT are influ-enced by several factors such as the polarity of the stationaryphase, the temperature and length of the GC column, theflow of the carrier gas, etc. The polarity of the stationaryphase determines the RT; polar compounds have a longerRT due to their strong adsorption on the stationary phase.The speed the sample passes through the column is dependenton the temperature of the GC column and the flow of thecarrier gas (Bernhard, 1960; Blumberg and Klee, 2000). Thehigher the temperature or the carrier gas flow, the faster thesample moves through the column and the less interaction it
with have with the stationary phase. This leads to a shorterRT, but fewer separated components. Therefore, the columntemperature is selected to compromise between the length of the analysis and the resolution of the separation. Also import-ant, is the length of the GC column; the longer the column is,the better the separation, although this leads to a longer RT(Gupta, 1969).
In 1959, the first application of GC was made to measureethylene from apples (Burg and Stolwijk, 1959; Huelin andKennett, 1959). The major drawback of GC was a relativelypoor detection limit, i.e. 10–100 mL L21
, determined by theavailable detection system: a thermal conductivity detector
(TCD) (Lawson and Miller, 1966). The TCD measures the dif-ference in thermal conductivity between the sample compo-nents in the carrier gas and the pure carrier gas alone (asreference). This difference generates a voltage signal propor-tional to the concentration of the sample components.Currently, TCDs are considered universal detectors and, in
spite of lack of sensitivity, TCDs are non-specific and non-destructive detectors. To overcome the GC’s lack of sensitiv-ity, plants were enclosed into a sealed cuvette, allowing ethyl-ene to accumulate for several hours, sometimes as long as 1 d(Freebairn and Buddenhagen, 1964; Abeles, 1972). It was acompulsory step, necessary to generate a detectable GCsignal, in spite of the risk that the plant was experiencingseveral environmental stress factors influencing the ethyleneproduction (e.g. lack of CO2).
A major breakthrough was achieved in the early 1960s,when novel detector technologies became available(Lovelock, 1960; McWilliam, 1983). The progress of flameionization detection (FID) and the photoionization detector(PID) significantly improved the detection limit of ethylene
to tens of nL L21
levels (Bassi and Spencer, 1989). Flame ion-ization detectors became the first standard practice in plant-physiology laboratories. Later on, it was demonstrated thatPID had a significant improvement over FID, becoming themost efficient detection system concerning ethylene measure-ments (Bassi and Spencer, 1985). The PID is also a populardetector in the field of environmental-pollution and industrial-process monitoring, as it is specifically sensitive to aromatichydrocarbons and sulfur compounds. A low detection limitof sub-nL L21 has been reported using such a detector(Degreef and Deproft, 1978); however, the claim was notwell supported by the data (Pham-Tuan et al., 2000).
Headspace collection of ethylene. The sampling procedure and
subsequently injection of the sample into the GC column aretwo aspects that require careful consideration (Tholl et al.,2006). In GCs, a small volume of the gas sample is neededfor injecting into the column (typically having the inner diam-eter of 5 mm for packed columns and 250 mm for capillarycolumns, respectively). If too much of the sample is injected,the peaks of the chromatogram show a significant tailing,which causes a poorer separation (Bassi and Spencer, 1985).
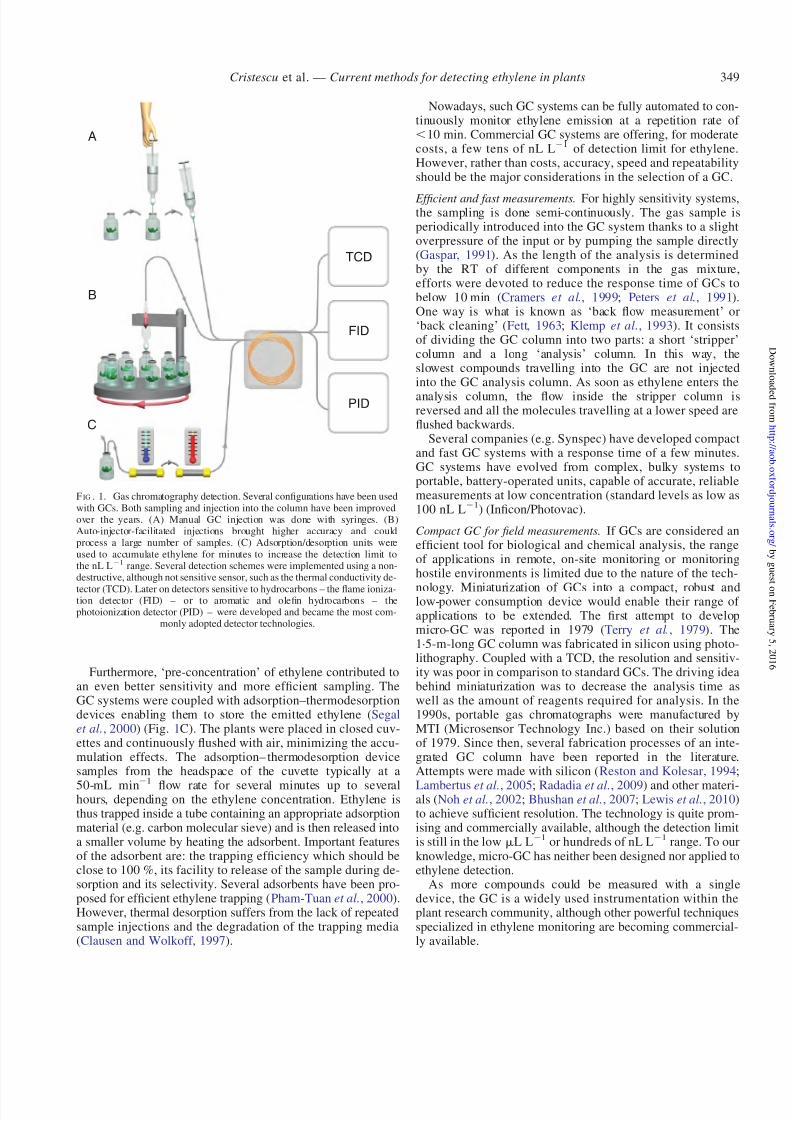
In the early 1970s, ethylene was sampled from the head-space of a closed cuvette, in which the plant was enclosedfor a few hours, and manually injected into the GC columnwith a gas-tight syringe (Abeles et al., 1992) (Fig. 1A).Although this is a simple technique, it was time consumingfor the analyst and not very reproducible as the sampled
amount could differ slightly; not to mention the induced-physiological impact on the plant material due to the enclosureneeded to obtain a high enough ethylene concentration. A so-lution was quickly developed, with automatic samplers con-nected to the GC raising the standard GC performance andreliability. In modern chromatography systems, concentricrotary valves allow a discrete sample to be automatically intro-duced into the column for separation (Fig. 1B). These samplersprovided accuracy, superior reproducibility, optimum injectionflexibility, reliability and were user-friendly. The use of valvesto switch between gas streams simplified the analyst’s work and made the GC more attractive.
Cristescu et al. — Current methods for detecting ethylene in plants348
7/21/2019 Current methods for detecting ethylene in plants
Furthermore, ‘pre-concentration’ of ethylene contributed toan even better sensitivity and more efficient sampling. TheGC systems were coupled with adsorption–thermodesorptiondevices enabling them to store the emitted ethylene (Segalet al., 2000) (Fig. 1C). The plants were placed in closed cuv-ettes and continuously flushed with air, minimizing the accu-mulation effects. The adsorption– thermodesorption devicesamples from the headspace of the cuvette typically at a
50-mL min21
flow rate for several minutes up to severalhours, depending on the ethylene concentration. Ethylene isthus trapped inside a tube containing an appropriate adsorptionmaterial (e.g. carbon molecular sieve) and is then released intoa smaller volume by heating the adsorbent. Important featuresof the adsorbent are: the trapping efficiency which should beclose to 100 %, its facility to release of the sample during de-sorption and its selectivity. Several adsorbents have been pro-posed for efficient ethylene trapping (Pham-Tuan et al., 2000).However, thermal desorption suffers from the lack of repeatedsample injections and the degradation of the trapping media(Clausen and Wolkoff, 1997).
Nowadays, such GC systems can be fully automated to con-tinuously monitor ethylene emission at a repetition rate of,10 min. Commercial GC systems are offering, for moderatecosts, a few tens of nL L21 of detection limit for ethylene.However, rather than costs, accuracy, speed and repeatabilityshould be the major considerations in the selection of a GC.
Efficient and fast measurements. For highly sensitivity systems,the sampling is done semi-continuously. The gas sample isperiodically introduced into the GC system thanks to a slightoverpressure of the input or by pumping the sample directly(Gaspar, 1991). As the length of the analysis is determinedby the RT of different components in the gas mixture,efforts were devoted to reduce the response time of GCs tobelow 10 min (Cramers et al., 1999; Peters et al., 1991).One way is what is known as ‘back flow measurement’ or‘back cleaning’ (Fett, 1963; Klemp et al., 1993). It consistsof dividing the GC column into two parts: a short ‘stripper’column and a long ‘analysis’ column. In this way, theslowest compounds travelling into the GC are not injectedinto the GC analysis column. As soon as ethylene enters the
analysis column, the flow inside the stripper column isreversed and all the molecules travelling at a lower speed areflushed backwards.
Several companies (e.g. Synspec) have developed compactand fast GC systems with a response time of a few minutes.GC systems have evolved from complex, bulky systems toportable, battery-operated units, capable of accurate, reliablemeasurements at low concentration (standard levels as low as100 nL L21) (Inficon/Photovac).
Compact GC for field measurements. If GCs are considered anefficient tool for biological and chemical analysis, the rangeof applications in remote, on-site monitoring or monitoringhostile environments is limited due to the nature of the tech-
nology. Miniaturization of GCs into a compact, robust andlow-power consumption device would enable their range ofapplications to be extended. The first attempt to developmicro-GC was reported in 1979 (Terry et al., 1979). The1.5-m-long GC column was fabricated in silicon using photo-lithography. Coupled with a TCD, the resolution and sensitiv-ity was poor in comparison to standard GCs. The driving ideabehind miniaturization was to decrease the analysis time aswell as the amount of reagents required for analysis. In the1990s, portable gas chromatographs were manufactured byMTI (Microsensor Technology Inc.) based on their solutionof 1979. Since then, several fabrication processes of an inte-grated GC column have been reported in the literature.Attempts were made with silicon (Reston and Kolesar, 1994;
Lambertus et al., 2005; Radadia et al., 2009) and other materi-als (Noh et al., 2002; Bhushan et al., 2007; Lewis et al., 2010)to achieve sufficient resolution. The technology is quite prom-ising and commercially available, although the detection limitis still in the low mL L21 or hundreds of nL L21 range. To ourknowledge, micro-GC has neither been designed nor applied toethylene detection.
As more compounds could be measured with a singledevice, the GC is a widely used instrumentation within theplant research community, although other powerful techniquesspecialized in ethylene monitoring are becoming commercial-ly available.
TCD
FID
PID
A
B
C
F IG . 1. Gas chromatography detection. Several configurations have been usedwith GCs. Both sampling and injection into the column have been improvedover the years. (A) Manual GC injection was done with syringes. (B)Auto-injector-facilitated injections brought higher accuracy and couldprocess a large number of samples. (C) Adsorption/desorption units wereused to accumulate ethylene for minutes to increase the detection limit tothe nL L21 range. Several detection schemes were implemented using a non-destructive, although not sensitive sensor, such as the thermal conductivity de-
tector (TCD). Later on detectors sensitive to hydrocarbons – the flame ioniza-tion detector (FID) – or to aromatic and olefin hydrocarbons – thephotoionization detector (PID) – were developed and became the most com-
monly adopted detector technologies.
Cristescu et al. — Current methods for detecting ethylene in plants 349
7/21/2019 Current methods for detecting ethylene in plants
Small sample requirementsHigh selectivity, good at separating complex mixtures and
compoundsFast analysis (minute time scale)Easy to operate (fully automated)
Portable GCs available for field measurements
Disadvantages of the GC Limited sensitivityRequires a pre-concentration step for better sensitivity and
optimized plant conditionsHigh costs for the highest performing systems
Electrochemical sensors
Various electrochemical devices, e.g. for measuring pH oroxygen, have been routinely used in the past. Recent advancesin electrochemical sensor technology have expanded the appli-cation of these devices towards a wide range of compounds,
including ethylene.An electrochemical sensor transforms the concentration of a
gas into a detectable physical signal such as: electrical current,resistance, etc. In detail, the target gas undergoes a chemicalreaction with the active sensing material, which in the presenceof an electrical circuit will generate a change in an electricalparameter (Bard and Faulkner, 1980). Electrochemical sensorscan be classified accordingly to the physical change measured.If the measurand is current (A) we refer to ‘amperometricsensors’, where we measure resistance (V) we refer to‘chemoresistive sensors’ and if we measure a change in capaci-tance the sensors are referred to as ‘capacitive’ (Janata, 2009).Below, these three groups of electrochemical sensors willbe discussed as they are the most popularly employed for
ethylene monitoring.
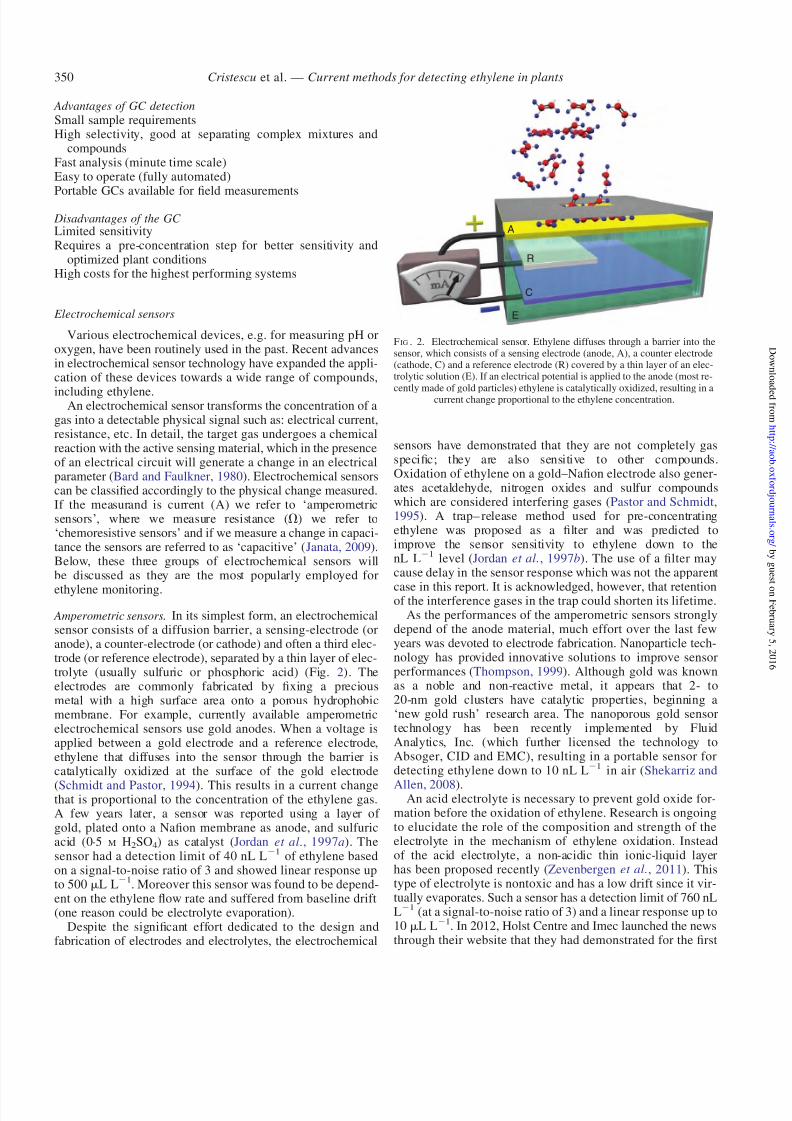
Amperometric sensors. In its simplest form, an electrochemicalsensor consists of a diffusion barrier, a sensing-electrode (oranode), a counter-electrode (or cathode) and often a third elec-trode (or reference electrode), separated by a thin layer of elec-trolyte (usually sulfuric or phosphoric acid) (Fig. 2). Theelectrodes are commonly fabricated by fixing a preciousmetal with a high surface area onto a porous hydrophobicmembrane. For example, currently available amperometricelectrochemical sensors use gold anodes. When a voltage isapplied between a gold electrode and a reference electrode,ethylene that diffuses into the sensor through the barrier iscatalytically oxidized at the surface of the gold electrode
(Schmidt and Pastor, 1994). This results in a current changethat is proportional to the concentration of the ethylene gas.A few years later, a sensor was reported using a layer of gold, plated onto a Nafion membrane as anode, and sulfuricacid (0.5 M H2SO4) as catalyst (Jordan et al., 1997a). Thesensor had a detection limit of 40 nL L2
1of ethylene based
on a signal-to-noise ratio of 3 and showed linear response upto 500 mL L2
1. Moreover this sensor was found to be depend-
ent on the ethylene flow rate and suffered from baseline drift(one reason could be electrolyte evaporation).
Despite the significant effort dedicated to the design andfabrication of electrodes and electrolytes, the electrochemical
sensors have demonstrated that they are not completely gasspecific; they are also sensitive to other compounds.Oxidation of ethylene on a gold–Nafion electrode also gener-ates acetaldehyde, nitrogen oxides and sulfur compoundswhich are considered interfering gases (Pastor and Schmidt,1995). A trap– release method used for pre-concentratingethylene was proposed as a filter and was predicted toimprove the sensor sensitivity to ethylene down to thenL L21 level (Jordan et al., 1997b). The use of a filter maycause delay in the sensor response which was not the apparent
case in this report. It is acknowledged, however, that retentionof the interference gases in the trap could shorten its lifetime.
As the performances of the amperometric sensors stronglydepend of the anode material, much effort over the last fewyears was devoted to electrode fabrication. Nanoparticle tech-nology has provided innovative solutions to improve sensorperformances (Thompson, 1999). Although gold was knownas a noble and non-reactive metal, it appears that 2- to20-nm gold clusters have catalytic properties, beginning a‘new gold rush’ research area. The nanoporous gold sensortechnology has been recently implemented by FluidAnalytics, Inc. (which further licensed the technology toAbsoger, CID and EMC), resulting in a portable sensor fordetecting ethylene down to 10 nL L21 in air (Shekarriz and
Allen, 2008).An acid electrolyte is necessary to prevent gold oxide for-
mation before the oxidation of ethylene. Research is ongoingto elucidate the role of the composition and strength of theelectrolyte in the mechanism of ethylene oxidation. Insteadof the acid electrolyte, a non-acidic thin ionic-liquid layerhas been proposed recently (Zevenbergen et al., 2011). Thistype of electrolyte is nontoxic and has a low drift since it vir-tually evaporates. Such a sensor has a detection limit of 760 nLL21 (at a signal-to-noise ratio of 3) and a linear response up to10 mL L21. In 2012, Holst Centre and Imec launched the newsthrough their website that they had demonstrated for the first
A
R
C
E
F IG . 2. Electrochemical sensor. Ethylene diffuses through a barrier into thesensor, which consists of a sensing electrode (anode, A), a counter electrode(cathode, C) and a reference electrode (R) covered by a thin layer of an elec-trolytic solution (E). If an electrical potential is applied to the anode (most re-
cently made of gold particles) ethylene is catalytically oxidized, resulting in acurrent change proportional to the ethylene concentration.
Cristescu et al. — Current methods for detecting ethylene in plants350
7/21/2019 Current methods for detecting ethylene in plants
time the use of this electrolyte in a single-chip electrochemicalsensor, monitoring ethylene with 100-nL L21 step changes in aconcentration range below 1 mL L21; the detection limit of thesensor was 200–300 nL L21.
Oxygen is an essential ingredient in the reaction with the gasand in maintaining the generated current when ethylene is
present. If the oxygen supply is inadequate, the sensor willnot operate properly, thus the sensor cannot be used forcertain applications. Measurements in low-oxygen conditionscan be performed if a separate access of air to the counter-electrode is available.
Interestingly, electrochemical sensors have been indicated assuitable for post-harvest storage under low-oxygen conditions.Obviously, the main considerations for this choice were theirlow cost, small size (some sensors are portable) and lowpower consumption. However, in the agricultural sector, tomonitor ethylene down to tens of nL L21
becomes moredemanding. Softening of kiwifruit in the presence of ethyleneat levels as low as 10 nL L2
1in ambient storage air represents
a critical issue (Pranamornkith et al., 2012).
Chemoresistive sensors. The use of a liquid electrolyte makesthis sensor sensitive to environmental conditions such as tem-perature and humidity. Novel types of electrochemical sensorsare currently being developed using carbon nanotubes (i.e.sheets of carbon atoms rolled into cylinders that act as ‘super-highways’ for an electron flow) or SnO2 (tin dioxide) nanopar-ticles (Fig. 3). The first type of sensor is a chemoresistancesensor: the active sensing material is a mixture of carbon nano-tubes and a copper complex placed between gold electrodes.Ethylene binds to the copper complex (known as the electricalconductor), changing the resistance of the nanotubes (Esseret al., 2012). According to the authors the choice for copperwas inspired by the role of copper as a cofactor for ethylene-
binding activity in the ethylene receptors. This sensor allowsdetection of ethylene concentrations as low as 0.5 mL L21.
Capacitive sensors. The second typeof sensor is a capacitor-basedsensor at room temperature. The active sensing material is SnO2
nanoparticles (10– 15 nm in diameter) used as a dielectric mater-ial between two copper electrodes (Balachandran et al., 2008).Inthe presence of ethylene the capacitance of the sensor is changed;ethylene concentrations in the range from 1 mL L21 to thousands
of mL L
21
can be measured. The addition of a palladium/platinumlayer between the nanoparticles and the metals resulted inincreased sensitivity, but the sensor showed a faster degradation(Straumal et al., 2010). The use of this kind of sensor would bedesirable due to its low power consumption and short responsetimes of a few minutes. Moreover the sensor can be integratedwith a microstrip patch antenna for passive wireless detection ofethylene gas. The sensor also responds strongly to other, interfer-ing compounds such as ethanol, acetic acid, ammonia, acetoneand ethyl acetate and to humidity changes.
In general, the operating lifetime of electrochemical sensorsdepends on the sensor type, which can vary from 6 months toover 2 years. The lifetime is shortened by a variety of environ-mental factors, such as low humidity, high temperatures (as the
electrolyte may dry out) and exposure to the target gas and gasinterferences (consumption of electrolyte). Electrochemicalcells are active even when they are stored; therefore, theyhave a limited lifetime even when not in use. It is recom-mended to keep them in a refrigerator when not in use.
Electrochemical sensor technology is a proven technologyand, like any other technology, it has its advantages anddisadvantages.
Advantages of electrochemical sensor technology
Ethylene gas specific in a mL L21 down to tens of nL L21
rangeGood repeatability and accuracyRelatively fast response time to ethylene (below 1 min) and
recovery time of minutesLow power consumptionLightweight (2.5– 10 kg)Low costPortable and easy to use in laboratory or field conditions (some
are battery operated up to max. 8 h)
Disadvantages of electrochemical sensor technology.
Sensitive to interfering gasesSensitivity to temperature and humidity changesLimited temperature rangeRequires oxygen to operate correctlyLimited shelf-lifeReduced lifetime when continuously exposed to higher
ethylene concentrations
A challenge remains where, on one hand, the electrochem-ical sensor works better at higher ethylene concentrations(by overruling the influence of the interfering gases) and, onthe other hand, continuous operation over several daysexhausts the anode and affects the sensitivity.
Optical gas sensors. When light interacts with ethylene mole-cules it can be absorbed, emitted or scattered. Ethylene, likemany other molecular gases, has its specific absorption charac-teristics, which are the strongest in the mid-infrared (IR)
Ethylene
Potentiostat
1 mm
1-SWNTmixture
Goldelectrodes
Change inresistance
F IG . 3. Chemoresistance sensor. The sensing material is a mixture of single-walled carbon nanotubes (SWNTs) and copper complex placed betweengold electrodes. Ethylene binds to the copper complex, changing theresistance of the nanotubes according to the gas concentration (adapted from
Esser et al., 2012).
Cristescu et al. — Current methods for detecting ethylene in plants 351
7/21/2019 Current methods for detecting ethylene in plants
region; the so-called fingerprint region (2–12 mm). Byknowing the absorption strength of ethylene at a specific IRlight frequency, the molecular ethylene concentration can bequantified.
There are several schemes of such sensors and generally
they can be classified as dispersive or non-dispersive sensors(Fig. 4).Typically, an optical sensor consists of an appropriate light
source (IR lamp or laser) that passes through an absorption cellcontaining the ethylene sample and reaches an optical detectorthat measures the light intensity. Obviously, the light sourcehas to be chosen in the wavelength region where ethylenehas absorption features. The measured intensity of the trans-mitted light is altered due to the light absorption of the ethyl-ene molecules and from this change the ethylene concentrationcan be determined.
Non-dispersive sensors. In the non-dispersive infrared (NDIR)instruments, as all the ‘wavelengths’ from a broadbandsource are considered at the same time without separation,the absorption spectrum cannot be resolved. An importantelement for the NDIR sensors is their band-pass filter. Thisis necessary to increase the sensor selectivity for ethylene
and to attenuate the undesired absorbents. Like the electro-chemical sensors, NDIR devices also suffer from lack of se-lectivity. Although they are simple and robust, NDIRinstruments have limited sensitivity because the measuredtransmitted light can also be affected by the absorptions of other gases A possible solution to this problem is to use asingle source and two identical detectors with two filters:one for measuring ethylene and the other for all (also interfer-ing) gases.
Presently, there are NDIR sensors based on photoacousticspectroscopy manufactured by LumaSense Technologies andGasera Ltd (Fig. 5A). This is a simple approach in whichethylene released by a biological sample is transported to theabsorption cell (in this case called the photoacoustic cell).
Once inside it absorbs the light of a pre-selected wavelengthand converts it into heat. By modulating the light (switchingthe light on and off with a certain frequency) with a mechan-ical chopper, pressure waves (i.e. sound) are generated anddetected with sensitive, miniature microphone(s). The ampli-tude of the waves is proportional to the concentration of ethyl-ene in the photoacoustic cell (Kreuzer, 1977).
These NDIR sensors need multiple narrow-band opticalfilters that can be mounted in a filter wheel (Fig. 5A). Thefilters are chosen for ethylene as well as for the interferinggases; the data analysis is performed using a mathematicalmodel based on non-linear compensation. If you desire tomeasure solely ethylene, you will need to also consider pur-chasing gas filters to remove interference gases (price
increases proportionally). The detection limits are in mL L21
and few hundreds of nL L21
level (100 nL L21
in nitrogen
Non-dispersive
Dispersive
Broadband
Laser-based
Others
Photoacoustics
Photoacoustics
F IG . 4. Classification of the optical gas sensors. In the non-dispersive sensorsthe light source used for gas absorption is broadband and multiple narrow-bandoptical filters are required for detecting ethylene by subtracting the interferencegases. The dispersive broadband sensors have dispersive elements, such asprisms to separate the wavelengths. The laser-based optical sensors are using
lasers to selectively excite the ethylene molecules and sensitive detectionmethods (i.e. photoacoustics) for fast detection at low concentrations.
Multiple species
mL L–1
>100 nL L–1
Single gas
Ethylene< 1 nL L–1
A
B
F IG . 5 . Non-dispersive versus laser-based sensor using photoacoustic spectroscopy. Light is generated by a broadband source passed through a filter wheel(A) or by a laser (B) and directed into an absorption cell where it is absorbed by the ethylene molecules and converted into heat. By switching the light onand off with a mechanical chopper the temperature changes periodically, giving rise to a periodic pressure change, resulting in acoustic energy detected by aminiature microphone. The intensity of the sound is proportional to the concentration of absorbing gas molecules present in the cell. The non-dispersivesensors detect multiple species at concentrations of mL L21of hundreds of nL L21 levels (e.g. ethylene and the interfering gases) using optical filters. The laser-
based sensors, using a single-frequency light source, are more selective and provide the lowest detection limits so far.
Cristescu et al. — Current methods for detecting ethylene in plants352
7/21/2019 Current methods for detecting ethylene in plants
with a noise level of 0.05 mL L21 for LumaSense Techn. andsub-mL L21 for Gasera Ltd ethylene sensor).
In a different configuration from Gasera Ltd the mechanicalchopper is replaced by a low-power electrically pulsedIR-source such as a diode laser, and the microphone used isa patented cantilever pressure sensor.
The sensors have the advantages of a low sample volume of 10–30 mL, are transportable and provide simultaneous quanti-tative analysis of more gas compounds over a large dynamicrange.
Broadband dispersive sensors. Some dispersive sensors makeuse of a prism or diffraction grating to disperse a spectrallybroadband source such as an IR lamp (Kneubuhi et al.,1966). In this way a wide range of wavelengths may be pro-vided. Each wavelength is changed by rotating the dispersiveelement and monitoring their intensities; by this method an
absorption spectrum (light intensity vs. frequencies) ofcertain molecules can be obtained. These are broadband ana-lytical instruments, usually bulky and complex and used formolecular spectroscopy purposes, which make them too ex-pensive for single-component detection.
Laser-based sensors. Other dispersive sensors are founded onlaser-based sensing techniques. They take the advantage ofusing tuneable lasers to selectively emit in the absorptionrange of ethylene in combination with detection techniques,such as photoacoustic spectroscopy (Fig. 5B) or cavity ring-down spectroscopy. This results in unprecedented detectionlimits and a short response time, which no other devices canachieve, namely nL L21 and sub-nL L21 levels in seconds/minutes time scale.
The main advantages of the photoacoustic detection overother laser-based techniques are simple design, high
ETD
Samples
SrcVC
Air
Cat
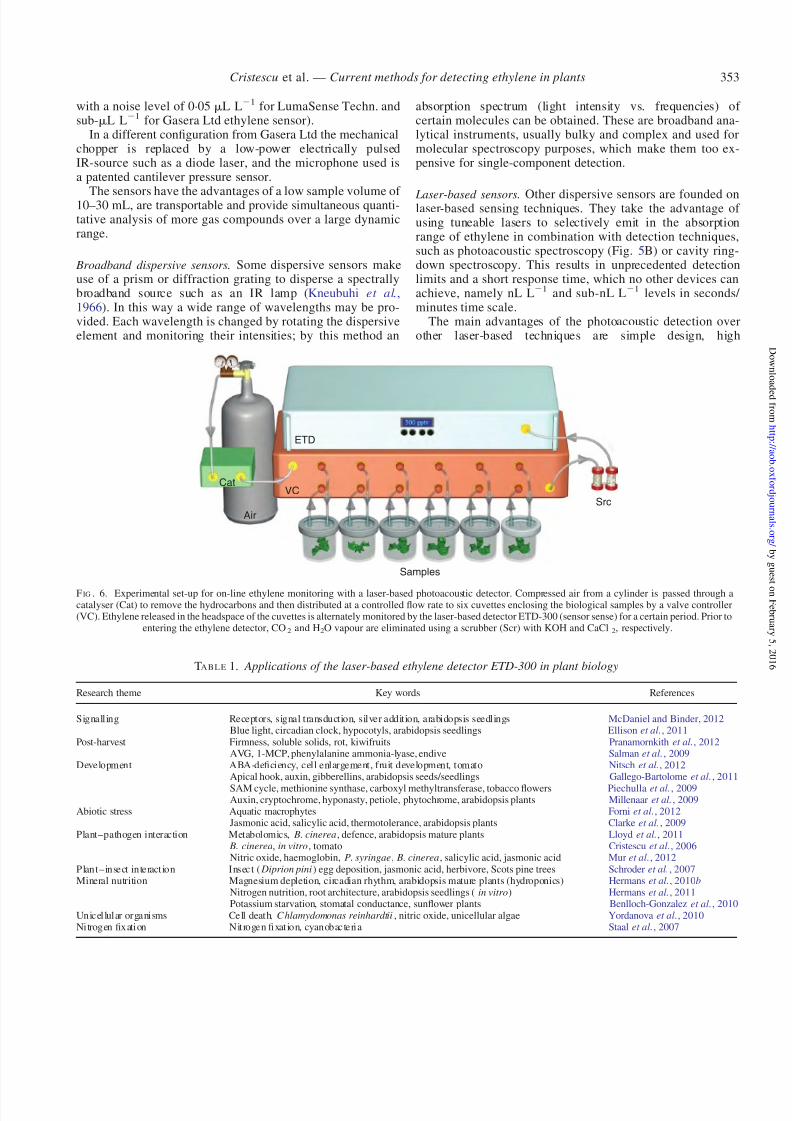
F IG . 6. Experimental set-up for on-line ethylene monitoring with a laser-based photoacoustic detector. Compressed air from a cylinder is passed through acatalyser (Cat) to remove the hydrocarbons and then distributed at a controlled flow rate to six cuvettes enclosing the biological samples by a valve controller(VC). Ethylene released in the headspace of the cuvettes is alternately monitored by the laser-based detector ETD-300 (sensor sense) for a certain period. Prior to
entering the ethylene detector, CO2 and H2O vapour are eliminated using a scrubber (Scr) with KOH and CaCl2, respectively.
TA B L E 1. Applications of the laser-based ethylene detector ETD-300 in plant biology
Research theme Key words References
Signalling Receptors, signal transduction, silver addition, arabidopsis seedlings McDaniel and Binder, 2012Blue light, circadian clock, hypocotyls, arabidopsis seedlings Ellison et al., 2011
Post-harvest Firmness, soluble solids, rot, kiwifruits Pranamornkith et al., 2012AVG, 1-MCP, phenylalanine ammonia-lyase, endive Salman et al., 2009
Development ABA-deficiency, cell enlargement, fruit development, tomato Nitsch et al., 2012Apical hook, auxin, gibberellins, arabidopsis seeds/seedlings Gallego-Bartolome et al., 2011
SAM cycle, methionine synthase, carboxyl methyltransferase, tobacco flowers Piechulla et al., 2009Auxin, cryptochrome, hyponasty, petiole, phytochrome, arabidopsis plants Millenaar et al., 2009
Abiotic stress Aquatic macrophytes Forni et al., 2012Jasmonic acid, salicylic acid, thermotolerance, arabidopsis plants Clarke et al., 2009
Plant–pathogen interaction Metabolomics, B. cinerea, defence, arabidopsis mature plants Lloyd et al., 2011 B. cinerea, in vitro, tomato Cristescu et al., 2006Nitric oxide, haemoglobin, P. syringae, B. cinerea, salicylic acid, jasmonic acid Mur et al., 2012
Plant–insect interaction Insect ( Diprion pini) egg deposition, jasmonic acid, herbivore, Scots pine trees Schroder et al., 2007Mineral nutrition Magnesium depletion, circadian rhythm, arabidopsis mature plants (hydroponics) Hermans et al., 2010b
Nitrogen nutrition, root architecture, arabidopsis seedlings (in vitro) Hermans et al., 2011Potassium starvation, stomatal conductance, sunflower plants Benlloch-Gonzalez et al., 2010
Unicellular organisms Cell death, C hlamydomonas reinhardtii, nitric oxide, unicellular algae Yordanova et al., 2010Nitrogen fixation Nitrogen fixation, cyanobacteria Staal et al., 2007
Cristescu et al. — Current methods for detecting ethylene in plants 353
7/21/2019 Current methods for detecting ethylene in plants
sensitivity, wide linear dynamic range, fast response and lowsample volume. The technique has been described in detailelsewhere including a comprehensive list of applications(Harren et al., 2012).
At the Life Science Trace Gas Facility (Nijmegen, TheNetherlands), the potential of this technique has been fully
exploited since the 1990s. Since the sensitivity of thismethod strongly depends on laser power, a high powersource has to be employed, such as the CO2 laser (Watts’slaser power), to reach very low detection limits. Moreover, itis a fortunate coincidence that ethylene displays the highest ab-sorption strength in the emission range of the CO2 laser at10 mm. Using these features, the laboratory-developed set-upwas capable of measuring ethylene in a continuous flowsystem down to 10 pL L21 over 90 s (Cristescu et al., 2006).
In close collaboration with biologists, the system was usedover the years to monitor various dynamic processes inplants and micro-organisms. Thanks to this excellent sensitiv-ity and rapid time response, fast processes in plants wererevealed and real-time measurements from a single plant or
plant organ were possible without accumulation periods(Cristescu et al., 2006; Harren et al., 2012).Only recently has the development of these detectors moved
towards commercial instruments (ETD-300, Sensor Sense BV)(Fig. 6). This detector has a detection limit of 300 pL L21
within a 5-s measuring time, at the moment the best-achievedsensitivity worldwide. From this limit its dynamic range goesup to 5 mL L21 (or optionally to 300 mL L21). In addition,data handling software makes external data processing user-friendly for non-laser specialists. In combination with a gashandling system that includes mass flow controllers and elec-tronic valves to perform switching between various cuvettes(up to six) containing biological samples, this detector is apowerful tool for continuous on-line measurements for long
periods of time (weeks, months). An overview list with mostrecent applications of this detector is given in Table 1.
The main advantage of laser-based detectors is their highsensitivity and selectivity as compared with the other detectiontechniques mentioned previously. This relies on the choice of the laser and its combination with the detection technique.When no high power source is available, other lasers can beused (e.g. diode lasers) in combination with other optical spec-troscopic techniques, such as cavity ring-down spectroscopy orcavity-enhanced absorption spectroscopy. Both methods useoptical cavities consisting of two mirrors with high reflectivitythat allow light to travel an extended optical path (up to kilo-metres) inside a small volume, increasing the interactions withthe ethylene molecules. Such an instrument was developed by
Picarro and tested in trace gas ethylene monitoring in ambientair in a cold storage room of a fruit-packing facility over aseveral-month period (Wahl et al., 2006). The detection limitwas 2 nL L21 in 5 s.
Recent advances in the fabrication of mid-IR sources suchas quantum cascade lasers (Faist et al., 1994; Curl et al.,2010) operating at room temperature opened new opportunitiesfor development of quantum cascade laser-based ethylenedetectors (Weidmann et al., 2004). Different absorption techni-ques can be combined with such lasers, as previously demon-strated by J. Tulip’s group who obtained a detection limit forethylene of 20 nL L2
1in an average time of 5 s (Manne
et al., 2010) and 5 nL L21 in ,10 s (Manne et al., 2008).Although such sensors are not yet in use for monitoringethylene from plants, this type of laser is very promising interms of system integration (Harren et al., 2012).
Advantages of laser-based sensors
Highest sensitivity (below nL L21)
Fastest response time (seconds)Good selectivityReal-time monitoring
A
C
B
D 1·0
0·8
0·6
E t h y l e n e p r o d u c t i o n
( n g C
2 H
4
h – 1 g
– 1 f .
w t )
0·4
0·2
00 4 8 12
Time (h)
16 20 24
+Mg
–Mg
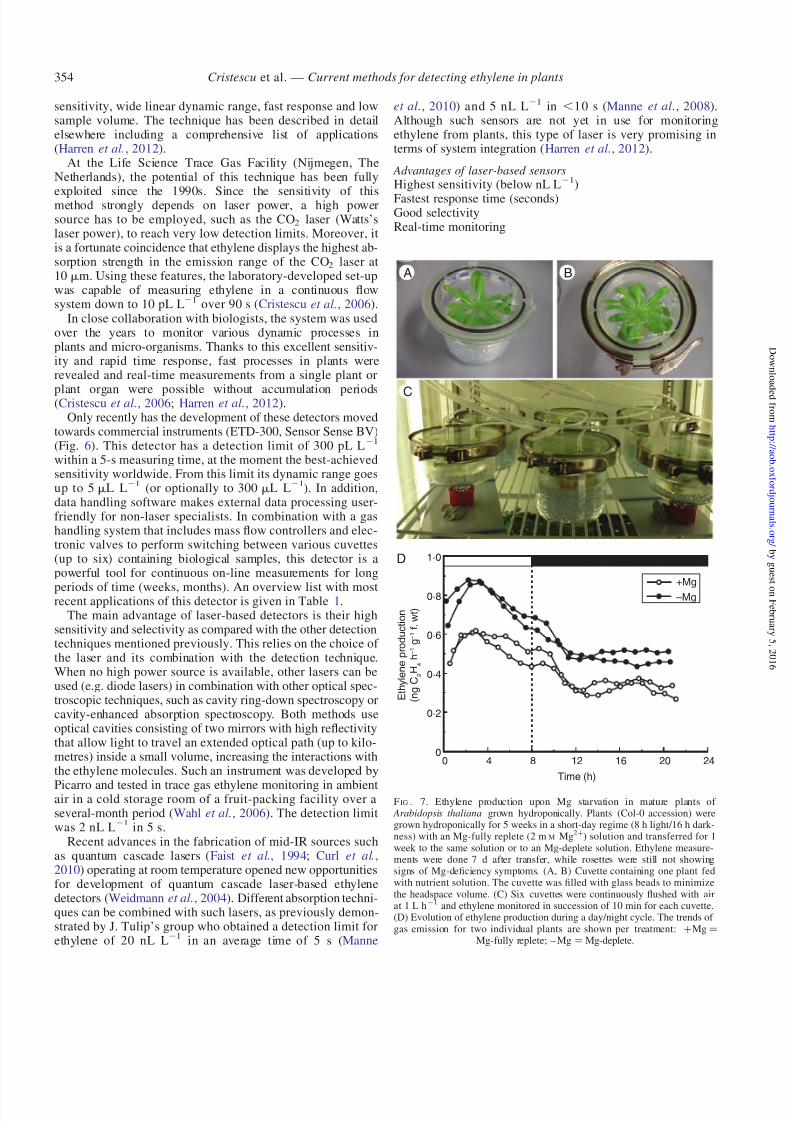
F IG . 7. Ethylene production upon Mg starvation in mature plants of Arabidopsis thaliana grown hydroponically. Plants (Col-0 accession) weregrown hydroponically for 5 weeks in a short-day regime (8 h light/16 h dark-ness) with an Mg-fully replete (2 mM Mg2+) solution and transferred for 1week to the same solution or to an Mg-deplete solution. Ethylene measure-ments were done 7 d after transfer, while rosettes were still not showingsigns of Mg-deficiency symptoms. (A, B) Cuvette containing one plant fedwith nutrient solution. The cuvette was filled with glass beads to minimizethe headspace volume. (C) Six cuvettes were continuously flushed with airat 1 L h21 and ethylene monitored in succession of 10 min for each cuvette.(D) Evolution of ethylene production during a day/night cycle. The trends of gas emission for two individual plants are shown per treatment: +Mg¼
Mg-fully replete; – Mg¼Mg-deplete.
Cristescu et al. — Current methods for detecting ethylene in plants354
7/21/2019 Current methods for detecting ethylene in plants
Application: sensitive and fast ethylene monitoring. Due to theirhigh sensitivity and fast response time the laser-based detec-tors can detect traces of ethylene emitted in various plant pro-cesses, thus making possible the transition from post-harvestresearch, requiring hundreds and tens of nL L21 detectionlevels to fundamental research in plant physiology that requiresmonitoring of nL L21 and sub-nL L21 concentrations. As anexample, we will take the recording of ethylene production
from Arabidopsis thaliana under the depletion of two majoressential elements (nitrogen and magnesium), to illustrate thesuitability of the laser-based detectors for plant-physiology re-search. The detector (ETD-300; Sensor Sense) in combinationwith the gas handling system allows ethylene monitoring inthree operation modes, namely continuous flow, stop-and-flow
and sampling, respectively (Fig. 6).Research into the roles of ethylene in signalling nutrientimbalances and in morphological and physiological responsesof plants to mineral resource fluctuations is gaining interest.Interrelation between ethylene and mineral nutrition is fre-quently reported (Rubio et al., 2009; Verbruggen andHermans, 2012). In particular, modulation of the expressionlevels of several genes encoding enzymes in the ethylene bio-synthesis, namely 1-aminocyclopropane-1-carboxylic acid
A
C D
B
12 10 6
5
4
3
2
1
0
8
6
4
2
0
10
8
6
4
2
0+Mg –Mg +Mg –Mg +Mg –Mg
L R
n u m b e r
P R
l e n g t h ( c m )
E t h y l e n e p
r o d u c t i o n ( n g C
2 H
4
h – 1 g
– 1 f .
w t )
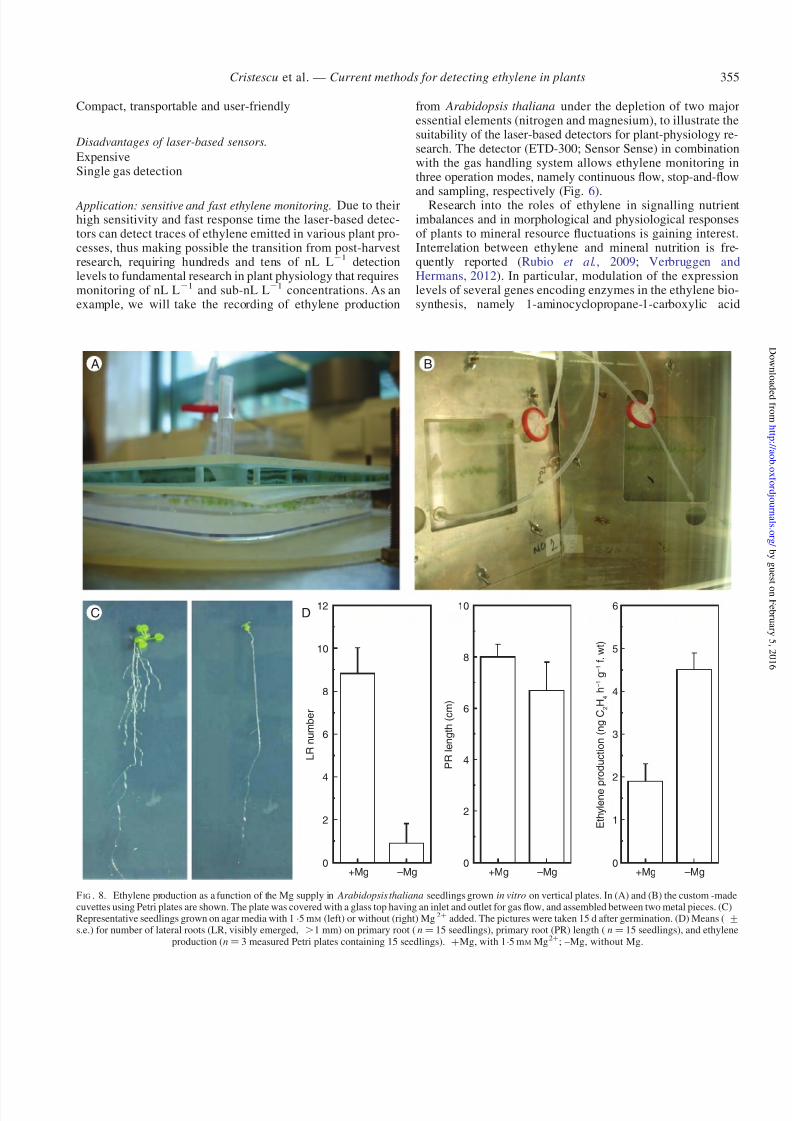
F IG . 8. Ethylene production as a function of the Mg supply in Arabidopsis thaliana seedlings grown in vitro on vertical plates. In (A) and (B) the custom -madecuvettes using Petri plates are shown. The plate was covered with a glass top having an inlet and outlet for gas flow, and assembled between two metal pieces. (C)Representative seedlings grown on agar media with 1.5 mM (left) or without (right) Mg2+ added. The pictures were taken 15 d after germination. (D) Means (+s.e.) for number of lateral roots (LR, visibly emerged, .1 mm) on primary root (n¼ 15 seedlings), primary root (PR) length (n¼ 15 seedlings), and ethylene
production (n¼ 3 measured Petri plates containing 15 seedlings). +Mg, with 1.5 mM Mg2+; –Mg, without Mg.
Cristescu et al. — Current methods for detecting ethylene in plants 355
7/21/2019 Current methods for detecting ethylene in plants
synthases and ethylene production were observed upon fluctu-ation of nitrogen (Khan et al., 2008; Tian et al., 2009; Iqbalet al., 2011) and magnesium (Hermans et al., 2010a, b) sup-plied to the plant.
Continuous flow. Up to six cuvettes with biological samples arecontinuously flushed with air at a constant flow rate of 1 l h21
(Fig. 6). Ethylene released in the headspace is transported to
the ETD-300 alternately, allowing a succession of typically10 min for each cuvette. In this way, the dynamics of the ethyl-ene emission can be studied in sufficient detail over severalhours or for an even longer period. Here, we measured ethyl-ene evolution of arabidopsis rosettes subjected to Mg depletion(Fig. 7); their growth conditions are described in detail else-where (Hermans et al., 2010b). Briefly, 5-week-old plants Arabidopis thaliana (Col-0), grown hydroponically, weretransferred to Mg-depleted nutrient solution for 7 d. At theend of the treatment, ethylene production was doubled inMg-starved plants compared with control ones (Fig. 7D).A possible implication of ethylene as a response to Mg short-age could be via adaptation of the photosynthetic apparatus(Hermans et al., 2010b).
Stop-and-flow. In some applications, the plant biomass is verysmall and the ethylene concentration is below the nL L21
level. Therefore, in a stop-and-flow mode, ethylene isallowed to accumulate for a period of time (e.g. 1 h) before
it is transported to the ethylene detector. While ethylenefrom a cuvette is measured (typically 15–30 min) no airflow is applied to the other cuvettes, hence optimizing themeasurement efficiency. As such an ethylene production aslow as 40 pL h2
1can be recorded. To illustrate that procedure,
the ethylene production of very young seedlings, grownin vitro vertically on agar media was measured (Fig. 8A–C).Agar media (0.8 % w/v) contained 1× MS strength with
10 mM NO3
2
as the sole source of nitrogen. Fifteen days aftergermination, ethylene production was doubled in Mg-starvedseedlings, which had smaller shoots and fewer lateral rootsthan control seedlings (Fig. 8D). Ethylene is identified as acentral actor in shaping root architecture upon mineralelement fluctuation (Tian et al., 2009; Hermans et al., 2011;Verbruggen and Hermans, 2012). Further characterization ofthe involvement of ethylene in the response to Mg limitationis essential.
Sample mode approach. Other applications require multiplesamples to be screened. Ethylene production needs to be quan-tified once per sample, rather than monitored over time. Usingthe sample mode approach, ethylene production of arabidopsis
seedlings, grown at two different nitrogen supplies, was mea-sured. Six seedlings (Col-0) were grown in vitro in small vials(10 mL) for 2.5 weeks at a continuous light regime. Agarmedia (0.8 % w/v) contained 1× MS strength with 0.1 or10 mM NO3
2 as the sole source of nitrogen (J. De Pessemier
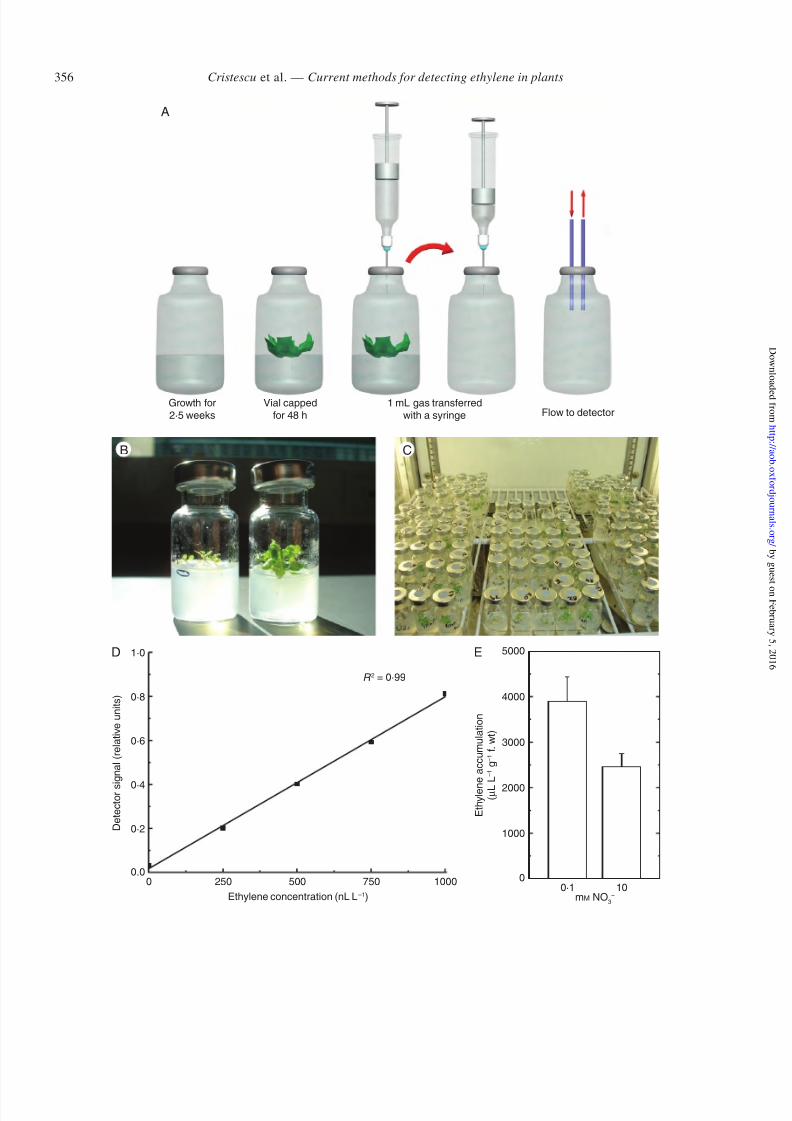
F IG . 9 . Ethylene production as a function of the nitrate supply in Arabidopsis thaliana seedlings grown in vitro in small vials. (A) Summary of the experimentalprocedure. Six seedlings (Col-0 accession) were gown in vitro in small vials (10 mL) for 2.5 weeks with a continuous light regime. Vials were capped for 48 h andthen 1 mL was extracted with a syringe and injected into an empty vial. Vials were stored prior to their content flowing to the detector. (B) Picture of capped vialswith plants grown at 0.1 mM (left) and 10 mM (right) NO3
2
. (C) Analysing the gas content of a vial with flow inlet and outlet. (D) Calibration curve with ethylenestandards for these conditions. (E) Ethylene accumulation of seedlings grown at 0 .1 and 10 mM NO3
2 (n¼ 3 measured vials,+ s.e.). Fresh biomass was 13+2 mg or 41+11 mg for six pooled seedlings grown at 0.1 or 10 mM NO3
2, respectively.
1000
100
R e s p o n s e t i m e ( s )
10
10·1 1
Laser-based
Non-dispersive
Price (k )
GCs
10
Sensitivity (nL L
–1
)
100
40
30
20
10
1000
Electrochemical
F IG . 10 . Comparison of different sensors described in this study. Gas chromatographs, electrochemical sensors and non-dispersive and laser-based sensors arecompared in terms of sensitivity ( x-axis) and response time ( y-axis). The colours are indicative of prices for the existing commercial devices. Note: the prices for
GCs do not include an automatic sampler unit.
Cristescu et al. — Current methods for detecting ethylene in plants 357
7/21/2019 Current methods for detecting ethylene in plants
et al., unpubl. res.). Vials were capped for 48 h and then 1 mLwas extracted with a syringe and injected to an empty vial(Fig. 9A). The advantage of this procedure is that largeamount of samples can be collected within a short timeperiod and that vials can be stored prior to flowing theircontent into the detector (Fig. 9B, C). The detector was cali-
brated with known ethylene concentrations under similar gastransfer procedure (Fig. 9D). The biomass of seedlingsgrown with a low nitrate supply was almost three timeslower than those grown with a high nitrate supply, while ethyl-ene production was only one-third higher under the same con-ditions (Fig. 9E). Ethylene involvement has been linked withfeatures critical for the improvement of the efficiency of nitro-gen use by crops, namely the control of biomass productionand the timing for senescence induction (J. De Pessemieret al., unpubl. res.). The biodiversity in ethylene emissionoffered by a large set of natural arabidopsis populations canbe exploited for a better understanding of the controlling func-tion of ethylene over biomass production at low nitrogen input.
C O N C LU S I O N S A N D O U TLO O K
Several types of sensors for monitoring ethylene production inplants were presented. Ideally, a sensor should monitor ethyl-ene quickly, sensitive, with high selectivity and should beavailable at low costs. Unfortunately, such a sensor does notexist at the moment (Fig. 10). Therefore it is important toreview your application information carefully, before decidingon the best-suited technology. Different applications requiredifferent solutions. If sensitivity and real-time analysis arerequired laser-based sensors should be considered. If less sen-sitivity and selectivity is needed, but portability is most im-portant, electrochemical sensors are recommended. Whenmore gases need to be measured, then a GC system is bettersuited.
Each type of sensor presented in this review has its own fieldof applications. The technical challenges for the future mayinclude the improvement of sensitivity, selectivity and measur-ing time. One might imagine a faster GC system, a more se-lective electrochemical sensor or even a more sensitivelaser-based detector. To fulfil such goals, new materials haveto be designed and new laser sources must be developed.
A C K N O W LED G EM EN TS
The authors thank M. B. Jackson for the invitation to write thispaper and the three anonymous reviewers for their constructive
comments. Furthermore, we thank S. te Lintel Hekkert for theexperimental support, Phil Brown for carefully reading themanuscript and C. Sikkens, L. Gerritsen and P. Claus for tech-nical assistance. This work was supported by the GO-EFRO‘Ultragas – gas analysis systems for quality control of agricul-tural products and medical diagnostics’ (project no.2009-010034), Q-Detect: FP7-KBBE-2009-3 ‘Developingquarantine pest detection methods for use by national plantprotection organizations (NPPO) and inspection services’(project no. 245047) and the EU-FP6-Infrastructures-5program, project FP6-026183 ‘Life Science Trace GasFacility’.
LI TER A TU R E C I TED
Abeles FB. 1972. Biosynthesis and mechanism of action of ethylene. Annual
Review of Plant Physiology 23: 259–292.
Abeles FB, Morgan PW, Saltveit MEJ. 1992. Ethylene in plant biology. San
Diego, CA: Academic Press.
Adams DO, Yang SF. 1979. Ethylene biosynthesis: identification of
1-aminocyclopropane-1-carboxylic acid as an intermediate in the conver-
sion of methionine to ethylene. Proceedings of the National Academy of Sciences of the USA 76: 170–174.
Balachandran MD, Shrestha S, Agarwal M, Lvov Y, Varahramyan K.2008. SnO2 capacitive sensor integrated with microstrip patch antenna
for passive wireless detection of ethylene gas. Electronics Letters 44:
464–465.
Bard AJ, Faulkner L. 1980. Electrochemical methods. New York, NY:
Wiley.
Bassi PK, Spencer MS. 1985. Comparative-evaluation of photoionization
and flame ionization detectors for ethylene analysis. Plant, Cell &
Environment 8: 161–165.
Bassi PK, Spencer MS. 1989. Methods for the quantification of ethylene pro-
duced by plants. In: Linskens HF, Jacksons JF. eds. Gases in plant and
microbial cells. Modern methods of plant Aanalysis, Vol. 9. Berlin:
Springer, 309– 321.
Benlloch-Gonzalez M, Romera J, Cristescu S, Harren F, Fournier JM,
Benlloch M. 2010. K +
starvation inhibits water-stress-induced stomatalclosure via ethylene synthesis in sunflower plants. Journal of
Experimental Botany 61: 1139–1145.
Bernhard RA. 1960. Effect of flow-rate and sample-size on column efficiency
in gas-liquid chromatography. Nature 185: 311–312.
Bhushan A, Yemane D, Trudell D, Overton EB, Goettert J. 2007.Fabrication of micro-gas chromatograph columns for fast chromatog-
raphy. Microsystem Technologies 13: 361–368.
Blumberg LM, Klee MS. 2000. Optimal heating rate in gas chromatography.
Journal of Microcolumn Separations 12: 508–514.
Borch K, Bouma TJ, Lynch JP, Brown KM. 1999. Ethylene: a regulator of
root architectural responses to soil phosphorus availability. Plant, Cell &
Environment 22: 425–431.
Burg SP, Stolwijk JAJ. 1959. A highly sensitive katharometer and its appli-
cation to the measurement of ethylene and other gases of biological im-
portance. Journal of Biochemical and Microbiological Technology and
Engineering 1: 245–259.
Chang C. 1996. The ethylene signal transduction pathway in Arabidopsis: an
emerging paradigm. Trends in Biochemical Sciences 21: 129–133.
Clarke SM, Cristescu SM, Miersch O, Harren FJM, Wasternack C, MurLAJ. 2009. Jasmonates act with salicylic acid to confer basal thermoto-
lerance in Arabidopsis thaliana. New Phytologist 182: 175–187.
Clausen PA, Wolkoff P. 1997. Degradation products of Tenax TA formed
during sampling and thermal desorption analysis: indicators of reactive
species indoors. Atmospheric Environment 31: 715–725.
Cramers CA, Janssen HG, van Deursen MM, Leclercq PA. 1999.High-speed gas chromatography: an overview of various concepts.
Journal of Chromatography A 856: 315–329.
Cristescu SM, De Martinis D, Hekkert ST, Parker DH, Harren FJM. 2002.Ethylene production by Botrytis cinerea in vitro and in tomatoes. Applied
and Environmental Microbiology 68: 5342–5350.
Cristescu SM, Woltering EJ, Harren FJM. 2006. Real time monitoring of
ethylene during fungal– plant interaction by laser-based photoacoustic
spectroscopy. In: Dijksterhuis J, Samson RA. eds. Food mycology, amultifaceted approach to fungi and food. New York, NY: Traylor and
Francis.
Curl RF, Capasso F, Gmachl C, et al 2010. Quantum cascade lasers in chem-
ical physics. Chemical Physics Letters 487: 1–18.
Degreef JA, Deproft M. 1978. Kinetic measurements of small ethylene
changes in an open system designed for plant physiological studies.
Physiologia Plantarum 42: 79–84.
Dhawan KR, Bassi PK, Spencer MS. 1981. Effects of carbon-dioxide on
ethylene production and action in intact sunflower plants. Plant
Physiology 68: 831–834.
Ellison CT, Vandenbussche F, Van Der Straeten D, Harmer SL. 2011.XAP5 CIRCADIAN TIMEKEEPER regulates ethylene responses in
aerial tissues of arabidopsis. Plant Physiology 155: 988–999.
Cristescu et al. — Current methods for detecting ethylene in plants358
7/21/2019 Current methods for detecting ethylene in plants
Gallego-Bartolome J, Arana MV, Vandenbussche F, et al 2011. Hierarchyof hormone action controlling apical hook development in Arabidopsis.The Plant Journal 67: 622–634.
Gaspar G. 1991. High-speed gas-chromatography: theoretical and practical
aspects. Journal of Chromatography 556: 331–351.
Gupta PL. 1969. A new variable path length column for gas chromatography. Journal of Chromatography 39: 373–382.
Harren FJM, Mandon J, Cristescu SM. 2012. Photoacoustic spectroscopy intrace gas monitoring. Encyclopedia of analytical chemistry. Hoboken, NJ:John Wiley & Sons.
Hermans C, Vuylsteke M, Coppens F, Craciun A, Inze D, Verbruggen N.
2010 a
. Early transcriptomic changes induced by magnesium deficiency in Arabidopsis thaliana reveal the alteration of circadian clock gene expres-sion in roots and the triggering of abscisic acid-responsive genes. New
Phytologist 187: 119–131.
Hermans C, Vuylsteke M, Coppens F, et al . 2010 b. Systems analysis of theresponses to long-term magnesium deficiency and restoration in
Arabidopsis thaliana. New Phytologist 187: 132–144.
Hermans C, Porco S, Vandenbussche F, et al . 2011. Dissecting the role of CHITINASE-LIKE1 in nitrate-dependent changes in root architecture.Plant Physiology 157: 1313–1326.
Huelin FE, Kennett BH. 1959. Nature of the olefines produced by apples. Nature 184: 996.
Iqbal N, Nazar R, Syeed S, Masood A, Khan NA. 2011. Exogenously
sourced ethylene increases stomatal conductance, photosynthesis, andgrowth under optimal and deficient nitrogen fertilization in mustard.
Journal of Experimental Botany 62: 4955–4963.
James AT, Martin AJP. 1952. Gas-liquid partition chromatography: the sep-
aration and micro-estimaton of volatile fatty acids from formic acid tododecanoic acid. Biochemical Journal 50: 679–690.
Janata J. 2009. Principles of chemical sensors. Dordrecht: Springer.
Jordan LR, Hauser PC, Dawson GA. 1997a. Amperometric sensor for mon-itoring ethylene. Analytical Chemistry 69: 558–562.
Jordan LR, Hauser PC, Dawson GA. 1997b. Portable trap-sensor system formonitoring low levels of ethylene. Analyst 122: 811–814.
Jung JY, Shin R, Schachtman DP. 2009. Ethylene mediates response and tol-erance to potassium deprivation in arabidopsis. The Plant Cell 21:607–621.
Khan NA, Mir MR, Nazar R, Singh S. 2008. The application of ethephon (an
ethylene releaser) increases growth, photosynthesis and nitrogen accumu-lation in mustard ( Brassica juncea L.) under high nitrogen levels. Plant
Biology 10: 534–538.
Klemp MA, Akard ML, Sacks RD. 1993. Cryofocusing inlet with reverseflow sample collection for gas-chromatography. Analytical Chemistry
65: 2516–2521.
Kneubuhi FK, Moser JF, Steffen H. 1966. High-resolution grating spectrom-eter for the far infrared. Journal of the Optical Society of America 56:760–763.
Kreuzer LB. 1977. Optoacoustic spectroscopy and detection. New York, NY:
Academic Press.
Lambertus GR, Fix CS, Reidy SM, et al 2005. Silicon microfabricatedcolumn with microfabricated differential mobility spectrometer for GC
analysis of volatile organic compounds. Analytical Chemistry 77:7563–7571.
Lawson AE, Miller JM. 1966. Thermal conductivity detectors in gas chroma-tography. Journal of Gas Chromatography 4: 273–284.
Lewis AC, Hamilton JF, Rhodes CN, et al 2010. Microfabricated planar
glass gas chromatography with photoionization detection. Journal of
Chromatography A 1217: 768–774.
Linkies A, Leubner-Metzger G. 2012. Beyond gibberellins and abscisic acid:how ethylene and jasmonates control seed germination. Plant Cell
Reports 31: 253–270.Lloyd AJ, William Allwood J, Winder CL, e t a l 2011. Metabolomic
approaches reveal that cell wall modifications play a major role inethylene-mediated resistance against Botrytis cinerea. The Plant
Journal 67: 852–868.
Lovelock JE. 1960. Photoionization detector for gases and vapours. Nature
188: 401.Manne J, Jager W, Tulip J. 2008. A quantum cascade laser based room tem-
perature spectrometer for sensitive detection of ammonia and ethylene.In: Sudharsanan R, Jelen C. eds. Proceedings of SPIE. Quantum
sensing and nanophotonic devices. Volume 6900. San Jose, CA: SPIE.http://dx.doi.org/10.1117/12.785478 .
McDaniel BK, Binder BM. 2012. ETHYLENE RECEPTOR1 (ETR1) is suf-ficient and has the predominant role in mediating inhibition of ethyleneresponses by silver in Arabidopsis thaliana. Journal of BiologicalChemistry 287: 26094–26103.
McWilliam IG. 1983. The origin of the flame ionization detector.Chromatographia 17: 241–243.
Manne J, Lim A, Jager W, Tulip J. 2010. Off-axis cavity enhanced spectros-copy based on a pulsed quantum cascade laser for sensitive detection of ammonia and ethylene. Applied Optics 49: 5302–5308.
Millenaar FF, van Zanten M, Cox MCH, Pierik R, Voesenek LACJ,Peeters AJM. 2009. Differential petiole growth in Arabidopsis thaliana:
photocontrol and hormonal regulation. New Phytologist 184: 141–152.Muday GK, Rahman A, Binder BM. 2012. Auxin and ethylene: collabora-
tors or competitors? Trends in Plant Science 17: 181–195.
Mur LA, Sivakumaran A, Mandon J, Cristescu SM, Harren FJHebelstrup KH. 2012. Haemoglobin modulates salicylate and jasmo-nate/ethylene-mediated resistance mechanisms against pathogens
Journal of Experimental Botany 63: 4375–4387.
Nitsch L, Kohlen W, Oplaat C, et al . 2012. ABA-deficiency results in reducedplant and fruit size in tomato. Journal of Plant Physiology 169: 878–883.
Noh HS, Hesketh PJ, Frye-Mason GC. 2002. Parylene gas chromatographiccolumn for rapid thermal cycling. Journal of Microelectromechanical
Systems 11: 718–725.Orihuel-Iranzo B, Miranda M, Zacarıas L, et al . 2010. Temperature and
ultra low oxygen effects and involvement of ethylene in chilling injuryof ‘Rojo Brillante’ persimmon fruit. Food Science Technology
International 16: 159–167.Pastor E, Schmidt VM. 1995. Electrochemical reactions of ethene on poly-
crystalline au electrodes in acid-solution studied by differential electro-chemical mass-spectrometry and isotope labeling. Journal of
Electroanalytical Chemistry 383: 175–180.Peters A, Klemp M, Puig L, Rankin C, Sacks R. 1991. Instrumentation and
strategies for high-speed gas-chromatography. Analyst 116: 1313–1320.Pham-Tuan H, Vercammen J, Devos C, Sandra P. 2000. Automated capil-
lary gas chromatographic system to monitor ethylene emitted from bio-logical materials. Journal of Chromatography A 868: 249–259.
Phillips CSG. 1949. Organic and biochemical: the chromatography of gasesand vapours. Discussions of the Faraday Society 7: 241–248.
Piechulla B, Roeder S, Dreschler K, et al 2009. SAM levels, gene expressionof SAM synthetase, methionine synthase and ACC oxidase, and ethyleneemission from N-suaveolens flowers. Plant Molecular Biology 70:535–546.
Pranamornkith T, East A, Heyes J. 2012. Influence of exogenous ethyleneduring refrigerated storage on storability and quality of Actinidia chinen-
sis (cv. Hort16A). Postharvest Biology and Technology 64: 1–8.Radadia AD, Morgan RD, Masel RI, Shannon MA. 2009. Partially buried
microcolumns for micro gas analyzers. Analytical Chemistry 81:3471–3477.
Reston RR, Kolesar ES. 1994. Silicon-micromachined gas-chromatographysystem used to separate and detect ammonia and nitrogen-dioxide. 1.Design, fabrication, and integration of the gas-chromatography system
Journal of Microelectromechanical Systems 3: 134–146.Rubio V, Bustos R, Irigoyen ML, Cardona-Lopez X, Rojas-Triana M,
Paz-Ares J. 2009. Plant hormones and nutrient signaling. Plant Molecular Biology 69: 361–373.
Salman A, Filgueiras H, Cristescu S, Lopez-Lauri F, Harren F, SallanonH. 2009. Inhibition of wound-induced ethylene does not prevent red dis-coloration in fresh-cut endive (Cichorium intybus L.). European Food
Research and Technology 228: 651–657.
Cristescu et al. — Current methods for detecting ethylene in plants 359
Schmidt VM, Pastor E. 1994. Adsorption and oxidation of acetylene and
ethylene on gold electrodes. Journal of Electroanalytical Chemistry
376: 65–72.
Schomburg G. 1990. Gas chromatography. Weinheim: Wiley VCH.
Schroder R, Cristescu SM, Harren FJ, Hilker M. 2007. Reduction of ethyl-
ene emission from Scots pine elicited by insect egg secretion. Journal of
Experimental Botany 58: 1835–1842.
Segal A, Gorecki T, Mussche P, Lips J, Pawliszyn J. 2000. Development of
membrane extraction with a sorbent interface-micro gas chromatography
system for field analysis. Journal of Chromatography A 873: 13–27.
Shekarriz R, Allen WL.2008. Nanoporous gold electrocatalysisfor ethylenemon-
itoring and control. European Journal of Horticultural Science 73: 171–176.
Staal M, Rabouille S, Stal LJ. 2007. On the role of oxygen for nitrogen fix-
ation in the marine cyanobacterium Trichodesmium sp. Environmental
Microbiology 9: 727–736.
Straumal BB, Protasova SG, Mazilkin AA, et al 2010. Ferromagnetic prop-
erties of the Mn-doped nanograined ZnO films. Journal of Applied
Physics 108: 073923
Terry SC, Jerman JH, Angell JB. 1979. Gas-chromatographic air analyzer
fabricated on a silicon-wafer. IEEE Transactions on Electron Devices
26: 1880–1886.
Thain SC, Vandenbussche F, Laarhoven LJJ, et al 2004.. Circadian rhythms
of ethylene emission in Arabidopsis. Plant Physiology 136: 3751–3761.
Tholl D, Boland W, Hansel A, Loreto F, Rose USR, Schnitzler JP. 2006.
Practical approachesto plantvolatile analysis. ThePlant Journal 45: 540–560.Thompson D. 1999. New advances in gold catalysis. Part II. Gold Bulletin 32:
12–19.
Tian QY, Sun P, Zhang WH. 2009. Ethylene is involved in nitrate-dependent
root growth and branching in Arabidopsis thaliana. New Phytologist 184:
918–931.
Tuomainen J, Betz C, Kangasjarvi J, et al 1997. Ozone induction of ethyl-ene emission in tomato plants: regulation by differential accumulation of transcripts for the biosynthetic enzymes. The Plant Journal 12:1151–1162.
Verbruggen N, Hermans C. 2012. Root responses to trace metallic elements.In: Eshel A, Beeckman T. eds. Plant roots: the hidden half. New York,NY: Taylor & Francis Group.
2004. Monitoring of ethylene by a pulsed quantum cascadelaser. Applied Optics 43: 3329–3334.
Yordanova ZP, Iakimova ET, Cristescu SM, Harren FJ, Kapchina-TotevaVM, Woltering EJ. 2010. Involvement of ethylene and nitric oxide incell death in mastoparan-treated unicellular alga Chlamydomonas rein-
hardtii. Cell Biology International 34: 301–308.Zarembinski TI, Theologis A. 1994. Ethylene biosynthesis and action – a
case of conservation. Plant Molecular Biology 26: 1579–1597.Zevenbergen MA, Wouters D, Dam VA, Brongersma SH, Crego-Calama
M. 2011. Electrochemical sensing of ethylene employing a thinionic-liquid layer. Analytical Chemistry 83: 6300–6307.
Cristescu et al. — Current methods for detecting ethylene in plants360