A version of this appeared in Current Science 75(6) 1998 India's Nuclear Breeders: Technology, Viability, and Options Rahul Tongia & V. S. Arunachalam Department of Engineering & Public Policy Carnegie Mellon University Pittsburgh, PA 15213 USA December 15, 1997 Tel: (412) 268 2670; Fax: (412) 268 3757 [email protected]; [email protected]Abstract: India's nuclear power program is based on indigenous materials and technology, with the potential for providing energy security for many centuries. This paper examines the technical validity of this plan, specifically the role of breeder reactors for extending the domestic uranium supplies. Our study shows breeding is unlikely to occur at anywhere near the rates envisioned, leading to a slow growth of fast breeder reactors. In addition, domestic uranium reserves restrict growth of Pressurized Heavy Water Reactors (PHWRs), which are likely to be the main contributors to nuclear capacity in the short-term. The Th-U233 cycle in fast breeders does not appear attractive, and, for the U238-Pu cycle, only metallic fuel offers hope of rapid increase in available fissile material. To increase the share of nuclear power in the coming decades, India should consider the construction of a number of large thermal reactors based on indigenous and imported uranium. Keywords: Nuclear Power, Fast Breeder Reactors, Three-Phase Plan, Doubling Time, Plutonium
Transcript
A version of this appeared in Current Science 75(6) 1998
India's Nuclear Breeders: Technology, Viability, and Options
INDIA'S NUCLEAR POWER PROGRAM ........................................................................................................... 5
MODEL AND METHODOLOGY..................................................................................................................... 8
DOUBLING TIME ............................................................................................................................................. 8
Reactor Doubling Time (RDT)..................................................................................................................... 9
System Doubling Time (SDT)....................................................................................................................... 9
Compound System Doubling Time (CSDT).................................................................................................. 9
WHAT CAN BE DONE? .................................................................................................................................. 21 Comparing Fuel Cycles.............................................................................................................................. 21
Metallic Fuel Development ........................................................................................................................ 22
APPENDIX A NUCLEAR REACTORS AND REACTIONS .............................................................................. 31 APPENDIX B SDT MODEL INFLUENCE DIAGRAM .................................................................................... 32 APPENDIX C WORLDWIDE EXPERIENCE WITH FAST REACTORS ........................................................... 33
APPENDIX D NUCLEAR REACTORS AND REACTIONS .............................................................................. 35 APPENDIX E THERMAL FUEL REPROCESSING CAPACITY ....................................................................... 36 APPENDIX F GROWTH OF ELECTRICAL CAPACITY .................................................................................. 37
APPENDIX G SHARE OF NUCLEAR POWERVARYING PLFS ................................................................. 38
APPENDIX H RADIOLOGICAL TOXICITY.................................................................................................... 40
FURTHER STUDY ........................................................................................................................................... 41
3
Acknowledgments
This work is supported by the Department of Engineering and Public Policy
(EPP), Carnegie Mellon University, and the Rockefeller Foundation. The authors
wish to thank the Department of Atomic Energy (DAE) for making data available
for this analysis. We thank numerous past and present DAE scientists, notably Dr.
C. V. Sundaram for his comments, and Shri L. V. Krishnan for his extended feedback
and support. The authors have benefited from discussions with Dr. Thomas
Graham, Rockefeller Foundation, Prof. Granger Morgan, Head of Department, EPP,
and Prof. Benoit Morel, EPP, among others. The authors are responsible for the
contents.
4
Abbreviations and Acronyms
AHWR Advanced Heavy Water Reactor
ANL Argonne National Laboratory
BWR Boiling Water Reactor (a type of LWR)
CANDU Canadian Deuterium Uranium (standard PHWR)
CSDT Compound System Doubling Time
CTBT Comprehensive Test Ban Treaty
DAE Department of Atomic Energy (India)
EF Ext-Factor (or Ex-Factor in some references)
FBR Fast Breeder Reactor
FBTR Fast Breeder Test Reactor
GWe Gigawatt-electric
HLW High Level Waste
IFR Integral Fast Reactor
IGCAR Indira Gandhi Center for Atomic Research
INFCE International Nuclear Fuel Cycle Evaluation (conf.)
KARP Kalpakkam Reprocessing Plant
LEU Lightly Enriched Uranium
LMFBR Liquid Metal Fast Breeder Reactor
LMFR Liquid Metal Fuel Reactor
LWR Light Water Reactor
MWd Megawatt-day
MWe Megawatt-electric
MWt Megawatt-thermal
NPC Nuclear Power Corporation (India)
NPT Non-Proliferation Treaty
PHWR Pressurized Heavy Water Reactor
PLF Plant Load Factor
Pu Plutonium
PWR Pressurized Water Reactor (a type of LWR)
RAPS Rajasthan Atomic Power Station
RDT Reactor Doubling Time
SDT System Doubling Time
SQ Significant Quantity- fissile amount req. for a bomb
TAPS Tarapur Atomic Power Station
Th Thorium
U Uranium
5
Introduction
India's Nuclear Power Program
India's nuclear power program began in 1948 with the establishment of the
Atomic Energy Commission under the chairmanship of Homi Bhabha. The need for
energy security based on domestic fuel availability was cited as a basic reason for
going to nuclear power. The coal reserves were not considered adequate for the
needs of the growing population of India. In the 1955 and 1958 UN conferences on
Peaceful Uses of Atomic Energy, Bhabha argued that the economics of nuclear
versus coal power depended on the assumptions such as the plant distance from the
coal mine. Nuclear power was expected to be the only available long-term source of
energy for India (Bhabha, 1955; Bhabha, 1958; Bhabha and Prasad, 1958).
As India preferred a technology that did not require uranium enrichment,
then considered expensive, it was decided to use Pressurized Heavy Water Reactors
(PHWRs) for the first stage.1 These are of the so-called Canadian Deuterium
Uranium (CANDU) design.
Table 1: India’s Planned Three Phase Nuclear Power Program
Based on the potential for PHWRs, this implies a domestic availability of approximately 60,000 tons natural uranium.
A long-term goal of India's program is to use the vast reserves of thorium
available in the country. As thorium is a fertile2 material and not a fissile one, it is
necessary initially to use another fissile material for fuel and also to breed fissionable
1 The trade-off is that PHWRs require large supplies of heavy water as moderator-cum-coolant. This is a very expensive material and, in India, accounts for double the costs of natural uranium fuel (NPC, 1993). 2 Fertile materials are those which do not typically undergo fission in a nuclear reactor. These can convert to fissile materials by absorption of a neutron (typically inside a nuclear reactor).
6
uranium 233 (U233) from the thorium-U233 cycle. Plutonium (Pu), a by-product of
the CANDU reactor, is the initial fuel for this stage. A method for producing more
Pu is through breeding in Fast Breeder Reactors3 (FBRs). The fissile material
produced at the end of this stage is the fuel for the third stage of the planned power
cycle. The three-phase power program as formulated by the Indian Atomic Energy
Establishment is shown in Table 1 (Chidambaram and Ganguly, 1996;
Chidambaram, 1995). We can see that the planned use of FBRs involves closing the
fuel cycle, reprocessing the discharged fuel from fast (or thermal) reactors.
India is now on the threshold of the second phase of its nuclear power
program, using FBRs. India has successfully operated a 40 MWt (Megawatt-
thermal) Fast Reactor since 1985, which recently began limited production of
electricity. This reactor, the Fast Breeder Test Reactor (FBTR), is the first of a series
of planned FBRs, beginning with a 500 MWe U-Pu oxide fueled Prototype Fast
PHWRs, with 4 more under construction. In addition to these, India's power
reactors include two 160 MWe BWRs, which were constructed before the PHWRs.4
India also operates numerous research reactors, and has indigenous reprocessing
and fuel fabrication facilities.
The Nuclear Power Corporation (NPC) was formed in 1987 as the commercial
arm of DAE. As of 1996, NPC had operating losses on the order of 10 billion
Rupees5, mostly because of poor load factors, long construction times, high interest
rates, and defaults on payments by state electricity boards6 (DAE, 1995b). NPC is
unlikely to begin commercial deployment of fast reactors until the 500 MWe PFBR
or a subsequent reactor operates successfully and safely, and shows economic
potential. Assessed from the present technology status and fissile materials
availability, India, in the coming decade, is unlikely to commission the third stage
power reactor that uses U233 as fuel.
Despite operating Asia's first nuclear reactor, India has now fallen behind
many countries pursuing nuclear power. Today's installed gross nuclear capacity of
3 A Fast Reactor is one with no moderator, and typically uses Liquid Metal (sodium) as a coolant. It has the capability of breeding, i.e., producing more fissile material than it consumes. However, one can operate a fast reactor as a burner of fissile material, as the Japanese propose to do, by simply not using fertile material in the blankets. 4 The BWRs and the first pair of PHWRs are under international safeguards, meaning all inputs and outputs are subject to scrutiny. 5 Dec. 1996 exchange rate: 1 US$ = 35.5 Indian Rupees. 6 Default amounts account for about 3/4 of the losses.
7
2210 MWe is actually de-rated to approximately 1750 MWe7, and operates at overall
(lifetime) plant load factors (PLFs) of only around 50%. This compares unfavorably
to the March 1996 world average lifetime PLFs of nearly 70% for Pressurized Water
Reactors (PWRs) and 66% for PHWRs (Nuclear Engineering International, 1996).
Though the performance of the most recent year shows improvement in PLFs to 67%
(NPC, 1997), these may not be adequate to compensate for a less than optimal
performance in the past decades.
Concerns on performance aside, the importance of the nuclear power lies in
its potential as well the energy security it might provide. While the current share of
nuclear power is only about 2% by generation (Ministry of Power, 1996), it still
remains as one of the important and available sources of power to meet India's
growing energy demands. India now experiences about 14% average shortfall and
28% peak shortfall in electricity production (The Hindu, 1996). In fact, power has
now become such an important national priority that almost one-third of all
development investments in India are related to this issue (Bahadur, 1996).
In this paper, we discuss the technology and viability of breeder reactors
using different fuels in India's nuclear power program. We evaluate these by using
the concept of System Doubling Time (SDT) and the data on breeding and fuel
doubling times available in open literature. We compare doubling times across the
fuel types: oxide, carbide, and metallic,8 while mainly for the U238-Pu cycle, but also
for the Th-U233 cycle.9
Based on the results obtained from our modeling, we discuss the performance
of India’s Nuclear Power Program in meeting India’s electricity needs and the
original objective of energy security, and suggest options that may be
technologically more relevant today than the plan formulated many decades ago.
This paper also briefly examines international acceptability, especially
regarding plutonium breeding and reprocessing. India is not a signatory to the
Non-Proliferation Treaty (NPT), and, along with Pakistan and Israel, is classified as
a threshold nuclear weapons state ("rogue state" to some). Because of that fact, India
is isolated from the world in terms of both nuclear technology and nuclear materials
(such as fuels). Even for countries operating under full-scope safeguards, such as
Japan, there are international concerns (especially American) over the use of
plutonium (Solomon, 1993; Oye, Skolnikoff et al., 1995).
7 RAPS 2 is currently undergoing coolant channel replacement; for the coming years, the usable capacity will only be 1550 MWe. 8 Metallic fuel as considered consists of a ternary alloy of uranium, plutonium, and zirconium. 9 Appendix A contains brief descriptions of nuclear reactor designs, as well as fuel cycle equations.
8
Model and Methodology
In this study, we build a parametric model for the growth of nuclear power
reactors solely based on the constraints of fissile material availability. India's
domestic reserves of uranium are limited and estimated to be between 30-70
thousand tons (DAE, 1995a; Sundaram, 1996). While the current worldwide glut of
uranium has depressed uranium prices and reduced incentives for more
exploration, India's case is different, as India does not have access to uranium from
outside. A recent article by Ramanna (1997) suggests that India has only 35,000 tons
of recoverable uranium at $80 or lower per kg. India's limited fissile material stock
when used in PHWRs can provide only 58 GWe-yr. of energy per 10,000 tons of
uranium, or only 407 GWe-yr based on 70,000 tons uranium.10
Through fuel reprocessing and breeding in FBRs, the fuel supplies can be
extended by a factor of 50. This is achieved by converting fertile U238 (found in
natural uranium as well as spent fuel) into fissile Pu239 in a FBR. FBRs require
significant quantities of fissile material to initiate criticality. If enriched uranium is
not used, depending on the reactor size, 15 to 20% of the fuel in a FBR would have to
be plutonium.
Presented below is a sample of the flow of fissile material (Balakrishnan, 1990;
Krishnan, 1996):
1 ton natural U used in PHWRs → 3.5 kg Pu in spent fuel
PLF} .685 {@ PHWRs GWe
U/yr. tons118 → 413 kg Pu/yr.
Doubling Time
Plutonium processed from the spent PHWR fuel can be loaded into a FBR for
breeding more plutonium from U238. Upon burn-up in a reactor, the discharged
fuel must undergo reprocessing before reuse. The term reprocessing is often used to
describe the entire process before reuse, i.e., the combination of cooling of burnt-up
fuel rods, processing to extract plutonium, and fuel fabrication. Most of the
reprocessed plutonium is loaded back as fuel into the same reactor, and the excess
plutonium is accumulated for starting another reactor. Doubling time characterizes
this growth of fissile material. Depending on the operating conditions, the doubling
times are defined as follows (Waltar and Reynolds, 1981; Marshall, 1983):
10 This is at 6,700 MWt-days/ton rated burn-up.
9
Reactor Doubling Time (RDT)
This is the core fissile requirement (in-pile inventory) divided by the fissile
gain per year. Any excess fissile material produced over the Fissile material at the
Beginning Of the Cycle (FBOC) is known as Fissile Gain (FG).
System Doubling Time (SDT)
This measure accounts for losses both during reprocessing and by radioactive
decay. These losses occur outside the reactor. SDT also accounts for the out-of-pile
inventory requirements due to the delay between the discharge of fuel after burn-up
and its reload, time required for cooling, reprocessing and fabrication of the fuel.
This extra inventory is measured by the term Ext Factor (EF), in Eqn. 2. SDT, by
definition, is longer than RDT.
Compound System Doubling Time (CSDT)
This doubling time is for compounded growth of fissile material, and
assumes a growing number of reactors. As soon as enough fuel for a new reactor
accumulates, it begins operation, increasing the rate of fissile production. It equals
SDT × loge(2). A single reactor can only achieve SDT, but as the system grows to a
number of reactors, the doubling time reduces from SDT to CSDT. It is generally
accepted that as the reactor base grows to between 10 and 16 reactors, the doubling
time approaches .7 × SDT, approximately loge(2) × SDT. This compounded growth
requires not only a continuous addition of new reactors as soon as the fuel is ready,
but also proportional increases in reprocessing and fabrication facilities.
Below is a list of factors affecting doubling time:
• Initial in-pile inventory
• Plant Load Factor (PLF)
• Breeding ratio Function of reactor design and fuel choice
• What fraction of the fuel undergoes fission (burn-up)
• Reloading fraction
• Cooling, reprocessing and fabrication times
• Other delays
• Construction schedule
While the last two points are important for relating practice to theory, for the
study, construction of reactors or FBR fuel-handing facilities is not assumed to be a
limiting constraint; the only constraint to growth is fissile availability.
10
SDT Calculations
Presented in Appendix B is a simplified influence diagram for the model used
for SDT calculations.
The equations used to calculate SDT are given below:
yr
cycles FL) -(FG
EF FBOC =SDT
×
× Equation 1
CycleofBeginningFissile FBOC =
inventory fissile core
inventory fissile cycle =Factor -Ext = EF Equation 2
(net) cycleper gained Fissile =FG
reactor) (outside cycleper lost Fissile = FL
Decay 241-Pu + FPL = FL Equation 3
Loss ProcessingFission = FPL
Existing Experience and Literature on Fast Reactors and Breeding
Appendix C (Paranjpe, 1992) shows the world's experience with fast reactors.
Today, only India, Japan, Russia, and China are interested in fast reactors in the near
future. Even countries such as France and UK that advocate reprocessing fuel to
extract plutonium have put their fast reactor development on hold (Energy
Committee, 1990).
The primary source for breeding data is the 1980 International Nuclear Fuel
Cycle Evaluation (INFCE) report, compiled with international collaboration (INFCE,
1980). As many of the reactor configurations still exist only on paper, this report has
been the primary source of data and information. Our analysis also draws
extensively on this report.
In Bhabha's 1958 papers on role of thorium, he pictured a doubling time of
only 5-6 years for U-233 in the Th-U233 cycle (Bhabha and Prasad, 1958; Dayal,
Paranjpe et al., 1958). INFCE pictures this as at least 70 years. The reason was
Bhabha assumed use of LMFRs, Liquid Metal Fuel Reactors (molten fuel). These
were never built due to technical difficulties.
11
Table 2: Published Doubling Times
U-238 Pu Cycle Th U-233 Cycle
SDT CSDT SDT CSDT
oxide (25.7) 17.8 (155.8) 108.0
carbide- Lee 14 (10) 72 (50)
metal (12.3) 8.5 (108.3) (75.1)
carbide (14.7) 10.2 (101.0) 70.0 (all times in years)
The times in parentheses are converted from the published times by multiplication or division by loge(2). The oxide, carbide, and metal calculations are from INFCE (1980); carbide- Lee is based on Lee et al. (1990).
Publications by DAE scientists, especially Ramanna and Lee, suggest an
optimistic picture for the growth of fissile material through breeding (Lee and
Kimura, 1988; Lee, John et al., 1990; Ramanna and Lee, 1986). Table 2 shows
doubling times from these publications. The INFCE data are based on CSDT as
simply SDT × loge(2). Most Indian data also use INFCE calculations, except for the
carbide fuel. Indian calculations (given as Carbide-Lee in Table 2) suggest a shorter
doubling time for thorium carbide. The authors have not discussed the reasons for
this difference. For calculating doubling times, the Indian authors have used
futuristic reactor performance scenarios, and yet to be built reactor designs. The
reactors described in INFCE are 1,000 MWe, while the Indian reactors are based on
500 MWe designs. This parameter alone need not affect the results, if construction is
not a constraint. Reactor profiles used in our study are given in Appendix D (Lee,
John et al., 1990; INFCE, 1980).
Model Parameters for Analysis
The cycles/year are a direct function of PLF. All publications assume a
sustained, average PLF of .75, which is high for any large FBR. On average, Indian
lifetime PLFs have been more modest for PHWRs, averaging between 30 and 60%
(IAEA, 1995; Bhoje, 1996b). In our model, the PLF was varied from .4 to .75, either
parametrically or as a uniform distribution. The SDT model assumes that as the PLF
decreases, the fuel residence time increases until the target burn-up is reached
(100,000 MWd/ton).
The delay for cooling, reprocessing, and fabrication is also important, as the
out-of-pile inventory is proportional to this delay. Publications assume a total one-
year time for all the reprocessing activities for advanced reactors to be built after
2000. This seems unlikely for a number of reasons discussed later in the paper. For
12
this analysis, we have varied the out-of-pile time between 2 and 3 years. This is for
the standard wet chemical reprocessing route for extracting Pu or U233 (Purex or
Thorex processes respectively). There is an alternative method envisioned for
metallic fuel, known as pyro-processing or dry reprocessing (Chang, 1989; Battles,
Miller et al., 1992).11 For our model, we have assumed 1-2 years delay time for dry
reprocessing. The assumption of one-year reprocessing delay is optimistic given the
time for cooling itself would be about eight months (the nominal time between
reloads). This model also assumes that the entire cycle (in-pile plus out-of-pile)
inventory of fissile material is available for a new reactor before it begins operation.
While calculating the doubling times, we have assumed the out-of-pile
inventory needs to be based on the nominal cycles per year. If the PLF is lower than
the nominal values, one might consider reducing the out-of-pile inventory needs,
based on the actual (lower) load factor. However, this would condemn the reactor
to lower PLFs in subsequent years as well. All the Ext-Factor calculations for out-of-
pile inventory in our paper are, therefore, for nominal PLFs only. It is important to
note that these calculations do not account for a buffer reserve against
reprocessing/fabrication disruptions. It would be advisable to have at least two
years' output from the largest reprocessing/fabrication facilities available as a buffer
stock.12
The publications assume losses during reprocessing at 1%. In our model,
these are varied between 1 and 3%. The higher value appears closer to the current
level of losses (Lee, 1996). Finally, our model accounts for decay of Pu241 during
cooling, reprocessing, and fabrication (Pu241 has a half-life of 14.4 years). This is
important when accounting for the different reactivity worths (an approximate
measure of fissionability) of Pu isotopes, which many publications fail to do. The
decay losses of Pu241 are magnified by its reactivity worth of 1.5. In addition, Pu241
decay leads to a build-up of Americium-241, a neutron poison. This reduces the
actual fissile worth even further (Solomon, 1993).
Based on the above considerations we have calculated SDT for different
parameter assumptions. We have also modeled the transition from SDT to CSDT,
calculating the number of reactors required for reaching CSDT. For this calculation
we have assumed fissile material availability to be the only constraint, and have
11 Pyrometallurgical reprocessing (pyro-processing) is an electrolytic separation process. It is expected to offer a number of advantages, including lower capital and O&M costs, as well as the possibility of using spent fuel with less cooling (Chang, 1989; Chang and Till, 1986; Battles, Miller et al., 1992). 12 Reprocessing plant sizes depend on the number of reactors served. An issue worth considering is that co-location or transportation to off-site plants affects risks of proliferation (diversion) and safety.
13
ignored the continual decay of Pu241 while awaiting the build-up of sufficient
reprocessed fuel for commissioning a new reactor.
Plutonium from PHWRs
It takes a number of breeder reactors to reach CSDT. To offset this, the
Department of Atomic Energy (DAE) suggests the utilization of Pu from
reprocessed spent PHWR fuel. It is therefore important to model PHWR growth as
a source of plutonium. The limit to PHWR growth is set by the domestic uranium
availability and, in the model, this is varied between 30 and 90 thousand tons. The
availability of uranium from other countries is not included in these calculations as
there are restrictions imposed by the Nuclear Suppliers Group on the supply of
nuclear materials to India.
It is necessary to know the PLF and the life of the reactors for calculating the
fissile material throughput. For this calculation, we have assumed a 40 year PHWR
life and an average PLF varying between 40 and 75%. In reality, the PLF may vary
from year to year depending on the reactor performance or need for repairs. In
some years, such as during coolant channel replacement, the PLF may even be zero.
After the current construction of the two 220 MWe twin units (RAPS 3&4 and
Kaiga 1&2) is complete in approximately 1-2 years, NPC will construct the first pair
of 500 MWe PHWR reactors (TAPS 3&4). This may be joined by the simultaneous
construction of Kaiga 3-6 (220 MWe each), after which NPC plans to construct only
500 MWe reactors.
Reprocessing facilities for handling spent fuel from PHWRs are also
important for producing Pu. India's current reprocessing capacity is around 140
tons of metal/yr., to be augmented by a new 100 tons/yr. plant (KARP) scheduled
to go on stream by 1997 (Editors, 1995; Krishnan, 1996). However, the existing 140
tons/yr. plants are near the end of their service life. It is estimated that reprocessing
plants take about 10 years to construct (Krishnan, Tongia et al., 1997). They also
have a shorter service life than reactors, and this is varied in the model between 20
and 25 years. Their overall PLFs, are likely to lie between 50 and 60%. A realistic
view of PHWR fuel reprocessing capacity is given in Appendix E.
The first 500 MWe fast reactor (PFBR) will be up for licensing soon. Its
construction schedule is also a parameter for the model. After it begins operation,
further construction of FBRs will depend on the experience of operating this test
reactor and on other modifications to the design the experience may suggest. These
refinements may involve a delay of two years before large-scale construction begins,
and this is also included in the model. In addition, PFBR is U-Pu oxide fueled. If
14
metallic fuel is to be used, it will mean an additional delay before large-scale
deployment, as this technology is still in its infancy.
This initial period for FBR growth is the only stage where the years for
construction are modeled as a constraint. After this period, the model assumes the
availability of fissile material as the only constraint to the growth of FBRs.
Results
Doubling Time
Table 3 shows the doubling times calculated using the model. For
comparison, doubling times from INFCE and Indian publications are shown in
Table 2. All fuel cycles used in our modeling have been derived from INFCE values
(which are the basis for most Indian publications), except for the carbide cycle where
we have also used the Indian values, which are termed in this analysis as Carbide-
Lee (Lee, John et al., 1990).
Table 3: Statistics of SDT from Model
oxide carbide-Lee
metal metal-dry carbide
min 31.1 23.3 12.0 9.1 16.5
U238-Pu median 48.8 35.8 17.9 13.8 24.6
Cycle mean 50.3 37.1 18.4 14.3 25.8
max 79.3 61.7 29.5 23.4 40.5
std. dev. 10.8 8.0 3.7 3.0 5.4
min 276 114 166 151
Th-U233 median 1,024 213 361 302
Cycle mean 107,200 225 425 340
max 500,000 473 1,117 871
std. dev. 203,000 67 199 134 (all times in years)
This assumes 1-3% reprocessing losses, 2-3 years reprocessing delay (1-2 for dry), and 40-75% PLF. In approximately 20% of the Th-U233 oxide cycle SDT calculations (if the losses are high enough), there is no net breeding. For these cases, the SDT is taken as 500,000 years.
As can be seen from the two tables, the doubling times we have calculated are
significantly longer than those in the INFCE and Indian reports. To determine the
relative importance of the uncertain parameters (PLF, percentage losses, and delay
until reload), we performed an importance analysis (absolute value of rank order
correlation) on these, and the results are presented in Table 4. In this calculation, we
15
assumed a first-order estimate of uniform distributions for the uncertain parameters,
across the ranges specified before.
Table 4: Importance Analysis for SDT
oxide carbide-Lee
metal metal-dry
carbide
PLF 0.92 0.93 0.94 0.92 0.94
U238-Pu reprocessing losses
0.29 0.24 0.17 0.16 0.18
Cycle delay until reload
0.28 0.37 0.26 0.38 0.35
PLF 0.17 0.62 0.41 0.48
Th-U233 reprocessing losses
0.96 0.74 0.89 0.85
Cycle delay till reload
0.03 0.25 0.17 0.15
This assumes 1-3% reprocessing losses, 2-3 years reprocessing delay (1-2 for dry), and 40-75% PLF. Sample size was 500 for all SDT calculations.
This analysis shows that for the U238-Pu cycle, PLF is the most important
parameter in determining doubling time, while for the Th-U233 cycle, losses are of
primary importance, followed by PLF.
PHWR Growth
The growth of PHWRs is limited by domestic uranium supplies. Figure 1
shows the growth of PHWR capacities based on a high availability of domestic
uranium (70,000 tons). The number of PHWRs going on stream is dependent on the
number of construction teams building the reactors. The plateau seen in this figure
represents equilibrium between new construction and decommissioning of old
reactors.
16
0
2
4
6
8
10
12
14
16
1995
2015
2035
2055
2075
2095
2115
Year
2 twin units 3 twin units 4 twin unitsConstr.:
Figure 1: PHWR Capacity Projections
This assumes 70,000 tons of uranium available domestically, and varying numbers of teams constructing PHWRs (in pairs). Reactors are assumed to have a 40 calendar year life, and operate at a 55% lifetime PLF. Construction takes 10 years (including the initial infirm period at low power). Reducing the construction time increases the peak PHWR capacity, but reduces the duration of the plateau. It also does not affect FBR growth as reprocessing remains a constraint.
The current construction capability is for 2 twin-reactor sites (of 220 MWe).
Even an aggressive construction schedule of 5 teams constructing five twin units
with a 7-year construction time would take until 2028 to reach peak capacity. This
peak capacity of 18 GWe would last only about a decade, after which PHWR
capacity would fall off rapidly.
Reactors Needed to Achieve CSDT
DAE maintains that there is enough Pu available from PHWRs to allow
approximately 25 GWe of FBRs to operate (Sundaram, 1996), at which point CSDT is
achieved. We have modeled the growth of FBRs operating only on Pu from FBR
breeding. (At some point, Pu from PHWRs would no longer be available, as those
reactors would have exhausted the country's supply of U.) As expected, the initial
doubling time for a small number of reactors begins with SDT, coming closer to
CSDT with more reactors operating. However, there is an offset. This is because the
fuel used to start up a new reactor will have to undergo burn-up and reprocessing
17
before joining the pool of fissile material. Stated another way, a specific reactor
won't be outputting any fissile material for use in a new reactor for a number of years
after beginning operation. This shows that SDT as generally defined is itself subject
to such an offset. In the long run, this offset is equal to the logarithme of the time for
burn-up and reprocessing. Table 5 compares the theoretical compound system
doubling times with the actual doubling times.
Table 5: Doubling Times for U238-Pu Cycle, Calculated vs. Actual Doubling
Calculated SDT
(model)
implied CSDT
= SDT ∞ loge(2) Actual Doubling
oxide 51.9 36.0 38 to 40
carbide -Lee 38.2 26.5 29 to 30
metal 19.0 13.1 16 to 17
carbide 26.6 18.5 21 to 22 (all times in years)
This assumes 60% PLF, 2% losses, and a three-year reprocessing delay. The offset between the CSDT and actual long-term doubling is because fuel has to undergo burn-up and cooling/reprocessing/fabrication. The reason for there being a range for Actual Doubling is that after starting as many new reactors as possible, there is typically some leftover fissile material, which reduces the time needed till the next one can start.
Implications
The fact that nuclear power is capable of providing energy for many years is
undisputed. A key question, however, is when that is likely to be realized, given all
the constraints discussed in the earlier sections. A useful exercise would be to
examine the contribution of nuclear power as a percentage of the total electrical
capacity in the country. For this study, we have assumed the contribution of nuclear
power to be determined as the sum of PHWR and FBR capacities. We have not
included in this calculation light water reactors that are in operation (Tarapur) or are
proposed to be acquired.
Electrical Capacity
To measure the share of nuclear power, one must make assumptions on the
overall growth of electrical power in the country. The current installed capacity of
around 85 GWe is growing at an annual rate of approximately 5% (Ministry of
Power, 1996). While this growth rate will continue for many years due to the
present very low per capita availability (around 350 kWh per year), it would
eventually slow down. This study assumes that the current growth rate
18
(parametrically varied between 4 and 6 %) would continue for about 20 years (again,
a variable), after which it would linearly decrease towards 0.5% growth as installed
capacity approaches saturation capacity. Saturation capacity, in this context, is
defined as the amount capable of providing for an annual per capita consumption of
2,300 kWh, based on an overall net PLF of 50%. This consumption is approximately
equal to the current world average consumption and is well under the US per capita
annual consumption of 11,000 kWh (DOE/EIA, 1995; Rodriguez, 1996). The
saturation population is estimated to be 1.3 billion. Even though the saturation
consumption of electric power may appear low and depressing in meeting India's
aspirations, it should be remembered that for achieving even this value, India would
have to add 600 GWe of power at an estimated cost of $1 billion per GWe. After
reaching saturation capacity, the electrical capacity would continue to grow at the
residual growth rate, as is seen in other developed countries with stable
populations. Appendix F shows the growth of electrical capacity including the
modeled growth of nuclear power. While these curves are subject to the
assumptions mentioned above, they bring out the limited contribution that nuclear
power is likely to play in the coming years.
Share of Nuclear Power
An important result of this study is the share of nuclear power within the
country's generation capacity (Figure 2).13 These calculations are based on the
U238-Pu cycle, as is currently planned by DAE. If the overall electricity growth rate
is slower than that assumed in this model, it would likely affect nuclear power more
than other forms of power, as it is a highly capital-intensive industry. This may
further reduce the share of nuclear power in the overall electricity generation
capacity. As the results showed the importance of PLF in doubling, we show in
Appendix G the share of nuclear power for different PLFs.
13 This share excludes contribution from any imported LWRs, as well as from TAPS 1&2 and RAPS 1&2, which are rated at only 520 MWe, and have only some 10-15 years of life left.
19
0
5
10
15
20
25
30
35
1995
2015
2035
2055
2075
2095
2115
2135
2155
2175
2195
Year
metal-dry
metal
carbide
carbide- Lee
oxide
Fuel Types
Figure 2: Share of Nuclear Power (by Capacity), for U238-Pu Cycle
The initial share is largely a function of PHWRs. FBR share is the upper-bound on possible capacity due to limited fissile availability. It does not account for contingencies or delays in any aspect of the fuel cycle. It assumes a 60% PLF, 2% reprocessing losses, and a 3 year reprocessing delay (2 year for dry).
In the last section we showed that the growth of fissile material through
breeding would not be as rapid as desired to allow an increase in nuclear power
capacity in the near future. As seen in Appendix G, even with optimistic (but
realizable, as recent NPC performance has indicated (NPC, 1997)) load factors, 70%
PLF, the share of nuclear power will continue to remain low. This is due to India's
choice of technology, which is path-dependent: the past performance of power
reactors combined with their present attainments will strongly determine the future
performance of nuclear power in India, as breeders depend on fuel produced from
the past operation of reactors.
A succinct method of summarizing the limits on fissile growth based on
breeding is comparing the growth rates corresponding to the calculated doubling
times with the overall electricity growth rate, which is expected to remain at or
above 5%. Table 6 shows the calculated growth rate of fissile material
(corresponding to the actual long term doubling times shown in Table 5). If
breeding is the only method of increasing fissile material, it would imply a fall in the
20
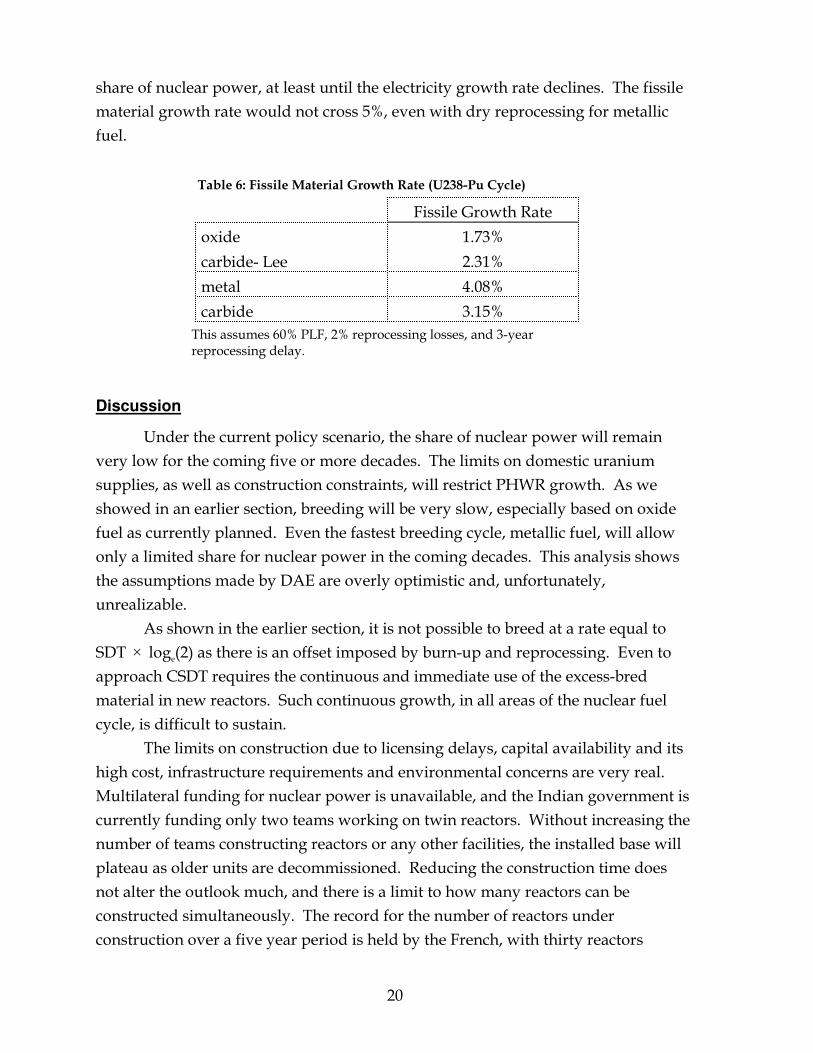
share of nuclear power, at least until the electricity growth rate declines. The fissile
material growth rate would not cross 5%, even with dry reprocessing for metallic
fuel.
Table 6: Fissile Material Growth Rate (U238-Pu Cycle)
Fissile Growth Rate
oxide 1.73%
carbide- Lee 2.31%
metal 4.08%
carbide 3.15%
This assumes 60% PLF, 2% reprocessing losses, and 3-year reprocessing delay.
Discussion
Under the current policy scenario, the share of nuclear power will remain
very low for the coming five or more decades. The limits on domestic uranium
supplies, as well as construction constraints, will restrict PHWR growth. As we
showed in an earlier section, breeding will be very slow, especially based on oxide
fuel as currently planned. Even the fastest breeding cycle, metallic fuel, will allow
only a limited share for nuclear power in the coming decades. This analysis shows
the assumptions made by DAE are overly optimistic and, unfortunately,
unrealizable.
As shown in the earlier section, it is not possible to breed at a rate equal to
SDT × loge(2) as there is an offset imposed by burn-up and reprocessing. Even to
approach CSDT requires the continuous and immediate use of the excess-bred
material in new reactors. Such continuous growth, in all areas of the nuclear fuel
cycle, is difficult to sustain.
The limits on construction due to licensing delays, capital availability and its
high cost, infrastructure requirements and environmental concerns are very real.
Multilateral funding for nuclear power is unavailable, and the Indian government is
currently funding only two teams working on twin reactors. Without increasing the
number of teams constructing reactors or any other facilities, the installed base will
plateau as older units are decommissioned. Reducing the construction time does
not alter the outlook much, and there is a limit to how many reactors can be
constructed simultaneously. The record for the number of reactors under
construction over a five year period is held by the French, with thirty reactors
21
(average) (Krishnan, Tongia et al., 1997). The Indian performance is far lower, and
that too for reactors of smaller capacity.
What Can Be Done?
Comparing Fuel Cycles
The importance analysis (Table 4) shows which parameters affect doubling
time more strongly. Are there any choices that can be made amongst the various
fuel types and fuel cycles that offer the promise of rapid breeding? Only metallic
fuel coupled with dry processing appears to be an attractive fuel option. However,
this technology has still not developed fully, let alone found commercial use. Even
metallic fuel is not adequate to produce fissile material rapidly enough for
increasing the percentage share of nuclear power
When comparing fuel cycles for rapid growth of fissile material, most
variables affect SDT monotonically. PLF14 is an important variable, not only for
reducing doubling time but also for the production of greater (and more economic)
power. Losses, which should be minimized for safety and economic reasons, affect
SDT most strongly in the Th-U233 cycle.
Reprocessing and fabrication are batch processes. One can decrease the time
needed for reprocessing by building extra capacity to operate in parallel. However,
this is uneconomic after a point as it increases the plant idle time. Extrapolating
from INFCE Table XXI, the reprocessing requirements for 30 GWe of U-Pu oxide
FBRs, for a two-year reprocessing and fabrication time, are on the order of 900 tons
heavy metal per year! This is based on a .55 reprocessing PLF. It is important to
note that reprocessing fuel with such a high burn-up has not been economically
tested. Such highly fissile fuel will typically have a much lower throughput than
spent LWR fuel for safety reasons (Krishnan, 1996). Clearly, the economics of
reprocessing need further examination.
Metallic fuel is also attractive if rapid breeding is the goal. However, it will
have a longer lead-time, as the technology is less developed in India. The bulk of
the experience with metallic fuel lies with US national labs, such as Argonne
National Laboratory (ANL).
Costs are difficult to assign to these technologies, if only because of limited
worldwide experience. In addition, Indian conditions are likely to be different.
What is known is that dry reprocessing promises to be cheaper (capital- and O&M-
14 PLF improvement is not directly a function of reactor configuration or fuel choice, but is a very important part of rapid breeding.
22
wise) than wet reprocessing. In addition, fabrication in the Th-U233 cycle is likely to
be more expensive than for the U238-Pu cycle, due to the γ-radioactive daughter
products. It requires remote fabrication. In terms of fuel costs, the metallic core
requires the least inventory15, and should thus be the cheapest, regardless of
reprocessing costs.
In terms of flexibility, reactors designed for metallic fuel can accommodate
oxide fuel, but the reverse is generally not true (Bhoje, 1996a).
Metallic Fuel Development
Metallic fuel is the only one easily capable of dry reprocessing, which offers
many advantages (listed below). It improves doubling time because of a reduced
Ext-Factor, as well as a reduced offset from CSDT. However, while reprocessing
and fabrication can be sped up in this process, the minimum cooling time will be
constrained to the time until the next reload. In fact, there are incentives to increase
the burn-up (to over 150,000 MWd/ton), resulting in a longer reload delay16. This is
because each reload (and simultaneous repairs and inspections) results in a down-
time on the order of one or more months (Krishnan, 1996). Also, each reprocessing
leads to losses.
There are other reasons why the metallic fuel cycle in conjunction with pyro-
processing is attractive. Safety is an important consideration. ANL has shown that
metallic fuel can offer passive safety, as was demonstrated by their 1986 test at EBR
II (Chang and Till, 1989; Chang, 1989). While metal fuel has a lower melting point
than oxide, the increased thermal conductivity more than compensates for this. Dry
reprocessing offers the possibility of actinide partitioning, meaning that many of the
long-term radioactive products can be reloaded into the reactor and burnt. If one
burns not only the plutonium but also other minor actinides such as Americium,
Neptunium, Curium, etc., the resulting high level waste (HLW) will decay to lower
radiation levels much sooner than standard HLW, in hundreds instead of thousands
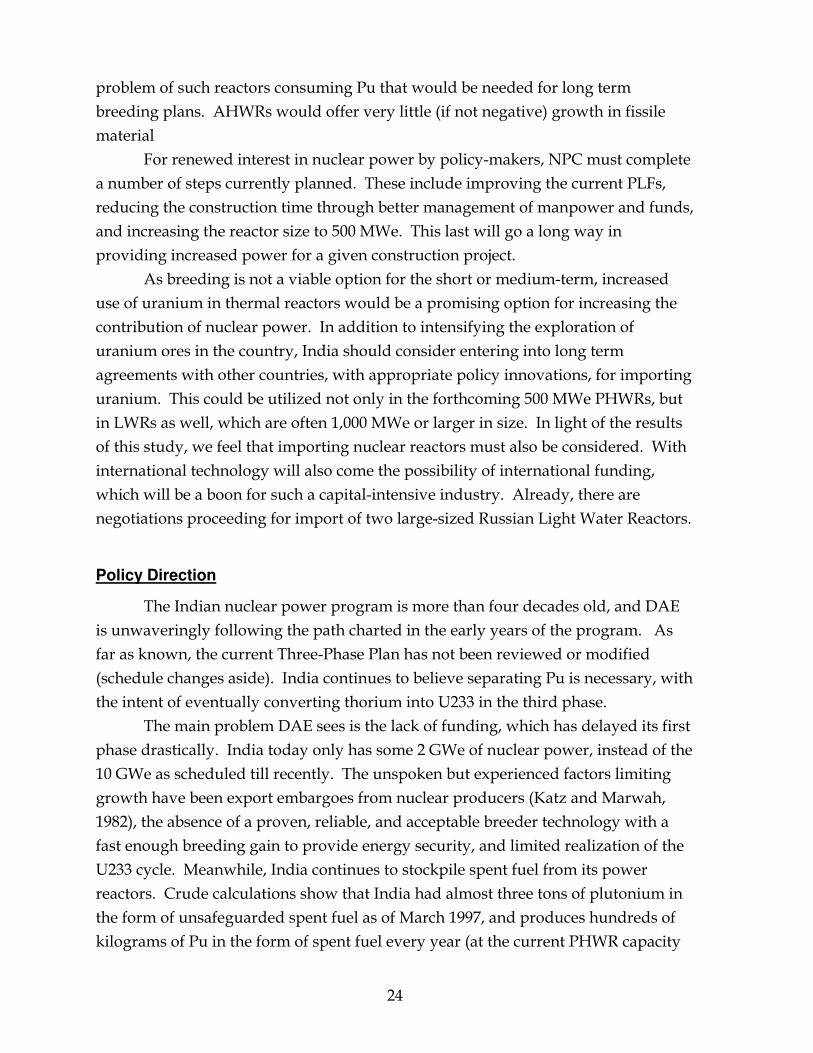
of years (Chang and Till, 1989; Hannum, 1991). Appendix H shows the effects of
actinide burning on radiation levels from wastes (Oye, Skolnikoff et al., 1995).
Non-Proliferation
One other crucial reason in favor of dry reprocessing is non-proliferation.
Spent fuel is not considered direct bomb material, because of its radiation levels as
15 This is for the U238-Pu cycle. 16 Metal fuel is capable of higher burn-ups because of a harder neutron spectrum, resulting in lower excess criticality at the beginning of a cycle (Chang and Till, 1989).
23
well as its poor fissionability. It has to be reprocessed to extract plutonium, and this
is the reason that reprocessing is of major concern regarding proliferation. Even
countries that have signed NPT, such as Japan, have been under pressure not to use
plutonium (safeguarded or not) (Oye, Skolnikoff et al., 1995; Solomon, 1993). The
throughput of plutonium envisioned for large-scale FBR deployment is on the order
of hundreds of tons per annum. Satisfactory techniques for safeguarding the large
quantities of plutonium found in reprocessing plants are still under evolution, and
this may turn out to be a major issue. However, the short-term policy of simply
disallowing reprocessing is not necessarily the answer.
Because of concerns arising out of large-scale availability of plutonium, the
US strongly discourages not only setting up new reprocessing plants but also
development of new technologies for reprocessing. This concern even extends to the
further development of FBR technology. One technology that could address these
concerns is pyro-processing.
The Purex process, the conventional method for reprocessing fuel in the
U238-Pu cycle, was developed with the goal of obtaining relatively pure plutonium.
That is no longer the goal as fast reactors can accept plutonium with impurities. In
dry reprocessing, plutonium is not isolated. A mixture of uranium and plutonium
with minor actinides and some fission products (making weapons virtually
impossible) can be the end product (Chang, 1989; National Research Council, 1992).
The smaller size of the dry reprocessing plant and fabrication facility leads to the
concept of an Integral Fast Reactor (IFR) (Chang and Till, 1986; Chang, 1989; Battles,
Miller et al., 1992). This involves co-location of the dry reprocessing facility with the
reactor, reducing transportation costs and risks, both safety and of diversion.
The Th-U233 cycle, though slower in growth, offers some non-proliferation
advantages. U233 (fissile) can be denatured by mixing it with U238 (fertile).
Weapons grade enrichment would then require isotopic separation.
Other Options for Nuclear Power in India
The role of thorium in thermal reactors needs further examination. India is
developing the Advanced Heavy Water Reactor (AHWR) as a means of utilizing
thorium. The AHWR will use a small plutonium seed while extracting some 75% of
its energy from thorium, which will be bred and burnt in-situ (Kakodkar and
Balakrishnan, 1990; Balakrishnan, Vyas et al., 1994). The AHWR will provide
numerous passive safety features, along with which the simplified design offers
lower capital costs. However, the AHWR is only in the planning stages, and will
likely take at least two decades before commercial deployment. There is also the
24
problem of such reactors consuming Pu that would be needed for long term
breeding plans. AHWRs would offer very little (if not negative) growth in fissile
material
For renewed interest in nuclear power by policy-makers, NPC must complete
a number of steps currently planned. These include improving the current PLFs,
reducing the construction time through better management of manpower and funds,
and increasing the reactor size to 500 MWe. This last will go a long way in
providing increased power for a given construction project.
As breeding is not a viable option for the short or medium-term, increased
use of uranium in thermal reactors would be a promising option for increasing the
contribution of nuclear power. In addition to intensifying the exploration of
uranium ores in the country, India should consider entering into long term
agreements with other countries, with appropriate policy innovations, for importing
uranium. This could be utilized not only in the forthcoming 500 MWe PHWRs, but
in LWRs as well, which are often 1,000 MWe or larger in size. In light of the results
of this study, we feel that importing nuclear reactors must also be considered. With
international technology will also come the possibility of international funding,
which will be a boon for such a capital-intensive industry. Already, there are
negotiations proceeding for import of two large-sized Russian Light Water Reactors.
Policy Direction
The Indian nuclear power program is more than four decades old, and DAE
is unwaveringly following the path charted in the early years of the program. As
far as known, the current Three-Phase Plan has not been reviewed or modified
(schedule changes aside). India continues to believe separating Pu is necessary, with
the intent of eventually converting thorium into U233 in the third phase.
The main problem DAE sees is the lack of funding, which has delayed its first
phase drastically. India today only has some 2 GWe of nuclear power, instead of the
10 GWe as scheduled till recently. The unspoken but experienced factors limiting
growth have been export embargoes from nuclear producers (Katz and Marwah,
1982), the absence of a proven, reliable, and acceptable breeder technology with a
fast enough breeding gain to provide energy security, and limited realization of the
U233 cycle. Meanwhile, India continues to stockpile spent fuel from its power
reactors. Crude calculations show that India had almost three tons of plutonium in
the form of unsafeguarded spent fuel as of March 1997, and produces hundreds of
kilograms of Pu in the form of spent fuel every year (at the current PHWR capacity
25
and modest load factors).17 Using the definition of 8 kg plutonium as significant
quantity (SQ) (Oye, Skolnikoff et al., 1995), an amount enough for a nuclear weapon,
India could choose to reprocess this fuel and make hundreds of nuclear devices18.
India has not signed NPT or the Comprehensive Test Ban Treaty (CTBT),
citing the discriminatory nature of these treaties as well as their explicitly not
mandating a time-frame for elimination of nuclear weapons (Subrahmanyam, 1985).
India was one of three countries that voted against CTBT. As a non-member of NPT,
CTBT, or the London Club, India is the only country with proven nuclear weapons
capabilities and fuel processing experience. In spite of a perceived isolation from
treaties, verification and control regimes, India has exercised great maturity in
safeguarding its materials and technology. As if to emphasize this restraint, India
has not yet reprocessed spent fuel from its power reactors on a large scale, and has
refused to yield to the demands of certain countries to share its plutonium
technology (Hussein, 1992).
The US nuclear euphoria of earlier decades, which led to a nuclear capacity of
almost 100 GWe being installed, has withered away. Other than plutonium fears,
which have led to an almost total abandonment of reprocessing and breeder
technology development19, the major concerns are environmental, safety, and lack of
commercial viability compared to other conventional and non-conventional energy
sources.
The present standoff between other nations and India on these issues has
neither brought down worldwide concerns of nuclear proliferation nor provided
reliable and safe power for India. We see four policy options available, and these
are summarized in Table 7.
The first option is to maintain the status quo of India going alone along its
Three-Phase Plan, with no transfer of technology or material (fuel) from other
countries. This is a lose-lose situation. This study shows that given the present
technology status and level of implementation, breeding with its touted energy
security is not going to be realizable at all. The world will have to be content with
India's track record in securing its nuclear technology and materials. Reduction of
plutonium stockpiles and bringing India under international safeguards will remain
elusive.
17 These amounts exclude safeguarded reactors (RAPS 1&2, TAPS 1&2). 18 Of course, this plutonium is not weapons-grade, meaning that a larger quantity than 8 kg is needed for criticality. 19 The recent announcement by DOE to consider burning weapons-grade plutonium in reactors (Wald, 1996) (along with vitrification as the other option) shows that the US government might change its views.
26
There is the possibility of the US practicing a benign neglect of India's nuclear
power program, not opposing India's acquiring technology from other members of
the London Club (second quadrant of Table 7). While India might consider this a
win situation, this may merely continue India's dependence on the Three-Phase
Plan, which this analysis has shown to be non-viable. The present high costs of
nuclear power20 and uncertainties regarding imports (especially without US
approval) make widespread deployment of even thermal power reactors difficult.
The world will not benefit, as India will continue to pursue its use of plutonium
without participating in international efforts to contain plutonium. Only those
reactors and materials of international origin would be subject to (islanded)
safeguards.
The policy opposite to the status quo, of persuading India to sign NPT and
CTBT, is no option at all. All political parties in India are united in their opposition
to India signing these treaties, which they perceive as perpetuating the current
nuclear hegemony and bringing India back in the colonial era. In addition, even
signing these treaties does not appear to ensure a free hand towards pursuing
plutonium use for power needs.
The fourth option is for other nations to agree to help set up thermal nuclear
reactors with an understanding that all the spent fuel would either be shipped back
to the supplier or remain under international safeguards. The irradiated fuel would
not be reprocessed until technologies that address proliferation concerns are
developed. India would also agree to not step up its plans for reprocessing the
current spent fuel, and would bring all domestic power reactor fuel under
international safeguards. It would also open up all its power reactors for inspection.
This option is worth considering as it will help India increase nuclear power
contribution in the short term while increasing worldwide collaboration for
plutonium containment and development of proliferation-resistant reprocessing
options. The world will also benefit with a "new" market for its nuclear industry.21
At present, India is in the first quadrant of Table 7. The US would ideally like
to see India in the third quadrant, while India would want the US to accept the
second. The fourth quadrant appears to be a worthwhile option, with benefits for
India and the US. The US, guaranteeing supplies of imported uranium22, would
20 Estimated final cost for a 500 MWe reactor (first of a kind) is 80 million rupees/MW (Sethi, 1996). 21 Since completion of this work, our attention was drawn to a January 1997 article by Haass and Rose suggesting Indo-US cooperation in nuclear power reactor development, but in a general manner (Haass and Rose, 1997). 22 The proven worldwide reserves of uranium under $130/kg are estimated at 4400 thousand tons, with an equal amount directly inferred. The current worldwide requirement is approximately 60
27
take the pressure off India's using FBR technology based on plutonium obtained
through wet reprocessing. India's energy concerns would be met, as would US
concerns about plutonium proliferation.
To make this last option realizable, laws in both countries will have to be
reinterpreted, or even modified. These may demand new presidential waivers and
policy directives. However, the improvements over the status quo for all concerned
are worth the pursuit of this option.
Table 7: Policy Options for India and the US
IV. Evolution of Cooperation:
All power reactors open for inspection
Import of nuclear technology and material
(once-through), with islanded safeguards
Dry reprocessing developed; no Pu
separated
I. Status Quo:
No cooperation
No future importing LWRs
India continues developing FBRs
India still has tons of Pu available from the
Purex process, all of which remains
unsafeguarded
III. Full Cooperation:
India signs NPT
India gains full access to Uranium, LWRs
US gains "victory", with enhanced non-
proliferation
Reprocessing remains an issue
II. Benign Neglect:
Limited access to imported Uranium, even
LEU for LWRs
India continues Three-Phase Plan
US concerns about Pu usage not addressed
thousand tons uranium per year, for an installed capacity of approximately 350 GWe (Krishnan, Tongia et al., 1997). These reserves are sufficient to allow India to import uranium and use it on a once-through basis for many decades.
28
References
Anderson, B., Frew, J. D., Pugh, O. and Thompson, P. J. (1994). Reprocessing the Fuel from the Prototype Fast Reactor. Nuclear Engineer 35(4): 129-133.
Bahadur, Jang (1996). Personal Communication. Dy. Director, Central Electricity Authority.
Balakrishnan, Kamala, Vyas, H. P., Saha, D., Anantharaman, K. and Dhawan, M. L. (1994). Development of Advanced Heavy Water Reactor. Bhabha Atomic Research Centre.
Balakrishnan, M. R. (1990). Growth Scenarios with Thorium Fuel Cycles in Pressurized Heavy Water Reactors. Indo-Japan Seminar on Thorium Utilization: Bombay.
Battles, J. E., Miller, W. E., Lineberry, M. J. and Phipps, R. D. (1992). IFR Fuel Cycle. 54th Annual Meeting of the American Power Conference.
Bhabha, H. J. (1955). The Role of Atomic Power in India and its Immediate Possibilities. First U.N. International Conference on the Peaceful Uses of Atomic Energy: Geneva.
Bhabha, Homi J. (1958). The Need for Atomic Energy in the Under-Developed Countries. Second UN International Conference on the Peaceful Uses of Atomic Energy: Geneva.
Bhabha, H. J. and Prasad, N. B. (1958). A Study of the Contribution of Atomic Energy to a Power Programme in India. Second UN International Conference on the Peaceful Uses of Atomic Energy: Geneva.
Bhoje, S. B. (1996a). Personal Communication. Director, Reactor Group, IGCAR.
Bhoje, S. B. (1996b). Status of Fast Reactor Development in India. IAEA International Working Group on Fast Reactors: Aktau.
Chang, Y. I. (1989). The Integral Fast Reactor. Nuclear Technology 88(November): 129-138.
Chang, Y. I. and Till, C. E. (1986). Integral Fast Reactor Concept. 48th American Power Conference.
Chang, Y. I. and Till, C. E. (1989). Evolution of the Liquid Metal Reactor. The IFR Concept. 51st American Power Conference.
Chidambaram, R. (1995). Plutonium- A Valuable Asset for India. 48th Annual Session of the Indian Institute of Chemical Engineers (Chemcon 95): Kalpakkam.
Chidambaram, R. and Ganguly, C. (1996). Plutonium and Thorium in the Indian Nuclear Programme. Current Science 70(1): 21-35.
DAE (1995a). Annual Report. DAE, Government of India.
DAE (1995b). Parliament Q&A Monsoon Session. DAE, Govt. Of India.
Dayal, M., Paranjpe, S. R., Prasad, N. B. and Singh, B. (1958). Study of Fuel Cycles with Reference to a Power Programme. Second UN International Conference on the Peaceful Uses of Atomic Energy: Geneva.
DOE/EIA (1995). Annual Energy Review 1994. Energy Information Administration.
Editors (1995). Datafile: INDIA. Nuclear Engineering International(February).
Energy Committee (1990). The Fast Breeder Reactor. House of Commons, 1989-90 Session.
Haass, Richard N. and Rose, Gideon (1997). Facing the Nuclear Facts in India and Pakistan. The Washington Post: Washington, D. C., January 5, 1997, p. C02.
29
Hannum, W. H. (1991). The IFR Modern Nuclear Fuel Cycle. International Power Generation Conference, ASME.
Hussein, Abid (1992). Personal Communication. Former Indian Ambassador to US.
IAEA (1995). Operating Experience with Nuclear Power Stations in Member States in 1994. IAEA.
INFCE (1980). Fast Breeders. International Fuel Cycle Evaluation Conference (INFCE)/IAEA.
Kakodkar, Anil and Balakrishnan, Kamala (1990). Advanced Heavy Water Reactor. Indo-Japan Seminar on Thorium Utilization: Bombay.
Katz, James Everett and Marwah, Onkar S. (1982). Nuclear Power in Developing Countries. Lexington Books: Lexington.
Krishnan, L. V. (1996). Personal Communication. Director, Safety Research and Health Physics, IGCAR, DAE.
Krishnan, L. V., Tongia, Rahul and Arunachalam, V. S. (1997). India's Three-Phase Program Re-visited (draft). Engineering and Public Policy, Carnegie Mellon University.
Lee, S. M. (1996). Personal Communication. Head, Reactor Physics Group, IGCAR, DAE.
Lee, S. M., John, T. M., Krishnakumar, P. T. and Ganesan, S. (1990). Study of Characteristics of Advanced LMFBRs with Alternative Fuels. India-USSR Seminar on Fast Breeder Reactor Core Physics: Kalpakkam, India.
Lee, S. M. and Kimura, Itsuro (1988). On the Utilization of Thorium in Fast Breeder Reactors. Summer Seminar on Reactor Physics: AESJ, Kyoto University.
Marshall, W., Ed. (1983). Nuclear Power Technology, Volume 2: Fuel Cycle. Oxford, Clarendon Press.
Ministry of Power (1996). 1995-96 Annual Report. Ministry of Power, Govt. of India.
National Research Council (1992). Nuclear Power Technical and Institutional Options for the Future. National Academy Press: Washington, D.C.
NPC (1993). Performance of Nuclear Power Stations. NuPower, 7, 11 & 12, p. 3-4.
NPC (1997). Performance of NPCIL. Nuclear Power Corp. of India Ltd.,: Mumbai.
Nuclear Engineering International (1996). Power Plant Performance. Nuclear Engineering International(August): 12-15.
Oye, Kenneth, Skolnikoff, Eugene and Suzuki, Tatsujiro (1995). International Responses to Japanese Plutonium Programs (working paper). Center for International Studies, MIT.
Paranjpe, S. R. (1992). Beyond FBTR. Seminar on Indian Fast Reactor Program (FOPSAK): Kalpakkam.
Ramanna, Raja (1997). Inevitability of Nuclear Energy. Current Science 73(4): 319-326.
Ramanna, R. and Lee, S. M. (1986). The Thorium Cycle for Fast Breeder Reactors. Pramana- J. Phys. 27(1&2): 129-137.
Rodriguez, Placid (1996). Fast Breeder Reactors: The Route to India's Energy Security and the Mission of Indira Gandhi Centre for Atomic Research. Twelfth Professor Brahm Prakash Memorial Lecture: Bangalore, Indian Institute of Metals, Bangalore Chapter.
30
Sethi, V. K. (1996). FBR Economics- Personal Communication. IGCAR, DAE.
Solomon, Kenneth Alvin (1993). Plutonium for Japan's Nuclear Reactors. RAND.
Subrahmanyam, K., Ed. (1985). Nuclear Proliferation and International Security. New Delhi, Institute for Defense Studies and Analyses.
Sundaram, C. V. (1996). Personal Communication. Former Director, IGCAR.
The Hindu (1996). Bleak Power Scenario-- Editorial. The Hindu Business Line, February 23, 1996.
Wald, Matthew L. (1996). Agency to Pursue 2 Plans to Shrink Plutonium Supply. New York Times: New York, December 10, 1996, p. A1,C25.
Waltar, A. E. and Reynolds, A. B. (1981). Fast Breeder Reactors. Pergamon Press:
LMFBR · Unmoderated design using liquid metal coolant · Req. high enrichment
Under development
Nuclear Cycle Equations:
Th-U233 Cycle
U Pa (unstable)Th n + Th 233
92
233
91
233
90
1
0
232
90
--
→→→ ββ Equation 4
U238-Pu Cycle
Pu Np (unstable) U n + U 239
94
239
93
239
92
1
0
238
92
--
→→→ ββ Equation 5
Subsequent absorption of neutrons by Pu239 leads to higher isotopes of Pu, as well as other elements heavier than Pu known as higher actinides.
32
Appendix B SDT Model Influence Diagram
PLF
SDT
Fissile
Beginning of
Cycle
Cycles/yrFissile End
of Cycle
Delay till
ReloadExt. Factor
Fuel Types
Fissile/Fertile
MaterialFissile Loss
Fissile Gain
Figure 3: Influence Diagram for System Doubling Time Model
SDT is proportional to the total cycle fissile inventory (beginning of cycle plus out-of-pile) and inversely proportional to the net gain per cycle and the number of cycles per year. SDT calculations are performed across fuel cycles and fuel types.
33
Appendix C Worldwide Experience with Fast Reactors
Table 9: Worldwide Experience with Fast Reactors
Country Plant Power Output MWt/MWe
Characteristics Status (Jan. 92)
France Rapsodie 24 (40)/ - MOX, loop-type shutdown
Phenix 563/254 MOX, pool-type operating since 1974
Superphenix 3000/1240 MOX, pool-type operating since 1985
SPX 2 /1500 MOX, pool-type development on hold
DeBeNe KNK II 60/21 MOX, loop-type operating since 1974
SNR 300 730/327 MOX, loop-type Abandoned after construction
on account of political decision
SNR 2 /1380 MOX development on hold
India FBTR 42/15 Carbide, loop-type operating since 1985, electrical
generation expected in 1997
PFBR 1200/500 MOX, pool-type under development
Italy PEC 123/ MOX, loop-type abandoned due to political
reasons
Japan JOYO 100/ MOX, loop-type
MONJU 714/280 MOX, loop-type under construction
USSR BR 2 .1/ Pu-Metal, Hg
coolant
dismantled
BR5 (BR 10) 5 (10)/ multi-fuel, pool-type in operation
This assumes a 10 year construction schedule, and 20-25 year plant life. Soon after KARP begins operation, the current plants go off-line. Subsequent constructions are all of 350 tons PHWR spent fuel/yr. capacity. After a point, the only constructions are to replace decommissioned plants. By the turn of the century, it is more economical to reprocess spent fast fuel than PHWR fuel. This is because of the vastly greater fissile amount per ton processed.
37
Appendix F Growth of Electrical Capacity
0
200
400
600
800
1000
1200
1400
1995
2015
2035
2055
2075
2095
2115
2135
2155
2175
2195
Year
Overall Capacity
Nuclear Capacity
(Oxide FBRs)
Figure 5a: Installed Electrical Capacity in India
The nuclear curve is based fissile availability using oxide FBRs with .6 PLF, 2% reprocessing losses, and a 3-year reprocessing delay. It also assumes 70,000 tons U available for PHWRs, and 4 teams constucting pairs of PHWRs.
0
1
2
3
4
5
6
1995
2015
2035
2055
2075
2095
2115
2135
2155
2175
2195
Year
Figure 5b: Electricity Growth Rate in India
Both the above figures are based on a saturation population of 1.5 billion, overall PLF of .55, a current growth rate of 5% that will continue for 24 years, and a .5% residual growth rate. The growth rate decreases ≈linearly until saturation, after which the residual growth rate applies.
38
Appendix G Share of Nuclear PowerVarying PLFs
0
5
10
15
20
25
30
351995
2015
2035
2055
2075
2095
2115
2135
2155
2175
2195
Year
0.7
0.6
0.5
0.4
PLF
Figure 6a: Metallic Fuel, U238-Pu Cycle.
0
5
10
15
20
25
30
35
1995
2015
2035
2055
2075
2095
2115
2135
2155
2175
2195
Year
0.7
0.6
0.5
0.4
PLF
Figure 6b: Oxide Fuel, U238-Pu Cycle.
Figures 6a and 6b: Share of Electricity Generation Capacity by Nuclear Power with Varying PLFs, Oxide and Metallic Fuel Cycles. PLF is the parameter most strongly affecting fissile material growth. Other parameters are chosen at optimistic levels, except delay. Losses are 1%, available uranium is 90,000 tons, 4
39
teams are available to construct PHWRs, and the reprocessing delay is 3 years. This is a limit on the share based on fissile availability, and does not account for contingencies or delays in any part of the fuel cycle.
40
Appendix H Radiological Toxicity
Figure 7: Benefits of Actinide Burning
This shows only the radiation reduction benefits from actinide burning (Oye et al, 1995).
41
Further Study
A comprehensive analysis must examine the role of Pu from a commercial
point of view. What credit is being assigned (or implicitly computed) by DAE for
Pu? Worldwide today, there is no credit for plutonium.
Reprocessing in general also needs further examination, especially in view of
higher losses expected for various designs planned in India. There is limited
experience reprocessing fast reactor fuel anywhere in the world. While the technical
feasibility of wet reprocessing has been shown at Dounreay (Anderson, Frew et al.,
1994), this says nothing of likely batch sizes or throughputs.
The policy changes in US and India necessary for moving out of the status
quo is a matter of great importance. The realizability of the four policy options
presented in Table 7 is material for further study.