Proceedings World Geothermal Congress 2015 Melbourne, Australia, 19-25 April 2015 1 Current Status of Technology Development for Geothermal Reservoir Evaluation and Management Takashi OKABE, Tatsuya SATO, Kazumi OSATO 1 , Kazuhiro SAEKI 2 , Keiichi SAKAGUCHI 3 , Kenji FUJIMOTO, Tadaaki SHIMADA, Toshiyuki TOSHA 4 1 Geothermal Research and Development Co., Ltd., Shinkawa 1-22-4, Chuo-ku, Tokyo 103-0044, Japan. 2 Okuaizu Geothermal Co., Ltd., 1034-1 Kaminotaira, Sunakohara, Yanaizu-machi, Kawanuma-Gun, Fukushima 969-7321, Japan. 3 Advanced Industrial Science and Technology, Central 7, 1-1-1 Higashi, Tsukuba, Ibaraki 305-8567, Japan. 4 Japan Oil, Gas and Metals National Corporation, 10-1, Toranomon 2-chome, Minato-ku, Tokyo 105-0001, Japan. [email protected], [email protected], [email protected], [email protected], [email protected], fujimoto- [email protected], [email protected], [email protected]Keywords: EGS, R&D, JOGMEC, Water recharge, Recharge well, Superheated reservoir, Simulation, TOUGH2,MINC model, Yanaizu-Nishiyama, Okuaizu, Fukushima ABSTRACT An R&D project funded by Japan Oil, Gas and Metals National Corporation (hereafter referred to JOGMEC) on technology development for geothermal reservoir evaluation and management is under way. The purpose of the project is to propose guidelines for a technical manual, based on numerical simulation and model verification, for better understanding of artificial water recharge effects to geothermal reservoirs and/or hot spring aquifers. Relevant examples include steam shortages resulting from the imbalance between the steam production rates and the natural water recharge; corrosion of surface facilities by superheated steam; and production of highly acidic fluid generated by superheating within the geothermal reservoir. These problems are widespread, and occur not only in existing geothermal power plants, but also in new geothermal power plants and in newly developing areas. Our aim is to develop new and general countermeasures to such problems, which are both technically effective and cost effective. We will then collate these comprehensive measures into a new set of guidelines to ensure a stable supply of geothermal energy. Artificial water recharge is one of the EGS (Enhanced Geothermal Systems) technologies which has been successfully applied and shown to increase steam supply in the Geysers and Larderello geothermal fields. We will develop and verify our artificial water recharge technology through R&D set in the Okuaizu geothermal field in Fukushima prefecture, whose installed capacity is 65MW and has been running since 1995. The utilization factor of this power plant has reduced today to 43.6%, mainly because of depletion of steam, the superheating effect, acidification and decline of productivity and/or injectivity. The R&D project consists of project planning, design & management, survey and modeling, design and construction of test facility, drilling of a recharge well, well test and logging, operation of recharge test, numerical reservoir simulation, monitoring, and preparation of a technical operation manual. In order to locate a recharge well, extensive reservoir simulations at superheated conditions by using TOUGH2 with the MINC model, are underway. Recharge simulation shows shallow depth injection is more effective than deep injection, because it recovers heat from subsurface rock mass where geothermal fluid has been almost depleted, and acts similarly to a Hot Dry Rock system. In contrast, deep injection tends to block fluid flow supplied from the deeper two phase zone, and depends on the injection rate. The risk to production from cold sweep will be evaluated by tracer analysis and past field injection tests, separately. The location of the recharge well will be decided by the comprehensive analysis of the simulations and the risk evaluation. 1. INTRODUCTION The concept of EGS(Enhanced Geothermal Systems) includes artificial reservoir creation and energy extraction (hereafter referred to as Type A), extension of fractured zones and increasing productivity/injectivity by hydraulic fracturing (hereafter referred to as Type B), and artificial water recharge (hereafter referred to as Type C). The Desert Peak and Bradys projects in the United States focuses on research on the extension of the fractured zone and increasing productivity/injectivity by stimulation of a low permeability well (Type B). An example of a Type A project is in Australia, where artificial reservoir creation and energy extraction by hydraulic fracturing is in use, but has encountered economic problems, as well as producing an unusual overpressured zone at greater depth. In Europe, the technique aiming to use deep geothermal water (Type B), and recover heat by reservoir creation by hydraulic fracturing in low to moderate temperature rock mass, has been employed. A Type B example occurs in Germany, FIT (feed-in tariff). A Hot Dry Rock project (Type-A) was carried out in Hijiori, Ogachi and east Hachimantai, Japan, yielding various results and knowledge, but these projects finished before showing the economical prospect for commercial power generation (e.g. Matsunaga et al., 1995; Kaieda et al., 1995). On the other hand, research on Type C projects is important since several geothermal power plants require the artificial water recharge to support the power output. One of the geothermal power plants which have problems such as reservoir superheating and acidification by the reservoir superheating is the Okuaizu geothermal area in Fukushima prefecture. Utilization factor of the facilities (Actual power output/Permitted capacity × Power generation hours × 100%) has fallen below half of that at the start. Commercial operation of the Yanaizu-Nishiyama power plant started in 1995 by Okuaizu Geothermal Co., Ltd (geothermal developer and steam supplier) and Tohoku Electric Power Co., Inc. (power generation), but the amount of steam has
Transcript
Proceedings World Geothermal Congress 2015
Melbourne, Australia, 19-25 April 2015
1
Current Status of Technology Development for Geothermal Reservoir Evaluation and
Management
Takashi OKABE, Tatsuya SATO, Kazumi OSATO1
, Kazuhiro SAEKI2
, Keiichi SAKAGUCHI3
, Kenji FUJIMOTO,
Tadaaki SHIMADA, Toshiyuki TOSHA4
1
Geothermal Research and Development Co., Ltd., Shinkawa 1-22-4, Chuo-ku, Tokyo 103-0044, Japan.
decreased every year along with superheating problems. Fluid acidification phenomenon followed by superheating occurred
requiring the discontinuation of production in some of the wells. Therefore, it is important to establish technology for water
recharge and its know-how by using the Okuaizu geothermal field as Type C EGS R&D project in Japan.
Type C examples have been seen overseas, municipal effluent water from Clear lake and Santa Rosa has been injected in wells in
the Geysers geothermal area from 1997 improving levels of power generation as well as reducing concentrations of non-
condensable gas (Sanyal and Enedy, 2011). In the Larderello geothermal field in Italy, artificial water recharge was carried out
from 1970’s after the steam production rate went down and the reservoir was superheated. As a result of the injection, steam
production rate increased and non-condensable gas concentration also reduced (Capetti, 1995). However, it is thought that these
artificial water recharge designs were not based on detailed simulation, an operation manual and/or a detailed plan. The geothermal
structure in Japan is smaller and rather complicated compared with overseas and technology development is required to pay
attention to environmental preservation such as hot spring monitoring, pressure/temperature maintenance in a borehole and
reservoir sustainability is also required.
Up to now, a comprehensive R&D project including evaluation of a recharge well in a superheated reservoir by extensive
simulation, drilling the recharge well, injection testing and evaluation of the injection test results has not yet been carried out. This
five year project started in 2013 and the purpose is to develop a guideline for an artificial water recharge technology and to develop
a technical manual through a verification test and numerical simulation for the artificial water recharge effect on the geothermal
reservoir and/or hot spring aquifer.
This paper reports on an extensive simulation including a model of the Okuaizu superheated geothermal reservoir in order to
identify optimal recharge well targets.
2. PROJECT OVERVIEW
2.1 Okuaizu Geothermal Field in Fukushima
The Okuaizu geothermal field is located in northeastern Japan (Fig.1). Exploration of the Okuaizu geothermal field commenced
with a reconnaissance survey by Mitsui Mining and Smelting Co., Ltd. (MMSC) in 1974. Subsequently, the first-phase geological,
geophysical and geochemical surveys were conducted by the New Energy Development Organization (NEDO) from 1976 to 1977.
After a geophysical and geochemical survey by MMSC in 1981, the second phase geological, geochemical and geophysical surveys
by NEDO were conducted from 1982 to 1983 (NEDO, 1985). In 1983, Okuaizu Geothermal Co., Ltd (OAG) was established to
carry out further exploration and assessment, and to undertake development. From 1984 to 1985, OAG carried out geological,
geophysical and geochemical surveys, and drilled five cored wells and four other wells. Production tests of 18 to 119 days for each
productive well were also conducted. From 1986 to 1989, 13 more wells were drilled, with 30 to 109 day production tests
conducted for each production well (Nitta et al., 1987). A total of 509 t/h of dry steam at about 165 °C from nine wells was
confirmed during a three month simultaneous production test, from December, 1989, to February, 1990 (Nitta et al., 1990). Three
additional production wells were drilled after that initial reservoir evaluation and the commercial operation started with the capacity
of 65MW in 1995. Presently, the utilization factor of this power plant has reduced today to 43.6%, mainly because of depletion of
steam, the superheating effect, acidification and decline of productivity and/or injectivity.
Figure 1: Location map of the Okuaizu geothermal field after Seki(1991).
2.2.1 Geology
The bedrock in these areas is composed of granite dating from the Paleozoic to Mesozoic era and from the late Cretaceous to the
Paleogene period, where relief structures elongated in a north-south direction are found. Apart from the array of this bedrock, green
tuff of the Miocene period of the Neogene, spreading over the entire region of the Tohoku District, is also formed around these
areas.
The geological stratigraphy in the areas consists of, in order of lower to higher layers, the Ohizawa and Takizawagawa layers of the
early Miocene period in the Neogene, the Ogino layer (including the Miyashita mudstone layers) of the early to mid Miocene
Okabe et al.
3
period, the Urushikubo layer of the mid to late Miocene period, the Fujitoge-Izumi layer of the late Miocene to the Pliocene periods,
the Nanaorizaka layer of the early to mid Pleistocene period in the Quaternary, the Sunagohara layer (including the Yunotake
rhyolite) of the early to late Pleistocene, terrace deposits of the late Pleistocene to the mid Holocene period, marsh volcanic
products of the late Holocene period, and the Alluvium.
The Ohizawa layer, located at the northern edge of the Aizu Basin, has been found in the core 1,800 meters deep in these areas,
where sandstones originating mainly from neutral to acid volcanic products have developed so as to give an inter-finger relationship
with conglomerate stones. The Takizawagawa layer is widespread across areas ranging from the Tadami to Miyashita areas and is
successively distributed with a layer thickness of about 1,000 meters under the ground in these areas. This layer is composed
mainly of rhyolitic pyroclastic rocks with rhyolitic lava placed there between in a transitional inter-finger manner. The Ogino layer
is widely distributed across these areas, and consists of rhyolitic pyroclastic rocks that have been thought to result from acid
volcanism at the bottom of the sea. Under this layer, the black-colored Miyashita mudstone layers (layer thickness in these areas is
dozens of meters) have developed, playing a role of a key bed in the stratigraphic classification. The Urushikubo layer is distributed
in the southern and northern parts of these areas and has lithofacies that significantly varies from place to place, consisting of
mudstones, sandstones, tuff, lime stones, rhyolitic lava and others.
Judging from the distribution of geologic strata, the direction of fold axes, the direction of the intrusive rock, and the direction of
faults, these areas have a prominent north-west to south-east geological structure. Typical fault structures include the Chinoikezawa
fault which consists of Chinoikezawa footwall fault, Chnoikezawa fault and Chnoikezawa hanging wall fault, the Oyasuzawa fault,
the Sarukurazawa fault, and the Oizawa fault (Fig. 2 and Fig.3). Others include north-east to south-west structures, represented by
the Takiyagawa fault, and, in a broader region, north to south structures where bedrock relief structures have been extending.
Figure 2: Cross section of the Okuaizu geothermal structure.
2.2.2 Geothermal Structures
In these areas, geothermal fluid is reserved mainly in north-west to south-east Chinoikezawa, Oyasuzawa, Sarukurazawa faults, and
other fracture zones around these faults. Portions with high temperatures in excess of 300 degrees Celsius lie 1,000 meters below
sea level under the fractured zones of the Chinoikezawa fault. Based on the results of temperature logging, the Takiyagawa fault
(including part of the Ohizawa layer) is thought to have hot water convective zones so as to have a two-dimensional extent.
The heat source is believed to be several kilometers under the acid volcanic rocks, which have been becoming solidified. However,
it remains uncertain whether it has resulted from the activities of the Yunotake rhyolite or from an association with marsh volcanic
activities or from other volcanic activities that have not so far led to an eruption until now.
Concentrating on the north-east to south-west Takiyagawa fault, the alteration zones in these areas are widely distributed across the
Chinoikezawa, Sarukurazawa, and Oizawa faults. As altered minerals, smectite stands out in the middle of the alteration zones,
while mordenite stands out in the northern and southern parts. Also, kaolinite is locally distributed in the vicinity of an intersection
between the Takiyagawa fault and the Oizawa fault. The areas where the alteration zones are distributed, as well as the Miyashita
mudstone layer, have extremely low water permeability, playing a role of a cap rock that prevents the geothermal fluid from
dissipating in shallow layers and prevents underground water in the shallow layers from entering the geothermal fluid reservoir.
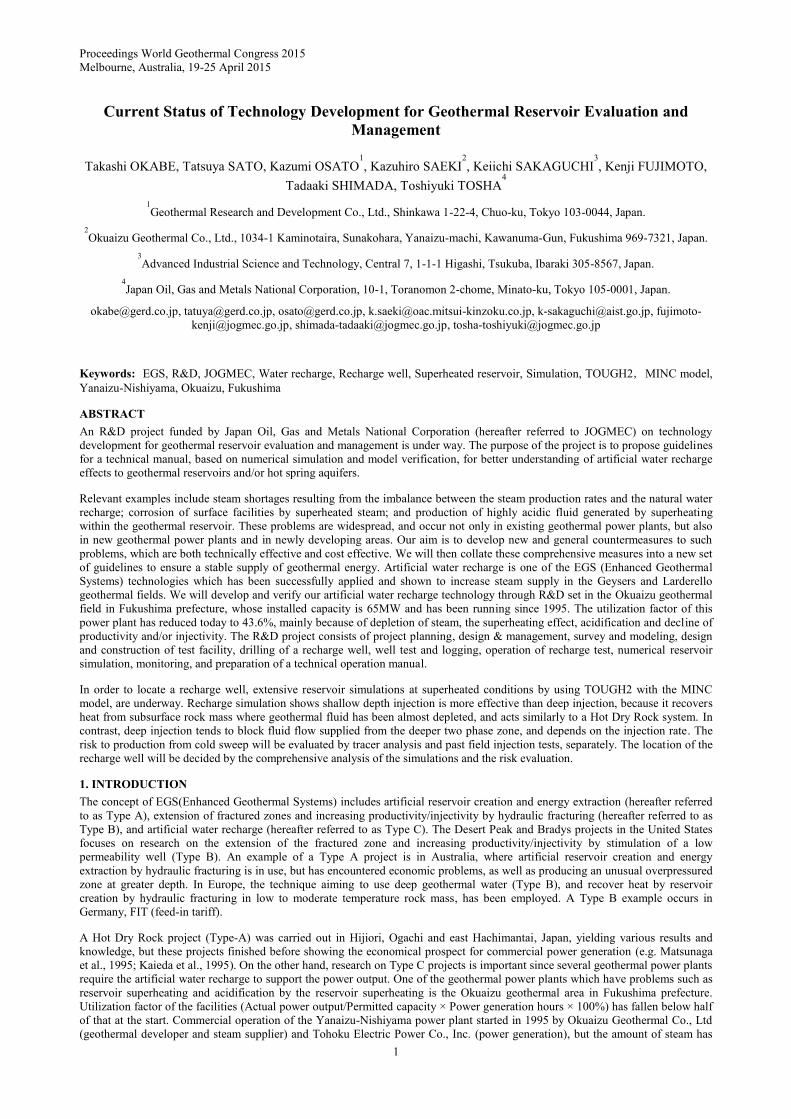
The geothermal reservoirs in the Chinoikezawa footwall fault and Chinoikezawa southeast fault have been gradually superheated
from the decrease of the pressure and some of the wells in the Chinoikezawa southeast fault had to be suspended by acidification
caused by the superheating effect (Fig.3). Note the numbers in the figure show degree of the superheat.
2.2 Outline of the project
The duration of this project is five years starting from 2013, and the purpose is to develop a guideline for an artificial water
recharge technology and to develop a technical manual through a verification test and numerical simulation clarifying the impact of
artificial water recharge on the geothermal reservoir and/or hot spring aquifer.
Onogawara faultChinoikezawa faults
Sarukurazawafault
Basement rock
Heat Source
Takiyagawa formation
Miyasita mudformastion
Oizawa fault
Ohhisawa formation
Urushiharaformation
Oginoformation
Quaternary deposit
Alteration zone
SW NE
Okabe et al.
4
Figure 3: Outline of the Okuaizu geothermal field (Plan View).
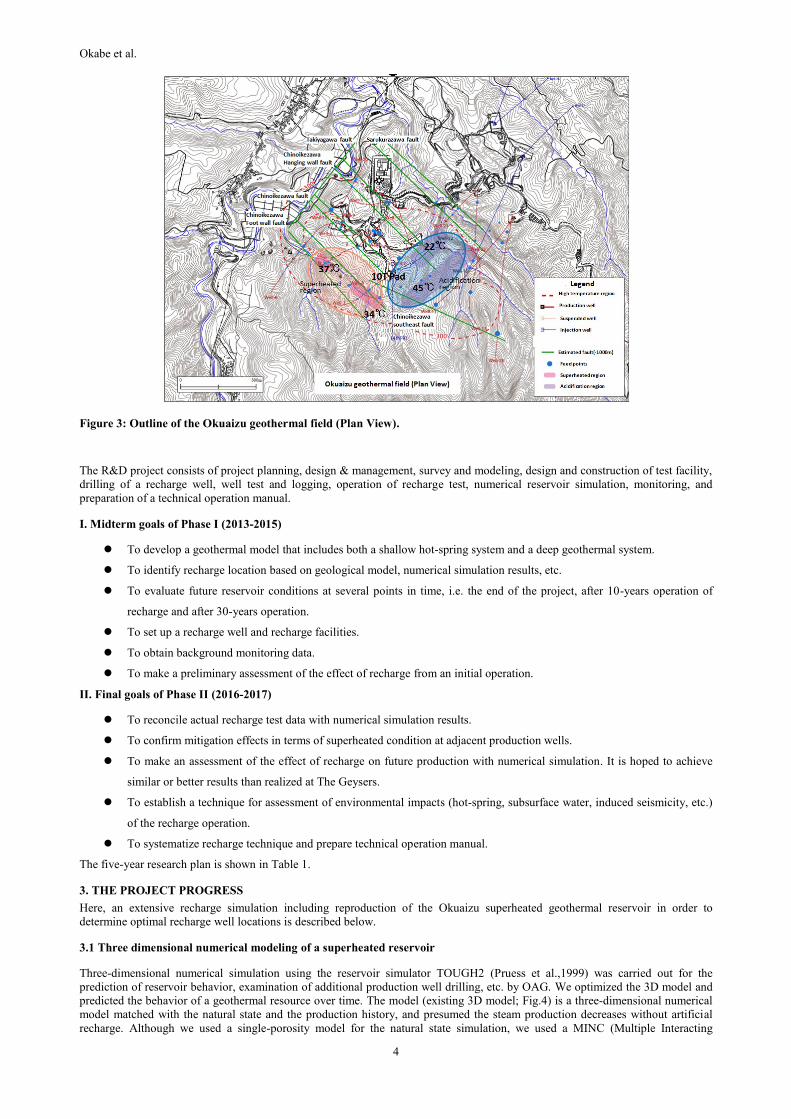
The R&D project consists of project planning, design & management, survey and modeling, design and construction of test facility,
drilling of a recharge well, well test and logging, operation of recharge test, numerical reservoir simulation, monitoring, and
preparation of a technical operation manual.
I. Midterm goals of Phase I (2013-2015)
To develop a geothermal model that includes both a shallow hot-spring system and a deep geothermal system.
To identify recharge location based on geological model, numerical simulation results, etc.
To evaluate future reservoir conditions at several points in time, i.e. the end of the project, after 10-years operation of
recharge and after 30-years operation.
To set up a recharge well and recharge facilities.
To obtain background monitoring data.
To make a preliminary assessment of the effect of recharge from an initial operation.
II. Final goals of Phase II (2016-2017)
To reconcile actual recharge test data with numerical simulation results.
To confirm mitigation effects in terms of superheated condition at adjacent production wells.
To make an assessment of the effect of recharge on future production with numerical simulation. It is hoped to achieve
similar or better results than realized at The Geysers.
To establish a technique for assessment of environmental impacts (hot-spring, subsurface water, induced seismicity, etc.)
of the recharge operation.
To systematize recharge technique and prepare technical operation manual.
The five-year research plan is shown in Table 1.
3. THE PROJECT PROGRESS
Here, an extensive recharge simulation including reproduction of the Okuaizu superheated geothermal reservoir in order to
determine optimal recharge well locations is described below.
3.1 Three dimensional numerical modeling of a superheated reservoir
Three-dimensional numerical simulation using the reservoir simulator TOUGH2 (Pruess et al.,1999) was carried out for the
prediction of reservoir behavior, examination of additional production well drilling, etc. by OAG. We optimized the 3D model and
predicted the behavior of a geothermal resource over time. The model (existing 3D model; Fig.4) is a three-dimensional numerical
model matched with the natural state and the production history, and presumed the steam production decreases without artificial
recharge. Although we used a single-porosity model for the natural state simulation, we used a MINC (Multiple Interacting
Okabe et al.
5
Continua) model in the history matching (recharge simulation was included) in order to express the fluid flow more accurately. The
result of the natural state simulation is substituted as the initial condition of the MINC model.
Table 1: Five year R & D Plan.
Figure 4: Simulation models.
Although the geothermal reservoir is superheated from the decrease of the pressure in the Okuaizu geothermal field, it is thought
that the superheated region spreads to depth as well. At the beginning, we tried to revise the model to produce a superheat reservoir
in the deep region. However, the calculation would not stabilize and failed to reproduce the superheated condition. Then, we
decided to build a two-dimensional model (2D recharge model) for the Chinoikezawa footwall fault. The 2D recharge was created
to be consistent with the existing 3D model. We carried out case studies using this 2D model and successfully created a superheated
reservoir following the production as well as confirming the effect of artificial recharge into the superheated region.
Next, we modeled the entire production zone to reproduce the superheated region in two faults of Chinoikezawa southeast and
Chinoikezawa footwall faults where enhanced superheating was seen. The two fault models were created and simulations were
carried out separately and the presence of superheated regions were confirmed in each fault model. Both models were combined
together as a 3D model (3D recharge model;Fig.4, Fig.5) and a simulation was carried out based on the conditions of the 2D
recharge model of the Chinoikezawa footwall fault to check if both models are superheated moderately. Subsurface interconnection
among Chinoikezawa hanging wall, Chinoikezawa and Chnoikezawa footwall faults through a shallow feed point of -718mals of
Research &
DevelopmentContents
Phase I Phase II
FY2013(2013.4-2014.3)
FY2014(2014.4-2015.3)
FY2015(2015.4-2016.3)
FY2016(2016.4-2017.3)
FY2017(2017.4-2018.3)
Project Planning,Design & Management
• Management of project and data
Survey and Modeling
• MT method, AMT method, Gravity survey• Integrated analysis, Development of geological model, geothermal model• (supplemental survey as needed to update models)
Design and Construction ofTest Facility
• Design and drilling/construction of a recharge well and recharge facilities (water intake, piping)
Well Test and Logging
• Before recharge test: Well test and logging for monitoring well/s and recharge well• After commencement of recharge test: PTS sampler logging for
production wells
Operation of Water Injection
• Recharge of surface water (increase recharge rate in stages so as to adjust at proper level)
NumericalReservoir Simulation
• Before recharge test: Forecast calculation for several cases to optimize recharge conditions• After commencement of recharge test: Update numerical model with using actual data obtained, and forecast calculation
Monitoring
• Down-hole continuous PT monitoring on monitoring well• Multi phase tracer test• Micro-seismic monitoring
• AMT method• Hot-spring sampling
Preparation of TechnicalOperation Manual
• systematize recharge technique and prepare technical operation manual
Okabe et al.
6
well-12 was confirmed by the tracer test described in 3.3.1. A suitable permeable region and the permeability of the boundary of the
two fault models were examined by changing the parameters by six patterns. Also fluid sources have been arranged at the base of
the model based on the temperature distribution and the fault locations and the production history (January, 1995 - January, 2014).
Figure 5: 3D recharge model.
In order to complete the 3D recharge model, a deliverability option was used for the recharge simulation and the productivity index
was adjusted to follow the decreasing trend of flow and pressure of the history matching result. Table-2 shows the simulation
parameters used for the 3D recharge model (MINC model). In order to re-create a superheated reservoir, permeability for the
matrices was required to set to be very low based on the idea that fractures consist of the reservoir rather than the matrices. And
thus capillary pressure is set to be zero for the matrices. Relative permeability and capillary pressure behavior of fractures is not
well known and we have assumed that fracture capillary pressures are negligibly small according to the Okuaizu filed simulation
history and also from Pruess and Enedy(1993) at the Geysers injection simulation and Vedova et al.(2007) at the Larderello
geothermal field modeling. van Genuchten with irreducible water saturation 0.6 for liquid phase and Corey with irreducible gas
saturation 0.05 for steam phase are used as relative permeability function respectively (Fig. 6). The larger irreducible water helps
the enthalpy match and create the superheated reservoir. An investigation on the capillary pressure is to be done in the future.
Parameters of the reservoir model include the relative permeability and capillary pressure that are to be reviewed based on an actual
recharge test.
Figure 6 Relative permeability
3.2 Optimal model and recharge simulation
Calculation of the recharge simulation was conducted in parallel with the evaluation of the optimal model. Recharge simulation
conditions are shown as below:
Okabe et al.
7
Wellhead is set on the 10T pad (Fig.3).
Maximum MD of the well is 2,500m.
KOP=200m and max inclination is 45deg.
Feed point is located not to recharge in the same block of the present production wells
Recharge location is shown by □ in Fig.7 based on the conditions above.
Table 2: Parameters for MINC model.
Figure7: Recharge block for the 3D recharge simulation (Plan view).
Nine recharge blocks were set up consisting of eight blocks in the Chinoikezawa footwall fault and one block in Chinoikezawa
southeast fault which are important to see the recharge effect (Fig.7, Fig.8). Four recharge blocks from 1 to 3 are set in the same
location (only the depth changes) of the Chinoikezawa footwall fault since we are interested in this area (a border between the
Chinoikezawa footwall fault and the Chinoikezawa southeast fault). A base case without recharging was calculated using the
optimal model. The recharge calculation was carried out and the effect evaluated by comparing with the base case. Recharge flow
rates were set to 15 t/h, 30 t/h, 50 t/h, and 100 t/h and the temperature was assumed to be 15 °C in the simulation.
3.2.1 Optimal model
Since a MINC model was used, optimization of the model with regard to the grid size and the number of matrices was important for
the recharge simulation. The optimal model was evaluated by the calculating the result of the cases to inject water in the block of
1.5, the block between 1 and 2(Fig.8), mainly.
The optimal model was determined by comparing the existing grid model (grid size X, Y= 100 m, Z= 200 m), a Z subdivision
model (grid size X, Y= 100 m, Z= 50 m) and an all subdivision model (grid sizes XYZ= 50 m) with matrix subdivision number of 1,
4 and 8. In order to minimize the simulation time, we avoided the use of the whole 3D recharge model and only used the
Chinoikezawa footwall fault model to determine the optimal model. Note it was confirmed that little difference on the results
existed between the 3D recharge model and Chinoikezawa footwall fault model.
In the existing grid model (the block size X, Y= 100 m, Z= 200 m), some differences in the calculation results were observed
between the matrix subdivision number 1 and the number of 4 and 8 (Fig.9). On the other hand, the calculation results of the matrix
Parameter Fracture Matrix
Permeability 1.0~3.0E-14m2 0.0~1.0E-25m2
Porosity 0.1 0.001Division number 1 1,4,8
Volume ratio 0.15 0.85Frcature spacing 30×30×30m -