Current Super Critical Water Loop test results M. Anderson, K. Sridharan, M. Corradini, et.al. University of Wisconsin – Madison Department of Engineering Physics Wisconsin Institute of Nuclear Systems Nuclear Engr & Engr Physics, University of Wisconsin - Madison Presented at April SCW exchange meeting April 29 th and 30 th , UW- Madison
Transcript
Current Super Critical Water Loop test results
M. Anderson, K. Sridharan, M. Corradini, et.al.
University of Wisconsin – Madison
Department of Engineering Physics
Wisconsin Institute of Nuclear SystemsNuclear Engr & Engr Physics, University of Wisconsin - Madison
Presented at April SCW exchange meeting April 29th and 30th, UW-Madison
TC1
3TC
TC2
5TC
4TC
48
47TC
TC
6TC
TC7
TC8TC
9
TC10TC
11TC15
TC34
TC33TC
32
TC31TC
30
16TC
17TC
18TC
19TC
20TC
21TC
25TC
28TC
29TC
TC38
TC43
TC42
TC41
TC40
TC39
TC26
TC27
TC12
TC13
14TC
L M S
22TC
TC23
24TC
35TC 36
TC 37TC
L
M
S
L M S
44TC
45TC
46TC
L
M
S
1EH
EH2
EH3
5EH
4EH
EH6
EH7
EH8
EH10
EH11
EH12
14EH
EH13
15EH
EH9
Cooler #1
Cooler #2
Heater #1
Heater #2
Hot coolant return
Coolant supply
Hot coolant return
Coolant supply
Remote operatedthrottle valves
Inline flow transducer(orfice type for temp issues??)
Primary coolant pump
To building drain
From building supply
TC52
51TC
50TC
49TC
Inline flow transducer
Remote operatedthrottle valve
54TC TC
53
55TC
Primary coolantsurge tank
Primary coolantpressure transducer
Remote operatedstop valve
Pressurized gas in
Remote operatedstop valve
Pressurized water in
EH16
TC56
Primary inlet
U-tube heat exchanger
Primary outlet
EH17
TC57
Manual Bleed Valve
Manual bleed valve
Water level transducer
Tap #2
Tap #1
Supercritical surge/makeup resevoir
High pressure (4Kpsi)water in
Manual stop valve
Manual stop valve
Surge pressure transducer
High pressure (4Kpsi)gas in
Coil in temp bath as throttle
Test water out for analysis
Tap #3
Experimental water inHPLC pumps
Remote operatedstop valve
Stop valvePort #4
Test section drain
Test sectionpressure transducer
Test sectionmechanical pressure gauge
Remote operatedstop valve
62.000
62.000
Overview of UW-SCW loop
• In 625 Const.
• Max Water temp = 550 C
• Max Pressure = 25MPa
• Flow velocity = 1 m/s
• Flow rate = 0.4 kg/s
• Max wall temp 625 C
• Chemistry control to 200ml/min
• Input power 100 KW
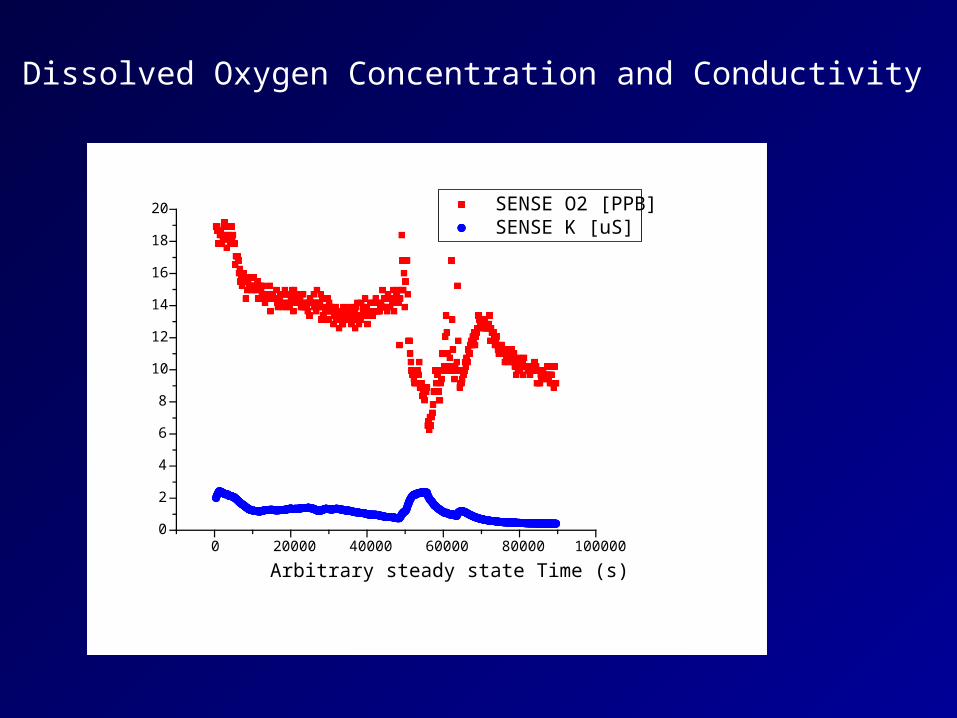
• O2 measurement
• Conductivity measurement
• Wall temps
• Replaceable test section
• Current test section I.D 4.25 cm
• Length 2x3 meters
• Corrosion, Heat transfer, thermal hydraulic stability and control
Cooling Bath
Needle Valve
Dissolved Oxygen sensor
ConductivitySensor
Particle filter
Dissolved gas control
HPLC Reservoir
Water Sample
HPLCPump
HPLCPump
Chemistry control
Hot Leg Cold Leg
Max flow 200 ml/minLoop volume = 14300 ml
15 ExternalHeaters
Thermocouples1 - 64
8 SideInternalHeaters
10 LowerInternalHeaters
4 AutomatedValves
5 PressureTransducers
National Instruments SCX 1100 controlled by Labview
Pressure and temperature control
• Pressurizer with Ar gas piston to control pressure (maintains pressure within 100 psi with a passive pressure regulator)
• Labview control of temperatures by control of lead temperature in heaters (maintain temperatures within 1 C)
• Labview control of HPLC pumps to maintain constant level in a HPLC resovior (differential pressure transducer feed back to maintain level height within 0.5 inches)
• Below is the first samples that were tested in a shake down test within the UW-SCW loop. Three samples were tested In 718, SS 316, Zirc
• The picture to the right shows the samples in the current week long test that is currently under operation 8 samples separated by a AlO2 spacer
- High Voltage+ Pulser
Ceramic Insulator
Biased Stage
Turbo Molecular Pump
Plasma Ions
Schematic illustration of plasma ion implantation and deposition process
Typical output from on-line process diagnostic showing voltage and current during pulse (taken during oxygen ion implantation of NERI project samples).
Schematic illustration of the plasma ion implantation process
Modes of operation
• Ion implantation of gaseous species (~50kV, N,O, Ar, C etc.)
• Film deposition (DLC, Si-DLC, F-DLC)
• Energetic ion mixing of film/substrate for surface alloying
• Film-substrate adhesion (atomic stitching or by ion implantation prior to deposition)
• Materials removal (alteration of surface alloy chemistry by differential sputtering, plasma cleaning)
• Cross-linking thin viscous polymer films for mechanical integrity, by energetic ion bombardment
• Deposition of metallic and compound thin films
Substrates & plasma treatments being investigated in this NERI project
Substrates and vendors:• Inconel 718 (Aerodyne Ulbrich Alloys, Indianapolis. IN)
• Zircaloy-2 (Allgheny Technologies, Albany, OR)
• 316 stainless steel (Goodfellow, Berwyn, PA)
Plasma Surface Treatments:• Room temperature and elevated temperature ion
implantation
• Energetic ion bombardment for modification of microstructure and composition
• Non-equilibrium surface alloying for a more tenacious and protective oxide
Bas
e M
ater
ial
IonImplantation
Implanted Layer Thin FilmB
ase
Mat
eria
l
Surface Alloying
Amorphous Layer
Bas
e M
ater
ial
SurfaceAmorphization
Species Used for Implantation
• O, N,C• Inert gases (Ar, Xe, Kr)• Y, Ta
Base Material
• Zircaloy-2• Stainless Steel 316• Inconel 718
Materials concept underlying the plasma treatment of samples for the NERI project
Thin Film
Bas
e M
ater
ial
Auger spectroscopy result showing composition vs depth below surface for a nitrogen ion implanted Zircaloy sample
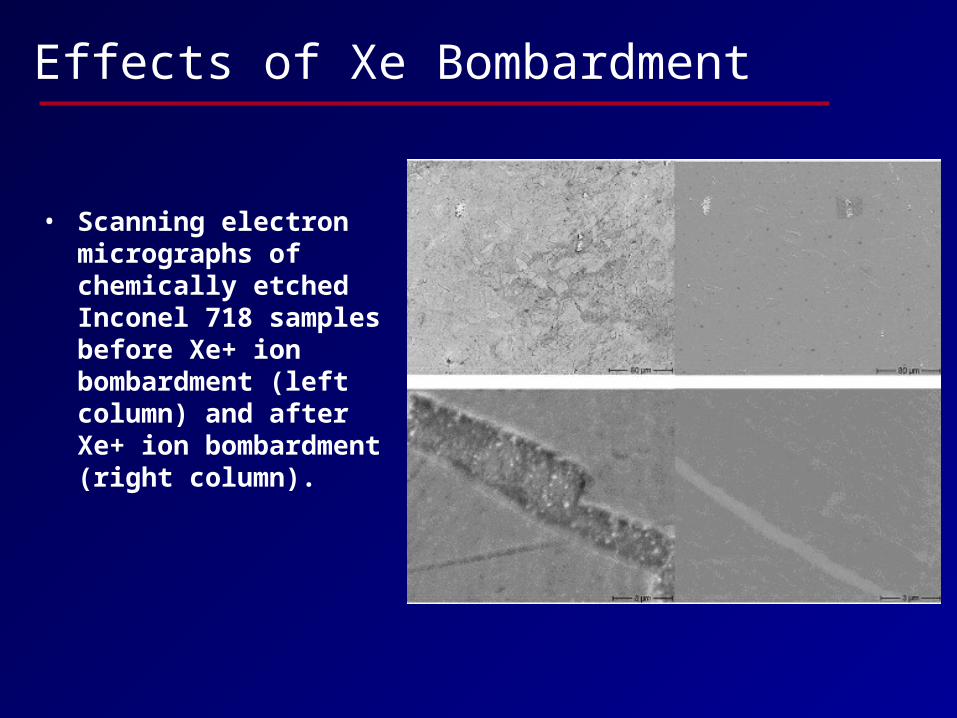
Effects of Xe Bombardment
• Scanning electron micrographs of chemically etched Inconel 718 samples before Xe+ ion bombardment (left column) and after Xe+ ion bombardment (right column).
Auger composition profile of a yttrium (oxide) film deposited on Inconel 718 substrate. Also shown photograph of the yttrium sputter cathode configuration and the substrate samples (with and without film)
Untreated Oxidized Y coating
Successful Y coating
Yttrium sputter cathode
Auger analysis of Si-containing DLC produced using hexamethyl-disiloxane precursor (Si: ~ 20 at.%)
Composition is tailored at the film-substrate interface to enhance adhesion
Zircaloy-4 sample
• SEM examination of Zircaloy-4 sample after 3-day SCW exposure
• coarse and fine distribution of oxide particles, and sporadic fissures.
• The finer particles were identified to be Zr-and Sn-oxide formed from the Zircaloy-4 sample
• The fissures represent initial stages of corrosion failure (indicated by arrows in the photomicrograph).
The finer particles were identified to be Zr-and Sn-oxide formed from the Zircaloy-4 sample
Zr Peak
ZrLEDS analysis of coarse particles indicated that they contained Fe and V and likely originated from the loop material and adjacent
Inconel 718 sample.VK
• High magnification images of the fissures that were observed sporadically on the Zircaloy-4 sample. The Fe and Ni signals are from the oxide particles of these elements entrapped in the fissures. We are presently investigating the origins of Al, Mg, and Si. The fissures represent the initial stages of corrosion failure in this alloy.
Zr Peak
Inconel 718 Sample
• Surface of the Inconel 718 sample after testing in supercritical water for 3 days. Oxide particles were identified to be niobium oxide, indicating that preferential corrosion of niobium-rich precipitates in the alloy, might have occurred. Other oxide particulate debris was also observed which stemmed from the washout of the loop.
Nb Peak
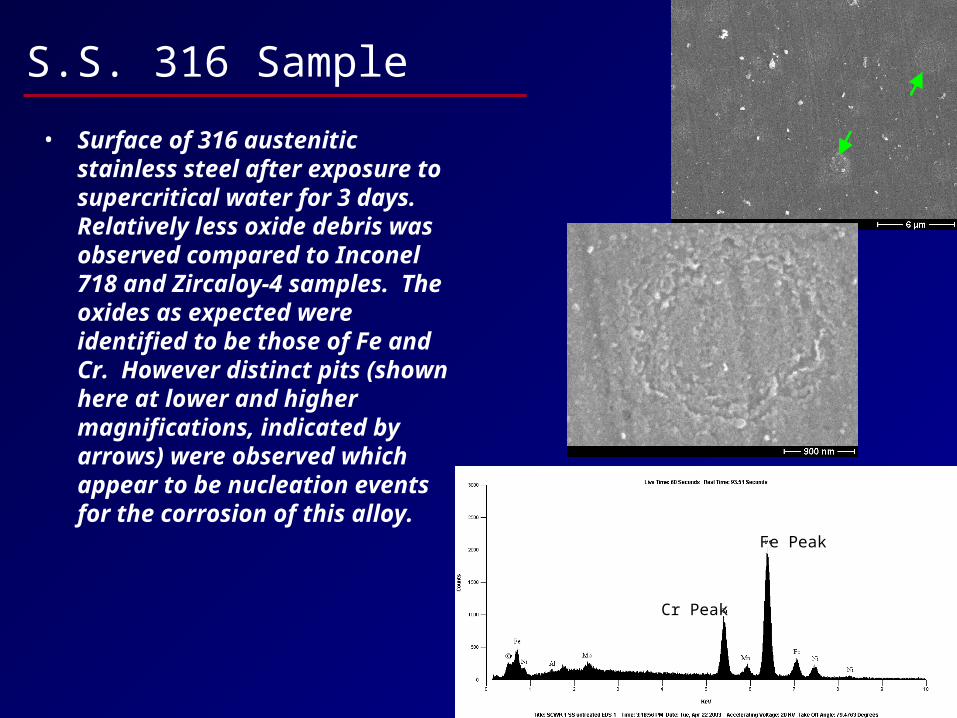
S.S. 316 Sample
• Surface of 316 austenitic stainless steel after exposure to supercritical water for 3 days. Relatively less oxide debris was observed compared to Inconel 718 and Zircaloy-4 samples. The oxides as expected were identified to be those of Fe and Cr. However distinct pits (shown here at lower and higher magnifications, indicated by arrows) were observed which appear to be nucleation events for the corrosion of this alloy.
Cr Peak
Fe Peak
Zr + O2 ZrO2
Zr + 2 H2O ZrO2 + 2 H2
Zr
Growingoxide layer
Bou
ndar
y la
yer
H2O
Liqu
id B
ulk
H2O
O2
O2
Shrinking base metal
H2O
( )( ) ( )( )tLdt
d
DtLk
COZ
eg
bA
r 212ρ=
+
Integrating at constant temperatures and with constant propertiesFor oxidation by steam
CAb Concentration of steam in liquid bulkDe Diffusion coefficient of steam in oxideKg Mass transfer coefficient in liquid phaseZrO2 Molar density of the oxide layer
•Diffusion of steam through the boundary layer fluid adjacent to the metal•Diffusion of steam into the growing oxide layer•Dissociation of water into elemental hydrogen and oxygen (O2)
•Oxidation reaction between Zr and O2
Diffusion of H2 back through the growing oxide
layer
( ) ( )2
22
OZ
Ab
ge r
tC
k
tL
D
tL
ρ=+
Quantification of oxidation/corrosion process
• Oxide film thickness measurements (Auger Electron Spectroscopy, and cross-sectional SEM)


![301AA - Advanced Programming [AP-2017] - unipi.itpages.di.unipi.it/corradini/Didattica/AP-17/SLIDES/AP...301AA - Advanced Programming [AP-2017] Lecturer: Andrea Corradini andrea@di.unipi.it](https://static.documents.pub/doc/80x56/5aa3225c7f8b9a436d8dd670/301aa-advanced-programming-ap-2017-unipi-advanced-programming-ap-2017.jpg)


