Current Trends of Change in the Population of Texas Karl Eschbach, Ph.D. State Demographer of Texas Director, Texas State Data Center University of Texas at San Antonio TASSCC State of the State 2008 December 11, 2008 Austin, Texas
Transcript
Current Trends of Change in the Population of Texas
Karl Eschbach, Ph.D.State Demographer of Texas
Director, Texas State Data CenterUniversity of Texas at San Antonio
TASSCC State of the State 2008December 11, 2008
Austin, Texas
?
Iowa
Population 2007 =
2,988,046
Texas 2007
+
+ 64,535 =
2000
2007
2007
Fastest Growing States, 2000-2007
State2000
Population*2007
Population*
NumericalChange
2000-2007
PercentChange
2000-2007
Texas 20,851,820 23,904,380 3,052,560 14.6
California 33,871,648 36,553,215 2,681,567 7.9
Florida 15,982,378 18,251,243 2,268,865 14.2
Georgia 8,186,453 9,544,750 1,358,297 16.6
Arizona 5,130,632 6,338,755 1,208,123 23.5
North Carolina 8,049,313 9,061,032 1,011,719 12.6
Virginia 7,078,515 7,712,091 633,576 9.0
Washington 5,894,121 6,468,424 574,303 9.7
Nevada 1,998,257 2,565,382 567,125 28.4
Colorado 4,301,261 4,861,515 560,254 13.0
* Population values are decennial census counts for April 1 for 2000 and estimatesfor July 1 for 2007.
Source: Derived from U.S. Bureau of the Census Estimates for dates indicated by the Texas State Data Center, University of Texas at San Antonio
Total of 10 Areas 17,626,224 36,618,477 18,992,253 97 108
Remainder of State 6,278,156 6,963,451 685,295 3 11
Population
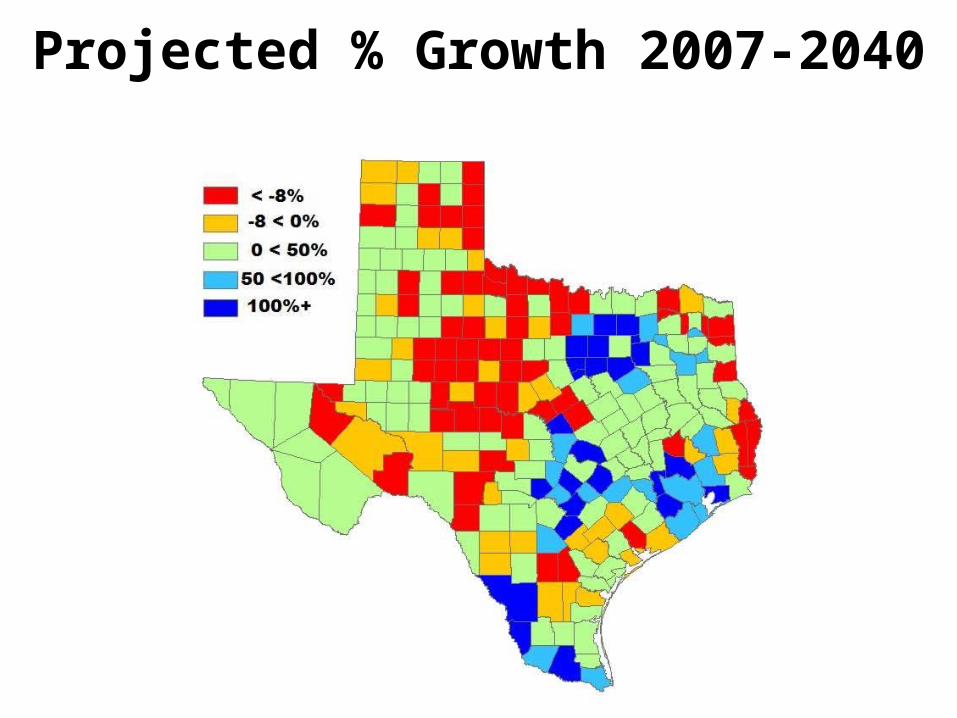
Projected Population Increase for Core-Based Areas in Texas, 2007-2040 (Scenario 00-04)
Changes in Age Structure
Age-Sex Structure of Texas, 2007 andProjected 2040 (Scenario 2000-2004)
Source: Texas State Data Center Estimates and Projections
Texas Population by Age, 2000 & 2007
Source: U.S. Bureau of the Census Counts (2000); Estimate (2007)
Texas Children by Age, 2000 and 2007
Source: U.S. Bureau of the Census Counts (2000); Estimate (2007)
Percent Change in Enrollment in Texas, 2000-2007
Numeric Change in Enrollment in Texas, 2000-2007
Changes in Ethnicity
Ethnicity & Immigrant Status-State of Texas, 2007
Source: U.S. Bureau of the Census, 2007 American Community Survey Microdata File
Immigrant Status by Age for Hispanics in Texas, 2007
% of Growth Due to Each Ethnicity in Texas, 1980-1990, 1990-2000, 2000-2007, and 2000-2040*
Sources: U.S. Census Counts, and State Data Center Projections, 0.5 Scenario
When do Hispanics pass Anglos in Texas?When do Hispanics become a majority in Texas?
MigrationScenario
PassAnglos ?
AbsoluteMajority?
No Migration 2034 2040+
1/2 of 1990-2000 2020 2035
Observed 1990-2000 2014 2026
Estimated 2000-2004 2015 2027
Source: Texas State Data Center Projections
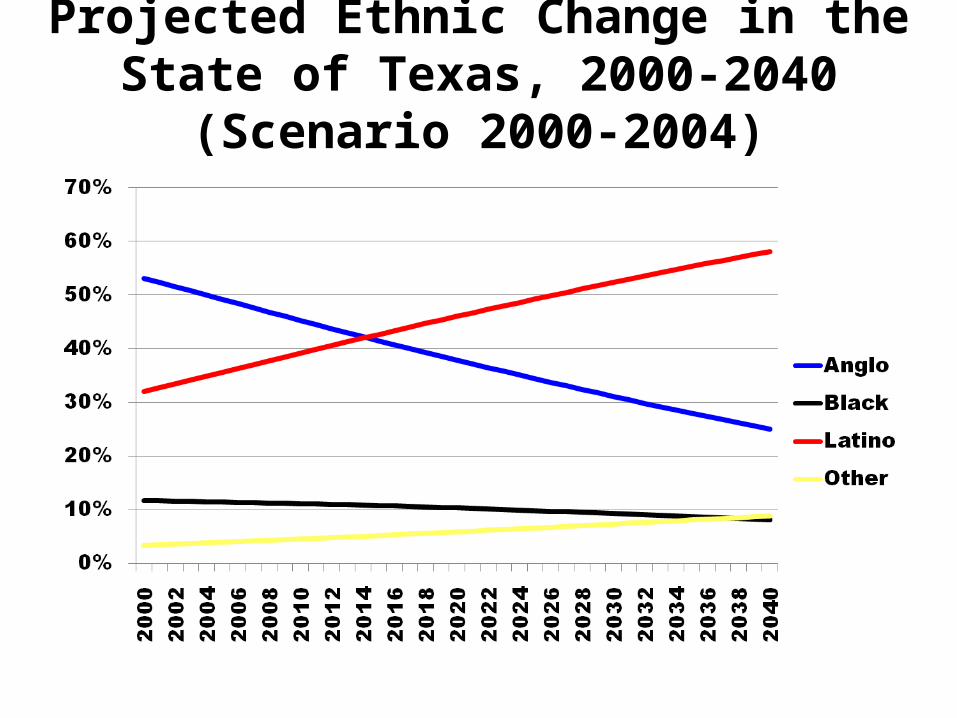
Projected Ethnic Change in the State of Texas, 2000-2040 (Scenario 2000-2004)
Percentage of Texas Population by Ethnicity at Each Age, 2000
Source: U.S. Bureau of the Census, 2000 Census of Population
Percentage of Texas Population by Ethnicity at Each Age, 2040
Source: Texas State Data Center, 2000-2004 Projection Scenario
Workforce Renewalin Texas
Educational Attainment (%) of Adults25-64, Texas vs. Rest of the US
0.0
5.0
10.0
15.0
20.0
25.0
30.0
Rest of US Texas
Source: American Community Survey 2007 Microdata File
Baby Boomers in Texas Workforce
• 4.3 million Baby Boomers (born 1946 to 1964) in Texas workforce in 2006
• 700,000 born before 1946• Total workforce= 11.5 million• Persons born before 1964 are 43% of
workforce, and 53% of college graduates in the workforce
Educational Attainment of Baby Boomers in the Texas Workforce vs. Parents of Texas Children
22.7
14.6
25.4 25.727.2
29.0
17.2
19.5
7.4
11.2
0.0
5.0
10.0
15.0
20.0
25.0
30.0
Less than HSdiploma
High SchoolGraduate
Some College Bachelor'sDegree
Graduate Degree
Parents of Texas Children aged 0-14 Civilian Work Force Age 46 to 60
Percentage
Ratio of over-represented and under-represented occupations:Parents of Texas children vs. Boomers in Civilian Workforce
1.85
1.37 1.34 1.30
1.21
0.67 0.74 0.77 0.79 0.79
0.0
00.5
01.0
01.5
02.0
0
Over Represented
Under Represented
Source: American Community Survey 2006 Microdata File
Projected Percent of Labor Force by Educational Attainment in Texas, 2000 and 2040
* Projections are shown for the 1.0 scenario
18.8
29 28.7
18.2
5.3
30.128.7
23.9
12.9
4.4
No High School Diploma
High School Graduate
Some College
Bachelor's Degree
Graduate/Prof.Degree
0
5
10
15
20
25
30
35
Percent
2000 2040
Texas State Data Center and Office of the State Demographer
• Karl Eschbach, Ph.D.• Nazrul Hoque, Ph.D.• Jeff Jordan, Ph.D.• Beverly Pecotte (State Data Center, San Antonio)• Sheila Dos Santos-Dierking (Office of the State