Cucurbita pepo http://www.proteacher.net/discussions/showthread.php?t=6479 Brown pollen? 03-20-2006, 02:39 AM #1 I feel REALLY stupid asking this. Anyway, I teach 6th grade self-contained, so I have to teach science. I've really enjoyed it, even though it's not my forte. We dissected tulips on Friday. The pink ones had really yellow pollen, but the red ones didn't appear to have any until we noticed little brown specks. Can pollen be brown? I'm assuming so, but it would be nice to know for sure. I'm in South Carolina, and right now our cars and houses and roads are COVERED with the yellow stuff from the pine trees. I was born and raised here, and I'm only used to seeing yellow pollen. Anyway, any help would be appreciated! Thanks! Pollen comes in many colors 03-25-2006, 06:37 AM #2 http://en.wikipedia.org/wiki/Pollen_source You can view a chart of plants and the colors of their pollen here. Pollen color varies and can include light-dark yellow, light-dark brown,
I feel REALLY stupid asking this. Anyway, I teach 6th grade self-contained, so I have to teach science. I've really enjoyed it, even though it's not my forte. We dissected tulips on Friday. The pink ones had really yellow pollen, but the red ones didn't appear to have any until we noticed little brown specks. Can pollen be brown? I'm assuming so, but it would be nice to know for sure. I'm in South Carolina, and right now our cars and houses and roads are COVERED with the yellow stuff from the pine trees. I was born and raised here, and I'm only used to seeing yellow pollen. Anyway, any help would be appreciated! Thanks!
Pollen comes in many colors 03-25-2006, 06:37 AM #2
http://en.wikipedia.org/wiki/Pollen_source You can view a chart of plants and the colors of their pollen here. Pollen color varies and can include light-dark yellow, light-dark brown, light-dark olive, gray, red-brown, etc.
Here are a few (trees/shrubs) followed by the color of their pollen:
Maple Acer spp. light yellow Manitoba Maple (Box elder) Acer negundo light olive good
Norway maple Acer platanoides olive Red Maple Acer rubrum grey brown Grey Alder Alnus incana brownish yellow American Hazel Corylus americana light green Hawthorn Crataegus spp. yellow brown American Sycamore Platanus occidentalis light olive Almond Prunus amygdalus light brown to brown pollen Peach Prunus persica redish yellow Pear Pyrus communis red yellow Elm Ulmus spp. light grey American Elm Ulmus americana light grey
Who can count pollen and mold?Tags: count, pollen, mold Only certified counters can read pollen and mold. Each counter must pass a year long certification course provided through the Harvard School of Public Health and must be
accredited by the American Academy of Allergy, Asthma and Immunology (AAAAI). The Environmental Health Laboratories has certified counters on staff. Meteorologists, allergy specialists, physicians, and individuals have relied on the Saint Louis County Department of Health for this data since 1960.http://www.aaaai.org/NAB/index.cfm?p=become_a_counter
National Allergy Bureau Pollen and Mold Certification Process
National Allergy Bureau Pollen and Mold Certification Process Certification is a multi-step process and NAB Counters are certified separately as a pollen counter or as a mold counter to use a Burkard Spore Trap or the equivalent. Certification is offered to counting stations that agree to provide data on a timely bases to the NAB web site. Following the required training course(s), the candidate for certification will be required to take a web based qualifying exam The exam will cover the basics of pollen and fungal spore aerobiology, fundamentals of microscopy, sampler operation, and conversion of counts into concentration as outlined on the “Knowledge Base for Counters” developed by the NAB. Reference materials for the exam are also provided click here. http://www.aaaai.org/NAB/knowledge_base_counters.doc
(The exact material for the exam will be determined by the NAB Certification Committee). Following successful completion of the qualifying exam, the candidate will be permitted to take the practical exams using slides. The present system for slides to be sent to the candidates one at a time is described below. In the future, however, the exams may be administered at AAAAI and/or ACAAI annual meetings.
Pollen CounterTo be certified for pollen, a counter will need to successfully count and identify grass, weed and tree pollen grains on one pollen slide, which would represent spring, summer, and fall pollen types in most of the continental U.S. Once the slide is graded passing, the counter will be considered a certified NAB pollen counter and eligible to count and present data for the NAB aeroallergen network.
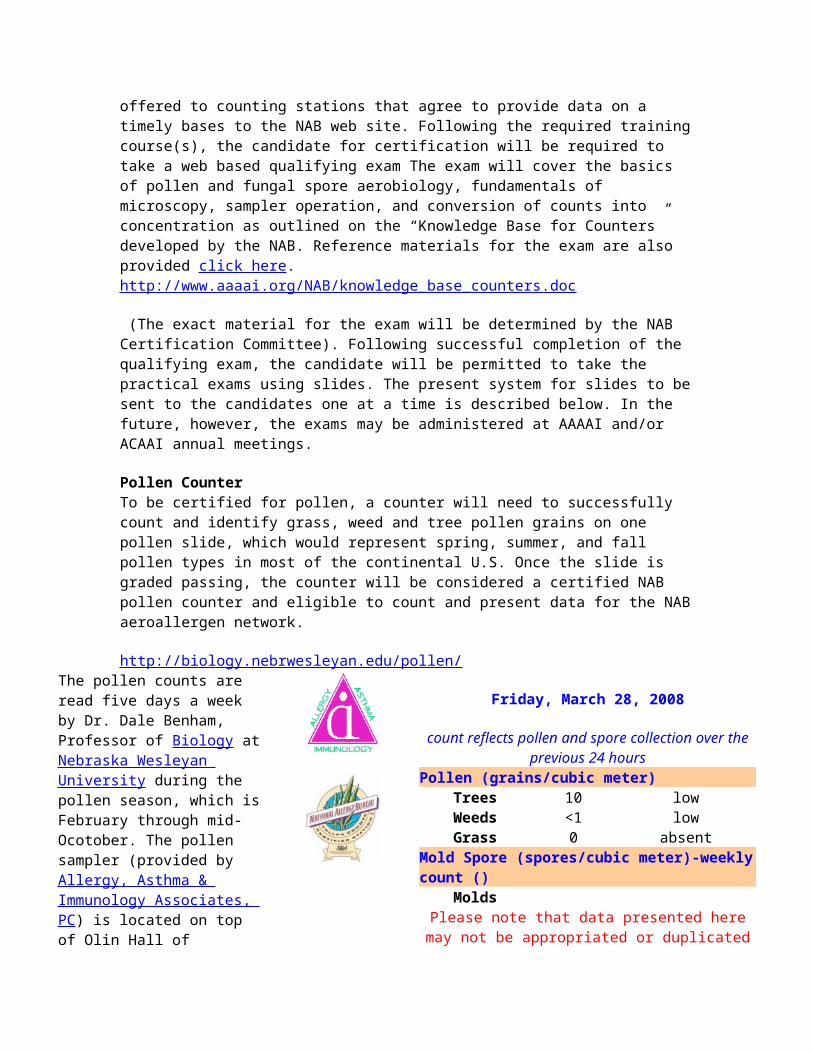
http://biology.nebrwesleyan.edu/pollen/The pollen counts are read five days a week by Dr. Dale Benham, Professor of Biology at Nebraska Wesleyan University during the pollen season, which is February through mid-Ocotober. The pollen sampler (provided by Allergy, Asthma & Immunology Associates, PC) is located on top of Olin Hall of Science, Nebraska Wesleyan University. Please direct any questions concerning the counts to Dr. Dale Benham. Funding for this project is provided by Allergy Asthma, Immunology
Friday, March 28, 2008
count reflects pollen and spore collection over the previous 24 hours
Pollen (grains/cubic meter)Trees 10 low
Weeds <1 lowGrass 0 absent
Mold Spore (spores/cubic meter)-weekly count ()
MoldsPlease note that data presented here may not be
appropriated or duplicated without written permission from
within this category experience symptoms of hay fever or asthma.
Absent No symptoms.
Low Only individuals extremely sensitive to these pollens and molds will experience symptoms.
Moderate Many individuals sensitive to these pollens and molds will experience symptoms.
High Most individuals with any sensitivity to these pollens and molds will experience symptoms.
Very HighAlmost all individuals with any sensitivity at all to these pollens and molds will experience symptoms. Extremely sensitive people could have severe symptoms.
Provided as a public service by Nebraska Wesleyan University, Allergy, Asthma & Immunology Associates
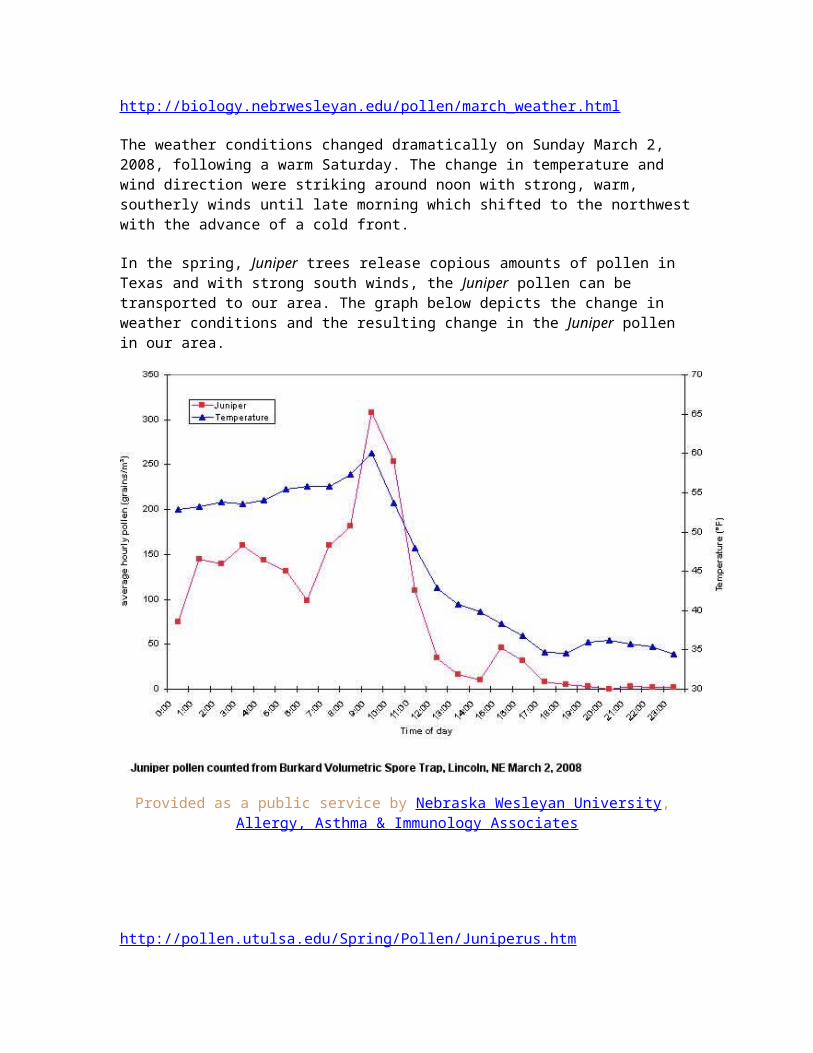
The weather conditions changed dramatically on Sunday March 2, 2008, following a warm Saturday. The change in temperature and wind direction were striking around noon with strong, warm, southerly winds until late morning which shifted to the northwest with the advance of a cold front.
In the spring, Juniper trees release copious amounts of pollen in Texas and with strong south winds, the Juniper pollen can be transported to our area. The graph below depicts the change in weather conditions and the resulting change in the Juniper pollen in our area.
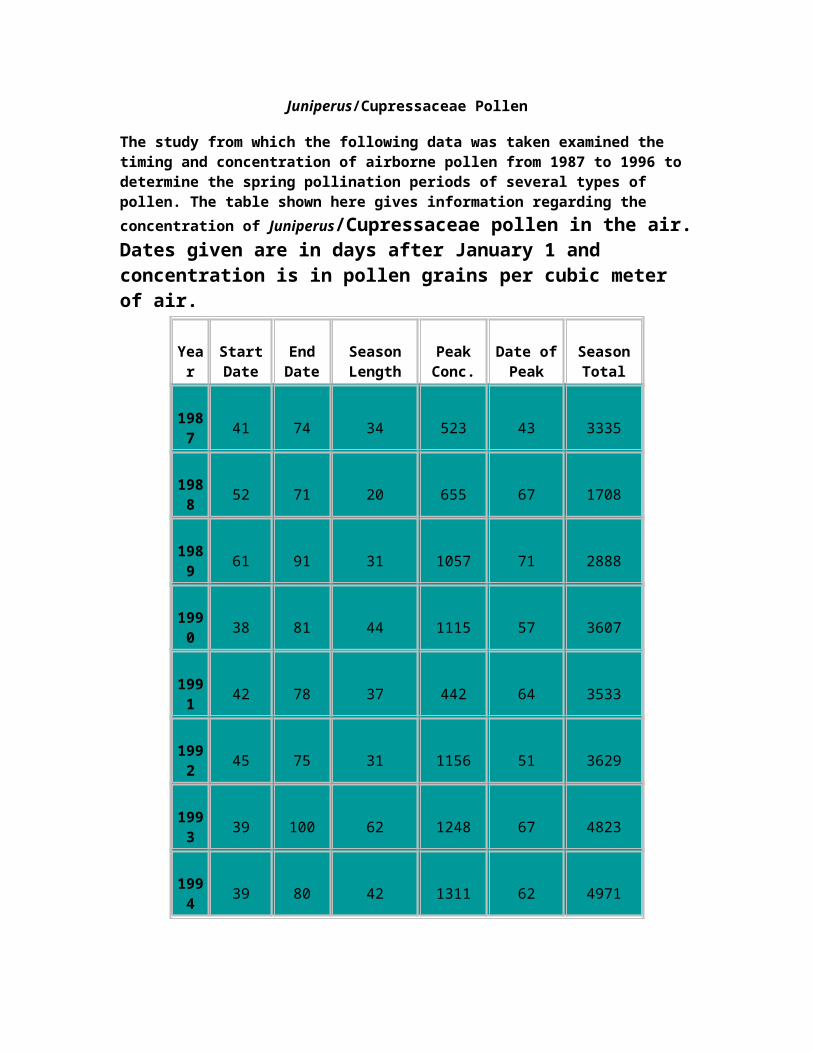
The study from which the following data was taken examined the timing and concentration of airborne pollen from 1987 to 1996 to determine the spring pollination periods of several types of pollen. The table shown here gives information regarding the concentration of Juniperus/Cupressaceae pollen in the air. Dates given are in days after January 1 and concentration is in pollen grains per cubic meter of air.
As can be seen in the table, Juniperus pollination began as early as February 7 (Day 38), and ended as late as April 10 (Day 100). However, the average season for airborne Juniperus pollen occurs between February 13 and March 20, and it is most abundant in the air around March 2.The following graph expresses the data in a manner that allows one to better visualize the conclusions drawn here.
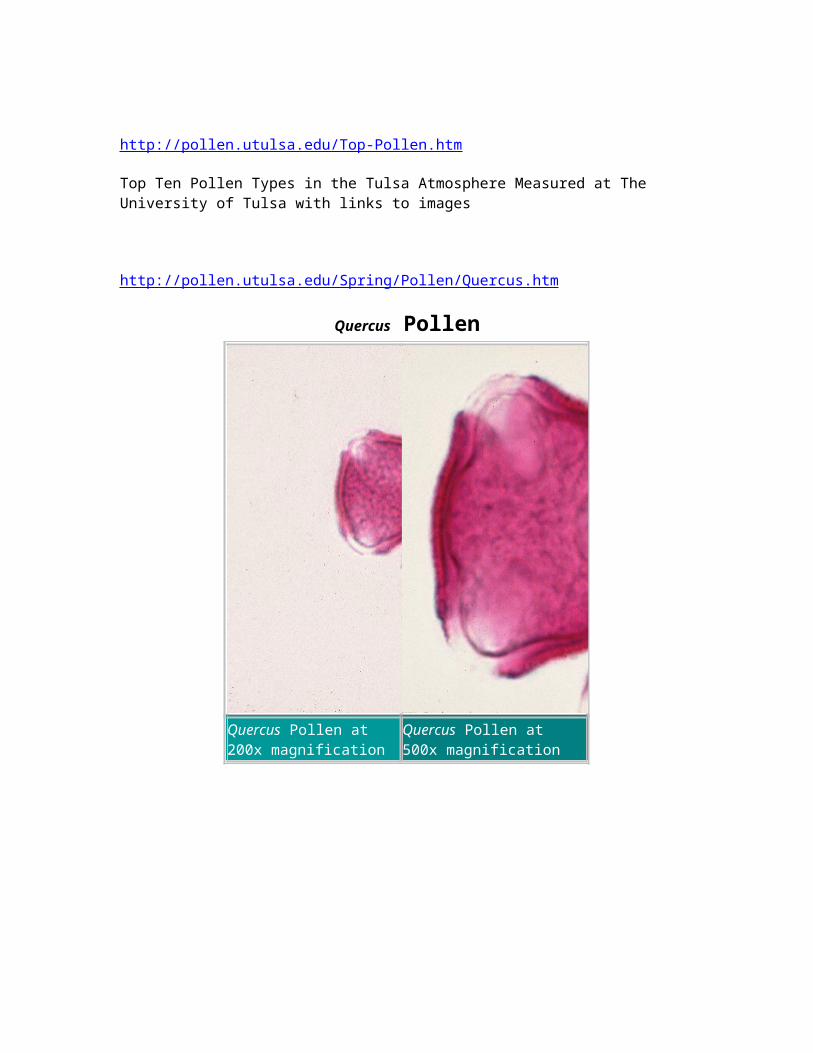
http://pollen.utulsa.edu/Top-Pollen.htm
Top Ten Pollen Types in the Tulsa Atmosphere Measured at The University of Tulsa with links to images
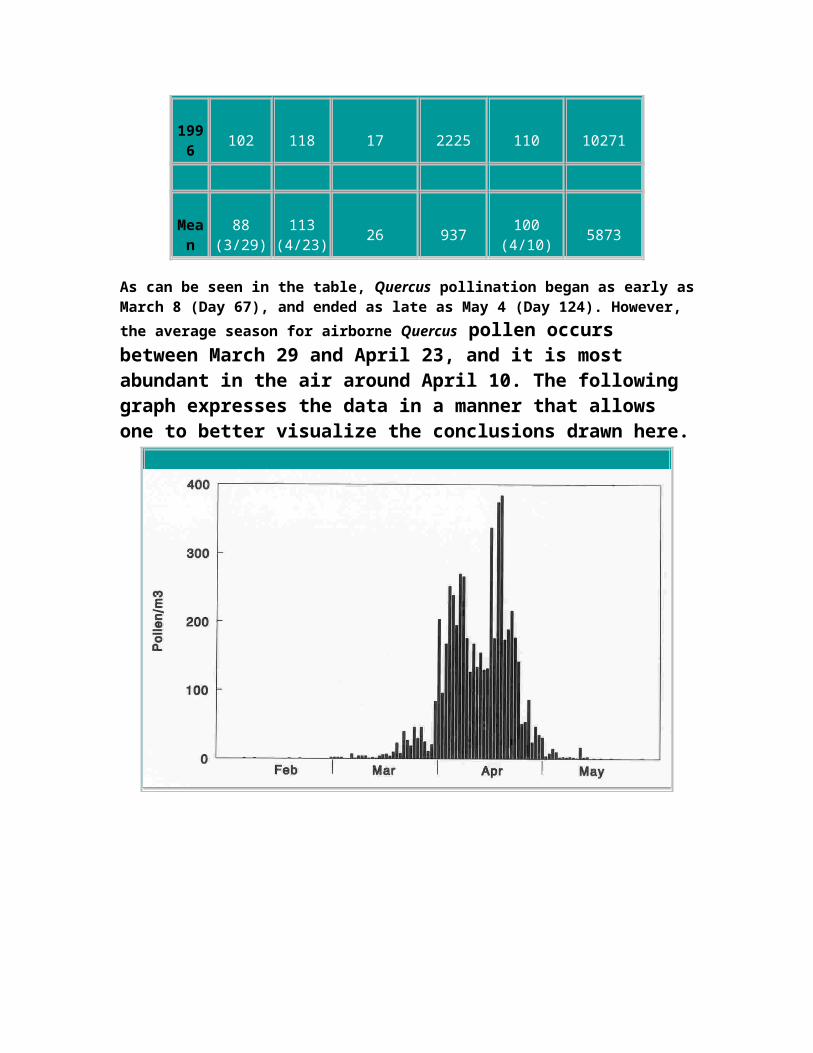
The study from which the following data was taken examined the timing and concentration of airborne pollen from 1987 to 1996 to determine the spring pollination periods of several types of pollen. To learn more about this study click here. The table shown here gives information regarding the concentration of Quercus pollen in the air. Dates are given in days after January 1 and concentration is measured in pollen grains per cubic meter of air.
As can be seen in the table, Quercus pollination began as early as March 8 (Day 67), and ended as late as May 4 (Day 124). However, the average season for airborne Quercus pollen occurs between March 29 and April 23, and it is most abundant in the air around April 10. The following graph expresses the data in a manner that allows one to better visualize the conclusions drawn here.
pin oak flowers http://pollen.utulsa.edu/Spring/Pollen/post-oak.htm
http://pollen.utulsa.edu/Monthly.html
Monthly Pollen in Tulsa
January July
February August
March September
April October
May November
June December
Great data!
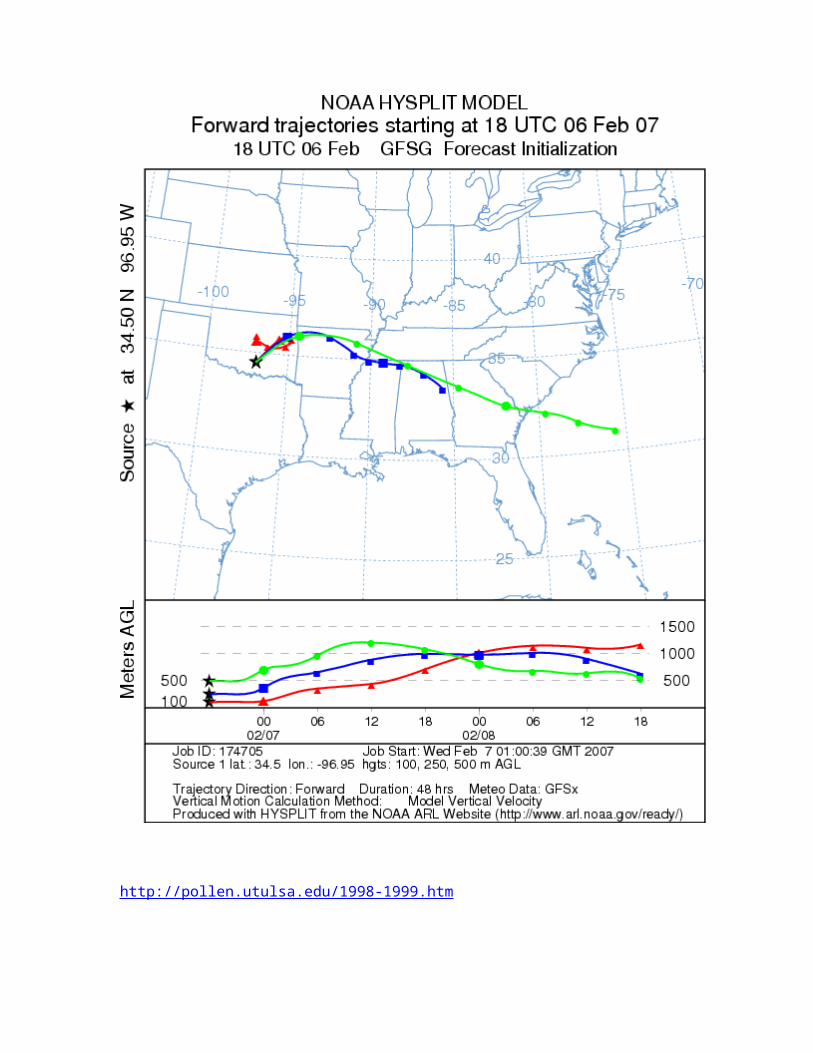
LONG DISTANCE TRANSPORT
Pollen from mountain cedar populations in southern Oklahoma and Texas is capable of traveling long distances over short periods of time along prevailing winds. Pollen from populations in the Edwards Plateau can be carried to Dallas, Tulsa, or even further north. Research in our lab has
focused on identifying the meteorological conditions that are associated with long distance transport. Generally, pollen is transported on days that are warm and sunny with southerly winds. Our forecasts have been developed to provide an alert for patients sensitive to mountain cedar pollen. We will be offering forecasts at least three days a week during December and January. Forecasts are developed using the HY-SPLIT trajectory model, which comes from NOAA's Air Resources Laboratory (ARL) in Silver Spring, Maryland. On days when pollen is forecast for a particular area, sensitive individuals may wish to limit outdoor activities or take other measures suggested by their physician.
Individuals allergic to mountain cedar should be cautious about pollen levels during other times of the year. Eastern red cedar (Juniperus virginiana) releases pollen during February and March in Texas and Oklahoma. This tree is abundant throughout much of the eastern half of North America including parts of Texas and Oklahoma. In the Tulsa area, eastern red cedar is one of our most prolific pollinators. Although not generally considered as allergenic as mountain cedar, there is cross reactivity between the two species. Therefore, if you are in areas with red cedar you may continue to experience allergy symptoms during the early spring. In the fall September through November, red-berry juniper (Juniperus pinchotii) pollinates in this region as well. This pollen is also allergenic and also cross reacts with mountain cedar; so fall symptoms are also possible. Often news media will provide information on local pollen counts. Sometimes the inclusion of any cedar pollen is thought (by the media) to be mountain cedar. As a result, misleading information is sometimes broadcast or published. Use the following as a general guideline
TECHNIQUES FOR MOLECULAR ANALYSISA compendium of methods useful for characterizingArabidopsis pollen mutants and gametophyticallyexpressedgenesSheila A. Johnson-Brousseau* and Sheila McCormick
Have you ever wondered how scientists gather data to determine whether global temperatures are warming or what climate was like during the Ice Ages?
Paleoclimate researchers conduct studies on coral cores, ice cores, tree rings, pollen, sediment from oceans and lakes, varves, pack rat middens and other products of nature in order to learn about past climates.
The links below will help you understand how scientists collect climatic data from the past, before the days of the thermometer, barometer, rain gauge and other weather instruments.
http://www.ncdc.noaa.gov/paleo/proxies.html
Fossil Pollen:
All flowering plants produce pollen grains. Their distinctive shapes can be used to identify the type of plant from which they came. Since pollen grains are well preserved in the sediment layers in the bottom of a pond, lake or ocean, an analysis of the pollen grains in each layer tell us what kinds of plants were growing at the time the sediment was deposited.�Inferences can then be made about the climate based on the types of plants found in each layer.
To learn more about fossil pollen, please visit the following:
The Institute of Paleontology, University of Vienna, Austria Fossil Groups: Spores and Pollens , U.S. Geological Survey (USGS
very resistant walls, pollen and spores typically are the most abundant, easily identifiable, and best preserved plant remains in sediments and sedimentary rocks.
robots have a spherical shape and may weigh around 2.2 pounds, 1 foot across and apart from this structure the makers have given them eyes. These eyes changes colors according to the condition of the pollen in the air. The eye colors are mainly in five colors-blue, white, green, purple and red. One can also use these spherical robots to scare any animal which may come pondering in to the related area. This is where it falls back, the robots instead of giving the report to the owner of the robot it sends the report of the pollen condition back to the robot company’s headquarters. All the data received from the robots is used to update and calculate an online pollen map. This device is specially brought in to alarm the people who suffer from hay fever. 200 of these spherical robots have already been spread out for use.
The so-called “Pollen Robots,” which weigh 1 kilogram (2.2 lbs) and measure 30
centimeters (1 ft) across, consist of a monitoring unit housed in a spherical styrofoam
shell. A pair of eyes glow 5 different colors — white, blue, green, red and purple — to
indicate the level of Japanese cedar and cypress pollen in the air.
There are going to be 200 of them across the country, each hung outside a volunteer's
home. They will send data every minute to the company's headquarters, which will be
used to update the online pollen maps they have available. I'm not sure what the proper
protocol for a 'code purple' pollen day is, but my guess is running around in the streets
waving your arms and screaming. Which, incidentally, is the same for a Godzilla attack.
The primary culprit for the epidemic runny eyes and noses is cedar trees, planted after World War II to reforest mountainsides denuded to reconstruct a destroyed Japan.
As a precautionary measure against possible landslides, in a country prone to earthquakes, the authorities began in the 1950s to reforest the hills with the native cedar trees.
Three decades later, when the cedars started to pollinate for the first time, the first allergy cases emerged and they seem to worsen with each passing year.
It is estimated that one in every five Japanese suffers from a pollen allergy.
Weather forecasts include reports if the following days will have high pollen counts and in which areas of the country will be more affected than others.
A local company has even developed a "pollen robot", whose "eye colour" changes depending on the pollen concentration.
Advice to reduce the symptoms includes avoiding areas with high pollen concentrations, not hanging up laundry outside to dry and to wash faces and eyes often.
Wearing facemasks, protective goggles and hair-covering caps are also recommended to keep pollen at bay.
Furthermore, stress, smoking and drinking coffee also are best avoided, according to allergy specialist Dr Toshiro Yamanashi.
The facemasks have spawned an entire industry offering simple gauze masks, which loosely cover the mouth and nose to others that closely fit the contours of the mouth and have an attached flap to envelope the nose.
But the masks are also problematic for wearers of prescription glasses and the latest advertised solution is for small adhesive strips to seal the upper rims of the mask to prevent condensation on the inside of lenses.
Pollen allergies are also a governmental concern - from developing anti-allergy measures, to medicinal remedies to the outright replacement of the current cedar forests with cedar species that produce less pollen.
However, the private owners of the forests have little interest to fell them as they are financially unyielding due to cheap timber imports.
A private initiative of wood-processing companies in Miyazaki prefecture, which has bestowed itself as the Pollen Allergy Annihilation Center, intends to tackle the situation by educating forest owners about the proper care of cedar trees.
Pruning and thinning out the cedar forest cover is an effective countermeasure to curb pollen emission, however, they currently grow uncontrolled, and with each growth cycle they produce more and more pollen.
Until this effort bears fruit, Eriko and her fellow sufferers have no other choice but to stock up on facemasks, eye drops and nose sprays.
"I am really looking forward to the arrival of summer (when the pollination period is over)," she moans before sneezing once again.
March 18, 2008 | by James | Filed Under Technology |
A English language news report from NDTV news about hay fever season in Japan and how people are “fighting back” with high tech pollen detection balls:Which of the following methods do you think would best fight the spread of hay fever pollen:
Pollys Pet Products Tooty Fruity Bee Pollen 6in Small Bird Perch Assorted Flavors
From Polly's Pet Products List Price: $17.40
Price: $5.87
Availability: Usually ships in 1-2 business daysShips from and sold by GlobalPets
Product Description
There are 22 basic elements in a birds body - enzymes, hormones, vitamins, amino acids and others which must be renewed by nutrient intake. No one food contains all of them except bee pollen.
Pollen is a great source of free amino acids, fatty acids which includes the omega 3 fatty acids and carbohydrates. The perch contains approx. 15% bee pollen.
This perch is edible and can be installed vertically or horizontally.
Bee Pollen contains 35% Protein, 55% Carbohydrate, 2% Fatty Acids, 3% Minerals and Vitamins. High in B-Complex Vitamins A, C, D and E. Also contains Lecithin, Beta Carotene and Selenium. It is rich in vitamins and contains almost all known minerals, trace elements, enzymes and amino acids. It contains the essence of every plant from which bees collect pollen in combination with digestive enzymes from the bees. This combination of elements make bee pollen
an excellent source of antioxidants. Bee pollen is rapidly absorbed into the blood stream and stimulates immunological responses.
Preview this book
By Daniel E. Moerman
Published 1998Timber Press
Indians of North America/ Ethnobotany
927 pages
ISBN 0881924539
Native American Ethnobotany By Daniel E. MoermanCattails Typha angustifolia Pollen used as facepaint, added to water to make cakes
Gathering pollen is not as easy as it sounds. Once a honeybee arrives at a flower, she settles herself in and nimbly scrapes off the powdery loose pollen from the stamen with her jaws and front legs, moistening it with a dab of the honey she brought with her from the hive. The enlarged and broadened tarsal segments of her legs have a thick trimming of bristles, called pollen combs. The bee uses these combs to brush the gold powder from her coat and legs in mid-flight. With a skillful pressing movement of her auricle, which is used as a hammer, she pushes the gathered gold into her baskets. Her pollen baskets, surrounded by a fringe of long hairs, are simply concave areas located on the outside of her tibias. When the bee's baskets are fully loaded, the microscopic golden dust has been tamped down into a single golden grain, or granule.
Honeybees do double duty. They are programmed to gather pollen and carry it back to the hive as food for the colony. However, even more important as far as humans are concerned, they are also responsible for the pollination of more than 80 percent of green growing things. As bees buzz from blossom to blossom, microscopic pollen particles coat their stubby little bodies so densely that they sometimes look like little yellow fuzz balls. When they arrive at the next flower, a portion of the live golden dust is transferred to that blossom and pollination is accomplished. It is important to recognize that a one teaspoon dose of pollen takes one bee working eight hours a day for one month to gather. Each bee pollen pellet,
contains over two million flower pollen grains and one teaspoonful contains over 2.5 billion grains of flower pollen. Pollen is considered an energy and nutritive tonic in Chinese medicine. Cultures throughout the world use it in a surprising number of applications: for improving endurance and vitality, extending longevity, aiding recovery from chronic illness, adding weight during convalescence, reducing cravings and addictions, regulating the intestines, building new blood, preventing infectious diseases such as the cold and flue (it has antibiotic type properties), and helping overcome retardation and other developmental problems in children. It is thought to protect against radiation and to have anti-cancer qualities. Nutrient deficiencies and all the health problems they cause are recognized worldwide as a growing problem. Because bee pollen contains all the nutrients needed to sustain life, it is being used on an ever larger scale for human nourishment and health. Science teaches that bee pollen contains many substances that combine to make it a healthy, nutritious, complete food. There are numerous reports from medical experience that conclusively show the benefits of bee pollen exceed that of a simple food item. And the bees do most of the work. Bee-gathered pollens are rich in proteins, free amino acids, vitamins, including B-complex, and folic acid. According to researchers at the Institute of Apiculture, Taranov, Russia, "Honeybee pollen is the richest source of vitamins found in Nature in a single food. Even if bee pollen had none of its other vital ingredients, its content of rutin alone would justify taking at least a teaspoon daily, if for no other reason than strengthening the capillaries. Pollen is extremely rich in rutin and may have the highest content of any source, plus it provides a high content of the nucleics RNA [ribonucleic acid] and DNA [deoxyribonucleic acid]."
Bee pollen is often referred to as nature's most complete food. Human consumption of bee pollen is praised in the Bible, other religious books, and ancient Chinese and Egyptian texts. It has long been prescribed by traditional health practitioners-including the fathers of Western medicine Hippocrates, Pliny the Elder, and Pythagoras-for its healing properties.Bee pollen is a complete food and contains many elements that products of animal origin do not possess. Bee pollen is more rich in proteins than any animal source. It contains more amino acids than beef, eggs, or cheese of equal weight. Bee pollen is particularly concentrated in all elements necessary for life.
Pollen, the plant structure most widely used by humans, is a key structure in plant reproduction giving rise to fruits and
seeds. Moreover, the biotechnological use of pollen is of great importance for plant breeders since it allows to obtain varieties with better utilization and yield. In the first part, the successive steps of pollen development in the
Anther and Pollen: From Biology to Biotechnology Christophe ClementE. PaciniJean-Claude Audran
anther from floral induction to pollen germination and fertilization are thoroughly examined; the second part is devoted to pollen behaviour in vitro.
Ecology Science Lab by Tyco, under its Chemcraft label. This set permits children to test for radon, pollen count and air quality.
A pollen model in the rat for testing adjuvant activity of air pollution components.Steerenberg PA, Dormans JA, van Doorn CC, Middendorp S, Vos JG, van Loveren H.
In conclusion, the intranasal application of pollen in the BN rat is a suitable and elegant method to evoke inflammatory reactions in the lung and pollen-specific IgE responses measured by DIG ELISA.
PDFAerodynamics of saccate pollen and its implications for wind pollinationSchwendemann et al. Am. J. Bot..2007; 94: 1371-1381
CitationE. Trankle and B. Mielke, "Simulation and analysis of pollen coronas," Appl. Opt. 33, 4552- (1994)http://www.opticsinfobase.org/abstract.cfm?URI=ao-33-21-4552
Floral distribution, clonal structure, and their effects on pollination success in a self-incompatible Convallaria keiskei population in northern Japan Journal Plant EcologyPublisher Springer NetherlandsISSN 1385-0237 (Print) 1573-5052
(Online)Issue Volume 189, Number 2 /
April, 2007Category Original PaperDOI 10.1007/s11258-006-9173-9Pages 175-186Subject Collection Biomedical and Life SciencesSpringerLink Date Wednesday, July 19, 2006
Add to marked items Add to saved items Permissions & Reprints Recommend this article
Kiwako Araki1, Kenichiro Shimatani2 and Masashi Ohara1
(1) Course in Ecological Genetics, Graduate School of Environmental Science, Hokkaido University, Sapporo 060-0810, Japan
(2) The Institute of Statistical Mathematics, 4-6-7 Minami-Azabu, Minato, Tokyo 106-8569, Japan
Received: 30 January 2006 Accepted: 28 May 2006 Published online: 19 July 2006
Abstract In plant species, when clonal growth produces a patchy structure and flowering ramets are clustered, the amount of pollen contributing to reproductive success is often regulated by pollinator efficiency and geitonogamy. The spatial population structure may influence reproductive success. We examined the clonal structure, the spatial ramet distribution, and their combined effects on fruit set in a natural population of the insect-pollinated, self-incompatible clonal herb, Convallaria keiskei, in northern Japan. The number of shoots, flowers, and fruits in 1-m2 quadrats were counted at every 5 m grid point in an established 100 × 90-m study plot. From all the quadrats where shoots existed, leaf samples were collected for allozyme analysis. Using the two spatial parameters of flowering ramet densities and genotypes, we then constructed individual-based fruit-set models. A total of 236 quadrats contained shoots, and 135 contained flowering ramets, which indicated expanded distribution of this plant throughout the study plot, while shoots, flowers and fruits all showed clustering distributions. Allozyme analysis of 282 samples revealed 94 multilocus genotypes. The largest clone extended to more than 40 m, whereas 56 genotypes were detected in only one sample. Several large clones and many small clones were distributed close to each other. Fine-scale spatial modelling revealed that the neighbouring flower numbers of different genotypes, compared with local genet or flower diversity, more influenced fruit set, in which the range of the neighbour was 14.5 m. These findings indicate that the compatible pollen dispersed by
insect pollinators has a significant effect on sexual reproduction, in this C. keiskei population. Consequently, the spatial structure, which includes both genet distribution and clonal expansion by ramets, had a significant effect on pollination success.
Previous Article | Next Article
Perform your original search, pollen model, in J. Exp. Bot. Search
Journal of Experimental Botany, Vol. 54, No. 391, pp. 2307-2312, October 1, 2003Donald E. Aylor* Rate of dehydration of corn (Zea mays L.) pollen in the air
http://www.darcof.dk/enews/june04/pollen.html
Newsletter from Danish Research Centre for Organic Farming • June 2004 • No. 2
Wind dispersal of genetically modified pollen from oilseed rape and rye fields
By C. Geels, P. Løfstrøm, L. M. Frohn, J. Brandt and G. Kjellsson, National Environmental Institute, Denmark
The increasing use of genetically modified plants (GMP) has opened up for a discussion about the problems related to the co-existence of GM and non-GM crops and especially the consequences for organic farming. One of the objectives of DARCOF project TOPRO (Tool for protection against contamination by GMO) has been to develop specific modelling tools,
which can be used for the prediction of dispersal of GM pollen under different conditions and for investigating measures to limit the GM dispersal to organic fields.
Dispersal of pollen
The focus has been on wind dispersal of pollen from winter oilseed rape (Brassica napus) and winter rye (Secale cereale), which are wind-pollinated crops. Insect pollination is also important for many types of crops (including oilseed rape), but the precise importance of wind versus insect pollination is often not well determined. In order to assess the potential risk for gene flow among crops, it is therefore important to increase our knowledge about the biological and physical processes driving the pollen dispersal for a given crop.
In this study a dispersion model is used to investigate the potential for wind dispersal of GM pollen and quantify the ratio between the concentration of GM and non-GM pollen over a given field. Over a non-GM field this ratio can be assumed to be proportional with the GM pollination and hence with the probability of unintended GM content in the crop (i.e., adventitious presence). In the following the applied model is described and examples of the results and future applications are presented.
A new pollen model
The OML-DEP model is based on the Operational Meteorological Air Quality Model, which has been developed and improved throughout the years at the National Environmental Institute in Denmark (Berkowicz et al., 1986; Olesen et al., 1992). The OML model is a modern Gaussian plume model suitable for detailed studies of dispersion of tracers in the atmosphere within 20 to 30 km from the source. The newly developed pollen version of OML-DEP now includes:
the emission of pollen from area sources (e.g., cultivated fields) the subsequent dispersion of pollen in the atmosphere due to the wind and the turbulent
mixing processes in the lowest part of the atmosphere the removal of pollen due to both gravitational settling and dry deposition.
Temporal and regional variation in pollen dispersal
The model needs an input of meteorological parameters, which in the current study is obtained from the meteorological model Eta (Nickovic et al. 1998; Brandt et al. 2001). Currently the OML-DEP pollen model simulations have been performed for five pollen seasons in the period 1999 to 2003. Thereby the possible variations in the pollen dispersal as a function of the year to year variations in the meteorological data can be analysed.
In order to study a similar effect of regional differences, the model simulations have been carried out for three locations in Denmark (Tange, Øster Højst and Lille Valby) for the five seasons included. Information on, e.g., the temporal variation of the emission of oilseed rape and rye pollen as well as on the settling velocity was found in the literature.
Model estimates of the spatial distribution of oilseed rape pollen at the three locations and for the five seasons indicate that the dispersal of pollen varies significantly due to the temporal and regional differences in the meteorological conditions. The dominating wind direction has a large impact on both the concentration level and the spatial distribution of pollen, but also the variations of the turbulent conditions in the atmospheric boundary layer (ABL) are seen to be important for the dispersion. The ABL is defined as the lowest part of the atmosphere where eddies (turbulence) are formed due to convection and friction at the surface. Turbulence can then lead to an effective mixing of pollen in the ABL depending on the local heating, the wind speed and the roughness of the surface. The potential for wind dispersal will therefore vary on both short and long time scales depending on local conditions, which all in all makes a general assessment of the probability for pollen dispersal more complicated.
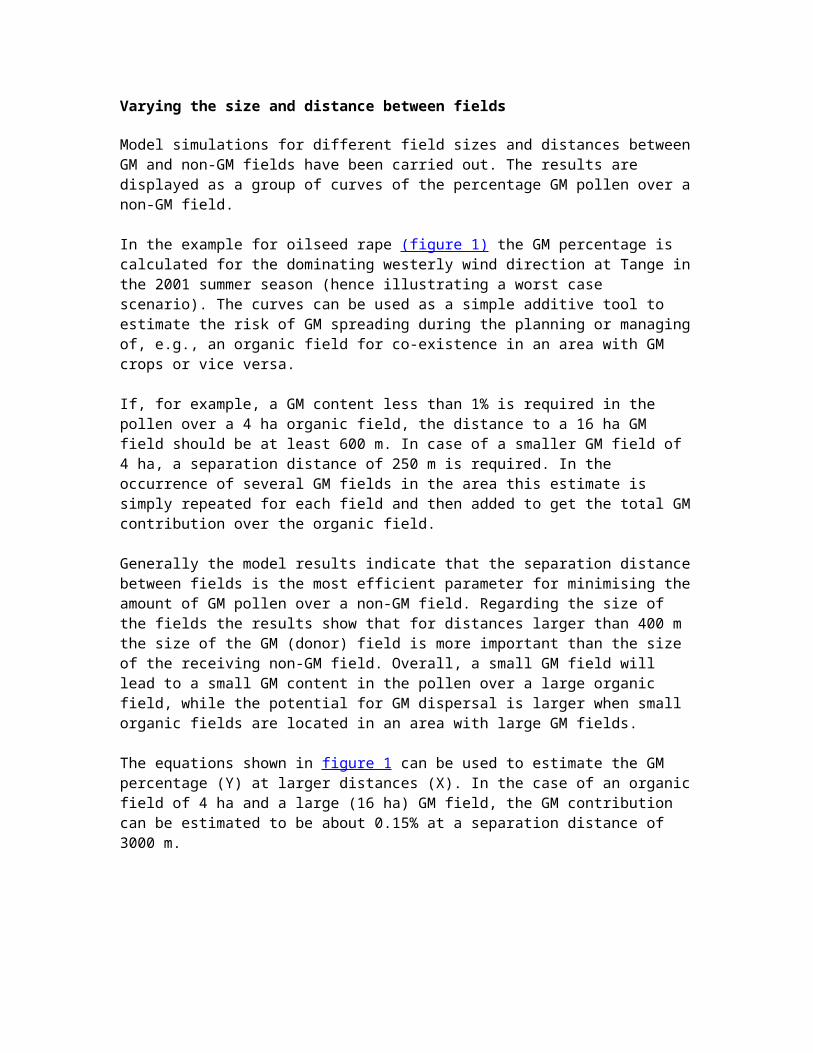
Varying the size and distance between fields
Model simulations for different field sizes and distances between GM and non-GM fields have been carried out. The results are displayed as a group of curves of the percentage GM pollen over a non-GM field.
In the example for oilseed rape (figure 1) the GM percentage is calculated for the dominating westerly wind direction at Tange in the 2001 summer season (hence illustrating a worst case scenario). The curves can be used as a simple additive tool to estimate the risk of GM spreading during the planning or managing of, e.g., an organic field for co-existence in an area with GM crops or vice versa.
If, for example, a GM content less than 1% is required in the pollen over a 4 ha organic field, the distance to a 16 ha GM field should be at least 600 m. In case of a smaller GM field of 4 ha, a separation distance of 250 m is required. In the occurrence of several GM fields in the area this estimate is simply repeated for each field and then added to get the total GM contribution over the organic field.
Generally the model results indicate that the separation distance between fields is the most efficient parameter for minimising the amount of GM pollen over a non-GM field. Regarding the size of the fields the results show that for distances larger than 400 m the size of the GM (donor) field is more important than the size of the receiving non-GM field. Overall, a small GM field will lead to a small GM content in the pollen over a large organic field, while the potential for GM dispersal is larger when small organic fields are located in an area with large GM fields.
The equations shown in figure 1 can be used to estimate the GM percentage (Y) at larger distances (X). In the case of an organic field of 4 ha and a large (16 ha) GM field, the GM contribution can be estimated to be about 0.15% at a separation distance of 3000 m.
Figure 2a. The GM ratio (in %) of rye pollen in the air above a 10 km x 10 km region in Denmark. Results from OML-DEP simulations representing a scenario for the minimum separation distance between GM and non-GM crops of 250 m. Red squares indicate GM fields, while non-GM fields are shown as blue squares. The coloured curves show percentage GM pollen: red=1%, pink=0.3% and purpel=0.1%.
Figure 2b. The GM ratio (in %) of rye pollen in the air above a 10 km x 10 km region in Denmark. Results from OML-DEP simulations representing a scenario for the minimum separation distance between GM and non-GM crops of 1000 m. Red squares indicate GM fields, while non-GM fields are shown as blue squares. The coloured curves show percentage GM pollen: red=1%, pink=0.3% and purpel=0.1%.
http://www.encyclopedia.com/doc/1G1-54626774.html
Pollen dispersal models in quaternary plant ecology: assumptions, parameters, and prescriptions.From: The Botanical Review | Date: 1/1/1999 | Author: Jackson, Stephen T.; Lyford, Mark E.
Print Digg del.icio.us
Models of atmospheric dispersal of anemophilous pollen are important tools in Quaternary plant ecology for determining pollen-source areas and for applying distance-weightings to vegetation data in formal pollen-vegetation
calibrations. The most widely applied model is Prentice's model, which uses a modified form of Sutton's equation for atmospheric diffusion to predict pollen-source areas from size of the depositional basin and a set of depositional parameters (deposition velocity of the ...
"Image of pollen grains, copyright Dr J Bloggs, University of Leeds, image courtesy of ImageBank".
http://www.mmm.ucar.edu/mm5/workshop/ws02/Pietrowicz.pdfTesting of Mesoscale MeteorologicalModels as a Tool to ForecastPollen ConcentrationsJoseph Pietrowicz1KMOV-TVRobert PaskenDepartment of Earth and Atmospheric SciencesSaint Louis University
Male phenology of three species of Cupressus: correlation with airborne pollen Journal Trees - Structure and FunctionPublisher Springer Berlin / HeidelbergISSN 0931-1890 (Print) 1432-2285 (Online)Issue Volume 17, Number 4 / July, 2003Category Original ArticleDOI 10.1007/s00468-002-0243-xPages 336-344Subject Collection Biomedical and Life SciencesSpringerLink Date Thursday, February 19, 2004
Add to marked items Add to shopping cart Add to saved items Permissions & Reprints Recommend this article
Domínguez 1Departamento de Biología Ambiental y Salud Pública, Universidad de Huelva, Campus de El Carmen, 21071, Huelva, Spain2Departmento de Biología Vegetal, Universidad de Córdoba, Campus Universitario de Rabanales, 14071, Córdoba, Spain
Abstract
A 3-year male phenological field study was performed on the represented species of the genus Cupressus in the city of Cordoba (Spain): Cupressus arizonica, C. macrocarpa and C. sempervirens. A new and complete description of the phenological stages of the male flower of Cupressus was obtained. Five phenological phases were described using internal and external bud/flower traits. In general, different pollination periods were recorded for the 3 years. C. arizonica flowered from 20 to 23 days before the others. C. macrocarpa and C. sempervirens flowered almost simultaneously, although the former appeared to flower slightly earlier. The total number of trees per square kilometre was estimated taking into account the total number of trees of each species in the city and surrounding area (5 km radius from the city centre). Data corresponding to total pollen production per tree were taken from a previous study in which the partial contribution of each species to atmospheric pollen was estimated. Considering all these parameters, a theoretical airborne pollen model was proposed. A correlation coefficient (R2) of 0.46 was obtained when comparing this model with the average airborne pollen concentrations for the last 18 years. According to the proposed model, C. macrocarpa trees accounted for 78% of total airborne pollen, while C. sempervirens and C. arizonica accounted for only 18% and 4%, respectively. The final objective of this study was to provide additional biological information on these species responsible for winter pollinosis in the Mediterranean area. Forecasting pollen emission and dispersion has an important application in public health warnings.
Keywords
Male phenology, Cupressus, Airborne pollen, Microsporogenesis
Home | Industry Information | Business News | Browse by Publication | B | Bulletin of the New Jersey Academy of Science
Pollen germination as a model system for teaching the process of science to undergraduate non-science majors in an investigative laboratory.
Article, News, Research, Information, Industry & Business News» View article excerpt
Ads by Google
Treatment for Allergies Find a Nasal Allergy Spray to Treat Seasonal Symptoms. Learn More.
Tree Allergy Info Learn About Your Seasonal Allergies & Discover How Claritin® Can Help
Alaway for Itchy Eyes Fast-acting, Long-lasting relief w/ no prescription. Get a free sample!
Read this article now - Try Goliath Business News - FREE! You can view this article PLUS...
Over 5 million business articles Hundreds of the most trusted magazines, newswires, and journals (see list) Premium business information that is timely and relevant Unlimited Access
Now for a Limited Time, try Goliath Business News - Free for 7 Days!
Tell Me More Terms and Conditions Close
You can enjoy Goliath Business News absolutely FREE for 7 days. At the completion of the 7-day trial, you will be charged $19.95 per month. You may cancel at any time. If you cancel before the trial period ends, you will not be charged. You may only sign up for this free trial once in a 90-day period. To cancel your membership, go to "My Account" and select "Cancel My Subscription". Complete the cancellation process and your account will not be charged.
Purchase this article for $4.95Already a subscriber? Log in to read full article
Publication: Bulletin of the New Jersey Academy of SciencePublication Date: 22-MAR-03Format: Online - approximately 5564 wordsDelivery: Immediate Online AccessAuthor: Evans, Robert C.
Article ExcerptABSTRACT: To help undergraduate non-science majors understand the process of science, an "investigative laboratory" approach was used to teach a one-semester course, "Science in Action," to 15 first- and second-year students. In this course, which was taught entirely in the laboratory, students worked cooperatively with each other and with the instructor on a research problem for which the answer was not known. Pollen grain germination was chosen as a model system, and the goal was to identify nutrient molecules that would stimulate germination of Gladiolus pollen. To adequately prepare the students for this project, the first several class periods were used for instruction in experimental design, statistical analysis of data. calculations for preparing solutions, and basic laboratory techniques. For the remainder of the course, students worked in groups on the problem, and even though they made progress they did not solve it by the end of the semester. However, results from student evaluations indicated that they learned a great deal, and they rated the quality of the course as high. Anecdotal conclusions by the instructor suggested that non-science students could excel at doing research via this method, and the process of working on a problem for which the answer was not known was exciting for both the students and the instructor.
Over the past few decades, there has been considerable interest in developing new strategies for teaching undergraduate science laboratories. Traditionally, students in science laboratories follow a proscribed series of recipe-like steps, usually printed in a manual, to observe and verify concepts and processes discovered by others. Such "cookbook labs" have served as the background for developing new laboratory exercises that give greater emphasis to problem-solving skills and applications of the scientific method. For example, in "open-ended labs," students use the results obtained in a traditional laboratory to conduct follow-up experiments of their own choosing. In "inquiry-based labs," students solve a series of "What happens if..." questions posed by the instructor. In
"investigative labs" students design and carry out an entire research project (Sundberg and Moncada, 1994).
The investigative laboratory, or I-lab, has been particularly effective in promoting student learning of both the process and content of science. Although many variations of the I-lab model exist, the basic plan for such a course, as described in what is still the classic reference for I-labs (Thornton, 1972a), is as follows:
1. Students are told that the purpose of the course is to help them conduct a research project of their choosing, and the instructor designs a series of exercises to prepare the students for this task.
2. In consultation with the instructor, students (either individually or in groups) formulate a problem and the experimental plan for solving it.
3. Students carry out their experiments over a period of time sufficiently long that experiments can be repeated, and the direction of the work can be modified if necessary.
4. The laboratory terminates with the submission of written and! or oral reports.
The evidence suggests that in I-labs, which emphasize student creativity and decision-making, students learn the desired concepts at least as well as students in traditional laboratories, and student satisfaction is much higher (Leonard, 1994). Because they emphasize procedures utilized by practicing scientists, such as hypothesis formation, manipulation of experimental variables, and data analysis, I-labs respond to the report, Project 206l: Science for all Americans, in which the American Association for the Advancement of Science recommends that science curricula include greater emphasis on the process of science rather than strictly content (American Association for the Advancement of Science, 1989). That is, students should experience science firsthand instead of merely being told about it (Thornton, 1972a).
One problem noted by instructors of biology I-labs is that students are often overwhelmed by the freedom to choose their own experimental problem. As a result, they cannot identify a suitable project, and potential experiments gleaned from journal articles are beyond their levels of expertise. This problem can be solved by providing the class with an experimental system for which some of the background work has already been carried out (Thornton, 1972b). By using such a "model system," students do not have to start from scratch, spending what might be the entire semester on tasks such as selecting an experimental organism, determining the optimal environmental conditions for maintaining it, and accumulating the appropriate apparatus for conducting the experiments. Care must be taken, however, to find a model system that is 1) simple enough to used by non-majors and 2) complex enough to maintain their interest for an entire semester. In this paper, I explain how pollen grain germination can be used as an effec tive model system for an I-lab. In addition, I describe how the I-lab concept can be used to teach the scientific method to students who are not majoring in a
science program.
MATERIALS AND METHODS
In the Spring 2002 semester I taught an honors seminar for first- and second-year non-science students. Fifteen students were enrolled, and all were taking the course to partially fulfill the science requirement in the College of Arts and Sciences at Rutgers-Camden. There were no prerequisites for this course, but all of the enrolled students had taken biology and chemistry in high...
Science NewsShare Blog Cite
Print Email Bookmark
Simulating Kernel Production Influences Maize Model Accuracy
ScienceDaily (Sep. 23, 2007) — Recently, researchers at Iowa State University discovered a way to increase the accuracy of a popular crop model. By zeroing in on early stages leading up to kernel formation, scientists believe they can help improve yield predictions across a variety of environmental conditions.
See also: Plants & Animals← Endangered Plants ← Botany ← Agriculture and Food
The Crop Environment Resource Synthesis (CERES)- Maize model is used worldwide to predict maize yield each growing season. CERES-Maize predictions are based upon simulations of plant growth and the amount of carbon and nitrogen maize plants accumulate each day. While this approach provides growers with ballpark estimates of maize production, the accuracy decreases when growing conditions affect kernel formation more than plant growth.
Unlike most crop plants, maize has separate male and female flowers. Pollen from male flowers must travel to and fertilize female flowers located on ear. Each successful fertilization of a female flower leads to the production of a kernel.
"Pollination success depends on the amount of viable pollen produced, the presence of the pollen receptive part of the female flower, and close synchrony in male and female flower development," says Mark Westgate, Iowa State University professor of agronomy. "CERES-Maize does not consider these critical aspects of the pollination process."
To overcome the limitations of CERES-Maize, Westgate and his colleagues developed algorithms for a Flowering Model to simulate maize flowering dynamics. Once they were convinced the Flowering Model was properly imitating maize flowering patterns, they coupled it to CERES-Maize. The Modified version of CERES-Maize then was calibrated against two years of field data involving three hybrids, eight population densities, and seven nitrogen levels. The Modified version of CERES-Maize generated more accurate predictions of maize yield across a wide range of growing conditions.
"There are many situations in which kernel number is not limited by the ability of the plant to supply carbon and nitrogen to the ear," Westgate said. "By taking into account other factors influencing kernel number, CERES-maize is much more sensitive to biological factors that can affect yield."
What's up next for Westgate and his research team? A model they are developing to predict pollen movement from one field to another. They're using it along with the Flowering Model to predict the genetic purity of harvested seed. According to Westgate, genetic purity is a concern in hybrid seed production as well as for corn grown for non-genetically modified markets.
The team of scientists reported their findings in the September-October issue of Crop Science.
Adapted from materials provided by American Society of Agronomy, via EurekAlert!, a service of AAAS.
Need to cite this story in your essay, paper, or report? Use one of the following formats:
APA
MLA American Society of Agronomy (2007, September 23). Simulating Kernel Production Influences Maize Model Accuracy. ScienceDaily. Retrieved March 30, 2008, from http://www.sciencedaily.com /releases/2007/09/070921071649.htmNews
Share Blog CitePrint Email Bookmark
GM Field Trials 'Underestimate Potential For Cross-pollination'
ScienceDaily (Jun. 1, 2007) — Field trials could be underestimating the potential for cross-pollination between GM and conventional crops, according to new research by the
University of Exeter. The research team recommends a new method for predicting the potential for cross-pollination, which takes account of wind speed and direction.
See also: Plants & Animals← Agriculture and Food ← Genetically Modified ← Botany ← Biology ← Nature ← Developmental Biology
The research, used records of wind speed and direction from weather stations across Europe to predict the movement of pollen in the air. The findings show huge variation in the amount of cross-pollination between GM and non-GM crops of maize, oilseed rape, rice and sugar beet. Levels vary according to whether the GM field is upwind or downwind of the non-GM field given the direction of the prevailing wind over the flowering period of the crop.
Field trials are regularly carried out to measure the potential for cross-pollination between GM and conventional crops. Current guidelines for minimum field-to-field distances are based on the results from these trials. However, if the GM field in a trial is downwind of the non-GM field, the trial will underestimate the potential for cross-pollination.
'We were struck by the strong influence of wind direction on the amount of cross-pollination', said Martin Hoyle of the University of Exeter. 'Wind speed and direction are important factors outside of our control that have not previously been used to inform guidelines on minimum field-to-field distances. Recommended minimum distances between GM and conventional crops may need to be increased based on our findings.'
Field trials are time-consuming and expensive, so measuring the potential for cross-pollination across the full range of weather conditions is not feasible. This research resulted in the development of a theoretical computer model to analyse the effects of wind on pollen travel. The model, together with measurements of cross-pollination and wind speed and direction from field trials, can be used to predict cross-pollination at other times and sites.
'If the production of GM crops becomes widespread in Europe, it is essential that measures are taken to minimise cross-pollination from GM to conventional non-GM crops,' said Hoyle. 'The recommended minimum distances between GM and conventional crops should be informed by weather data, which is possible using our model of pollen dispersal in the wind.'
This research was funded by the Natural Environment Research Council (NERC) and published 1 June 2007 in the journal Ecological Applications. Ecological Applications is the journal of the Ecological Society of America.
Adapted from materials provided by University of Exeter, via EurekAlert!, a service of AAAS.
Need to cite this story in your essay, paper, or report? Use one of the following formats:
APA
MLA University of Exeter (2007, June 1). GM Field Trials 'Underestimate Potential For Cross-pollination'. ScienceDaily. Retrieved March 30, 2008, from http://www.sciencedaily.com- /releases/2007/05/070531191126.htmScience News
Share Blog CitePrint Email Bookmark
Seeds Without Sex -- Research Could Make Male Plant Parts Redundant
ScienceDaily (Sep. 9, 1997) — CSIRO research could make male plant parts in crops redundant, and dramatically lift grain production around the world.
See also: Plants & Animals← Endangered Plants ← Agriculture and Food ← Botany ← Seeds ← Nature ← Pests and Parasites
The research program aims to develop plants which can produce seed without sex. It is a 15-year collaboration between CSIRO, the Australian Centre for International Agricultural Research (ACIAR), and the International Rice Research Institute (IRRI).
"The normal process of pollen formation and transfer is very sensitive to a range of weather conditions - it cannot be too dry nor too windy and so forth. It is estimated that $400 million is lost in rice production alone around the world each year because of drought-related pollination failure," said Dr Abed Chaudhury, of CSIRO Plant Industry.
In a world-first discovery, CSIRO scientists have found a gene that allows Arabidopsis - a test plant used by scientists because of its rapid life cycle - to bypass the normal pollination process and begin seed formation. This is the crucial first step in developing plants which can produce seed without pollination.
The hunt is now on to find equivalent genes in commercial plants like rice - the world's biggest crop, and the staple diet for billions of people globally.
"In most crop plants, the male parts of the flower transfer pollen to the female parts, prompting the grain to develop," Dr Chaudhury said.
"But we are aiming to produce grain without the need for male plant parts."
Plants that do not require pollination for seed-set undergo an alternative, sexless process called apomixis. CSIRO scientists aim to identify the genes involved in apomixis and then use them in pollination-reliant crop species.
"If we can produce commercial crop plants that don't need pollination, the benefits would be enormous in terms of higher yields and more efficient production methods," Dr Chaudhury said.
ACIAR have estimated that the minimum likely benefits from the research will be $7 billion to $8.6 billion worldwide with the benefit to Australia estimated at $16 million to $19 million.
Adapted from materials provided by Australian Centre For International Agricultural Research.
Need to cite this story in your essay, paper, or report? Use one of the following formats:
APA
MLA Australian Centre For International Agricultural Research (1997, September 9). Seeds Without Sex -- Research Could Make Male Plant Parts Redundant. ScienceDaily. Retrieved March 30, 2008, from http://www.sciencedaily.com /releases/1997/09/970909053217.htm
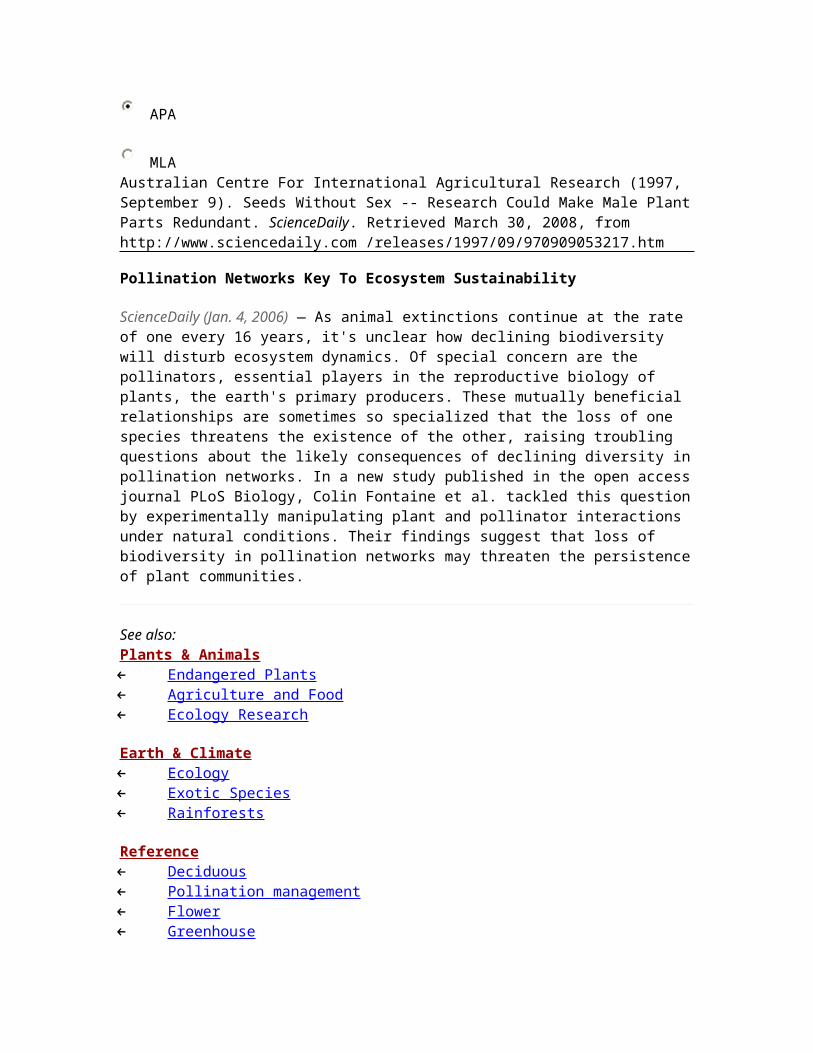
Pollination Networks Key To Ecosystem Sustainability
ScienceDaily (Jan. 4, 2006) — As animal extinctions continue at the rate of one every 16 years, it's unclear how declining biodiversity will disturb ecosystem dynamics. Of special concern are the pollinators, essential players in the reproductive biology of plants, the earth's primary producers. These mutually beneficial relationships are sometimes so specialized that the loss of one species threatens the existence of the other, raising troubling questions about the likely consequences of declining diversity in pollination networks. In a new study published in the open access journal PLoS Biology, Colin Fontaine et al. tackled this question by experimentally manipulating plant and pollinator interactions under natural conditions. Their findings suggest that loss of biodiversity in pollination networks may threaten the persistence of plant communities.
For their study, the authors chose plants with easy and harder access to food rewards--three open-flower and three tubular-flower species--and insects with short and longer mouthparts--three syrphid fly and three bumblebee species. What happened? Not surprisingly, the pollinators stuck to their preferred plant: syrphids visited mostly open flowers, and bees visited mostly tubular flowers. Bees can pollinate open flowers but prefer tubular flowers when they have the choice, suggesting that bees may not fill a void left by a different pollinator. The presence of both pollinators allowed more appropriate pairings between insects and flowers--each performing a complementary role--leading to increased pollination efficiency and plant reproductive success.
While the study offers an admittedly pared down view of pollination networks, it demonstrates the value of studying the functional effects of pollination networks in the field. These results show that losing a species affects plant–pollinator communities, and that such losses may ultimately trigger further reductions in biodiversity, possibly reverberating through the food chain. With as many as 70% of plant species dependent on animal pollinators and at least 82 mammalian pollinator species and 103 bird pollinator species considered threatened or extinct, this is sobering news.
###
Citation: Fontaine C, Dajoz I, Meriguet J, Loreau M (2006) Functional diversity of plant–pollinator interaction webs enhances the persistence of plant communities. PLoS Biol 4(1): e1.
Adapted from materials provided by Public Library of Science.
Need to cite this story in your essay, paper, or report? Use one of the following formats:
Public Library of Science (2006, January 4). Pollination Networks Key To Ecosystem Sustainability. ScienceDaily. Retrieved March 30, 2008, from http://www.sciencedaily.com /releases/2006/01/060103191555.htmScience News
Share Blog CitePrint Email Bookmark
Neighbors Gone, Fruits Gone, Species Gone
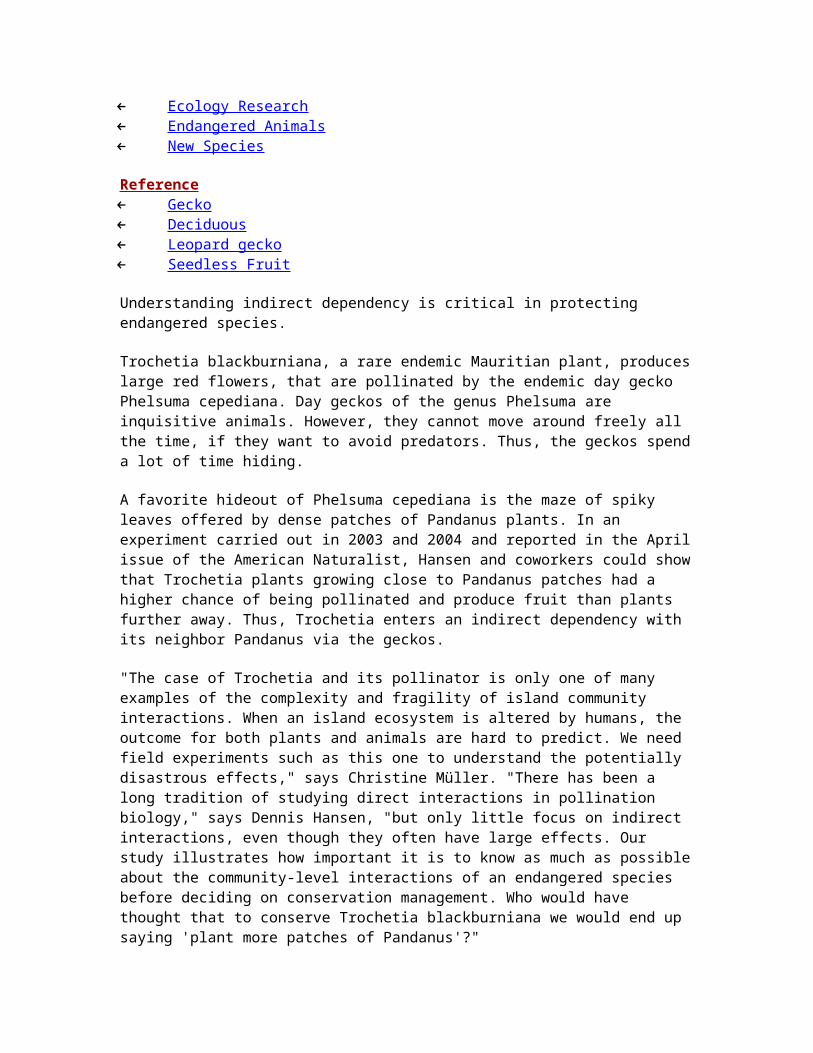
ScienceDaily (Mar. 23, 2007) — Neighbors gone, sex gone, fruits gone, species gone. This is the ultra-short conclusion of the findings in a study by Dennis Hansen, Heine Kiesbüy, and Christine Müller from Zurich University, and Carl Jones from the Mauritian Wildlife Foundation, who found that an endangered plant in Mauritius depends on a neighboring plant to provide a safe home for its pollinator, a day-active gecko.
See also: Plants & Animals← Endangered Plants ← Nature ← Botany ← Ecology Research ← Endangered Animals ← New Species
← Gecko ← Deciduous ← Leopard gecko ← Seedless Fruit
Understanding indirect dependency is critical in protecting endangered species.
Trochetia blackburniana, a rare endemic Mauritian plant, produces large red flowers, that are pollinated by the endemic day gecko Phelsuma cepediana. Day geckos of the genus Phelsuma are inquisitive animals. However, they cannot move around freely all the time, if they want to avoid predators. Thus, the geckos spend a lot of time hiding.
A favorite hideout of Phelsuma cepediana is the maze of spiky leaves offered by dense patches of Pandanus plants. In an experiment carried out in 2003 and 2004 and reported in the April issue of the American Naturalist, Hansen and coworkers could show that Trochetia plants growing close to Pandanus patches had a higher chance of being pollinated and produce fruit than plants further away. Thus, Trochetia enters an indirect dependency with its neighbor Pandanus via the geckos.
"The case of Trochetia and its pollinator is only one of many examples of the complexity and fragility of island community interactions. When an island ecosystem is altered by humans, the outcome for both plants and animals are hard to predict. We need field experiments such as this one to understand the potentially disastrous effects," says Christine Müller. "There has been a long tradition of studying direct interactions in pollination biology," says Dennis Hansen, "but only little focus on indirect interactions, even though they often have large effects. Our study illustrates how important it is to know as much as possible about the community-level interactions of an endangered species before deciding on conservation management. Who would have thought that to conserve Trochetia blackburniana we would end up saying 'plant more patches of Pandanus'?"
Dennis M. Hansen, Heine C. Kiesbüy, Carl G. Jones, and Christine B. Müller, "Positive indirect interactions between neighbouring plant species via a lizard pollinator" The American Naturalist, volume 169 (2007), pages 534--542
Adapted from materials provided by University of Chicago Press Journals, via EurekAlert!, a service of AAAS.
Need to cite this story in your essay, paper, or report? Use one of the following formats:
APA
MLA University of Chicago Press Journals (2007, March 23). Neighbors Gone, Fruits Gone, Species Gone. ScienceDaily. Retrieved March 30, 2008, from http://www.sciencedaily.com /releases/2007/03/070319114445.htm
Wild Bees And The Flowers They Pollinate Are Disappearing Together
ScienceDaily (Jul. 22, 2006) — The diversity of bees and of the flowers they pollinate, has declined significantly in Britain and the Netherlands over the last 25 years according to research led by the University of Leeds and published in Science this Friday (21 July 2006). The paper is the first evidence of a widespread decline in bee diversity.
See also: Plants & Animals← Endangered Plants ← Agriculture and Food ← Extinction
Earth & Climate← Exotic Species ← Biodiversity ← Environmental Policy
Reference← Pollination management ← Greenhouse ← Characteristics of common wasps and bees ← Bee
Concerns have been raised for years about the loss of pollination services, but until recently most of the evidence has been restricted to a few key species or a few focal sites. To test for more general declines, an international team of researchers from three UK universities (Leeds, Reading and York) and from the Netherlands and Germany compiled biodiversity records for 100s of sites, and found that bee diversity fell in almost 80% of them. Many bee species are declining or have become extinct in the UK [for detailed examples, see the attached case studies].
Lead author, Dr Koos Biesmeijer from the University of Leeds said: "We were shocked by decline in plants as well as bees. If this pattern is replicated elsewhere, the 'pollinator services' we take for granted could be at risk. And with it the future for the plants we enjoy in our countryside."
Pollinators are essential for the reproduction of many wild flowers and crops. Co-author Simon Potts (of the University of Reading) said: "The economic value of pollination worldwide is thought to be between £20 and 50 billion each year."
The team examined pollinator and plant data, collected by professional and volunteer researchers and naturalists in Britain and the Netherlands, comparing records from before and after 1980. The results showed bee diversity had declined consistently in both countries, whereas the diversity of hoverflies (another group of pollinating insects) stayed roughly constant in Britain, but increased in the Netherlands.
Loss of bee diversity in itself might not be too worrying, so long as other surviving insect pollinators are similar, and capable of pollinating the same flower species. However, this
is not the case. The research found for both bees and hoverflies, the "winners" and "losers" were consistently different; insects which pollinate a limited range of flower species or which have specialised habitat needs were most often lost. Overall, a small number of common generalist pollinators are replacing a larger number of rarer specialist species.
Stuart Roberts from the University of Reading pointed out: "In Britain, pollinator species that were relatively rare in the past have tended to become rarer still, while the commoner species have become even more plentiful. Even in insects, the rich get richer and the poor get poorer."
There have been parallel shifts in the plant world, with the plants that depend on pollination by bees disappearing too.
Dr Bill Kunin, coordinator of the project at the University of Leeds explained: "We looked at plant changes as an afterthought, and were surprised to see how strong the trends were. When we contacted our Dutch colleagues, we found out that they had begun spotting similar shifts in their wildflowers as well."
In Britain, where bee diversity has fallen and hoverflies have at best held steady, there have been declines in 70% of the wildflowers that require insects for pollination. However, wind-pollinated or self-pollinating plants have held constant or increased.
The pattern is slightly different in the Netherlands, where bees have declined on average but hoverfly diversity has increased. In that country there has been a decline in plants that specifically require bees for pollination, but not in plants that can make use of other insect pollinators. Thus the plant declines closely mirror those of the pollinators.
This difference between the countries suggests the declines in pollinators and plants are causally linked. Researcher Dr Ralf Ohlemüller from the University of York explained: "The parallel declines of wildflowers and their pollinators seem too strong to be a coincidence."
The research can't tell us whether the bee declines are causing the plant declines, or vice versa, or indeed whether the two are locked in a vicious cycle in which each is affecting the other. It's also not clear as of yet what the ultimate causes of the declines are, although land use change, agricultural chemicals and climate change may be important factors. The researchers hope to clarify these issues with follow-up studies.
Dr Biesmeijer said: "Whatever the cause, the study provides a worrying suggestion that declines in some species may trigger a cascade of local extinctions amongst other associated species."
The research may not yet prove a global decline in pollination, but in two countries at least there is strong evidence that both wild pollinators and the wildflowers that they visit are in serious trouble.
Adapted from materials provided by University of Leeds.
Need to cite this story in your essay, paper, or report? Use one of the following formats:
MLA University of Leeds (2006, July 22). Wild Bees And The Flowers They Pollinate Are Disappearing Together. ScienceDaily. Retrieved March 30, 2008, from http://www.sciencedaily.com /releases/2006/07/060721200158.htm
Field scabious (Knautia arvensis) provides pollen and nectar to a wide range of insects. One visitor, the scabious bee, Andrena hattorfiana, raises her young exclusively on pollen from this plant. (Photo Credit: Copyright Gérard Minet)
Pollination Find Could Lead To Cordgrass Control
ScienceDaily (Aug. 19, 2004) — The wind transports pollen far less effectively than scientists assumed, according to a new study of invasive Atlantic cordgrass by researchers at UC Davis. This discovery will help control a cordgrass, Spartina alterniflora, that is invading wetlands on the Pacific coast.
See also: Plants & Animals← Endangered Plants ← Botany ← Nature ← Seeds ← Pests and Parasites ← Extinction
Plants including grasses, oaks and pine trees need the wind to carry pollen between plants, fertilizing nascent seeds. Scientists guessed that wind pollination was efficient, but the theory hadn't been tested.
"People think, because they get hay fever, there's always plenty of pollen in the air," said Heather G. Davis, lead author on the study published Aug. 16 in the journal Proceedings of the National Academy of Sciences, USA. "But pollen is fragile, like sperm. It has a very short life."
Working in the salt marsh of Willapa Bay, Wash., Davis and colleagues studied wind pollination at two stages of a Spartina invasion: early, when plants are spread apart, and late, when plants form a solid meadow.
Wind pollination worked well for late-invasion meadow plants, causing high seed production. But the wind worked poorly when plants were spread further apart. Early-invasion plants received little pollen and made very few seeds.
Davis thinks this explains why Spartina covers only 60 of Willapa Bay's 230 acres, despite having been present in the bay for a century. The study's findings are helping biologists devise new strategies to eradicate invasive species. Davis says inefficient wind pollination could also speed the extinction of rare plants.
Adapted from materials provided by University Of California - Davis.
Need to cite this story in your essay, paper, or report? Use one of the following formats:
APA
MLA University Of California - Davis (2004, August 19). Pollination Find Could Lead To Cordgrass Control. ScienceDaily. Retrieved March 30, 2008, from http://www.sciencedaily.com /releases/2004/08/040819084754.htm
Invasive Spartina grass is shown in Willapa Bay, Washington. (Janie Civille/UC Davis photo)
Biology TeachersCopyright Cornell Institute for Biology Teachers, 2000.This work may be copied by the original recipient from CIBT to provide copies forusers working under the direction of the original recipient. All other redistribution ofthis work without the written permission of the copyright holder is prohibited.A Bouquet of Flower Investigations and Activitiesfour different lab activities all related to flowerreproduction. They have been designed to relate to each other and to stand alone.Name that Pollinator, has students focus on adaptations for successful pollination.Both pollen and pollen vectors are examined. Observing, data gathering, makingmeasurements through the microscope, and constructing tables are all emphasized.This lab would work equally well in ecology, evolution, or reproduction units.The World’s Best Artificial Flower is a cooperative learning venture which hasstudents either construct 3-D models or write essays on a fictitious flower, pollinator,habitat system.The third activity, Flower Dissection, is a rather traditional lab. Students identify,remove, arrange, and tape down the essential and accessory parts of a flower. It alsohas students examine pollen grains and the possibility of pollen tube formation.“To form a pollen tube...or not to form a pollen tube,” allows students to design theirown experiment to investigate some variable influencing pollen germination. Theparts of a research paper are outlined and students are expected to follow that formatwhen writing their final report.
Students had a wonderful time creating simulated pollen by vigorously rubbing yellow chalk on paper, then dredging cotton ball "pollen baskets" through the dust to "fill them up." Which legs are the pollen baskets on? Francesca forgot, but since Kay was busy elsewhere, she used her own initiative to consult the book they had just read to answer her own question.
The worker bee weighs 80 milligrams. Her honey crop will hold 70 milligrams of nectar, and her pollen baskets will hold 20 milligrams of pollen. Workers can fly 12 to 15 miles per hour and will average 8 to 12 trips from the hive each day for a distance of 1 1/2 miles forag ing for nectar and pollen.
1. If a worker bee flies 15 miles per hour from the colony to a pollen and nectar source 3/4 miles away, how long does it take her to complete one trip?
[6 minutes]
2. If a worker bee makes 10 round trips from the colony to the nectar source 3/4 miles away, how many miles does she travel all together?
[15 miles]
3. If a worker bee makes 10 complete trips to get food 3/4 miles away by flying 15 miles per hour, how much time has she spent flying?
[One hour]
4. If a worker bee can carry 90 milligrams of nectar and pollen each trip, how much total weight has she carried after making 10 trips?
[900 milligrams]
5. Based on your answer for problem 4, how many grams of weight does the worker bee carry all together?
[.90 grams or almost 1 gram]
6. How does the total weight carried by the worker bee after making 10 trips compare to her body weight?
7. Of the total weight carried (in milligrams), how much of the weight was from carrying nec tar and how much of the weight was from carrying pollen? [700 milligrams of nectar, 200 milligrams of pollen]
From: Africanized Honey Bee Curriculum, developed by Betsy A. Leonard, H. Steven Dasher, and Karen L. Robb. Published by the University of California Cooperative Extension Farm and Home Advisor's Office, San Diego, CA., 1994.
I found an article stating that the tree Alnos japonica, or Japanese alder, has pollen grains which have an average radius of 12 micrometers and which have a density of 1.350 grams per cubic micrometer. (That's the density of an actual pollen grain, which was of interest for the study in question.) Here's a text file of the study:http://www.google.com/search?q=cac he:UHwSwtthEV8:www.imamod.ru/jour/conf/ECCOMAS_2000/PDF/758.pdf+pollen+weight+-loss+-control+density&hl=en
Let's assume that the pollen grains are spherical. The volume of one grain would be 4/3 pi r-cubed, or (4/3)x(3.14)x(12 microns to the third power). That comes out to a volume of 7.23 times 10 to the -15 cubic meters per pollen grain.
The weight of one pollen grain would be the volume of the pollen grain times the density of the pollen grain. So a single grain of Japanese alder pollen would weigh 9.77 times 10 to the -9 grams.
Another reference I found says that a moderate level of an allergen will cause many individuals who are sensitive to it to experience symptoms. A moderate level of tree pollen is 15-90 grains per cubic meter of air. Let's call it 50 pollen grains per cubic meter of air. Reference: http://www.thebostonchannel.com/weather/pollencount/
To find the weight of a moderate level of Japanese alder pollen in a cubic meter of air, multiply the weight of one grain times 50. Therefore, the amount of Japanese alder pollen necessary to produce symptoms in moderately allergic people would be 0.145 micrograms of pollen/cubic meter of air. If 250,000 pounds of Japanese alder pollen were sprayed over 30 minutes at 2000 meters from one stationary KC-10 tanker, it would produce five times the level of allergen necessary to produce allergies in moderately allergic people. In other words, it would be theoretically possible for a single tanker to disburse enough of an allergen to make moderately allergic people notice symptoms at ground level. These calculations do not prove that the purpose
of the putative spraying is to make people sick, but they do show that spraying large quantities of particulate matter could make susceptible people sick as an unintended consequence.
She Does Math!: Real-Life Problems from Women on the Job By Marla Parker
SU 222 – Scott Thatcher (Truman) Pollen Flight Dynamics: An Interdisciplinary Project in Math and Biology The pollen grains of wind-pollinated plants come in a variety of shapes and sizes. Some have one to three air-filled sacs positioned around the main body. These sacs affect the pollen grain’s flight characteristics. This interdisciplinary project studied the effects of the shape, size, surface features, and position of the sacs on the pollen grain’s flight dynamics. A research team comprised of one math faculty member, one biology faculty member, and one undergraduate from each discipline used microscopy and mathematical modeling to create a model for the settling speed of pollen grains. This is a report on that work and on insights gained while pursuing this interdisciplinary work.
http://www.ncdc.noaa.gov/paleo/polle...webviewer.htmlI just found this totally rad thing right here, pollen viewer. It shows plant populations from 21,000 BC to present. But what are the units for the models shown?
Can't see the link So I'm not sure what exactly you want to know. Pollen diagrams like this one (Lucke and Brauer 2004 Meerfelder Maar in the Younger Dryas) show the pollen count per cubic centimeter. You see filled black graphs and open white, that's a difference in order of magnitude. This specific one is extremely interesting. I have to write the others sometimes that their dating is 34 years off. The correction would bring their transition to the Younger Dryas to 11,654 years ago, whereas the transitition in the GISP ice core is 11,652 years. Unfortunately the error margin (+29 -26 years) spoils the apparant accuracy.
Pollen Viewer 3.2, created by Phil Leduc. See: Late Quaternary vegetation dynamics in North America: scaling from taxa to biomes.
Ages at the top of maps are calibrated ages. White areas on maps have no data. Light blue areas on maps are ice.
Errata: The word "Differentiated" for Pinus and Picea should instead be "Undifferentiated". Thuja (Arbor Vitae) should instead be Thuja (Western redcedar).
08 December 2003
http://www.mathaware.org/mam/00/master/people/webb/paleo.htmlPaleoecology and Data Visualization
Brownian motionIn 1827 the English botanist Robert Brown noticed that pollen grains suspended in water jiggled about under the lens of the microscope, following a zigzag path like the one pictured below. (Click the mouse button to draw a new path). Even more remarkable was the fact that pollen grains that had been stored for a century moved in the same way.
JAVA Applet here
BrownianMotion.java | CGraphics.java
In 1889 G.L. Gouy found that the "Brownian" movement was more rapid for smaller particles (we do not notice Brownian movement of cars, bricks, or people). In 1900 F.M. Exner undertook the first quantitative studies, measuring how the motion depended on temperature and particle size.
The first good explanation of Brownian movement was advanced by Desaulx in 1877: "In my way of thinking the phenomenon is a result of thermal molecular motion in the liquid environment (of the particles)." This is indeed the case. A suspended particle is constantly and randomly bombarded from all sides by molecules of the liquid. If the particle is very small, the hits it takes from one side will be stronger than the bumps from other side, causing it to jump. These small random jumps are what make up Brownian motion.
http://www.woodrow.org/teachers/bi/1997/pollen2/Pollen: collecting, observing, and classifying
by Greg Bisbee Arrowhead High School Hartland, Wisconsin
Students will: learn the basic anatomy of flowering plants (angiosperms) collect and observe pollen from different species of plants classify pollen according to shape, size and physical characteristics create a dichotomous key for identifying the pollen grains germinate pollen, observe pollen tube formation, and explain this event
Sample Problem 2• A circular culture plate with a radius of 5cm is placed in an open area outside a clinic for six hours. At the end of this time the plate is taken to lab for examination. It is observed that there are 54 grains of pollen per square centimeter of surface area. Determine the surface area of the plate and the number of pollen grains present.
Higher level • It’s your turn. Please measure thecircumference of your partners head usinga tape measure. Find the area of the head and try to find the total surface area.IiAnswers will vary See formula below Solution• r=c/2π• SA=4πr2• Total surface area=SA/.099National Research Center for Career and Technical Education
Solution 3• A=4πr2•=4(3.14)(15cm)2•=2826cm2Sample 3• What is the surface area of a basketballthat has a radius of15cm?http://www.nba.com/Solution 4• A=bh/2•=10cm(5cm)/2•=25cm2http://www.ncdc.noaa.gov/paleo/webmapper-pollen.html
Spruce, sedge, and pine distribution at 6,000 years before present. Click figure to run the PollenViewer. Late Quaternary vegetation dynamics in North America: scaling from taxa to biomes Ecological Monographs Vol. 74, No. 2, pp. 309-334, May 2004
John W. Williams 1,4 , Bryan N. Shuman2, Thompson Webb III3, Patrick J. Bartlein2, Phillip L. Leduc3 1
http://remf.dartmouth.edu/images/botanicalPollenStereoColor/index.htmlPollen Color Stereo and animation
The Climate Time Machine ActivityIn “The Climate Time Machine” activity, students will look for “simulated pollen in lake sediment”.Based on actual pollen data collected from Battleground Lake in southwest Washington, students will
Forensic Palynology . . . solving a crime and a scheme for developing good microscope skills in students
Students use microscopes relatively infrequently in the school laboratory. Thus they rarely have an opportunity to develop the skills needed to get the best from their work. In particular, student drawings from slides are often sloppy and unrepresentative. Students also have difficulty when using high power objective lenses and graticules to estimate size. Setting a microscope session within a forensic scenario seems to generate greater student interest and enthusiasm, possibly because of the relevance of their laboratory work to ‘real life’ forensic analysis.
Pollen has been used for some years in helping to solve crime, from the adulteration of commercial honey to murder. (For further information, see the websites and references listed below.) This article provides a useful simulation of ‘solving a crime’ by using pollen samples, and an opportunity to develop students’ microscopy skills. It is particularly suitable for post-16 students, but can also be used successfully with younger pupils.
Preparation for the activity and identifying the ‘suspect’
First you need to collect some pollen, using the method for collecting and storing pollen as described below. You then use the collected pollen to make up class sets of ‘mixed’ pollen slides. For the class sets you need to include a ‘crime scene’ sample and a series of ‘suspect’ samples. (We suggest three to five suspect samples.)
You also need photographs of a number of pollens, giving their names and size. Some of these photographs must be of pollen that you use to make up the slides. For the photographs it is appropriate to use laminated A4 sheets, with eight photographs per page. One set of sheets (we suggest a maximum of three sheets per set) is needed for each group of students (two to four students per group). As an example, a group of four photographs is shown below. So you may have three laminated sheets (i.e. a total of 24 photographs) and eight of these photographs represent pollens which have been used to prepare the slides – the other 16 being chosen at random.
To identify the pollens that they see on the slides in the ‘crime scene’ sample, students need to draw the pollens and estimate their size. They then compare their findings with the photographs to identify the pollens. Ultimately they should be able to identify one of the ‘suspects’ as being the same as the ‘crime scene’.
Outcomes
As well as ‘solving the crime’, after completing this exercise, students should be skilled in the following techniques:• finding and focusing pollen using the low power objective• scanning a slide using the low power objective to look for the different pollens• using the higher power objective to draw a sample pollen• using a graticule with a high power objective to estimate pollen dimensions
Selecting which pollens to use
Most plants flower in a particular season, so to collect sufficient different pollens, it may be necessary to collect pollen over several seasons. You may be fortunate in having a wide selection growing in the school grounds or in your own garden. You may be able to grow some plants at school that will provide you with samples, or you can always try using a florist or supermarket.
Plants that produce large amounts of pollen include the following:
horse chestnut (Aesculus hippocastrum) Christmas rose (Helleborus niger)
In addition, species of apple (Malus), plum and cherry (Prunus), poppy (Papaver), pine (Pinus), mallow (Lavatera), daffodil (Narcissus), lily (Lilium), fritillary (Fritillaria), and tulip (Tulipa) are useful as sources of pollen. As a rough guide, a loaded microspatula tip of each pollen is enough to make up a class set of slides.
Making a set of pollen slides
You need to collect several types of pollen or anthers (see boxes 1 and 2). Both pollen and anthers store well in the freezer (in stoppered containers) until required. You may, for example, have eight samples (A to H), two of which are pure pollen (A and B), and the rest anthers (C to H).
4. Spreading pollen 5. Adding the stain 6. Laying on a cover slip
• Add about 500 µl water to each tube of anthers, shake vigorously, and leave for about 10 minutes to allow the anthers to release their pollen.• Label six tubes as follows: CS (for crime scene sample), S1 to S5 (for five suspect samples). Decide which pollen samples you will mix together for each sample - one of the suspect tubes will match the crime scene one. Add a very small amount of pollen from tube A or B, or a drop of suspended pollen from tubes C to H. It is recommended to have no more than four pollens in each sample, otherwise the analysis becomes too long. See box 3.• Once you have loaded the tubes, shake vigorously to mix evenly, then pipette a drop from the CS tube onto a number of microscope slides labelled CS (enough for your student group). Spread out the pollen onto each slide, and either place in a cool oven or leave to dry. Repeat for the suspect slides. See box 4.• Once dry, add a drop of Basic Fuchsin stain (warmed in an oven at about 50ºC to melt it), and lay on a cover slip. If possible, use large coverslips (22 x 50 mm). See boxes 5 and 6.
• Leave your samples in the oven until the stain has spread throughout the specimens (about 5 minutes) and then remove them and press the cover slip down on the slides gently to remove any excess stain and air bubbles (a cocktail stick is the recommended tool!). Excess stain around the edges of the cover slip can be removed with a scalpel blade when set.
The stainThe stain is based on Basic Fuchsin, which colours most pollens pink. It can be made up as follows.Add 7 g of gelatin (this can be found in most supermarkets) to approximately 42 cm3 of tap water. Warm gently to dissolve. Add 50 cm3 of glycerine and 10 drops of 80% phenol (care!). Keep warm so that the mixture remains liquefied.Dissolve 0.1 g Basic Fuchsin in 10 cm3 IMS. Add this drop-wise to the liquefied jelly until a rich pink colour is obtained.The stain may be stored indefinitely at room temperature (as may the excess Basic Fuchsin), and then warmed to about 50ºC before use.
Some examples of pollens that could be used to make up ‘crime scene’ and ‘suspect’ samples
These photographs are as viewed using a high power objective of a light microscope (total magnification x 400). Note the scale on the photographs.
References and websites
There are several websites with images of pollen that may be freely downloaded. SAPS also has access to a collection of about five hundred digital images and, from early in 2005, a range of these images will be available through the SAPS website.
Osmosis 23 Autumn 2002. Using plants to solve crime. www-saps.plantsci.cam.ac.uk/osmos/os23.htm#8Randerson, J (2 March 2002) Grassed up, New Scientist, 173 (2332), p 32 .George, A (28 June 2003) Close examination, New Scientist, 178 (2401), p 54.The official site for the Forensic Science Service www.forensic.gov.uk/forensic_t/index.htmThe University of Arizona Palynology Unit www.geo.arizona.edu/palynologyThe New Zealand Government’s Institute for Forensic Services www.gns.cri.nz/services/paleo/forensic.htmlThe larger size coverslips are available from BDH.
Dr Leighton Dann, SAPS Cambridge
http://www.dar.csiro.au/airwatch/awident.html
Pollen identification
To identify the pollen grains under the microscope you will need to use four sources of information:
(i) Pollen Identification Photographs
The photos included here low-resolution images of pollen grains. The common name is on each image, its botantical name and size are given immediately below. High resolution images can be downloaded.
Pollen grains under the microscope have distinct structural characteristics. Points to note when identifying pollen types:
pollen grains stain pink, and starch granules released from pollen stains
dark red to black.
a pollen grain has one or more holes on the surface called an aperture. The
aperture releases starch granules.
grass pollen is generally identified by a single aperture, round shape, and
well defined pollen grain wall.
tree pollen has more than one aperture, some having many apertures, and
the shape of the grain can vary greatly from Family to Family.
(ii) Pollen Calendar
Pollen grains can be grouped into: Trees, Grasses, Herbs and Weeds
Refer to a Pollen Calendar for your state. This will indicate which plant types could be contributing to the airborne pollen count for that time of the year.
(iii) Your observations of the sampling location
Investigate your local trees, grasses, herbs and weeds for evidence of pollen bearing flowers (be careful not to confuse your identification with insect pollinating plant types).
Note down any obvious flowering plant types that can be identified. Collect plant samples to bring back to the laboratory. You may be able to shake pollen from the plant specimen onto a glass slide and view it under the microscope. This will help to identify pollen on your filter paper.
(iv) ACTIVITY: Making a pollen reference slide
Aim:
To collect flower samples of wind pollinating plants in your local area To prepare a reference pollen slide from the local wind pollinating plants To identify pollen on the prepared slide.
Method:
1. Refer to the Pollen Calendar (Appendix) and determine the plants contributing to the airborne pollen in your area, eg. grasses, trees, weeds.
2. Collect a small branch with flowers from a wind pollinating tree, grass or weed. 3. Leave for ~1 hour before step 4. 4. Lightly smear a glass slide with vaseline. 5. Lightly dab the flower onto the glass slide. 6. Saturate the pollen on the slide with Calberla's stain, and place a coverslip over
the sample. Observe pollen grains under the microscope.
Repeat this activity to generate reference slides of a flowering tree, grass or weed in your area.
For a clear diagram of what happens with pollen germination and syngamy when the pollen tube enters an ovule see this link and for details of how to collect and mount pollen grains see the booklet by John White [2].
My efforts at growing pollen tubes started with various pollens on sugar solution. Success didn't come until I tried Chris Thomas's method of spreading the pollen on an onion epidermis laid on a moist microslide. Even this hardly worked with our locally grown onions. However, a good big Spanish onion produced instant success with a number of pollens so that's the medium I use now. Leek epidermis is also successful and has the merit of being curved about only one axis, so easier to spread flat on a slide!
First you need a flower with ripe anthers covered in pollen. A warm dry day is helpful for this.
Where to get the epidermis? Cut the top and bottom off an onion. With a sharp knife, cut a few millimetres deep from the "North Pole" to the "South Pole" of the onion. Now make a similar cut so that the strip that you can remove is about 15 mm wide in the middle. Remove this section from the rest of the onion. Take a piece of epidermis from the inside of the section - i.e. the concave surface (scratching the edge with a finger nail or knife will get it started and then you can peel it gently with fingers) - and put it with the side that was towards the outside of the onion upwards.
Breathe on the slide to moisten it just before you lay the onion epidermis on it and then gently spread the skin to try to make a flat area about a centimetre square. Don't worry if there are a few creases elsewhere.
Stroke the chosen ripe anther(s) across this flat area and have a look under the microscope, using a low power objective, to see that you actually have some pollen grains on the onion skin. Label the slide with the name of the flower, the date and time. I use waterproof ink (overhead projector pens) direct onto the slide. Now place the slide in a sandwich box or similar in which you have put a layer of damp tissue and put the lid on to keep the air moist.
Periodically observe the slide and, if there has been any growth, sketch or photograph the shape of some of the tubes, noting the time on your picture. This will permit you to work out the rate of growth of the tubes. In some cases you will be able to see the tip of the tube moving if you observe it under high power. I have found a 40x objective good for this.
Of the pollens tried, the fraction of pollen grains that germinated varied considerably. I started this late in the year, so the variety of plants with pollen was limited. Here is a rough guide to the activity that I found but "your mileage may vary" (mine certainly does!):
poor ivy field pansy fair Penstemmon Nasturtiumgood Japanese poppy dead-nettle
.
Penstemmon (6 hours)
On the next page Chris has described his scoring system and the details to record to make your observations of interest as part of a collaborative project.
So, after reading John Garrett's excellent article, frantically raiding your larder for onions or leeks (good lateral thinking there John!) and decapitating all flowering plants in your garden you've set up your little germination experiment and are waiting for it to work! What do you do now? Well, you could consider adding any information you gain to the fount of human knowledge. I would be very interested in hearing from you about your results and if we get enough of a response, we could try publishing it.
It will take a little more care on your part. Try to provide the following information:
1. Where geographically you obtained the pollen (flower). Latitude & Longitude if possible.2. Date you conducted experiment.3. Local time of day of experiment (24 hour clock or state am or pm.).3. Name of flower from which you took pollen - Latin name and common name if
possible.4. Any additional points you thought of interest.5. Pollen germination scores for three separate experiments determined as below.
Scoring pollen germination.
Apply pollen to the surface of onion epidermis as described by John Garret within 1 hour of picking flower. It is important that the pollen is streaked on the epidermis surface that has been in contact with the flesh of the onion - see John's picture! Place in humid sealed container. Score for germination 3 hours after applying the pollen to the epidermis and transferring to a humid environment in the sealed box. View using a x10 objective (circa 100 x magnification). Pollen grains are considered germinated if the length of the pollen tube exceeds one pollen grain width. Germination is scored visually by scanning the sample and assigning to one of seven score classes as follows:
1. no germination2. 1% to 2% germination3. 3% to 10% germination4. 11% to 25% germination5. 26% to 50% germination6. 50% to 90% germination7. 91% to 100% germination
The latter method is fast, reliable and better suited than direct counting to experiments where a number of samples have to be scored at the same time or where samples are likely to dry out under prolonged observation.
Once you find a species that gives very good germination, always include a test slide with that species with any new species your testing. That way you can be sure that any results you see are real.
For photography or observation of pollen tube germination on surfaces, the slide can be covered with a coverslip to prevent drying out on the microscope stage. The light source to the microscope has to be reduced with neutral grey filters (or use a cold light source such as a white LED - JG) to prevent heating of the sample that could cause the accumulation of condensation on the coverslip.
Please send your results to me by mail, I really look forward to hearing from you!
We would never be so foolish as to pollinate a dead flower, because we can easily see that it is dead. Yet. unbeknownst, we will use dead pollen, store pollen improperly, and transport it with no idea as to what it may be subjected. All because we see pollen the same whether it be DEAD or ALIVE.
http://www.news.wisc.edu/12854Achoo! Pollen counter measures what’s making you sneeze
Sept. 6, 2006
Rose Vrtis, an associate researcher in the asthma, allergy and pulmonary research section of the School of Medicine and Public Health, replaces a pair of pollen rods in a RotoRod Sampler mounted on the rooftop of the UW Hospital and Clinics. The RotoRod Sampler drops and spins the greased pollen rods in the air for 10-second intervals every 30 minutes, night and day. Madison's only certified pollen counter, Vrtis collects and analyzes the samples every 24 hours from March-November, and then reports the regional pollen data to the National Allergy Bureau. Her findings also are used for clinical allergy studies at hospital.
Two of the more popular volumetric samplers used in this country over the past few years are the Rotorod sampler and the Volumetric Spore Trap. The Rotorod sampler uses small adhesive coated rods that intermittently spin through a certain volume of air so that the particles in that air stick to the rod. At the end of 24 hours, the particles are
identified under a microscope and the concentration of particles per cubic meter of air is calculated.
The Rotorod sampler does a good job collecting pollens and larger molds. However, smaller mold spores are not as efficiently collected resulting in low estimates for counts of certain mold spores.
Volumetric Spore Traps draw air into the sampler at a given rate. The particles in the air land on an adhesive coated microscope slide. After a period of sampling, usually one day, the sample is stained and the pollen grains and mold spores are identified and counted, and the concentrations in the air are calculated.
Regardless of the method used, the reported counts reflect the average count for the sampling period, not a real-time count determined at the time of the report. For example, a pollen count reported on Monday probably represents the average count for the 24-hour period ending at some time on Monday morning.
Because various pollen and mold counts vary over the course of the day, the average count gives us an estimate of overall exposure. At certain times during the day, the concentration of various particles could be temporarily higher.
The American Academy of Allergy Asthma and Immunology (AAAAI) organized the Aeroallergen Monitoring Network, which has compiled pollen and mold counts for more than 30 years. The network was established to further the science of allergy, and to contribute to the information available to physicians for the diagnosis and treatment of allergic disease.
The Network has reported pollen and mold spore counts to the public and the media since 1992 through the National Allergy Bureau, a service established by the AAAAI. Member stations report pollen and mold counts to the NAB which releases reports to interested media outlets and to the public through the AAAAI web site (www.aaaai.org/nab). Results are reported as total tree pollen, grass pollen, weed pollen, and mold spore counts per cubic meter with comments about their relative amounts. This information allows allergy sufferers and their physicians to correlate symptoms and causing agents.
Accurate forecasts of future counts would allow people to adjust activities on days with predicted high counts. Forecasting involves having accurate counts from previous years at the involved site and taking into account meteorological data.
Researchers involved with the network are working on such predictive models, but want to prove their reliability before making such predictions available to the public. Until reliable forecasts are available, people with symptoms will have to rely on trends in
Every year, food allergies cause about 30,000 visits to emergency rooms and an estimated 150 deaths. The culprits are known; only eight foods--milk, eggs, peanuts, tree nuts, fish, shellfish, soybeans, and wheat--cause 90% of all allergic food reactions. But why do those foods cause allergies while others don't? A study in the January 2005 Journal of Allergy and Clinical Immunology suggests that the answer may lie partly in three-dimensional protein structures that are common to many different plants that cause allergies.
Degrees of separation. In the above comparison of proteins from apples (left) and celery (right) to that from birch pollen, red areas show where surface structure has been conserved across the proteins. Given these two proteins' relative structural similarity to that of birch pollen, people allergic to birch pollen are more likely to also be allergic to apples than to celery. image: John Jenkins
Scientists once thought that any protein could potentially become an allergen. In the current study, however, using a computer program to categorize 129 common plant food allergens, structural biologist John Jenkins of the British Institute of Food Research (IFR) and colleagues found that 65% of these proteins fell into just four structural families. The study used the protein families defined by Pfam, a database of protein structures housed at the Wellcome Trust Sanger Institute in the United Kingdom.
The results suggest that certain protein structures contribute to plants' allergenicity, says coauthor Clare Mills, head of the allergy research team at IFR. The next step is finding out which structures contribute, and how they do so.
Some of these common structures may make a protein very stable, and thus hard to digest. For instance, one of the four dominant families identified in this study, the cupin family, has barrel-shaped sections (the family gets its name from cupa, a Latin word meaning "barrel"). This shape makes the proteins very stable, Mills says, adding, "If a protein is resistant to digestion, there's more of it available for the immune antibodies to attack."
The authors also analyzed surface structures in proteins that are cross-reactive. One family of proteins, the Bet v 1 homologues, showed an unusual conservation of surface
shapes across different plants. The scientists studied the family closely to learn more about that conservation and how it underlies the allergic cross-reactivity between birch pollen and plant foods such as apples and celery.
"Generally, proteins change quite a lot on their surface when you go across different species," Mills says. "But the Bet v 1 family is unusual. Although some of the amino acid residues changed [from the major birch pollen allergen Bet v 1 to the related apple allergen Mal d 1], the shape of the molecule was very much the same."
According to Mills, the degree of change in the surface of the allergenic protein appears to correlate with the degree of allergic symptoms that people experience. A Bet v 1-related allergen, Api g 1, is found in celery, but its surface shape is altered more from Bet v 1 than that of the apple allergen. Similarly, people with birch pollen allergy can have cross-reactions to celery, but less often than they do to apples.
Mills and colleagues are conducting similar bioinformatics analysis of proteins in pollen and food allergens of animal origin to find out if these also show structural similarities. Although Mills says "it's not a focus of our research to come up with an in silico method of looking for allergens," she does say that categorizing proteins into structural families may also help in evaluating the potential allergenicity of proteins found in genetically modified foods. Many people are concerned that these engineered foods may introduce novel proteins that humans are unable to digest.
Stephen Howell, director of the Plant Sciences Institute at Iowa State University, agrees that the study suggests an additional parameter to be considered in evaluating novel proteins for allergenicity. Although new proteins introduced by genetic engineering are already tested extensively, he says that more knowledge can only help inform and improve that testing.
Richard Goodman, a research professor of food science and technology at the University of Nebraska-Lincoln, says that, in addition to bioinformatics tools, researchers may also need to use nuclear magnetic resonance spectroscopy or crystallography to examine tiny differences in surface structure to fully understand protein structures' role in allergenicity. Allergy is a complicated condition that depends on the amount of allergen present in a food, how often a person has been exposed to it, how many immune cells react to the allergen, and how strongly the cells react. "But," Goodman says, "this study does indicate that there might be more predictability to this than once thought."
Angela Spivey
http://www.unifiedworlds.com/cornet/Why02/why.htm
When Did Angiosperms First Evolve?
by Bruce Cornet, Ph.D.
PREFACE
The article you are about to read contains many technical terms and concepts used
Figure 2. The pollen tube as a model system for cell polarity studies. A. In vitro-cultured pollen tubes show uniformly cylindrically-shaped cells. B. Schematics showing polar distribution of the cytoplasm in pollen tubes. Note the apex contains dynamic F-actin and Golgi vesicles.
http://www.edor.se/
We manufacture pollen isolations for plant breeders
great images of coconut pollinationAppendix 5. Equipment and materials needed in pollen collection, pollen processing and pollinationTRAINERS COURSE ON STANDARDIZED COCONUTBREEDING TECHNIQUES(Finalizing & Pre-testing of STANTECH Manual)BALITKA, Coconut Research InstituteManado, INDONESIASeptember 19 - 29,1995 (2)
See also: http://www.bioversityinternational.org/publications/Web_version/108/ch09.htm#TopOfPage
Manual on Standardized Research Techniques in Coconut Breeding
Table of Contents
edited by G.A. Santos, P.A. Batugal, A. Othman, L. Baudouin and J.P. Labouisse
Modified with permission from Global Climates - Past, Present, and Future, S. Henderson, S. Holman, and L. Mortensen (Eds.). EPA Report No. EPA/600/R-93/126, U.S. Environmental Protection Agency, Office of Research and Development, Washington, DC. 25 - 38.
THE POLLEN PATH Monday March 08th 2004, 11:13 am Filed under: Points of Art, Im.Perfect
“Oh, beauty before me, beauty behind me, beauty to the right of me, beauty to the left of me, beauty above me, beauty below me, I’m on the pollen path”Navaho saying
David Sylvian Pollen path Lyrics from the album Dead Bees on a Cake
welcome me father on the North shores of Laplandwelcome me father who knows no namewelcome me mother the earth here is yawning
POLLEN TRACKERFeb 15, 2002 12:00 PM, by Rhonda J. Brooks
Bob Dylan's “Blowin' in the Wind” was a huge hit for folk singers Peter, Paul and Mary in the 1960s. Forty years later, that refrain has an altogether different meaning for corn production.
Using a computer-based software program, researchers at Iowa State University (ISU) are combining hybrid information, field design and local weather conditions, especially wind, to predict the genetic purity of hybrid seed corn. The computer-based program enables researchers to determine how much pollen is produced by a field of corn, when it is produced, where it goes and what happens to it when it's distributed to a neighboring field, explains Mark Westgate, an ISU crop physiologist. His work focuses on corn and soybean reproduction.Knowing the level of genetic purity within a field of corn long before harvest will give farmers time, and therefore flexibility, in determining how to market their crops.“Say your contract is for GMO [genetically modified organism]-free seed, and you find there was considerable risk of out-crossing during pollination. Then you have time to decide where to sell that crop, perhaps for animal feed,” Westgate says. “Keeping hybrids pure is increasingly a challenge. The model helps us assess the risk of pollination in a field of corn from foreign pollen.”
Not ready for growersWestgate says no decision has been made at this point on how to market the PC-based software program to the corn industry. He says the investment to corn growers could range between no cost, if the program were made available via the Internet, to as much as $500, a price typical these days for a software package.Westgate says that although the computer-based model is not ready for commercial use, it is working effectively in university research projects. “We are ground-truthing the model now across various corn production management practices and field conditions to ensure it stands up to real-life conditions,” he says. He adds that through the use of the model, this is the first time corn researchers have been able to couple the biology of plant flowering with the physics of pollen movement.
Preventing out-crossingHistorically, corn growers and seed companies have employed isolation methods to prevent out-crossing by foreign pollen in their corn crops and hybrid seed production fields. With the increased use of GMOs, however, the need to prevent out-crossing has increased.“We do need to better understand how pollen moves,” says David Dornbos, global head of production research for Syngenta. “Purity standards are becoming more stringent, and we want to ensure that farmers get the quality of seed they need and expect.”Dornbos says the ISU corn pollen dispersal program offers seed companies several potential benefits. It can help companies make more informed decisions about the spatial isolation requirements of cornfields for seed production as well as how
effective the use of male border rows are in preventing out-crossing. He says the same factors that benefit seed companies will, in turn, benefit corn growers. “It's simply a function of scale,” he says. “The same theories and information should apply to farmers.”Westgate agrees. He says the program will help farmers determine how to manage specific hybrids and specific fields more effectively during the next growing season. “By knowing my risks, I can better determine whether I might need more border rows or a windbreak on one side of the field to keep that particular corn hybrid pure,” he says.
GMO-free cropsThe issue of genetic purity was underscored during the American Seed Trade Association (ASTA) annual meeting this past December. During that event, Joe Burris, a consultant to U.S.-based seed companies, shared highlights from a two-year, interindustry study he conducted on their behalf. He says the study was conducted to help companies establish their risk level for out-crosses in seed production fields and determine how to improve current purity standards.Burris has developed a brochure for growers that outlines guidelines for producing non-GM corn and soybeans. The guidelines address factors such as field and seed selection, isolation strategies, harvest and storage needs, and record keeping. To receive the brochure, e-mail Burris at [email protected] or call him at 515/232-8290. Additional information about genetic purity and GMOs, in general, also is available under “new technologies” at ASTA's Web site, www.amseed.com.
Pollen production
Westgate says that in addition to helping researchers determine genetic purity, the pollen dispersal program also helps them better understand pollen production and the role it plays in kernel formation and yield.“When farmers planted for 24,000 to 26,000
exine--and the stigma cell occurs. After binding, the stigma cell causes the pollen grain
to absorb water, enabling it to send a pollen tube down through the female tissue to the
flower's ovary. Sperm carried inside the pollen grain makes its way down the tube and
fertilizes eggs within the ovary.
Until now, scientists knew very little about how the right pollen stuck to the right stigma
while pollen from other species falls off.
To test the force of adhesion between pollen and stigma cells, Zinkl and Preuss teamed
up with Grier and undergraduate student Ben Zwiebel created a novel tool to measure
the strength of the pollen-stigma bond designed using the same principles as an atomic
force microscope.
To test the force of adhesion between pollen and stigma cells, Zinkl and Preuss teamed
up with Grier and undergraduate student Ben Zwiebel to create a novel tool to measure
the strength of the pollen-stigma bond designed using the same principles as an atomic
force microscope.
The researchers attached a pollen grain to the end of a fine glass fiber that acted like a
simple spring. A stigma mounted on a retractable stage was brought into contact with
the pollen grain. After binding occurred, the stage was retracted until the adhesion
between the grain and the stigma was broken. The distance the stage traveled is
proportional to the strength of the interaction.
The researchers found that the adhesion between pollen and stigma of the same
species was unexpectedly strong, perhaps helping pollen borne by high winds to tightly
bind to flowers of their species. "The force was strong enough that you could use it to
suspend a 100 kg object from an area the size of a dinner plate coated with this
adhesive," says Preuss.
Zinkl and Preuss also showed that adhesion between pollen and stigma does not rely on
the outer pollen coating, but instead on the exine--a stable polymer made up of fatty
acids and phenolics. Using pollen grains lacking a pollen coating due to genetic
mutation, Preuss and Zinkl showed that these grains retained the ability to bind to same-
species stigmas.
"This indicates that the binding factors for the pollen grain reside within the exine itself,
or even the cell wall of the pollen grain, which was once thought to be inactive in the
binding process," says Preuss.
The University of Chicago Medical Center Office of Medical Center Communications 850 E. 58th Street, Room 106, MC6063
Chicago, IL 60637 Phone (773) 702-6241 Fax (773) 702-3171
http://www.uq.edu.au/news/index.html?article=858
Botany researchers help police solve drug crimes
http://www.phy.davidson.edu/brownian.html
Consider the Brownian motion animation appearing on this page. Click either link below to start the animation.
Brown Einstein
In 1827 botanist Robert Brown noticed that grains of pollen suspended in a liquid moved erratically. This motion is called Brownian motion. In 1905 Einstein explained this motion by creating a mental picture or thought experiment (also called a Gedanken experiment) that involves the invisible molecules in the liquid crashing into the larger pollen molecules.
But how can you visualize this erratic behavior and understand its cause? Since we cannot see the individual molecules that make up a liquid or air, it is hard to do an experiment or to draw a satisfying picture. We can, however, simulate the effect of smaller particles on a larger particle by using a Physlet. The two animations differ in that for Brown's discovery the particles are invisible and for Einstein's explanation the particles are visible. The Einstein animation allows us to see exactly what Einstein "saw" in his mental model and what Brown was missing.
We can also represent the motion of objects by graphing. An example of this visualization is shown below. The graphs depict the position of the particle (x,y) as a function of time and show exactly how erratic the motion of the large particle really is.
Using a high-speed camera, researchers have documented what may be the quickest-acting plant ever seen: the bunchberry dogwood slinging pollen into the air.
Bunchberry dogwood carpets forest floors in Canada and northern parts of the United States.
Robert H. Mohlenbrock. USDA-NRCS PLANTS Database/USDA NRCS. 1995. Northeast wetland flora: Field office guide to plant species. Northeast National Technical Center, Chester, PA.
A bunchberry dogwood (Cornus canadensis) has flowers that look like those of the flowering dogwood tree, but the plant itself stands only about knee high. Its tiny flowers, measuring just a few millimeters across, are cradled in clusters of four white leaflets that many people mistake for petals.
Williams College biologist Joan Edwards was inspired to study how the plant releases pollen by one of her students. While examining the flowers, the student had noticed that something suddenly "poofed." Edwards wanted to find out what was going on.
To investigate the phenomenon, she and her coworkers used a video camera that takes 1,000 pictures every second. But the images came out blurry because the camera was too slow to capture what was happening.
Next, the scientists used a superfast camera that shoots 10,000 frames per second. This time, the film showed exactly what happens when a bunchberry dogwood goes poof.
Bunchberry dogwood buds open in less than half a millisecond and fling pollen upward. That's the fastest plant motion on record. The scale bar on the left is 0.04 inch (1 millimeter).
D. Whitaker, M. Laskowski, A. Acosta, J. Edwards
The tiny flower's petals are highly elastic. The petals flip backward and release springy filaments. The filaments act like miniature versions of an ancient catapult known as a trebuchet. They snap upward, causing pollen to spray from containers hinged to the filaments.
The mechanism unfolds so fast that the pollen experiences 800 times more gravitational force than an astronaut does in a space shuttle during launch. No known plant, not even the snapping Venus flytrap, comes close to that kind of speed.—E. Sohn
Going Deeper:
Milius, Susan. 2005. World's fastest plant explodes with pollen. Science News 167(June 11):381. Available at http://www.sciencenews.org/articles/20050611/note12.asp .
Videos showing a bunchberry dogwood flower shooting out pollen can be seen at www.oberlin.edu/news-info/05may/expflower.html (Oberlin College).
Learn more about the bunchberry dogwood at plants.usda.gov/cgi_bin/topics.cgi?earl=plant_profile.cgi&symbol=COCA13 (U.S. Department of Agriculture).
Young Albert E. and the Miracle Year By James Riordon
Listen my friends, and shortly you'll hearWhy 1905 was a miracle yearFor that was the time that a young patent clerkBy the name Albert Einstein did incredible work.
Now this is a story that comes in three partsAnd the beginning, of course, is the best place to start.But how it begins, I confess I don't knowSo I made up a lie, and here's how it goes.
One day Al was walking and stopped to look downAt a puddle that spread in his way on the groundAs he studied the muck and the mud, Albert foundThat his mind wandered back to the motion of Brown.
A small bit of dust or pollen or fluffWould dance in the water, if 'twas tiny enough.Some thought that the motions were signs of lifeBut old Reverend Brown had proved that's not right.
"The way the dust jiggles and wiggles and writhes,"Al said, "it's no wonder some think it's alive."He sat and he pondered and grasped for some notion,What could possibly lead to this Brownian motion?
Well, he thought and he thought and he thought a bit more,He thought 'til the thoughts made his thinking parts sore.And with a little statistics and persistence galore,He thought of an answer not thought of before.
"It's molecules," cried Albert, "too small to seeThat are bumping the bits, that's what it must be.And if water has molecules then so has that treeAnd this rock and that bird, and yes, you and me!"
Well molecules and atoms at last were confirmed,And solid state texts were rewritten or burned.'Twas a wondrous discovery, though not without peer,And it's hardly enough for a miracle year.
Now photons, like atoms, were once speculation,Since light comes in waves with well known undulations.But when light fell on metals and started a current,Though the theories were clear, the experiments weren't.
Turn up the brightness and more electrons emerge,While it's the color of light makes their energy surge.How could this be? Albert knew it was wrongIf light was a wave as we'd thought all along.
He thought and he thought and he thought a bit more,He thought 'til the thoughts made his thinking parts sore.With a little deduction and persistence galore,He thought of an answer not thought of before.
Light is sometimes a wave, that much is true,But at other times it's a particle too.And the same goes for atoms and marbles and pigs-It just hard to tell when things get too big.
'Twas a wondrous discovery, and now he was near.Yes, it's almost enough for a miracle year.
One day he was dreaming and thought if he mightTravel as fast as his photons of light.What strange things would happen, what wonders there'd beIf he could approach the speed of light: c.
He thought and he thought and he thought a bit more,He thought 'til the thoughts made his thinking parts sore.
With a little deduction and persistence galore,He thought of an answer, not thought of before.
Now light speed is constant, experiment showed,If you move quickly or move very slow.But if light speed is constant, it's time that must change.The answer's the answer no matter how strange.
This one little notion, while modest enough,Led to a whole bunch of powerful stuff.From time dilation to lengths that contractTo the source of the sunshine and cloud chamber tracks.
And perhaps Al's most famous discovery of allIs the simple equation that most folks recall.E=mc^2 made the fact plainThat energy and matter are one and the same.
And now there you have it, the case is quite clear
Why 1905 was a miracle year.For in five famous papers and less than twelve monthsEinstein came up with some fabulous stuff.
http://www.physorg.com/news94970468.html
Pollen Can Hinder Lifting FingerprintsBy ERRIN HAINES, Associated Press Writer
All the pollen-covered cars in the South may be an eyesore to drivers, but the yellow dust might be a bandit\'s best friend. Pollen can make it difficult for crime scene investigators to lift fingerprints from outdoor surfaces, since the dust absorbs the moisture people normally leave behind. (AP GRAPHIC)
(AP) -- All the pollen-covered cars in the South may be an eyesore to drivers, but the yellow dust might be a bandit's best friend. Pollen can make it difficult for crime scene investigators to lift fingerprints from outdoor surfaces, since the dust absorbs the moisture people normally leave behind.
http://www.geo.arizona.edu/palynology/sit_mnt2.html = good list of sites
Find out more: the Texas Essential Knowledge and Skills (TEKS) Virtual Field Trip site. This TEKS program provides curriculum support museums and education centers of Texas through internet links, including 65 virtual field trips, in particular the Virtual Apiary, made with the help of palynologists Gretchen Jones and V.M. Bryant, Jr. Palynologists should see the pages of stunning plant pictures and pollen grains for several Texas regions.
Welcome to Pollinator Paradise Where bees and flowers cooperate for mutual benefit
The alfalfa leafcutting bee, Megachile rotundata.photo by Karen Strickler
NEW! A bee identification exercise to try with master gardeners, kids and other groups.
2007 Orchard bee cocoons (mostly Osmia lignaria) for sale for the 2008 season. Click for details.
We have easy to clean BINDERBOARD® nesting systems. Click to Learn more.A Pictorial Guide to Orchard Bee ManagementNew! Follow the growth of my summer squash patch and market garden:http://squashblossomdiary.blogspot.com/ New! Read about our 2006 Summer Squash Research Project:Harvest Frequency, Yield, and Economics of Summer Squash
Should bee species be moved across country or between countries? Read about the issues : "For Nonnative Crops, Whence Pollinators of the future?"
What is pollination? Some definitions.Is it a bee? The Logan bee lab helps you distinguish bees from other similar insects.
Plant and soil evidence can provide clues to what happened in the past. You may want to examine this pollen slide, which comes from a sample taken from the bottom of a bog in a farming area outside of Copán.
This slide is of mahogany pollen, dating to around A.D. 1200-1250. It shows that the Copán Valley had largely returned to forest by that time. Before A.D. 1200-1250, there is little evidence of mahogany pollen in the sample. Mahogany pollen would be present in areas of tall forest, but not in areas of heavy farming.
Aerodynamic Features of Saccate Pollen: Evolutionary Implications for Wind-pollinated Plants
Project DescriptionThe pollen grains of many wind-pollinated plants contain one to three air-filled bladders, or sacci. Sacci are thought to increase surface area, yet add minimal weight, thereby increasing dispersal distance. However, no studies have tested this hypothesis. Using scanning electron and transmission electron microscopy and mathematical modeling, a model is being developed to investigate pollen flight. Saccate pollen grains of three extant conifers (Pinus, Falcatifolium, Dacrydium) are being used to create the model. Examples of structural characters analyzed include: lengths, widths, and depths of the main body and sacci; angle of saccus rotation; thicknesses of the saccus wall, endoreticulations, intine, and exine; and surface ornamentation. The model uses these data to calculate terminal settling velocity. Settling speeds have been validated by stroboscopic photography of pine pollen, and modeling pollen both with and without sacci indicates that sacci can increase dispersal distance. The model affords the opportunity to study pollen flight in three dimensions while controlling factors such as the temperature and wind speed. The advantage of a mathematical model that is based on structural characters is that flight properties can be measured without having to physically test pollen, which provides the opportunity to model flight dynamics of fossil pollen.
Faculty Mentors← Dr. Jeffrey Osborn ← Dr. Scott Thatcher
The Weeds of ChangeWRITTEN BY AMY BRAVERMANPHOTOGRAPHY BY DAN DRY
By focusing her research on a simple mustard plant, geneticist Daphne Preuss is helping to speed crop improvement—and possibly making some medical breakthroughs.
What if there were an adhesive stronger than any glue that stuck only to a specific matching element?
http://owenmundy.com/work/anemophilous_formula/animation of pollen calendar
http://www.artgallery.nsw.gov.au/whats_on?eventid=1814art = pollen from pine 1999
http://books.google.com/books?id=f6N7XL37KTMC&pg=PA33&lpg=PA33&dq=pollen+art&source=web&ots=g04FVnZh5g&sig=nLOovtTddSkvwHY0DvSlXxKccOw&hl=en#PPA35,M1Biophotonics: visions for better health care By Jürgen Popp, Marion Strehle
Search for Specific PlantsEnter a full or partial species name to find more information on one of over 1200 potentially allergenic plants. For example, you can find chenopods searching on "cheno" (no quotes) as Latin Name. Search By Name:
Common Name
Latin Name
Search By Alphabet:A B C D E F G H I J K L M N O P Q R S T U V W X Y Z
Search By LocationSearch By Entering Your Zip Code:
Click on your state to find the allergy-producingplants that are located in your area.
The map contains current allergy conditions as reported on Pollen.com
Increased Competition for Pollen May Lead to Plant ExtinctionsARCHIVE :: Thursday, January 19, 2006 <<<<<< :: infoZine Staff
Loss of birds, bees and other pollinators places plants at risk
Washington, D.C. - infoZine - The decline of birds, bees and other pollinators in the world's most diverse ecosystems may be putting plants in those areas at risk, according to new research. The finding raises concern that more may have to be done to protect Earth's most biologically rich areas, scientists say in an article appearing in the Jan. 17 issue of the Proceedings of the National Academy of Sciences (PNAS).
The analysis shows that ecosystems with the largest number of different species, including the jungles of South America and Southeast Asia and the rich shrubland of South Africa, have bigger deficits in pollination compared to the less-diverse ecosystems of North America, Europe and Australia.
"The global pattern we observed suggests that plants in species-rich regions exhibit a greater reduction in fruit production due to insufficient pollination than plant species in regions of lower biodiversity," said Susan Mazer, a co-author of the article and a biologist at the University of California, Santa Barbara. She and her colleagues believe such biodiversity "hotspots" are characterized by stronger competition among plant species for pollinators, such that many plant species simply don't receive enough pollen to achieve maximum fruit and seed production.
"Many plants rely on insects and other pollen vectors to reproduce," said Jana Vamosi, an evolutionary biologist at the University of Calgary and co-author of the paper. "We've found that in areas where there is a lot of competition between individuals and between species, many plants aren't getting enough pollen to successfully reproduce. If plants
can't survive, neither can animals. These biodiversity hotspots are important because they are where we most often find new sources of drugs and other important substances. They are also the areas where habitat is being destroyed the fastest."
The study analyzes 482 field experiments on 241 flowering plant species conducted since 1981. The research took several years to complete; all continents except Antarctica are represented.
The analysis, which was sponsored by the researchers affiliated with the National Center for Ecological Analysis and Synthesis (NCEAS) at the UC-Santa Barbara, and was funded by the National Science Foundation (NSF), "can tell us things about ecological processes hat individual studies can't," Mazer said, noting that the synthesis could not have been done 25 years ago because few careful field studies of this type had been conducted. "Our detection of global patterns required the simultaneous analysis of many studies conducted independently by plant ecologists all over the world," she said.
Mazer cautioned that it is not yet possible to determine whether low pollenation observed in species-rich areas is a new phenomenon or a long-standing one. It may be a recent problem due to habitat fragmentation or destruction, she said, or it may be long term. Plant species in ecologically complex areas may be continually faced with new competitors, and therefore cannot evolve as rapidly as their environment changes. If that is true, she said, pollen limitation may be a chronic problem for species in biodiversity hotspots--a challenge they have coped with for millions of years.
"The pattern raises the alarm, however, that these species face two challenges that increase the risk of extinction: habitat destruction, which is occurring at alarming rates in the tropics, and reduced pollinator activity," said Mazer.
In addition to Vamosi and Mazer, authors include Tiffany Knight at Washington University; Tia-Lynn Ashman and Janette Steets at the University of Pittsburgh; and Martin Burd at Monash University in Melbourne, Australia.
What is Palynology, and Why is it Important? For people with hay fever and allergies, pollen is something to be avoided whenever possible, but to palynologists, pollen is a treasure chest full of information.
An analysis of pollen from the Walden core sample, for example, reveals changes in the composition of the forests of the region and even pinpoints in time the advent of settlement by Europeans.
"A rise in ragweed pollen in the sediment is the time marker of European settlement at Walden Pond," says Winkler. "It increases along with grass and as tree pollen decreases, indicating the clearing of land for homes and farms and the demand for wood for heating and building."
http://www.aip.org/history/climate/climogy.htmClimatology as a Profession
http://www.aip.org/history/climate/summary.htm The Discovery of Global Warming Spencer Weart
June 2007 [ HOME ] Table of Contents for printer
Introduction:A Hyperlinked History of Climate Change Science
http://www.ucmp.berkeley.edu/fosrec/ONeill.html
USING MICROFOSSILSIN PETROLEUM EXPLORATION
BRIAN J. O'NEILLWHEN I meet new people and they find out that I'm a paleontologist working for an oil company, the second question they ask (after "What is a paleontologist?") is usually "Why would an oil company hire one?"
Additionally, the organic chemicals which comprise palynomorphs get darker with increased heat. Because of this color change they can be used to assess the temperature to which a rock sequence was heated during burial. This is useful in predicting whether oil or gas may have formed in the area under study, because it is h eat from burial in the Earth that makes oil and gas from original organic rich deposits.
http://www.ucmp.berkeley.edu/fosrec/Matrix.html
National Science Standards Matrix
Name of Activity
Suggested Grade
LevelContent Standards
OtherContentK-4 5-8 9-
12 A B C D E F G H
Building a Topo Model MathClimate Analysis Using Forams MathDetermining Ages Of Rocks... MathDino FactsDinosaur Body StructureDinosaur Names Eng/Art FindasaurusFossilization and Adaptation Eng/Art Inferring Ancient Environments Math/GeogInterpreting Paleoenvironments Math/GeogIsland Biogegraphy Math/GeogModel Of Sea Floor SpreadingMonster Math MathPaleo Cookie Dig MathRound RocksSequencing Time — What Came 1st?Submarine MountainsTennis Shoe Detectives Eng Tracking Global Climate Change Math/GeogTwo Kinds Of DinosaursWhere Can I See the SeaWho's On First?KEY:
Content Standards A = Unifying Concepts and ProcessesB = Science as InquiryC = Physical ScienceD = Life ScienceE = Earth and Space ScienceF = Science and TechnologyG = Science in Personal and Social PerspectivesH = History and Nature of Science
= Major Emphasis In Content= Minor Emphasis In Content
http://www.ucmp.berkeley.edu/fosrec/Stucky.html
MAKING PALEONTOLOGY RELEVANT
Paleontology is highly relevant to the modern and future world. We can learn how climate change has effected past organisms as well as how organisms have changed the physical world. We can also better understand the principles of extinction, evolutionary change, and biodiversity. Understanding, for example, the effects of global warming in the past can at least provide students with knowledge of its impacts on life. Knowing how climate change affects life can lead to understanding potential changes in future ecosystems and changes that will effect human land-use. Similarly, students can imagine how changes in human land-use and exponential population growth might result in the same effects we see in the fossil record due to physical environmental change. This is crucial because human society as a whole and many of its political leaders have not come to grips with the demographics of exponential population growth, consequent urbanization and loss of habitats that many perceive will dramatically change the course of life on earth. Paleontology can provide us with an understanding of the depth of history for millions of years and an ethic that includes at its core a long-term stewardship for planetary wellness.
Paleontology can be the rosetta stone for helping students understand the importance of science, how science is done, and how all of the sciences tie together. By incorporating novel activities and studies that are tied to both state and federal standards for science literacy, we can take advantage of student's interest in fossils to give them models for understanding how the world works and at the same time better prepare them for future decisions that will shape their lives and their world.
PalynologyArticle: pp. 111–119 | Abstract | PDF (709K)
COLLECTING POLLEN AND SPORE SAMPLES FROM HERBARIA
DAVID M. JARZEN and SUSAN A. JARZEN
Paleobotany and Palynology Laboratory Florida Museum of Natural History University of Florida Gainesville, Florida 32611-7800, U.S.A. e-mail: [email protected]; [email protected]
A properly documented pollen and spore reference collection is a valuable tool in systematic/taxonomic studies, paleoenvironmental reconstruction, forensic palynology, archaeology, aerobiology and other areas of research. The collection of pollen or spore samples is best made from vouchered herbarium specimens that have been identified by trained systematists. The collection procedure, although simple, requires careful attention to each specimen so that the material collected contains mature pollen or spores, that the relevant, associated data are recorded and that the herbarium specimen is not damaged during the collection procedure.
PalynologyArticle: pp. 175–227 | Abstract | PDF (3.32M)
ATLAS OF POLLEN AND SPORES OF THE FLORIDA EVERGLADES
DEBRA A. WILLARDA, CHRISTOPHER E. BERNHARDTA, (deceased) LISA WEIMERA, SHERRI R. COOPERB, DESIRÉ GAMEZC, and JENNIFER JENSEND
A. U.S. Geological Survey, 12201 Sunrise Valley Drive, 926A National Center, Reston, Virginia 20192, U.S.A., E-mail: [email protected]; E-mail: [email protected], B. Department of Biology, Bryn Athyn College, P.O. Box 717, Bryn Athyn, Pennsylvania 19009-0717, U.S.A., E-mail: [email protected], C. Department of Geotechnical Engineering and Geosciences, Technical University of Catalonia, Barcelona 08034, Spain, E-mail: [email protected], D. Minnesota Pollution Control Agency, 525 Lake Avenue South, Suite 400, Duluth, Minnesota 55802, U.S.A
An illustrated, descriptive atlas of pollen and spores from wetland plants of the Florida Everglades was compiled to facilitate identification of dispersed palynomorphs in sediments. The atlas includes 121 wetland species characteristic of eleven plant associations of the Florida Everglades including sloughs, sawgrass marshes, tree islands, wet prairies, cypress domes, mangrove forests, salt marshes, sawgrass ridges, beach/dune communities, pine flatwoods/dry prairies, and disturbed/developed sites. We include light micrographs and detailed descriptions of 121 species, 110 genera, and 63 families.
Why the Weather?
Daily public service announcements regarding weather facts, phenomena and proverbs provided for the Science Service beginning in May 1923.
http://docs.lib.noaa.gov/rescue/whytheweather/1930/19300505.pdfPollen In The Air, C. Fitzhugh Talman, May 5, 1930http://docs.lib.noaa.gov/rescue/whytheweather/1932/19320811.pdfHigh Air Pollen, C. Fitzhugh Talman, August 11, 1932http://docs.lib.noaa.gov/rescue/whytheweather/1934/19341027.pdfPollen In Dust Storms, C. Fitzhugh Talman, October 27, 1934http://docs.lib.noaa.gov/rescue/whytheweather/1931/19310718.pdfRagweed Pollen, C. Fitzhugh Talman, July 18, 1931
WARM CLIMATE IN THE LATE MIOCENE OF THE SOUTH COAST OF ALASKA AND THE OCCURRENCE OF PODOCARPACEAE POLLEN
Linda M. Reinink-SmithA and Estella B. LeopoldB
A. Department of Space and Earth Sciences University of Washington, Box 351310 Seattle, Washington 98195 U.S.A. E-mail: [email protected], B. Department of Biology/Quaternary Research Center University of Washington, Box 351800 Seattle, Washington 98195 U.S.A. E-mail: [email protected] Options:
Create Reference Email this Article
Search CrossRef for: Articles Citing This Article
Search Google Scholar for: Linda M. Reinink-Smith Estella B. Leopold
A study of the Homerian type section in the upper Beluga Formation (Upper Miocene) of the Kenai Group of southern Alaska has yielded two surprising discoveries: (1) warmth-loving taxa and (2) the presence in Alaska of a ‘new’ gymnosperm family, Podocarpaceae. A well-preserved pollen and spore flora is present in Upper Miocene coal beds of the Kenai lowland, near Homer, Alaska. Stump horizons, abundant wood fragments, wood grain, and amber within the coal attest to a forested swamp. Pollen assemblages from the Homerian type section include elements of both Mixed Northern Hardwood and warm-temperate Mesophytic forests and are far richer than the flora previously defining the Homerian type section, which had suggested a less diverse, cooler assemblage. Within the Homerian type section, the flora exhibits no definite taxonomic chronology; in general, Alnus dominates, with up to 45% of the total counts, followed by Pinaceae and Taxodiaceae pollen types (30 to 35%) and thermophiles (c. 14%). At least 36 genera are represented, including Carya type, Corylus, Ilex, Juglans, Myrica, Ostrya/Carpinus, Pterocarya, Quercus/Quercus-type, and Ulmus/Zelkova, eight dicot genera have not previously been reported from the type Homerian. Presence of these hardwoods in moderate to minor amounts suggests that the climate during the Homerian (Late Miocene) was only slightly cooler than that of the Seldovian (Early to Middle Miocene).
Unexpectedly, Dacrydium and Podocarpus are present as minor elements in most of the samples. They apparently coexisted with the other Miocene taxa, because the pre-Paleogene Kenai–Chugach terrane to the southeast, which supplied sediments to the Kenai Group, is mostly of oceanic plate provenance and is unlikely to have been the source of the pollen. A uniform orange fluorescence of all the pollen, including the podocarps and any potentially reworked pollen, also suggests a contemporaneous origin for all the taxa.
The flora from the Homerian type section may precede or coincide with uplift of the Alaska Range to the north. Thus, further comparison with Homerian taxa at localities north and south of the Alaska Range will be important as it may reveal a possible rain shadow effect.
Exploring Career ChoicesNovember 19th, 2007 by Steve Pavlina
Yesterday Erin and the kids and I went to see Bee Movie. (This paragraph may contain a spoiler or two, so skip it if you don’t want to know the details of the film.) In the movie the main character, voiced by Jerry Seinfeld, has to choose a job for himself, one he’ll keep for the rest of his life. He’s overwhelmed by the decision, so he procrastinates. Eventually he goes on a ride-along with the “pollen jockeys” to fly outside the hive for the first time, which leads to a winding exploration of the outside world. This exposes him to new ideas, and he does what no bee has done before. At the end of the movie, his final
career choice seems to be ”animal attorney,” but he also appears to have the freedom to continue flying with the pollen jockeys.
I thought Bee Movie’s cheesy humor needed some work, but I liked the message: If you don’t like the career choices in front of you, don’t decide. Go outside and explore, and let your intuition guide you.
What many people don’t realize, however, is that this exploration never ends. Exploring is an integral part of any fulfilling career, not merely something you do before making the choice. No career choice is final.