Page 1
[email protected] – University of Geneva – KEYSTONE Summer School – © July 2015 - 1
Curse of Dimensionality and
Big Data
Stephane Marchand-Maillet Viper group
University of Geneva Switzerland
Page 2
[email protected] – University of Geneva – KEYSTONE Summer School – © July 2015 - 2
• Are you familiar with vector spaces? – Dimension, projection
• Are you familiar with statistics? – Mean, variance, Gaussian distribution
• Are you familiar with linear algebra? – Matrix, inner product
• Are you familiar with indexing? – Principle, methods
• Do you realise all the above is one and the same
thing? – That’s what we’ll see – I hope it will not be just trivial…
Quick get-to-know (profiling )
Page 3
[email protected] – University of Geneva – KEYSTONE Summer School – © July 2015 - 3
• To provide you with an overview of
– Basics of data modelling
– Potential issues with high-dimensional data
– Large-scale indexing techniques
• To create bridges between basic techniques
– For better intuition
– To understand what is the information we manipulate
– To understand what approximations are made
• To start you on doing your own data modelling
Objectives of the tutorial
Page 4
[email protected] – University of Geneva – KEYSTONE Summer School – © July 2015 - 4
Outline
• Motivation and context
• Large-scale high-dimensional data
• Fighting the dimensionality
• Fighting large-scale volumes
4
Note: Several illustrations from within these slides have been borrowed from the Web, including Wikipedia or teaching material. Please do not reproduce without permission from the respective authors. When in doubt, don't.
Page 5
[email protected] – University of Geneva – KEYSTONE Summer School – © July 2015 - 5
Data Production
• Growth of Data – 1,250B GB (=1.2EB) of data generated in
2010.
– Data generation growing at a rate of 58% per year • Baraniuk, R., “More is Less: Signal Processing and the
Data Deluge”, Science, V331, 2011.
1 exabyte (EB) = 1,073,741,824 gigabytes
0
2000
4000
6000
8000
10000
2010 2011 2012 2013 2014
Dat
a Si
ze (
EB)
Data Generation Growth
http://www.intel.com/content/www/us/en/communicati
ons/internet-minute-infographic.html
http://www.ritholtz.com/blog/2011/12/financial-industry-
interconnectedness/
Internet
Scientific
Industry
Data
By Sverre Jarp, By Felix'Schürmann
© Copyright attached
Page 6
[email protected] – University of Geneva – KEYSTONE Summer School – © July 2015 - 6
A digital world
© Copyright attached
Page 7
[email protected] – University of Geneva – KEYSTONE Summer School – © July 2015 - 7
[Picture from: http://www.intel.com/content/www/us/en/communications/internet-minute-infographic.html]
Data communication
© Copyright attached
Page 8
[email protected] – University of Geneva – KEYSTONE Summer School – © July 2015 - 8
User “productivity”
[Picture from: http://www.go-gulf.com/wp-content/themes/go-gulf/blog/online-time.jpg - Feb 2012]
© Copyright attached
Page 9
[email protected] – University of Geneva – KEYSTONE Summer School – © July 2015 - 9
Motivation • Decision making requires informed
choices
• The information is often not easy to manage and access
• The information is often overwhelming – « Big Data » trend
We need to bring a structure to the raw data
• Document (data) representation
• Similarity measurements
• Further analysis: mining, retrieval, learning
© Copyright attached
Page 10
[email protected] – University of Geneva – KEYSTONE Summer School – © July 2015 - 10
Information management process
Raw documents
Representation space (visualisation)
Document features
User interaction
Feature extraction
“Appropriate” mapping
“Decision” process
Page 11
[email protected] – University of Geneva – KEYSTONE Summer School – © July 2015 - 11
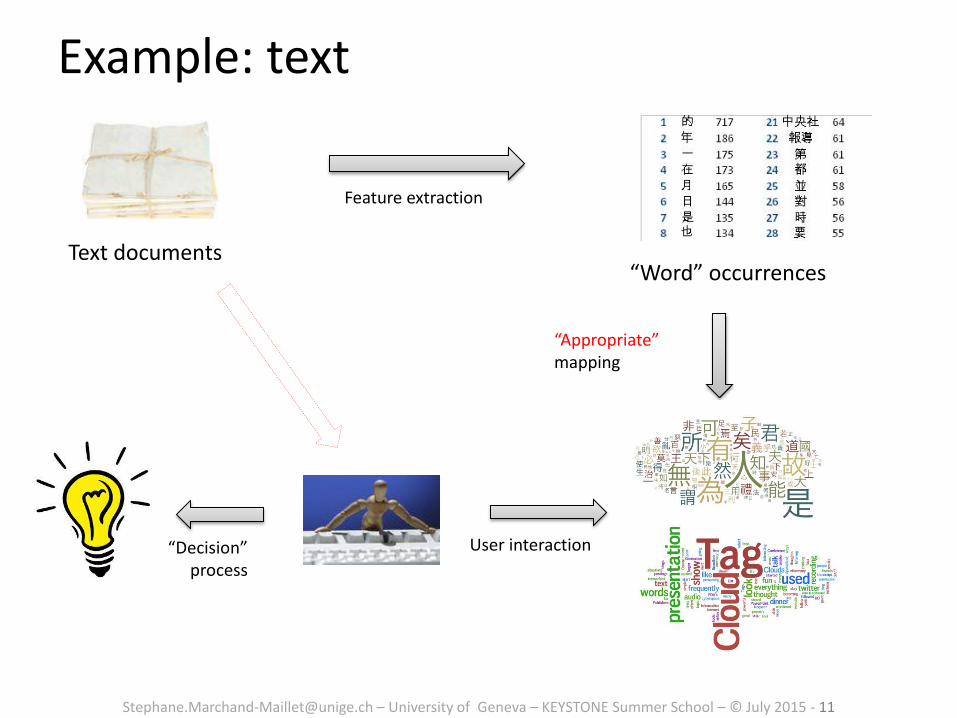
Example: text
Text documents
Feature extraction
“Appropriate” mapping
User interaction “Decision” process
“Word” occurrences
Page 12
[email protected] – University of Geneva – KEYSTONE Summer School – © July 2015 - 12
Example: Images
Images
Feature extraction
“Appropriate” mapping
User interaction “Decision” process
Photo collage Filtering
Color histogram
Page 13
[email protected] – University of Geneva – KEYSTONE Summer School – © July 2015 - 13
Also...
• Any type of media: webpage, audio, video, data,...
• Objects, based on their characteristics
• People in social networks
• Concepts: processes, states, ... Etc
Anything for which “characteristics” may be measured
Page 14
[email protected] – University of Geneva – KEYSTONE Summer School – © July 2015 - 14
The key is distance
• Features help characterizing 1 document (summary)
• Features help comparing 2 documents
• How can they help structuring a collection?
Page 15
[email protected] – University of Geneva – KEYSTONE Summer School – © July 2015 - 15
Most often back to the local neighbours
- Information retrieval - Similarity query
- Machine learning - Generalization
- Data mining - Discover continuous patterns
Distance measurements
Page 16
[email protected] – University of Geneva – KEYSTONE Summer School – © July 2015 - 16
However
Two main issues:
• High-dimensional data
– «Curse of dimensionality»
• Large data
– «Big data»
Page 17
[email protected] – University of Geneva – KEYSTONE Summer School – © July 2015 - 17
• Raw data (the documents) carries information
• Computer essentially perform additions
• We need to represent the data somehow to provide the computer with as much as possible faithful information
• The representation is an opportunity for us to transfer some prior (domain) knowledge as design assumptions
If this (data modelling) step is flawed, the computer will work with random information
Representation spaces (intuition)
Page 18
[email protected] – University of Geneva – KEYSTONE Summer School – © July 2015 - 18
Given a set C of N documents di, mapped onto a set X of points xi of a M-dimensional vector space RM
• To index and organise (exploit) this collection, we must understand its underlying structure
We study its geometrical properties Notion of distance, neighbourhood
We study its statistical properties Density, generative law
Both are the same information!
Approach
Page 19
[email protected] – University of Geneva – KEYSTONE Summer School – © July 2015 - 19
Terminology
Given a set C of N documents di, mapped onto a set X of points xi of a M-dimensional vector space RM
Two main issues:
• High-dimensional data
– M increases
• Large data
– N increases
Page 20
[email protected] – University of Geneva – KEYSTONE Summer School – © July 2015 - 20
• C={d1,d2,…,dN} a collection of documents
– For each document, perform feature extraction f
– di is represented by its feature vector xi in RM
– xi is the view of di from the computer perspective
– f: C X = {x1,x2,…,xN}
• Examples
– Images: xi is a 128-bin color histogram: M=128
– Text: xi measures the occurrence of each word of the dictionary: M=50’000
Representation spaces
Page 21
[email protected] – University of Geneva – KEYSTONE Summer School – © July 2015 - 21
We have
We want to create an order or a structure over X
– We define a topology on the representation space
We study distances
We study neighborhoods (kNN)
Representation spaces
M
iN RxxxxX },...,,{ 21
M
M Reee of basis},...,,{ 21
Page 22
[email protected] – University of Geneva – KEYSTONE Summer School – © July 2015 - 22
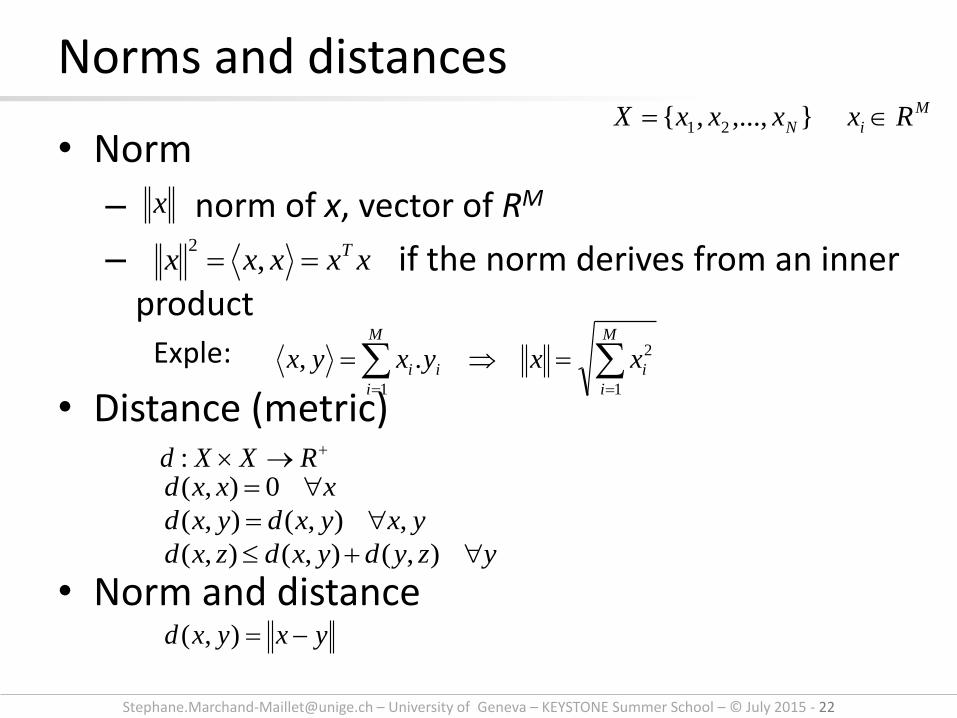
Norms and distances
• Norm
– norm of x, vector of RM
– if the norm derives from an inner product
Exple:
• Distance (metric)
• Norm and distance
M
iN RxxxxX },...,,{ 21
x
xxxxx T ,2
M
i
i
M
i
ii xxyxyx1
2
1
.,
RXXd :xxxd 0),(
yxyxdyxd ,),(),(
yzydyxdzxd ),(),(),(
yxyxd ),(
Page 23
[email protected] – University of Geneva – KEYSTONE Summer School – © July 2015 - 23
• Examples of norms (distances)
– Minkowsky (Lp norms)
• p=1 : norm L1
• p=2: L2 norm (Euclidean)
• : norm
• Unit ball for distance d(.,.)
Norms and distances M
iN RxxxxX },...,,{ 21
pM
i
p
ipxx
1
1
M
i
ixx1
1
ii xx max
pL
(open)}1),(s.t{)(
(closed)}1),(s.t{)(
yxdyxB
yxdyxB
d
d
1 2
Ilustrations: http://www.viz.tamu.edu/faculty/ergun Wikipedia
)()()(),(),(),(2
2
2
2
2 yxyxyxyxyxyxdyxd T
E
Page 24
[email protected] – University of Geneva – KEYSTONE Summer School – © July 2015 - 24
• Generalised Euclidean distance
• Mahalanobis distance
Norms and distances
2
1
)(1
),( ii
M
i i
G yxw
yxd
)0;0(s.d.p xAxxRA TMxM
)()(),( 12 yxAyxyxd T
A
2Idif ddA A
GAi ddwiagA )(dif
Page 25
[email protected] – University of Geneva – KEYSTONE Summer School – © July 2015 - 25
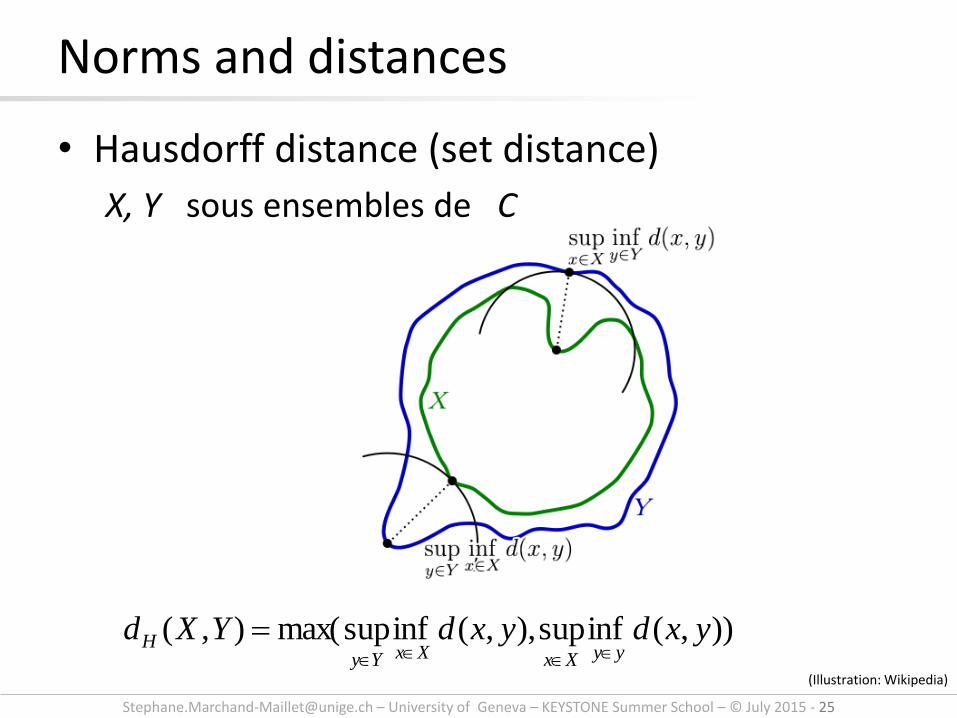
• Hausdorff distance (set distance)
X, Y sous ensembles de C
Norms and distances
)),(infsup),,(infsupmax(),( yxdyxdYXdyyXxXxYy
H
(Illustration: Wikipedia)
Page 26
[email protected] – University of Geneva – KEYSTONE Summer School – © July 2015 - 26
• Unit masses at positions xi
• Center of mass
• Inertia wrt point a:
• Inertia wrt subspace F:
• Huygens theorem:
Physics and statistics M
iN RxxxxX },...,,{ 21
i
ixN
g1
i
ia xadXI ),()( 2
),()()( 2 gadXIXI ag
Physics Statistics
Mass(xi) Probability P(xi)
Centre of mass g Mean mEX
Inertia Ig Variance s2=V(X)
i
iF xFdXI ),()( 2
Page 27
[email protected] – University of Geneva – KEYSTONE Summer School – © July 2015 - 27
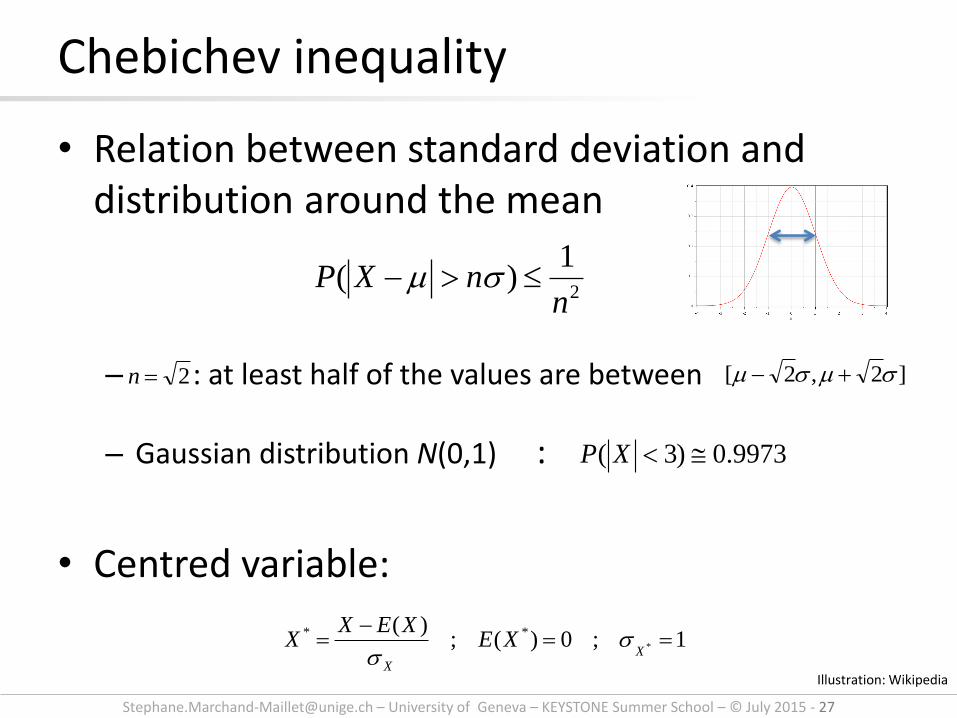
• Relation between standard deviation and distribution around the mean
– : at least half of the values are between
– Gaussian distribution N(0,1) :
• Centred variable:
Chebichev inequality
1;0)(;)(
*
**
X
X
XEXEX
X ss
2
1)(
nnXP sm
2n ]2,2[ smsm
9973.0)3( XP
Illustration: Wikipedia
Page 28
[email protected] – University of Geneva – KEYSTONE Summer School – © July 2015 - 28
Markov inequality
• Upper bound of the cumulative distribution
• Useful for proofs and upper bounds
0)(
)( aa
XEaXP
Page 29
[email protected] – University of Geneva – KEYSTONE Summer School – © July 2015 - 29
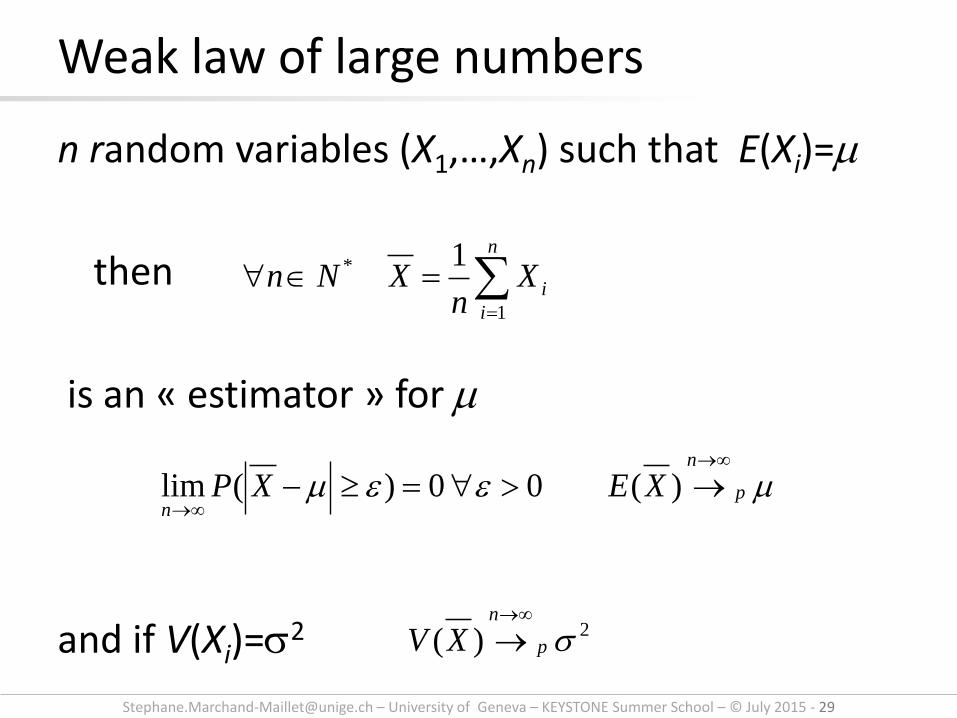
n random variables (X1,…,Xn) such that E(Xi)=m
then
is an « estimator » for m
and if V(Xi)=s2
Weak law of large numbers
n
i
iXn
XNn1
* 1
mm p
n
nXEXP
)(00)(lim
2)( sp
n
XV
Page 30
[email protected] – University of Geneva – KEYSTONE Summer School – © July 2015 - 30
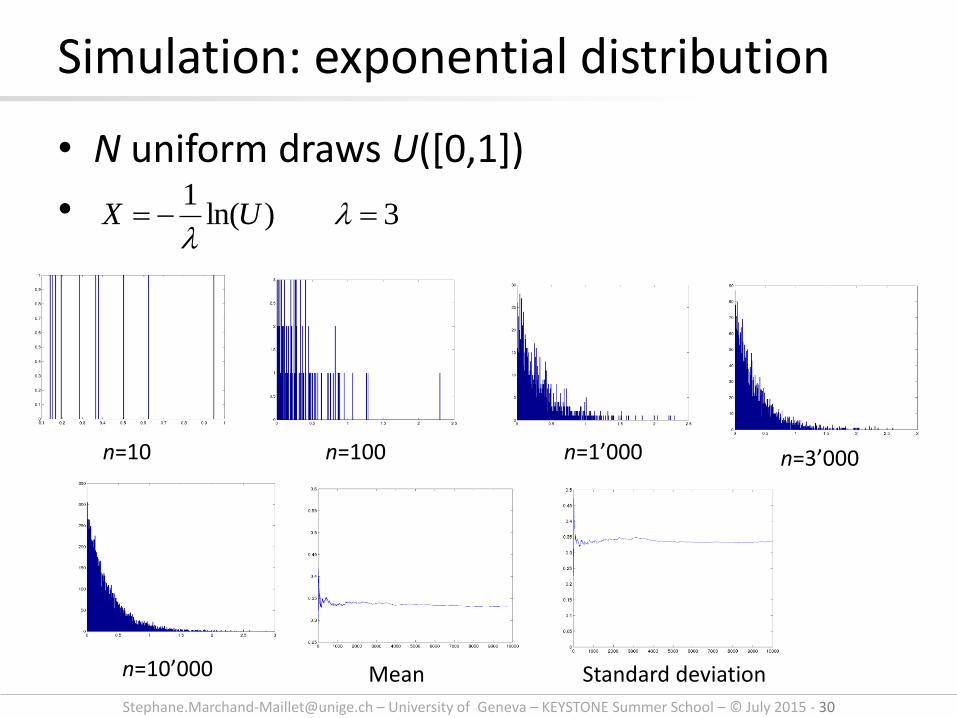
• N uniform draws U([0,1])
•
Simulation: exponential distribution
n=10 n=100 n=1’000 n=3’000
n=10’000 Mean Standard deviation
3)ln(1
UX
Page 31
[email protected] – University of Geneva – KEYSTONE Summer School – © July 2015 - 31
X such that E(X)=m et V(X)=s2
X1,…,Xn random variables iid with X
Then, Zn converges (in probability) to N(0,1)
Central Limit Theorem
dxebZaP
b
a
x
nn
2
2
2
1)(lim
s
)(1
1
* ms
Xn
ZXn
XNn n
n
i
i
Page 32
[email protected] – University of Geneva – KEYSTONE Summer School – © July 2015 - 32
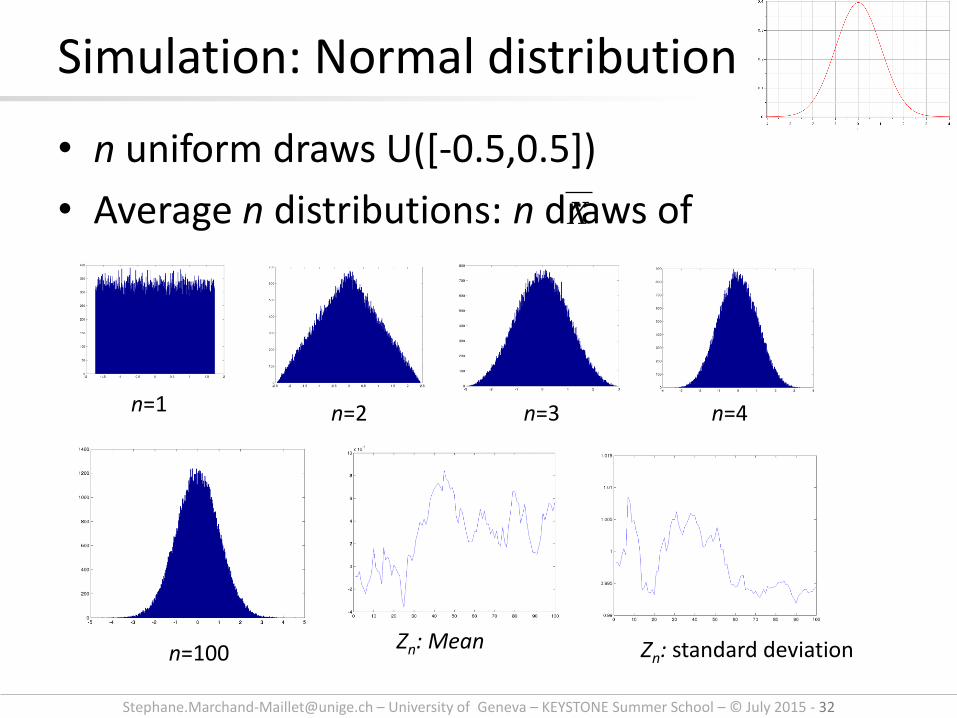
• n uniform draws U([-0.5,0.5])
• Average n distributions: n draws of
Simulation: Normal distribution
X
n=1 n=4 n=3 n=2
n=100 Zn: Mean Zn: standard deviation
Page 33
[email protected] – University of Geneva – KEYSTONE Summer School – © July 2015 - 33
• X random variable whose mean m to be estimated – Exple: « Diameter »
• Xi population – Exple: « Apples »
• xi : measures – Exple: « measured diameters »
(mean of measures) tend to X (by the Weak Law of Large Numbers)
• The Central Limit Theorem says that the error on the estimate of m (Zn) follow a normal law N(0,1)
Zn is a random variable representing the error carried by
Interpretation
X
XnZ mm
Page 34
[email protected] – University of Geneva – KEYSTONE Summer School – © July 2015 - 34
• In vector spaces, distances are essentially measured using difference of coordinates
• Statistical distribution may be considered as statistical objects with inter-distances (similarity)
• However, it would not be relevant to compare their intrinsic values directly. We rather use Divergences
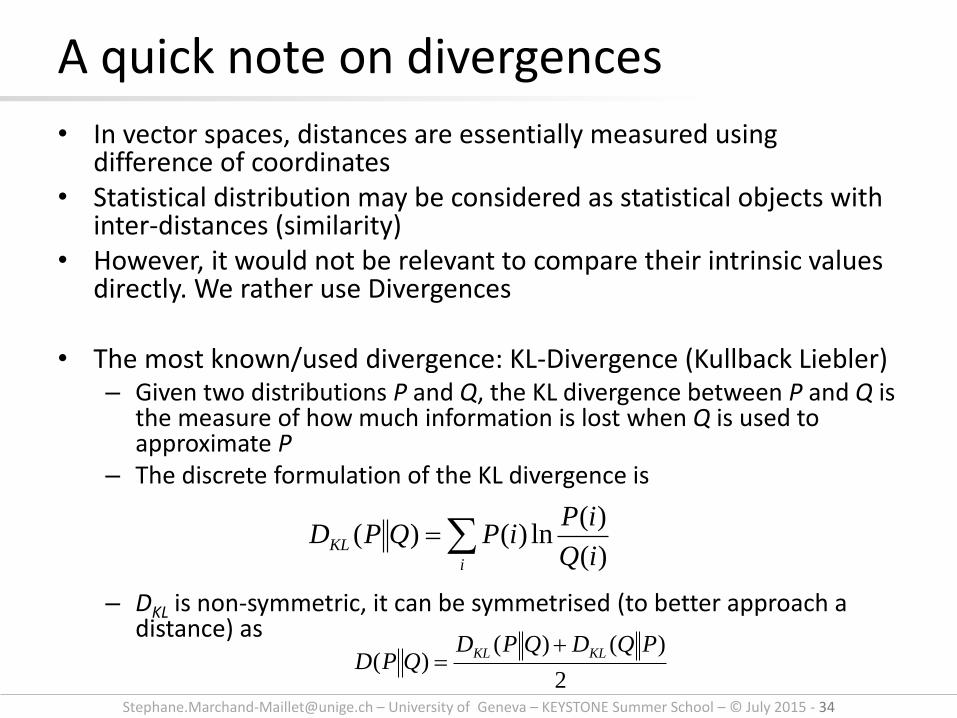
• The most known/used divergence: KL-Divergence (Kullback Liebler) – Given two distributions P and Q, the KL divergence between P and Q is
the measure of how much information is lost when Q is used to approximate P
– The discrete formulation of the KL divergence is
– DKL is non-symmetric, it can be symmetrised (to better approach a distance) as
A quick note on divergences
i
KLiQ
iPiPQPD
)(
)(ln)()(
2
)()()(
PQDQPDQPD
KLKL
Page 35
[email protected] – University of Geneva – KEYSTONE Summer School – © July 2015 - 35
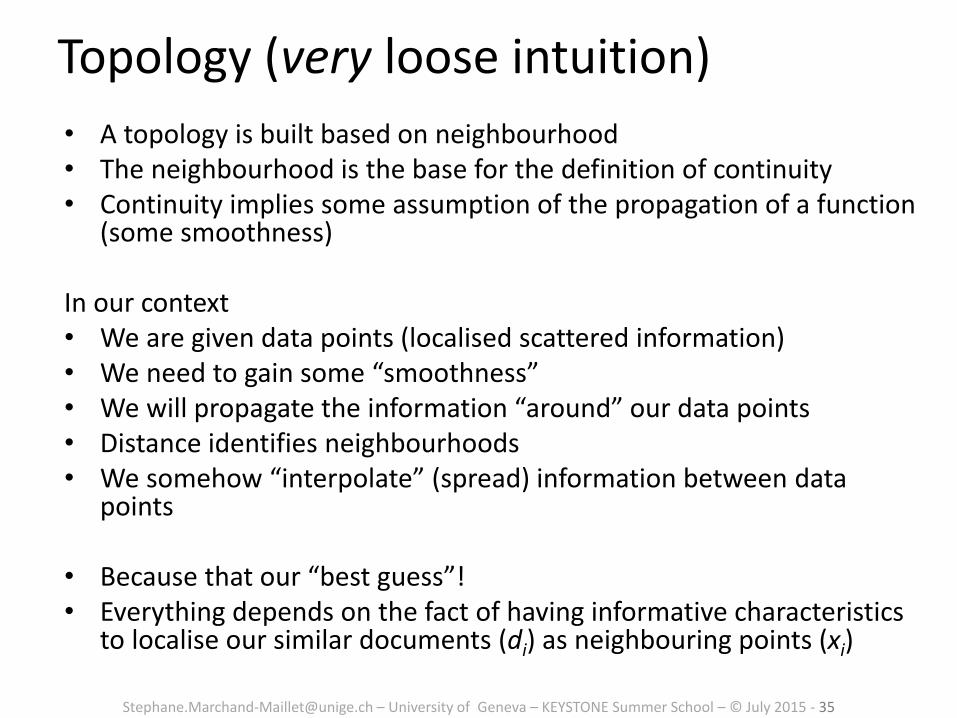
Topology (very loose intuition)
• A topology is built based on neighbourhood • The neighbourhood is the base for the definition of continuity • Continuity implies some assumption of the propagation of a function
(some smoothness)
In our context • We are given data points (localised scattered information) • We need to gain some “smoothness” • We will propagate the information “around” our data points • Distance identifies neighbourhoods • We somehow “interpolate” (spread) information between data
points
• Because that our “best guess”! • Everything depends on the fact of having informative characteristics
to localise our similar documents (di) as neighbouring points (xi)
Page 36
[email protected] – University of Geneva – KEYSTONE Summer School – © July 2015 - 36
One of the main problems in Data Analysis
• Given a query point
• Find its neighbourhood (vicinity) V
k-NN (nearest neighbour)
is the nearest (k-)neighbour
is the farthest k-neighbour
-NN >0, fixed (range query)
Nearest neighbours
MRq
*Nk
},...,{),(),(s.t ,...,, 121 kjiiii iijxqdxqdxxxVlk
kxqdxxxVlk iiii ),(s.t ,...,,
21
1ix
kix
Page 37
[email protected] – University of Geneva – KEYSTONE Summer School – © July 2015 - 37
Voronoi diagram ci: Voronoi cell associated to point xi
Delaunay Graph D=(C,E) : points xi are the vertices of D (xi,xj) is an edge if ci and cj have a common edge The graph connects neighbouring cells
Space partitioning M
iN RxxxxX },...,,{ 21
ijyxdyxdRyc ji
M
i ),(),(t.q.
Ilustrations: http://www.wblut.com Wikipedia
ci
xi
xj
(xi,xj)
Page 38
[email protected] – University of Geneva – KEYSTONE Summer School – © July 2015 - 38
We, as human, are experts in 1D, 2D, 3D, a bit less in 4D (time) and less so afterwards
In high dimensions (eg 20 is enough), counter intuitive properties appear
Eg:
• Sparsity
• Concentration of distances
• Relation to kNN: hubness
which we try to model here, to better understand why things go wrong (or not as good)
Curse of Dimensionality
Page 39
[email protected] – University of Geneva – KEYSTONE Summer School – © July 2015 - 39
• M is the dimension of the space (and the data) – Measures, characteristics, …
• X is therefore the sample data of a M-dimensional space
What if M increases? – Influence on geometric measures (distances, k-NN) – Influence on statistical distributions
« Curse of dimensionality » Richard Ernest Bellman (1961). Adaptive control
processes: a guided tour. Princeton University Press.
High dimensionality M
iN RxxxxX },...,,{ 21
Page 40
[email protected] – University of Geneva – KEYSTONE Summer School – © July 2015 - 40
Imagine a data sample in [a,b]M
We quantify every dimension with k bins
To estimate the distribution we require n samples in each bin in average
• M=1: N~k.n
• M=2: N~n.k2
…
• M: N~n.kM
Exple:
k=10, n=10, M=6 => N ~ 10’000’000 samples required
High dimensionality
Page 41
[email protected] – University of Geneva – KEYSTONE Summer School – © July 2015 - 41
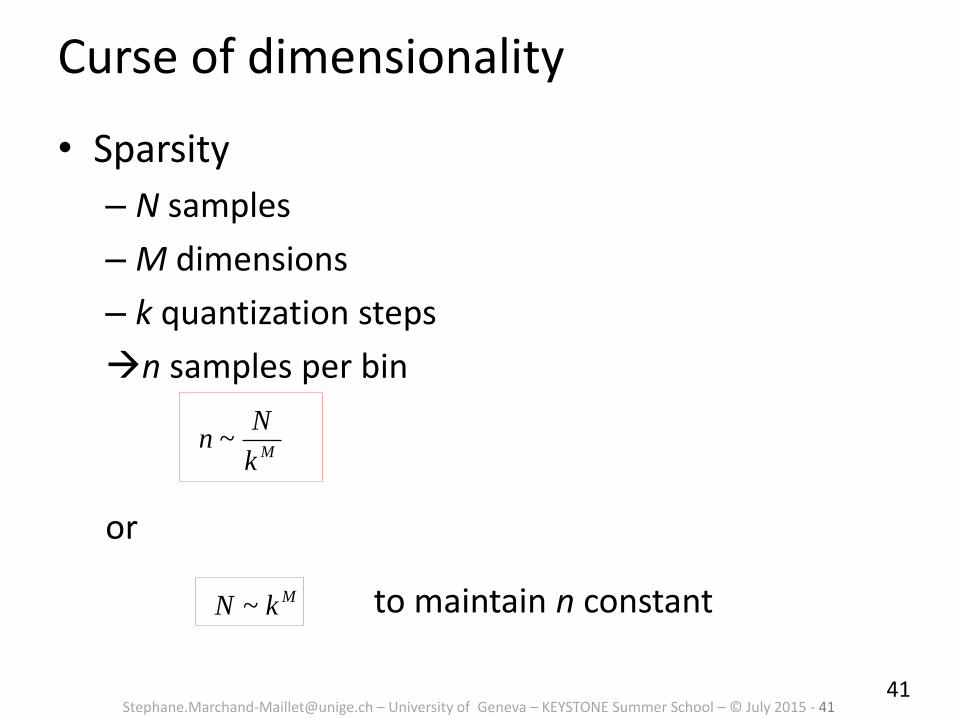
Curse of dimensionality
• Sparsity
– N samples
– M dimensions
– k quantization steps
n samples per bin
or
to maintain n constant
41
Mk
Nn ~
MkN ~
Page 42
[email protected] – University of Geneva – KEYSTONE Summer School – © July 2015 - 42
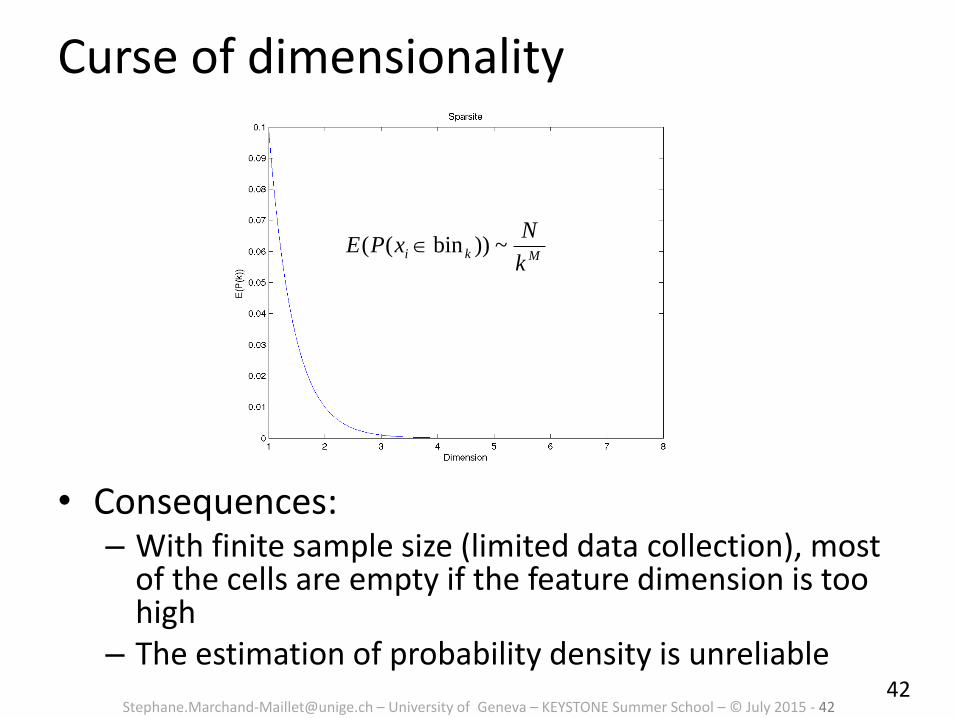
Curse of dimensionality
42
Mkik
NxPE ~))bin((
• Consequences: – With finite sample size (limited data collection), most
of the cells are empty if the feature dimension is too high
– The estimation of probability density is unreliable
Page 43
[email protected] – University of Geneva – KEYSTONE Summer School – © July 2015 - 43
Curse of dimensionality
• Gaussian distribution
43
MXP )9973.0()3(
M
1 99.7%
10 97.3%
100 76.3%
500 25.8%
1000 6.7%
)3( XP
Page 44
[email protected] – University of Geneva – KEYSTONE Summer School – © July 2015 - 44
Neighbourhood structure
• S a ball around a point (radius r, dimension M)
• C a cube around a point [-r,+r]M
0)2/(2)(
)(ratio
)2()()2/(
2)(
1
2/
2/
M
M
M
C
S
M
C
MM
S
MMMV
MV
rMVMM
rMV
Page 45
[email protected] – University of Geneva – KEYSTONE Summer School – © July 2015 - 45
Neighbourhood structure
• Most of the neighbours of the centre are «in the corners of the cube»
• Empty space: each point (center) sees its neighbours far away
0)(
)( M
C
S
MV
MV0))(( M
i SxPE
Page 46
[email protected] – University of Geneva – KEYSTONE Summer School – © July 2015 - 46
• S a ball around a point (radius r, dimension M)
• C enclosed cube: side a
Neighbourhood structure
?)2/(2)(
)(ratio
12/1
2/
M
MM
M
C
S
MMMV
MV
M
raM
ar
2
2
M
CM
rMV
2)(
)2/(
2)(
2/
MM
rMV
MM
S
Page 47
[email protected] – University of Geneva – KEYSTONE Summer School – © July 2015 - 47
Dmax and Dmin are smallest and largest neighbour distances
High-dimensional k-NN
Dmax Dmin
Beyer, K., Goldstein, J., Ramakrishnan, R., and Shaft, U. (1999). When is“nearest neighbor” meaningful? In Proceedings of the 7th International Conference on Database Theory, pages 217–235
01)(
P lim n the0)(
lim ifmin
minmax
M
D
DD
MkM
kM
XE
XV
Thm [Beyer et al, 1999]
Page 48
[email protected] – University of Geneva – KEYSTONE Summer School – © July 2015 - 48
Loss of contrast:
High-dimensional k-NN
Dmax Dmin
Computational imprecision prevents relevance
Noise is taking over
-NN: all or nothing
k-NN: random draw
0)(
min
minmax
D
DD M
P
Page 49
[email protected] – University of Geneva – KEYSTONE Summer School – © July 2015 - 49
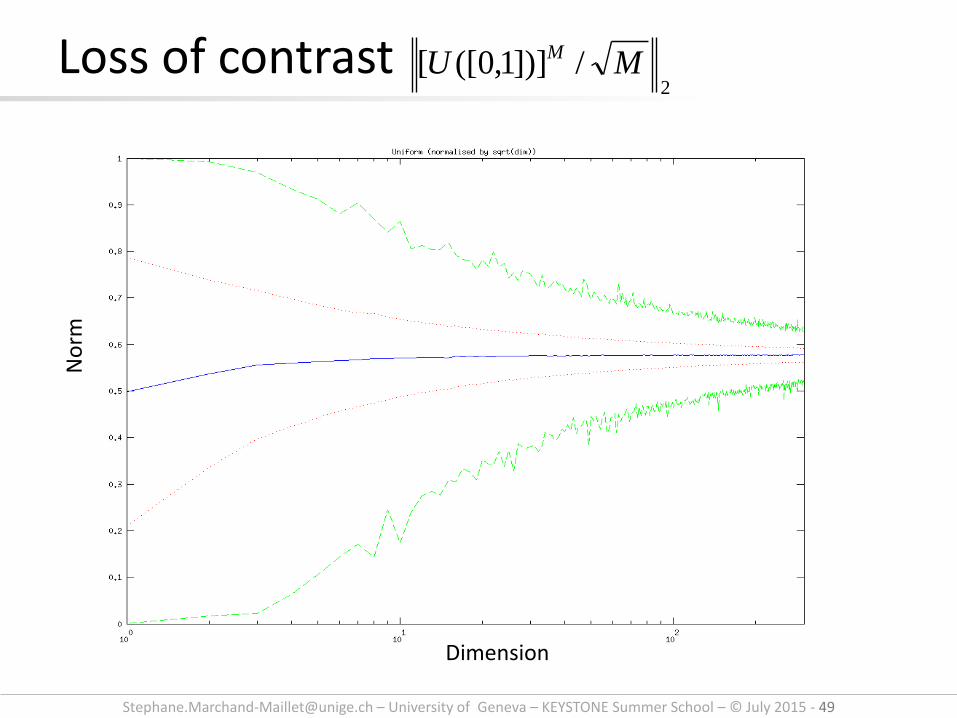
Loss of contrast 2
/])]1,0([[ MU M
Dimension
No
rm
Page 50
[email protected] – University of Geneva – KEYSTONE Summer School – © July 2015 - 50
Loss of contrast 2
/)]1,0([ MN M
Dimension
No
rm
Page 51
[email protected] – University of Geneva – KEYSTONE Summer School – © July 2015 - 51
• Consequences
– Database index based on metric distances
• K-d-tree
• VP-tree
have to perform exhaustive search
“Every enclosing rectangle encloses everything”
High dimensional k-NN
Illustrations: Peter N. Yianilos. Data Structures and Algorithms for Nearest Neighbor Search in General Metric Spaces. Fourth ACM-SIAM Symposium on Discrete Algorithms, 1993
Page 52
[email protected] – University of Geneva – KEYSTONE Summer School – © July 2015 - 52
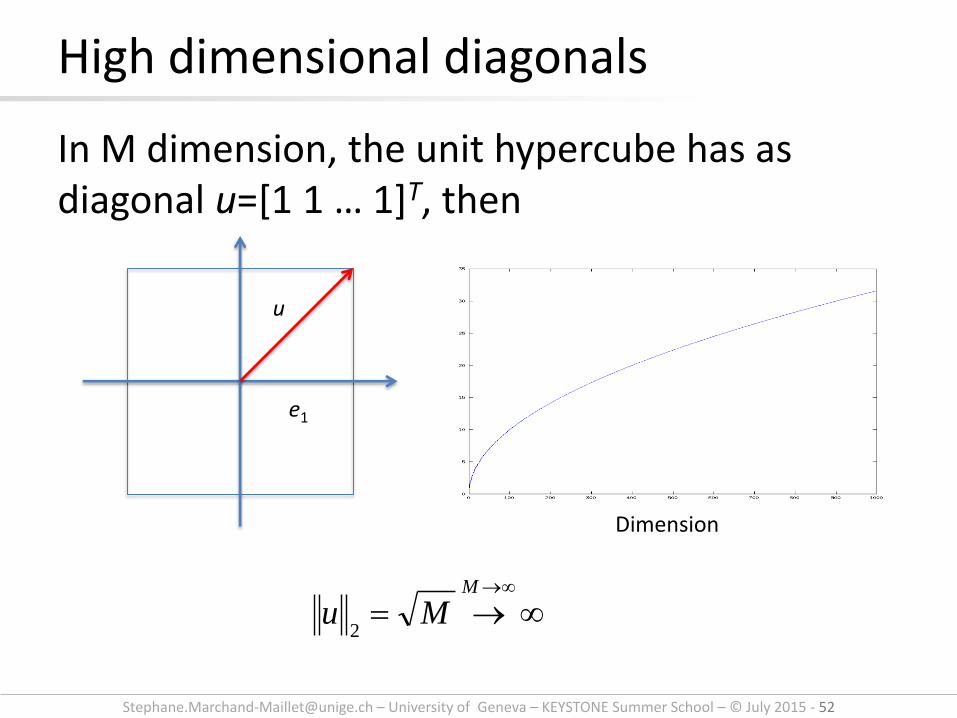
In M dimension, the unit hypercube has as diagonal u=[1 1 … 1]T, then
High dimensional diagonals
M
Mu2
u
e1
Dimension
Page 53
[email protected] – University of Geneva – KEYSTONE Summer School – © July 2015 - 53
In M dimension, the unit hypercube has as diagonal u=[1 1 … 1]T, then
High dimensional diagonals
01
),cos()cos( 11
MT
MMu
eueu
u
e1
Page 54
[email protected] – University of Geneva – KEYSTONE Summer School – © July 2015 - 54
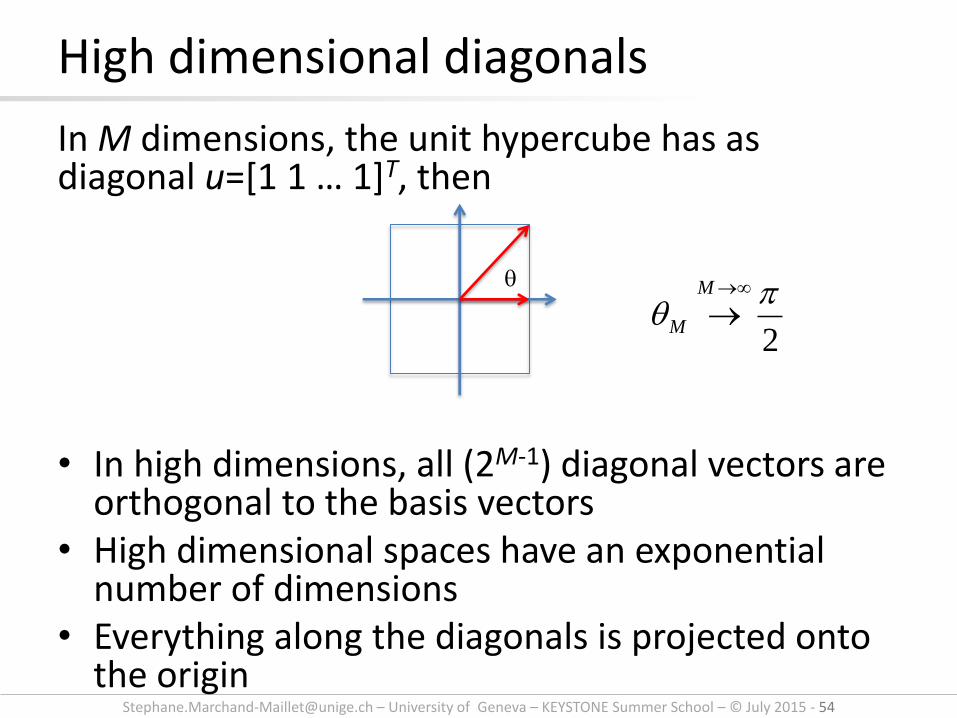
In M dimensions, the unit hypercube has as diagonal u=[1 1 … 1]T, then • In high dimensions, all (2M-1) diagonal vectors are
orthogonal to the basis vectors • High dimensional spaces have an exponential
number of dimensions • Everything along the diagonals is projected onto
the origin
High dimensional diagonals
2
M
M
Page 55
[email protected] – University of Geneva – KEYSTONE Summer School – © July 2015 - 55
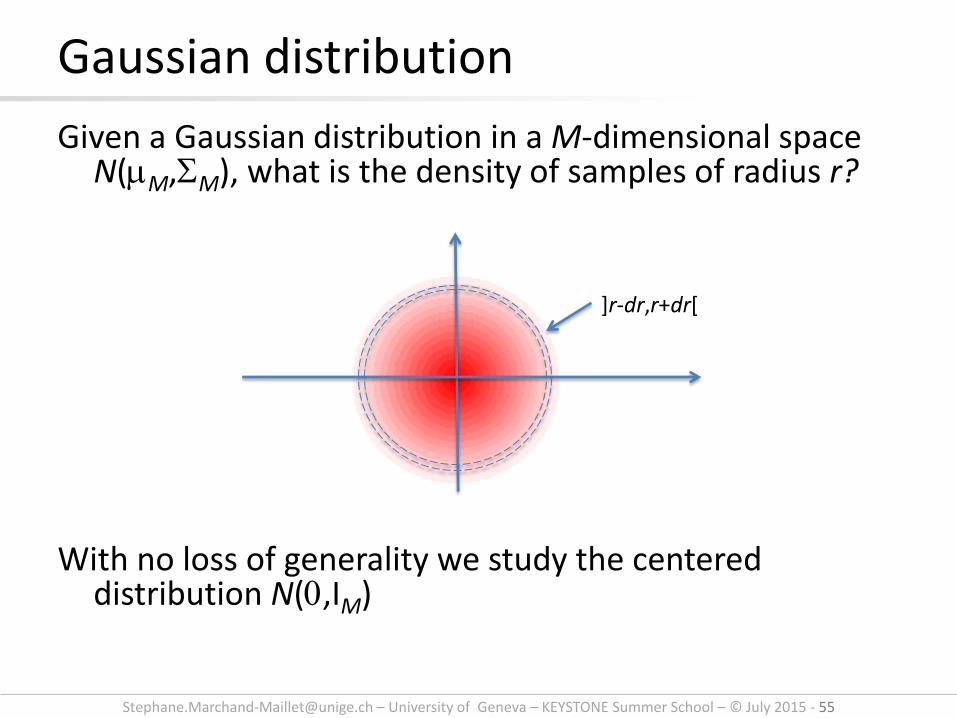
Given a Gaussian distribution in a M-dimensional space N(mM,SM), what is the density of samples of radius r?
With no loss of generality we study the centered
distribution N(0,IM)
Gaussian distribution
]r-dr,r+dr[
Page 56
[email protected] – University of Geneva – KEYSTONE Summer School – © July 2015 - 56
Gaussian distribution ]r-dr,r+dr[
MM
MrVM
MrE
MX
Mr
rMXX
rrXP
NX,...,X(XX
M
i
i
M
i
i
T
iM
22)(1
1)(
1~
1
.
)),...,(( of estimation
)1,0(~)
2
22
2
1
22
2
1
22
2
1
kVkE
XVabaXV
bXaEbaXE
2)(;)(
)(2)(
)()(
22
Page 57
[email protected] – University of Geneva – KEYSTONE Summer School – © July 2015 - 57
]r-dr,r+dr[
MM
MrVM
MrE
rrXP
NX,...,X(XX
T
iM
22)(1
1)(
)),...,((for estimation
)1,0(~)
2
22
1
« Gaussian egg »
Dimension
0
1
)),...,(( TrrXP
)( rXP
)( rXP
Page 58
[email protected] – University of Geneva – KEYSTONE Summer School – © July 2015 - 58
MM
MrVM
MrE
rrXP
NX,...,X(XX
T
iM
22)(1
1)(
)),...,((for estimation
)1,0(~)
2
22
1
« Gaussian egg »
Dimension
)),...,(( TrrXP
)( rXP
)( rXP
For a M-dimensional Normal distribution of mean 0 and s.d 1, the expected distribution marginalised over concentric spheres has a mean of 1 and a variance converging to 0
Intuition: The volume of the sphere tends to 0 goes against the high density at the centre
Page 59
[email protected] – University of Geneva – KEYSTONE Summer School – © July 2015 - 59
Empirical evidence (10’000 samples) D
imen
sio
n
Bins on [0,2]
Page 60
[email protected] – University of Geneva – KEYSTONE Summer School – © July 2015 - 60
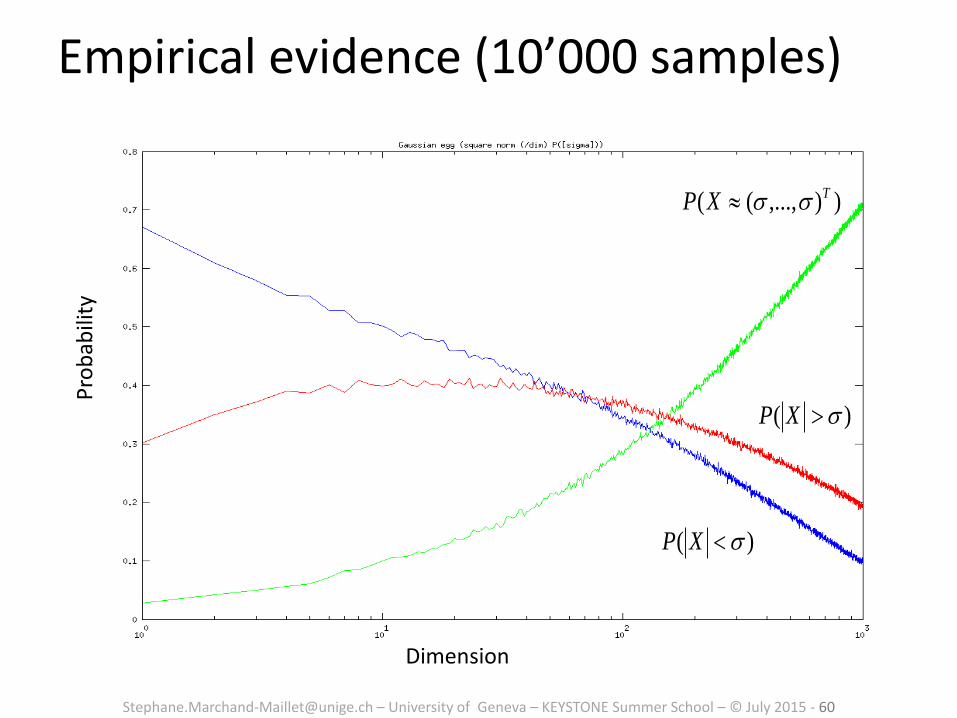
Empirical evidence (10’000 samples)
)( sXP
)),...,(( TXP ss
)( sXP
Pro
bab
ility
Dimension
Page 61
[email protected] – University of Geneva – KEYSTONE Summer School – © July 2015 - 61
Empirical evidence (10’000 samples) P
rob
abili
ty (
cum
ula
tive
)
Dimension
)),...,(( TXP ss
)( sXP
)( sXP
Page 62
[email protected] – University of Geneva – KEYSTONE Summer School – © July 2015 - 62
Consequences
• Loss of contrast: the relative spread of points is not seen accurately
• Conversely: using high dimensional Gaussian distributions to model the data may not be as accurate
Page 63
[email protected] – University of Geneva – KEYSTONE Summer School – © July 2015 - 63
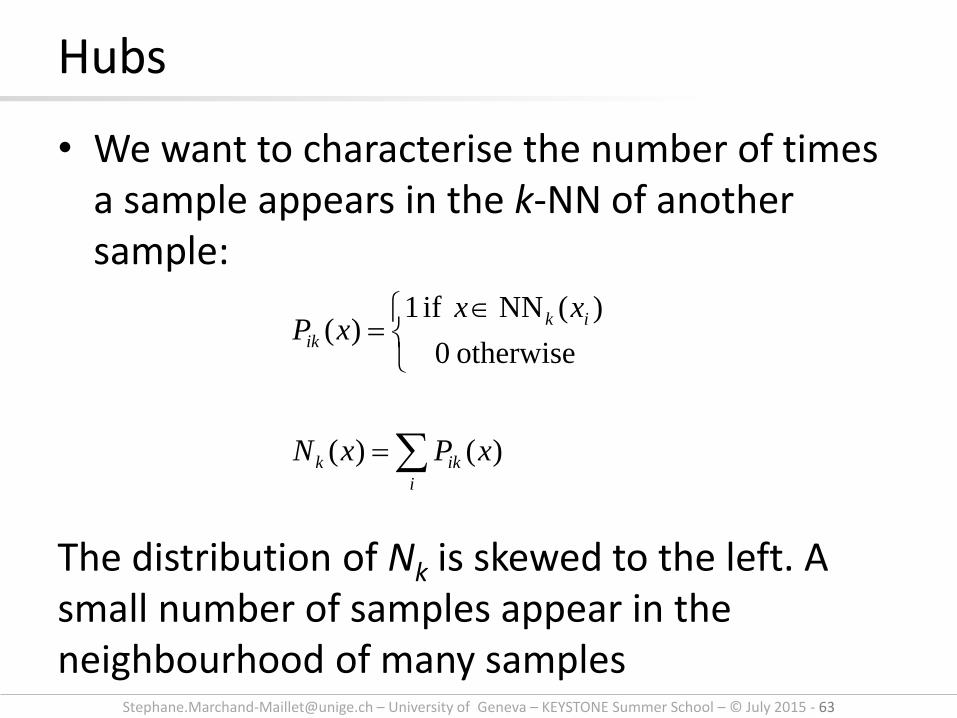
• We want to characterise the number of times a sample appears in the k-NN of another sample:
The distribution of Nk is skewed to the left. A small number of samples appear in the neighbourhood of many samples
Hubs
i
ikk
ik
ik
xPxN
xxxP
)()(
otherwise0
)(NNif1)(
Page 64
[email protected] – University of Geneva – KEYSTONE Summer School – © July 2015 - 64
20-NN M=100 (1000 samples) (50bins)
Bin
Freq
uen
cy
Page 65
[email protected] – University of Geneva – KEYSTONE Summer School – © July 2015 - 65
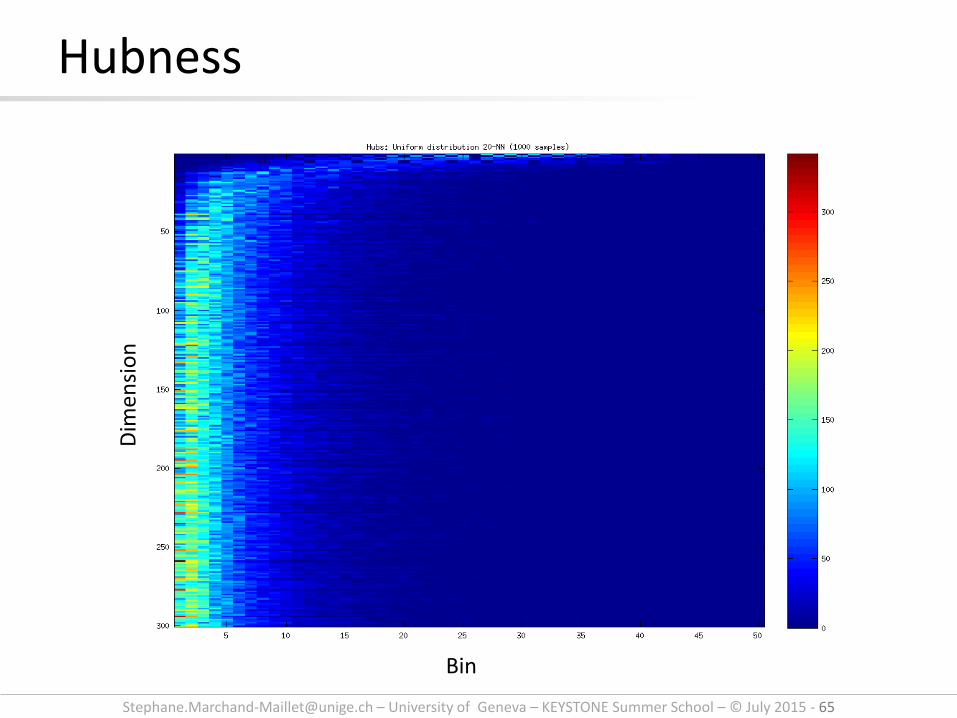
Hubness D
imen
sio
n
Bin
Page 66
[email protected] – University of Geneva – KEYSTONE Summer School – © July 2015 - 66
When using the cosine distance as similarity measure
Centering the data helps reducing the hubness
Hubs: centering
yx
yxyxd
T
1),(cos
I Suzuki et al. Centering Similarity Measures to Reduce Hubs.2013 Conf. on Empirical Methods in NLP.
Page 67
[email protected] – University of Geneva – KEYSTONE Summer School – © July 2015 - 67
Lesson
Although data points may be uniformly distributed, the Lp norms being sums of coordinate distances,
the computed distances are corrupted by the excess of uniformative dimensions
As a result, points appear non uniformely distributed
pM
i
p
ipxx
1
1
Page 68
[email protected] – University of Geneva – KEYSTONE Summer School – © July 2015 - 68
Summary
Two main issues:
• High-dimensional data
– «Curse of dimensionality»
– Making distance measurements unreliable
– Making statistical estimation inaccurate
• Large data
– «Big data»
Reduction of dimension
Page 69
[email protected] – University of Geneva – KEYSTONE Summer School – © July 2015 - 69
Dimension reduction: principle
• Given a set of data in a M-dimensional space, we seek an equivalent representation of lower dimension
• Dimension reduction induces a loss. What to sacrifice? What to preserve? – Preserve local: neighbourhood, distances
– Preserve global: distribution of data, variance
– Sacrifice local: noise
– Sacrifice global: large distances
– Map linearly
– Unfold data
Page 70
[email protected] – University of Geneva – KEYSTONE Summer School – © July 2015 - 70
Some example techniques:
• SFC: preserve neighbourhoods
• PCA: preserve global linear structures
• MDS: preserve linear neighbourhoods
• IsoMAP: Unfold neighbourhoods
• SNE family: unfold statistically
Not studied here (but also valid):
• SOM (visualisation), LLE, Random projections (hashing)
Dimension reduction
Page 71
[email protected] – University of Geneva – KEYSTONE Summer School – © July 2015 - 71
Space-filling curves
• Definition:
– A continuous curve which passes through every point of a closed n-cell in Euclidean n-space Rn is called a space filling curve (SFC)
• The idea is to map the complete space onto a simple index: a continuous line
– Directly implies an order on the dataset
Page 72
[email protected] – University of Geneva – KEYSTONE Summer School – © July 2015 - 72
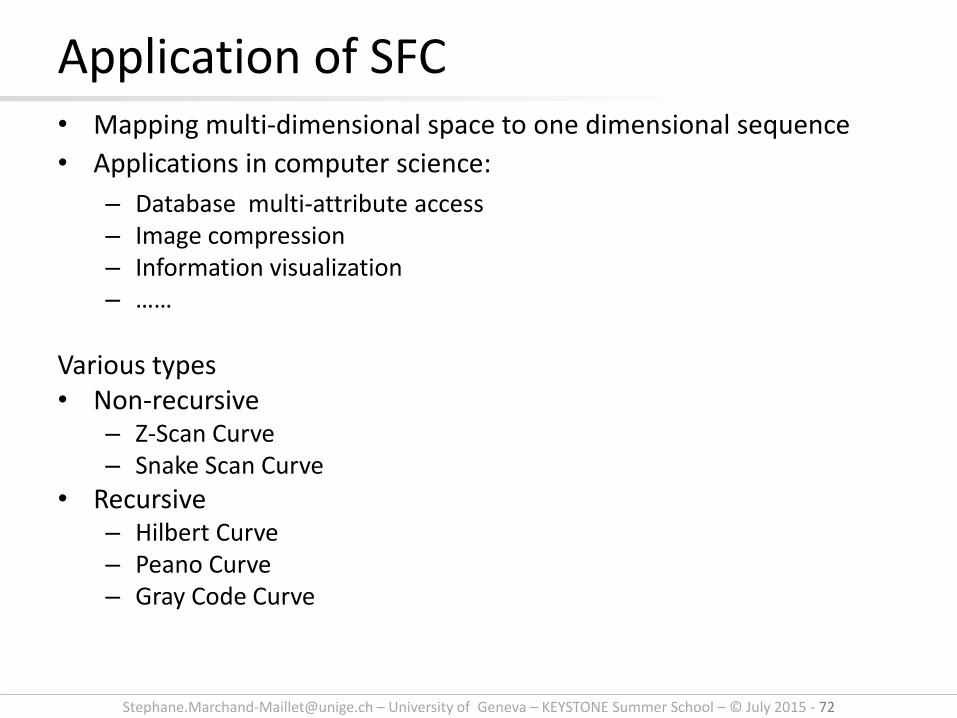
Application of SFC • Mapping multi-dimensional space to one dimensional sequence
• Applications in computer science:
– Database multi-attribute access – Image compression – Information visualization – ……
Various types • Non-recursive
– Z-Scan Curve – Snake Scan Curve
• Recursive – Hilbert Curve – Peano Curve – Gray Code Curve
Page 73
[email protected] – University of Geneva – KEYSTONE Summer School – © July 2015 - 73
Hilbert curve Ilustrations: Wikipedia
Page 74
[email protected] – University of Geneva – KEYSTONE Summer School – © July 2015 - 74
Peano Curve Ilustrations: Wikipedia
Page 75
[email protected] – University of Geneva – KEYSTONE Summer School – © July 2015 - 75
SFC
• In our case, the idea is to use SFC to “explore” local neighborhoods, hoping that neighborhoods will appear “compact” on the curve
• Hence we study such mapping for SFC
Page 76
[email protected] – University of Geneva – KEYSTONE Summer School – © July 2015 - 76
Visualizing 4D Hyper-Sphere Surface
• Z-Curve Hilbert Curve
[Illustrations from the lecture “SFC in Info Viz”, Jiwen Huo, Uni Waterloo, CA]
Page 77
[email protected] – University of Geneva – KEYSTONE Summer School – © July 2015 - 77
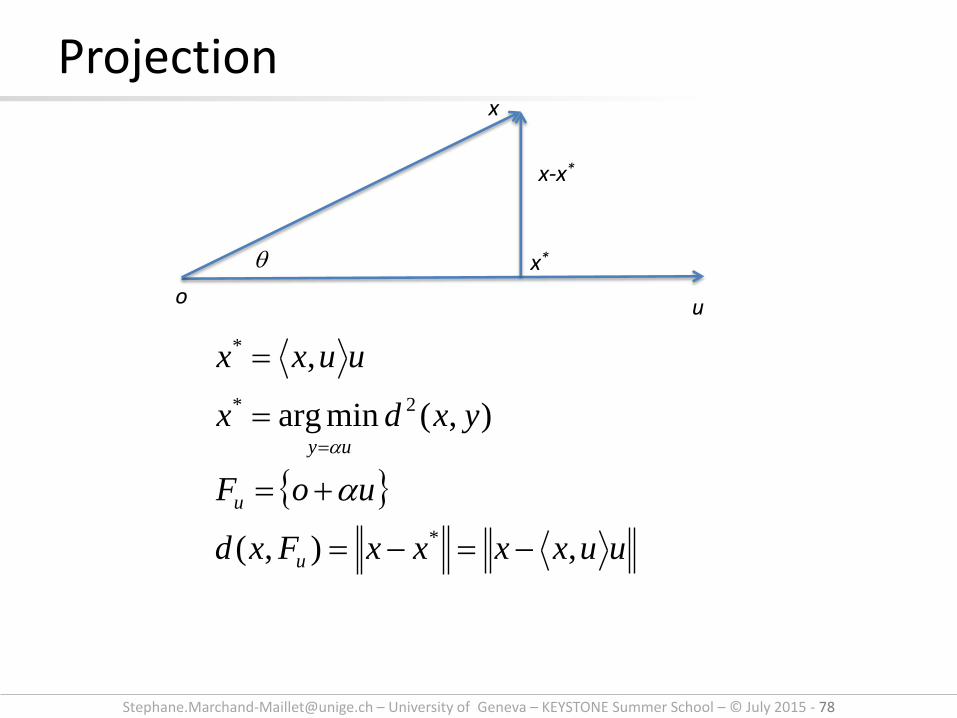
• Points can be identified as vectors from the origin
• Orthogonal projection
• x gets projected in x* onto u (which we take of unit length to represent the subspace Fu)
Projection x
u o
x*
x-x*
Fu
Page 78
[email protected] – University of Geneva – KEYSTONE Summer School – © July 2015 - 78
Projection
uuxxxxFxd
uoF
yxdx
uuxx
u
u
uy
,),(
),(minarg
,
*
2*
*
x
u o
x*
x-x*
Page 79
[email protected] – University of Geneva – KEYSTONE Summer School – © July 2015 - 79
• x* is the part of x that lives in Fu (eg subspace of interest)
• x-x* is the residual (what is not represented)
• x and x-x* are orthogonal (they represent complementary information)
• Point x* is the closest point from Fu to x (minimal loss, maximal representation)
Interpretation x
u o
x*
x-x*
Fu
Page 80
[email protected] – University of Geneva – KEYSTONE Summer School – © July 2015 - 80
• Given a set of data in a M dimensional space, we seek a subspace of lower dimension onto which to project our data
• Criterion: preserve most inertia of the dataset
• Consequence: project and minimize residuals
• We construct incrementally a new subspace by successive projections – X is projected onto ui, find an orthogonal ui+1 to
project the residual
– At most M ui s can be found, we then select the most representative (preserving most inertia)
Principal Component Analysis (PCA)
Page 81
[email protected] – University of Geneva – KEYSTONE Summer School – © July 2015 - 81
• The data is centred around its mean to get minimal global inertia
• We then look for u1 the direction capturing most inertia (minimizing the global sum of residuals)
PCA
),(minarg 2
1 u
i
iu
Fxdu
m ii xx
M
iN RxxxxX },...,,{ 21
uxxuxxuuxxuuxxFxd i
T
i
T
i
T
iii
T
iiui ),(),(),(2
)(maxarg),(minarg1
2
1 uutrFxdu T
uu
i
iu
S
uuuuu
Luu
L T
SS
221
Page 82
[email protected] – University of Geneva – KEYSTONE Summer School – © July 2015 - 82
• PCA incrementally finds “best fit” subspaces, orthogonal to each other (minimize residuals)
• PCA incrementally finds directions of max variance (maximize trace of the cov matrix)
• PCA transforms the data linearly (eigen decomposition) to align it with its axis of max variance (and make the covariance matrix diagonal)
• The reduction of dimension is made by selecting eigenvectors corresponding to the (m<<M) largest eigenvalues
• Because of the max variance criterion, PCA sees the dataset as a set of data draw from a centred distribution penalised by their deviation (distance) to the centre: a Normal distribution
PCA is a linear transformation adapted to non clustered data
PCA
Page 83
[email protected] – University of Geneva – KEYSTONE Summer School – © July 2015 - 83
PCA
[Illustration Wikipedia]
Page 84
[email protected] – University of Geneva – KEYSTONE Summer School – © July 2015 - 84
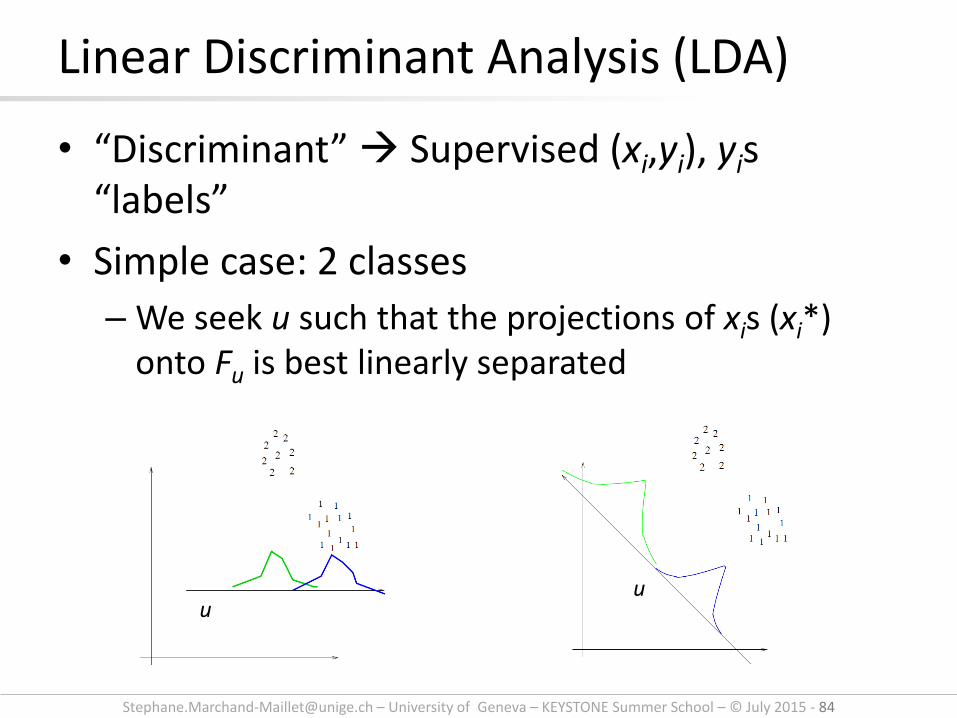
• “Discriminant” Supervised (xi,yi), yis “labels”
• Simple case: 2 classes
– We seek u such that the projections of xis (xi*) onto Fu is best linearly separated
Linear Discriminant Analysis (LDA)
u u
Page 85
[email protected] – University of Geneva – KEYSTONE Summer School – © July 2015 - 85
• Intuitively: max inter-class distance
– u parallel to the original m1-m2
• Fisher criterion adds min intra-class spread (s2)
• Fisher criterion
LDA
*
2
*
11
maxarg mm u
u
2*
2
2*
11
minarg ss u
u
2*
2
2*
1
*
2
*
1
1
maxargss
mm
u
u
Page 86
[email protected] – University of Geneva – KEYSTONE Summer School – © July 2015 - 86
• Both inter- and intra-class criterion can be generalised to multi-class
• Criteria consider classes as one Gaussian distribution N(mj,sj) each
• Resolved by solving an eigensystem
Linear solution
• Can be used for supervised projection onto a reduced set of dimensions
LDA
Page 87
[email protected] – University of Geneva – KEYSTONE Summer School – © July 2015 - 87
Given dij a set of inter-distances between points of a supposed M-dimensional set X (M unknown),
• We seek points X* in a m-dimensional space (m given) such that dij(X*) approximates dij
• We define stress functions:
which are optimised by majorization
Note: weighting by dij may help privileging local structures (less penalty on small distance values)
Multi Dimensional Scaling (MDS)
ji
ij
ji
ijij
Y Yd
Yd
Xm
2
2
))((
))((
minarg*
d
Page 88
[email protected] – University of Geneva – KEYSTONE Summer School – © July 2015 - 88
Shepard diagram: plot dij against dij(X*)
• Ideally along the diagonal (or highly correlated)
• Helps seeing where the discrepancy appears
MDS
[Illustration from I. Borg & PJF Groenen. Modern Multidimensional Scaling. Springer 2005]
Page 89
[email protected] – University of Geneva – KEYSTONE Summer School – © July 2015 - 89
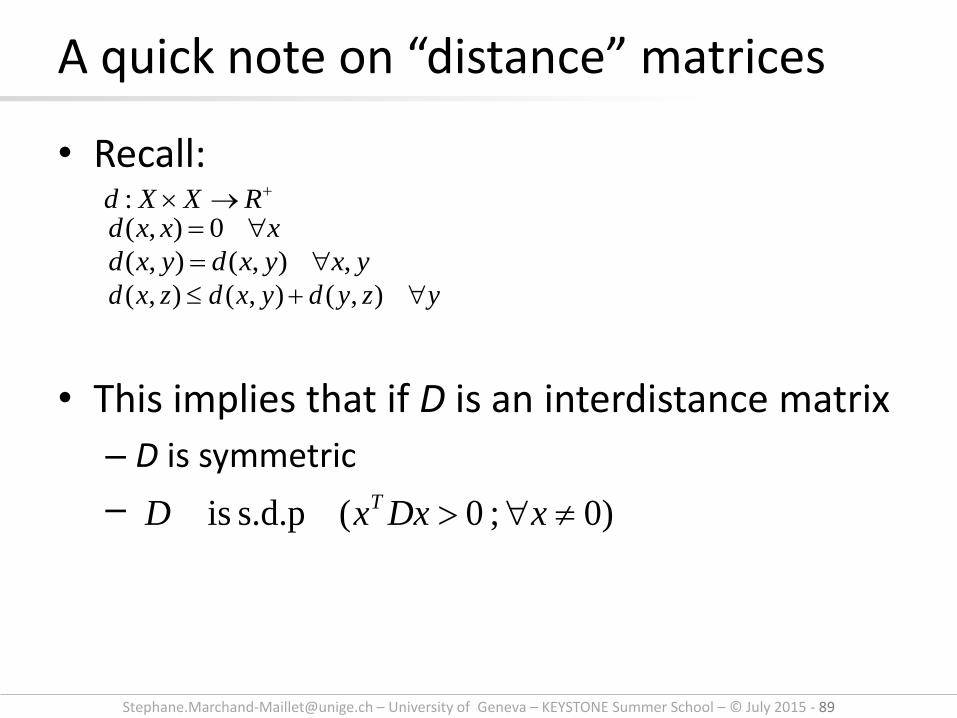
• Recall:
• This implies that if D is an interdistance matrix
– D is symmetric
–
A quick note on “distance” matrices
RXXd :xxxd 0),(
yxyxdyxd ,),(),(
yzydyxdzxd ),(),(),(
)0;0(s.d.p is xDxxD T
Page 90
[email protected] – University of Geneva – KEYSTONE Summer School – © July 2015 - 90
• Euclidean distances say that the shortest distance between two points is along a straight line (any diversion increases the distance value)
• This also says that if y is close to x and z, then x and z should be reasonably close to each other
• This may not always be true
– Social nets : if y is friend with x and z, it says nothing about the social distance between x and z (may be large)
– Data Manifold: if the data lies on a complex manifold, the straight line is irrelevant
Non Euclidean distances
yzydyxdzxd ),(),(),(
Page 91
[email protected] – University of Geneva – KEYSTONE Summer School – © July 2015 - 91
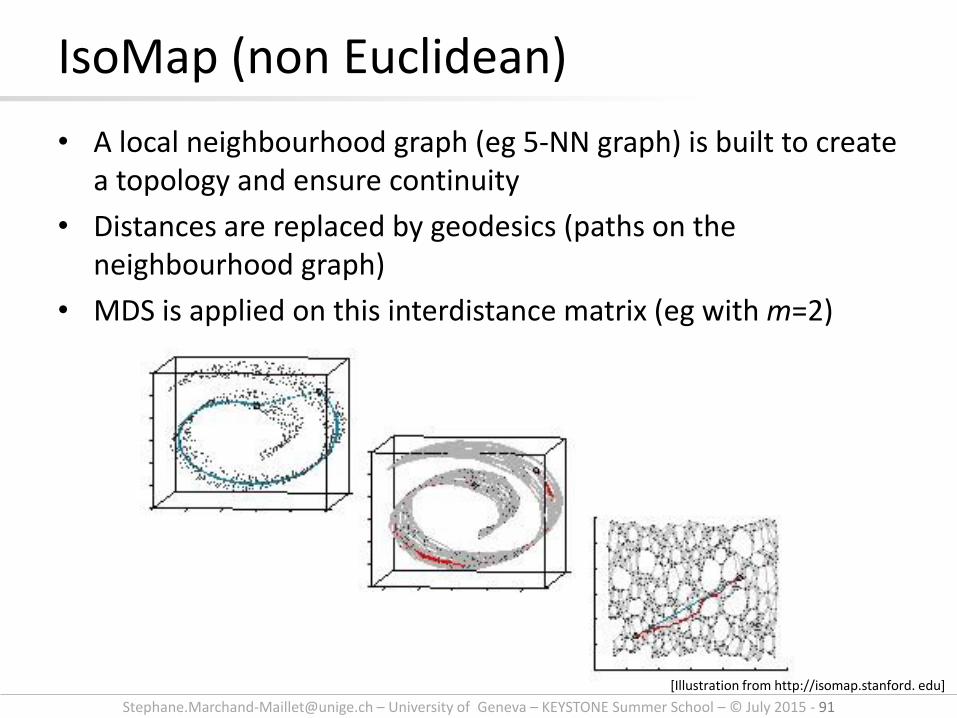
• A local neighbourhood graph (eg 5-NN graph) is built to create a topology and ensure continuity
• Distances are replaced by geodesics (paths on the neighbourhood graph)
• MDS is applied on this interdistance matrix (eg with m=2)
IsoMap (non Euclidean)
[Illustration from http://isomap.stanford. edu]
Page 92
[email protected] – University of Geneva – KEYSTONE Summer School – © July 2015 - 92
• Locally Euclidean neighbourhoods are considered
– Requires a good (dense, uniform) data distribution
– Choice of the neighbourhood size to ensure connectivity and avoid infinite distances
• Powerful to “unfold” the manifold
IsoMap
Page 93
[email protected] – University of Geneva – KEYSTONE Summer School – © July 2015 - 93
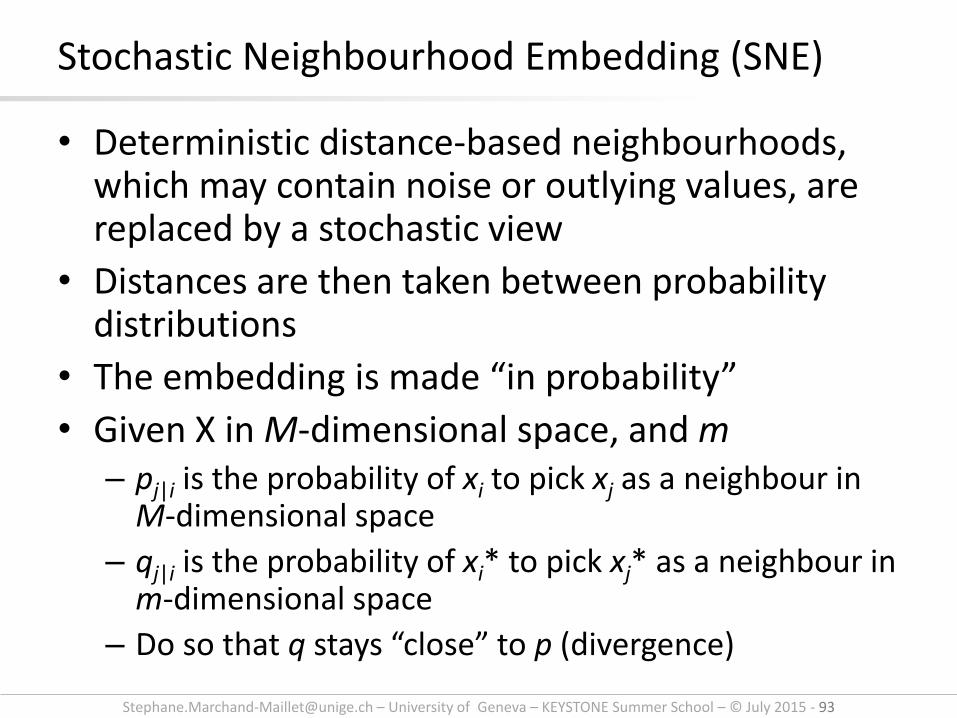
• Deterministic distance-based neighbourhoods, which may contain noise or outlying values, are replaced by a stochastic view
• Distances are then taken between probability distributions
• The embedding is made “in probability”
• Given X in M-dimensional space, and m – pj|i is the probability of xi to pick xj as a neighbour in
M-dimensional space
– qj|i is the probability of xi* to pick xj* as a neighbour in m-dimensional space
– Do so that q stays “close” to p (divergence)
Stochastic Neighbourhood Embedding (SNE)
Page 94
[email protected] – University of Geneva – KEYSTONE Summer School – © July 2015 - 94
• X* is found by minimizing F(X’) using gradient-based
optimisation
• The definition of P and Q relax the rigid constraints found using distances
• The exponential decay of likelyhood favors local structures
• t-SNE uses a Student t-distribution in the low dimensional space
SNE
k
xxd
xxd
ij
k
xxd
xxd
ijki
ji
i
ki
i
ji
e
eq
e
ep
),(
),(
|
2
),(
2
),(
| **2
**2
2
2
2
2
s
s
ij
ij
i j
ij
i
iiKLq
ppQPDXF
|
|
| log)()'(
Page 95
[email protected] – University of Geneva – KEYSTONE Summer School – © July 2015 - 95
• MNIST dataset
t-SNE example
[Illustration from L. van der Maaten’s website]
Page 96
[email protected] – University of Geneva – KEYSTONE Summer School – © July 2015 - 96
Traces of our everyday activities can be:
• Captured, exchanged (production, communication)
• Aggregated, Stored
• Filtered, Mined (Processing)
The “V”’s of Big Data:
• Volume, Variety, Velocity (technical)
• and hopefully... Value
Raw data is almost worthless, the added value is in juicing the data into information (and knowledge)
Big Data
Page 97
[email protected] – University of Geneva – KEYSTONE Summer School – © July 2015 - 97
Page 98
[email protected] – University of Geneva – KEYSTONE Summer School – © July 2015 - 98
However
Two main issues:
• High-dimensional data
– «Curse of dimensionality»
– Making distance measurements unreliable
– Making statistical estimation inaccurate
• Large data
– «Big data»
– Could compensate for sparsity problems
– But hard to manage efficiently
Page 99
[email protected] – University of Geneva – KEYSTONE Summer School – © July 2015 - 99
Solutions
Two main issues
• High-dimensional data
– Reduce the dimension
– Indexing for solving the kNN problem efficiently
• Large data
– Reduce the volume
– Filter, compress, cluster,…
Page 100
[email protected] – University of Geneva – KEYSTONE Summer School – © July 2015 - 100
Indexing structures
…+ M-tree Tries Suffix array Suffix Tree Inverted files LSH…
Illustration: Wikipedia
Page 101
[email protected] – University of Geneva – KEYSTONE Summer School – © July 2015 - 101
Main ideas:
• A point is described by its neighbourhood
• The neighbourhood of a point encodes its position
• We use only neighboring landmarks
– To be fast
• We don’t keep distances, just ranks
– To be faster
Permutation-based Indexing
Page 102
[email protected] – University of Geneva – KEYSTONE Summer School – © July 2015 - 102
Permutation-based Indexing
L(x1, R)= (𝑟1, 𝑟2, 𝑟3, 𝑟4, 𝑟5) L(x2, R)=(𝑟1, 𝑟2, 𝑟3, 𝑟4, 𝑟5) L(x3, R)= (𝑟5, 𝑟3, 𝑟2, 𝑟4, 𝑟1)
n=5:
D={x1, . . . , x𝑁}, N objects,
R = {𝑟1, . . . , 𝑟𝑛} ⊂ D, n references
Each 𝑜𝑖 is identified by an ordered list: L(x𝑖, R)= {𝑟𝑖1, . . . , 𝑟𝑖𝑛} such that d(x𝑖, 𝑟𝑖𝑗) ≤ d(x𝑖, 𝑟𝑖𝑗+1 ) ∀j = 1, . . . , n − 1
x
y
z
1x2x
3x
4x
5x
r1
r2
r3r4
r5
Page 103
[email protected] – University of Geneva – KEYSTONE Summer School – © July 2015 - 103
Permutation-based Indexing Indexing: Building ordered lists Querying (kNN): • Build the query ordered list • Compare it with points ordered lists
Using the Spearman Footrule Distance:
Solving kNN: “I see what you see if I am close to you”
j
ririSFD
rank
i jjRxLRqLxqdxqd || ),(),(),(),(
x
y
z
1x2x
3x
4x
5x
r1
r2
r3r4
r5
Page 104
[email protected] – University of Geneva – KEYSTONE Summer School – © July 2015 - 104
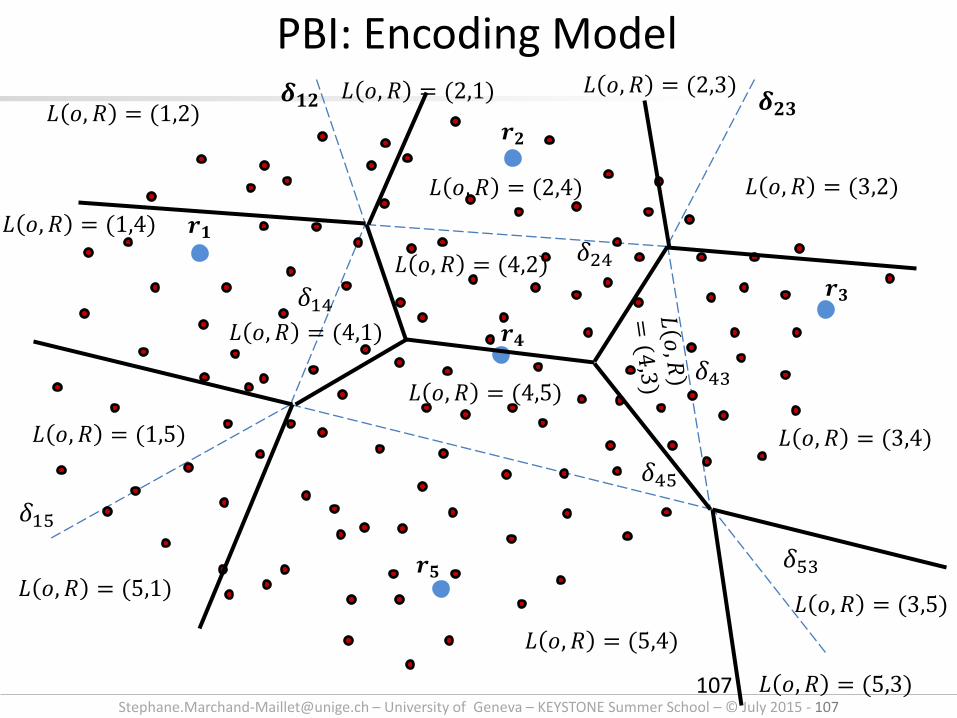
PBI in practice
Given a query point q, we seek objects xi such that L(xi,R) ~ L(q,R)
• We use inverted files to (pre-)select objects such that L(xi,R)|rj ~ L(q,R)|rj
• We prune the lists with the assumption that only local neighborhood is important
• We quantize the lists for easier indexing
• … (still an active development)
Page 105
[email protected] – University of Geneva – KEYSTONE Summer School – © July 2015 - 105
Efficiency of PBI
• Still uses distances for creating lists
• Issues with ordering due to the curse of dimensionality
However
• The choice of reference points (location, number) may be optimised
• Empirical performance are good
Page 106
[email protected] – University of Geneva – KEYSTONE Summer School – © July 2015 - 106
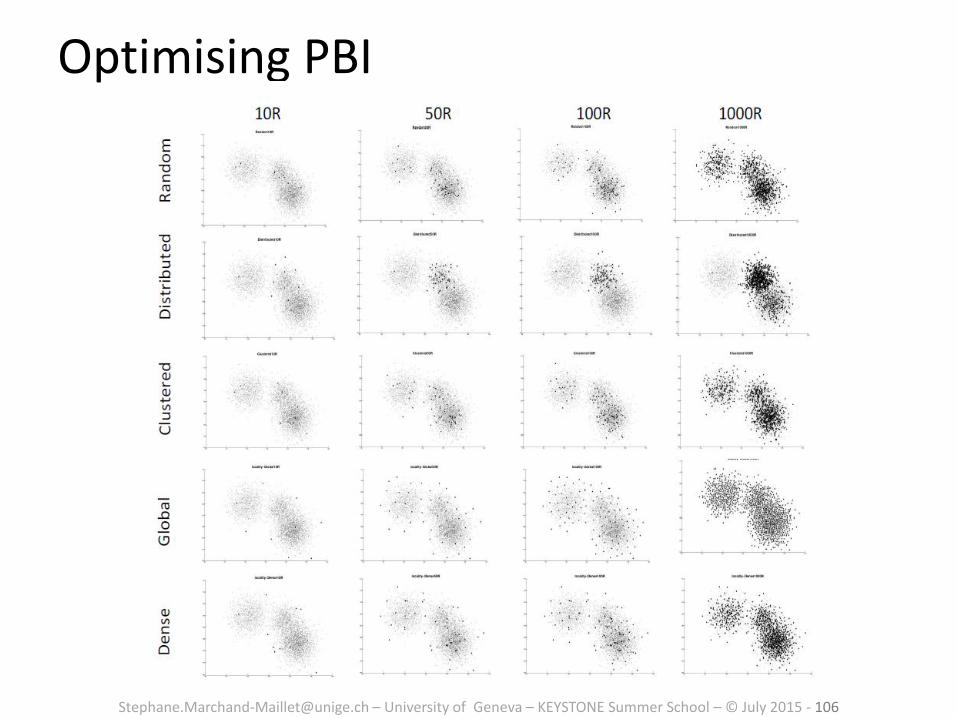
Optimising PBI
Page 107
[email protected] – University of Geneva – KEYSTONE Summer School – © July 2015 - 107
PBI: Encoding Model
𝒓𝟏
𝒓𝟐
𝒓𝟑
𝒓𝟒
𝒓𝟓
𝜹𝟏𝟐 𝜹𝟐𝟑
𝛿24
𝛿43
𝛿14
𝛿15
𝛿53
𝛿45
𝐿 𝑜, 𝑅 = (1,2)
𝐿 𝑜, 𝑅 = (1,4)
𝐿 𝑜, 𝑅 = (1,5)
𝐿 𝑜, 𝑅 = (5,1)
𝐿 𝑜, 𝑅 = (4,5)
𝐿 𝑜, 𝑅 = (4,2)
𝐿 𝑜, 𝑅 = (3,4)
𝐿 𝑜, 𝑅 = (3,2)
𝐿 𝑜, 𝑅 = (2,3)
𝐿 𝑜, 𝑅 = (2,4)
𝐿 𝑜, 𝑅 = (3,5)
𝐿 𝑜, 𝑅 = (5,3)
𝐿 𝑜, 𝑅 = (5,4)
𝐿 𝑜, 𝑅 = (2,1)
𝐿 𝑜, 𝑅 = (4,1)
107
Page 108
[email protected] – University of Geneva – KEYSTONE Summer School – © July 2015 - 108
Optimising PBI
Page 109
[email protected] – University of Geneva – KEYSTONE Summer School – © July 2015 - 109
Map-Reduce principle
Two-step parallel processing of data:
• Map the data properties (values) onto respective keys (data)
– (key,value) pairs
• Reduce the list of values for each of the keys
– (key, list of values)
– Process the list
Page 110
[email protected] – University of Geneva – KEYSTONE Summer School – © July 2015 - 110
Map Reduce – Word Count example
[Illustration: http://blog.trifork.com/2009/08/04/introduction-to-hadoop/]
• Keys: stems
• Values: occurrence (1)
• Reducing: sum (frequency)
Page 111
[email protected] – University of Geneva – KEYSTONE Summer School – © July 2015 - 111
MapReduce
• The MapReduce programming interface brings a simple and powerful interface for data parallelization, by keeping the user away from the communications and exchange of data.
1. Mapping
2. Shuffling
3. Merging
4. Reducing
Page 112
[email protected] – University of Geneva – KEYSTONE Summer School – © July 2015 - 112
Distributed inverted files
• Data size: 36GB of XML data. • Hadoop: 40 minutes. • The best ratio between the mappers and reducers is
found to be:
Page 113
[email protected] – University of Geneva – KEYSTONE Summer School – © July 2015 - 113
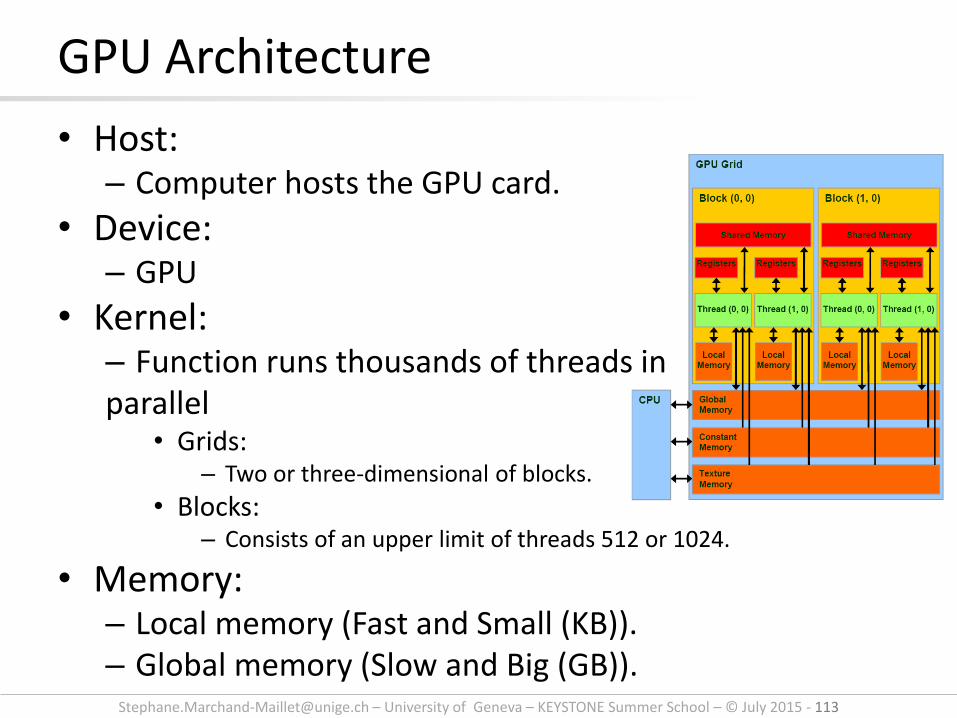
• Host: – Computer hosts the GPU card.
• Device: – GPU
• Kernel: – Function runs thousands of threads in parallel
• Grids: – Two or three-dimensional of blocks.
• Blocks: – Consists of an upper limit of threads 512 or 1024.
• Memory: – Local memory (Fast and Small (KB)). – Global memory (Slow and Big (GB)).
GPU Architecture
Page 114
[email protected] – University of Geneva – KEYSTONE Summer School – © July 2015 - 114
PDPS PIOF PDSS
𝑂𝑁𝑛
𝑃+ 𝑁(𝑛 log 𝑛 + 𝑛) + 𝑡1
𝑂𝑁(2𝑛 + 𝑛 log 𝑛 )
𝑃+ 𝑡2
= 𝑠 × (𝑁𝑙× 𝑚 + 𝑛 × 𝑚 +2(𝑁𝑙 × 𝑛 ))
= 𝑠 × (𝑁𝑙× 𝑚 + 𝑛 × 𝑚 + 𝑁𝑙 × 𝑛 + (𝑁𝑙 × 𝑛 ))
= 𝑠 × (𝑁𝑙× 𝑚 + 𝑛 × 𝑚 +(𝑁𝑙 × 𝑛)
Complexity:
Memory:
𝑂𝑁(2𝑛 + 𝑛 log 𝑛 )
𝑃+ 𝑡2
PIOF does the sorting while it calculate the distances!
Permutation Based Indexing on GPU
Page 115
[email protected] – University of Geneva – KEYSTONE Summer School – © July 2015 - 115
• Indexing looks at organising neighborhoods to avoid exhaustive search
• Indexing may be tailored to the issue in question
– Inverted files for text search
– Spatial indexing for neighbourhood search
Summary
Page 116
[email protected] – University of Geneva – KEYSTONE Summer School – © July 2015 - 116
• Hashing
– LSH, Random projections,
• Outlier detection
– Including in high-dimensional spaces
• Classification, regression
– With sparse data
Were not studied here…
Page 117
[email protected] – University of Geneva – KEYSTONE Summer School – © July 2015 - 117
Conclusion
“Distance is key”
– Defines the neighbourhood of points
– Defines the standard deviation around the mean
– Defines the notion of similarity
However
– Distance may have a non-intuitive behavior
– Distance may not be strictly needed
• Stochastic model for neighbourhoods (SNE)
• Ranking approach for neighbourhoods (PBI)
Page 118
[email protected] – University of Geneva – KEYSTONE Summer School – © July 2015 - 118
References
Big Data and Large-scale data – Mohammed, H., & Marchand-Maillet, S. (2015). Scalable Indexing for
Big Data Processing. Chapman & Hall. – Marchand-Maillet, S., & Hofreiter, B. (2014). Big Data Management
and Analysis for Business Informatics. Enterprise Modelling and Information Systems Architectures (EMISA), 9.
– M. von Wyl, H. Mohamed, E. Bruno, S. Marchand-Maillet, “A parallel cross-modal search engine over large-scale multimedia collections with interactive relevance feedback” in ICMR 2011 - ACM International Conference on Multimedia Retrieval.
– H. Mohamed, M. von Wyl, E. Bruno and S. Marchand-Maillet, “Learning-based interactive retrieval in large-scale multimedia collections” in AMR 2011 - 9th International Workshop on Adaptive Multimedia Retrieval.
– von Wyl, M., Hofreiter, B., & Marchand-Maillet, S. (2012). Serendipitous Exploration of Large-scale Product Catalogs. In 14th IEEE International Conference on Commerce and Enterprise Computing (CEC 2012), Hangzhou, CN.
More at http://viper.unige.ch/publications
Page 119
[email protected] – University of Geneva – KEYSTONE Summer School – © July 2015 - 119
References Large-scale Indexing
– Mohamed, H., & Marchand-Maillet, S. (2015). Quantized Ranking for Permutation-Based Indexing. Information Systems.
– Mohamed, H., Osipyan, H., & Marchand-Maillet, S. (2014). Multi-Core (CPU and GPU) For Permutation-Based Indexing. In Proceedings of the 7th Internation Conference on Similarity Search and Applications (SISAP2014), Los Cabos, Mexico.
– H. Mohamed and S. Marchand-Maillet “Parallel Approaches to Permutation-Based Indexing using Inverted Files” in SISAP 2012 - 5th International Conference on Similarity Search and Applications .
– H. Mohamed and S. Marchand-Maillet “Distributed Media indexing based on MPI and MapReduce” in CBMI 2012 - 10th Workshop on Content-Based Multimedia Indexing.
– H. Mohamed and S. Marchand-Maillet “Enhancing MapReduce using MPI and an optimized data exchange policy”, P2S2 2012 - Fifth International Workshop onParallel Programming Models and Systems Software for High-End Computing.
– Mohamed, H., & Marchand-Maillet, S. (2014). Distributed media indexing based on MPI and MapReduce. Multimedia Tools and Applications, 69(2).
– Mohamed, H., & Marchand-Maillet, S. (2013). Permutation-Based Pruning for Approximate K-NN Search. In DEXA, Prague, CZ.
More at http://viper.unige.ch/publications
Page 120
[email protected] – University of Geneva – KEYSTONE Summer School – © July 2015 - 120
References Large data analysis – Manifold learning – Sun, K., Morrison, D., Bruno, E., & Marchand-Maillet, S. (2013).
Learning Representative Nodes in Social Networks. In 17th Pacific-Asia Conference on Knowledge Discovery and Data Mining, Gold Coast, AU.
– Sun, K., Bruno, E., & Marchand-Maillet, S. (2012). Unsupervised Skeleton Learning for Manifold Denoising and Outlier Detection. In International Conference on Pattern Recognition (ICPR'2012), Tsukuba, JP.
– Sun, K., & Marchand-Maillet, S. (2014). An Information Geometry of Statistical Manifold Learning. In Proceedings of the International Conference on Machine Learning (ICML 2014), Beijing, China.
– Wang, J., Sun, K., Sha, F., Marchand-Maillet, S., & Kalousis, A. (2014). Two-Stage Metric Learning. In Proceedings of the International Conference on Machine Learning (ICML 2014), Beijing, China.
– Sun, K., Bruno, E., & Marchand-Maillet, S. (2012). Stochastic Unfolding. In IEEE Machine Learning for Signal Processing Workshop (MLSP'2012), Santander, Spain.
More at http://viper.unige.ch/publications