313
Transit Oriented Development Edited by Carey Curtis John L. Renne Luca Bertolini Making it Happen
Transit Oriented Development
Edited by Carey Curtis
John L. Renne Luca Bertolini
Making it Happen

TRANSIT ORIENTED DEVELOPMENT
Transport and Mobility Series
Series Editors: Professor Brian Graham, Professor of Human Geography, University of Ulster, UK and Richard Knowles, Professor of Transport Geography, University of Salford, UK, on behalf of the Royal Geographical Society (with the Institute of British Geographers) Transport Geography Research Group (TGRG).
The inception of this series marks a major resurgence of geographical research into transport and mobility. Reflecting the dynamic relationships between socio-spatial behaviour and change, it acts as a forum for cutting-edge research into transport and mobility, and for innovative and decisive debates on the formulation and repercussions of transport policy making.
Also in the series
The City as a TerminalThe Urban Context of Logistics and Freight Transport
Markus HesseISBN 978 0 7546 0913 1
Ports, Cities and Global Supply ChainsEdited by James Wang, Daniel Olivier, Theo Notteboom and Brian Slack
ISBN 978 0 7546 7054 4
Achieving Sustainable MobilityEveryday and Leisure-time Travel in the EU
Erling HoldenISBN 978 0 7546 4941 0
Policy Analysis of Transport NetworksEdited by Marina Van Geenhuizen, Aura Reggiani, and Piet Rietveld
ISBN 978 0 7546 4547 4
A Mobile Century?Changes in Everyday Mobility in Britain in the Twentieth Century
Colin G. Pooley, Jean Turnbull and Mags AdamsISBN 978 0 7546 4181 0
For further information about this series, please visit www.ashgate.com
Transit Oriented DevelopmentMaking it Happen
Edited by
CAREY CURTISCurtin University of Technology, Australia
JOHN L. RENNEUniversity of New Orleans, USA
LUCA BERTOLINIUniversity of Amsterdam, The Netherlands
© Carey Curtis, John L. Renne and Luca Bertolini 2009
All rights reserved. No part of this publication may be reproduced, stored in a retrieval system or transmitted in any form or by any means, electronic, mechanical, photocopying, recording or otherwise without the prior permission of the publisher.
Carey Curtis, John L. Renne and Luca Bertolini have asserted their right under the Copyright, Designs and Patents Act, 1988, to be identified as the editors of this work.
Published byAshgate Publishing Limited Ashgate Publishing CompanyWey Court East Suite 420Union Road 101 Cherry StreetFarnham BurlingtonSurrey, GU9 7PT VT 05401-4405England USA
www.ashgate.com
British Library Cataloguing in Publication DataTransit oriented development : making it happen. -
(Transport and mobility series)1. Transit-oriented development - Case studies2. Sustainable urban development 3. Regional planning - Case studiesI. Curtis, Carey II. Renne, John L. III. Bertolini, Luca388.4
Library of Congress Cataloging-in-Publication DataTransit oriented development : making it happen / edited by Carey Curtis, John L. Renne, and Luca Bertolini.
p. cm. -- (Transport and mobility)Includes bibliographical references and index.ISBN 978-0-7546-7315-6 -- ISBN 978-0-7546-9100-6 (ebook)1. Transit-oriented development. 2. Transportation--Planning. 3. City planning.
4. Regional planning. I. Curtis, Carey. II. Renne, John L. III. Bertolini, Luca.
HE305.T725 2009388.4--dc22
2008053685
ISBN: 978-0-7546-7315-6 (Hbk)ISBN: 978-0-7546-9100-6 (ebk.V)
Figure 3.5 reproduced with the permission of its author, Daniel A. Rodriguez.
Figure 7.5 reproduced with permission of Hiroki Matsuura of Maxwan Architects and Urbanists and Pedro Maia.
Figures 8.1, 8.3, 8.5 and 8.6 reproduced with the permission of the Singapore Urban Redevelopment Authority.
Figure 8.4 reproduced with the permission of the Housing and Development Board, Singapore.
Contents
List of Figures viiList of Tables xiList of Contributors xiiiPreface xviiAcknowledgements xix
PART I THe COnTexT fOR TRAnsIT ORIenTeD DeveLOPMenT1 Introduction 3
Luca Bertolini, Carey Curtis and John L. Renne
2 Planning for Transit Oriented Development: Strategic Principles 13Peter Newman
3 Public Transport and Sustainable Urbanism: Global Lessons 23Robert Cervero
PART II IMPLeMenTATIOn: TOOLs4 Implementing Transit Oriented Development through Regional Plans:
A Case Study of Western Australia 39Carey Curtis
5 Rail Friendly Transport and Land-use Policies: The Case of the Regional Metro System of Naples and Campania 49Ennio Cascetta and Francesca Pagliara
6 Retrofitting TOD and Managing the Impacts: The Case of Subi Centro 65Andrew Howe, Geoff Glass and Carey Curtis
7 From Concept to Projects: Stedenbaan, The Netherlands 75Verena Balz and Joost Schrijnen
8 An Asian Model of TOD: The Planning Integration in Singapore 91Perry Pei-Ju Yang and Seng How Lew
PART III IMPLeMenTATIOn: PROCesses9 Portland’s TOD Evolution: From Planning to Lifestyle 109
G.B. Arrington
Transit Oriented Developmentvi
10 Successful Delivery Mechanisms: Coordinating Plans, Players and Action 125Mike Mouritz and Louise Ainsworth
11 Promoting Transit Oriented Development at the Local Level: The Opportunities and Challenges for Local Governments 139Janet Edghill, Annette Kroen and Jan Scheurer
PART Iv IMPLeMenTATIOn: COMMunITy12 Transit Oriented For All: Delivering Mixed-Income Housing
in Transit Served Neighbourhoods 153Shelley Poticha and Jeff Wood
13 There Goes the Neighbourhood? Or Saving the World? Community Views about Transit Orientated Development 171Janet Rice
PART v IMPLeMenTATIOn: MARkeTs14 The Property Sector as an Advocate for TOD: The Case of South
East Queensland 187Bruce James
15 The Commercial Reality of TOD in Australia 201Warwick Hemsley
16 Developing TOD in America: The Private Sector View 209Marilee A. Utter
17 Transit Oriented Development in Tokyo: The Public Sector Shapes Favourable Conditions, the Private Sector Makes it Happen 225Paul Chorus
COnCLusIOn MAkIng TOD HAPPen18 Measuring the Success of Transit Oriented Development 241
John L. Renne
19 TODs for a Sustainable Future: Key Principles to ‘Make TOD Happen’ 257Luca Bertolini, Carey Curtis and John L. Renne
References 269
Index 283
List of Figures
1.1 Basic transport and land use correlations: TOD pursues a combination of transit and walking and cycling environments 5
1.2 Schematic representation of an integrated strategy exploiting the synergy between transport and land use features 6
1.3 Left: Compact city policy: ‘build in or next to existing city’; Right: Transit oriented development: ‘build within walking/cycling distance of station’ 7
2.1 Activity intensity and transport energy: Sydney 14
3.1 Copenhagen’s “transit first” spatial evolution: From finger plan, to five-axis radial investment, to corridors of satellite, rail-served new towns 24
3.2 HDB’s dwelling units and commercial developments since 1960 253.3 Arlington County, Virginia’s “Bull’s Eye” vision for the
Rosslyn-Ballston corridor 273.4 Bogota’s Transmilenio: Dual-carriageways at stations 303.5 Commercial properties studied in relation to Bogotá’s TransMilenio
system, 2002 313.6 Buses operating along linear corridors in Curitiba 33
4.1 Greater Perth Metropolitan Area 40
5.1 Residential densities in the Campania region 525.2 Network for the city of Naples 545.3 Transportation system model for the Campania region 565.4 Resident change in the rail station areas, 1991–2004 585.5 Property value change of low quality housing in the station areas,
1991–2004 585.6 Salvator Rosa before and after the station project 615.7 Changes of car ownership and transit ridership, 2000–2005 62
6.1 Subi Centro redevelopment area 666.2 Development concept plan 68
7.1 City Line stations 777.2a Plans drawn up by local and regional authorities 80
Transit Oriented Developmentviii
7.2b Plans drawn up by local and regional authorities 817.3 Spatial transformation areas along City Line 827.4 Nine potential developments 837.5 Overview of potentialities 84
8.1 Concept Plan, 1991 948.2 (a) Chronological rate of decentralization of population to distance
from central; (b) Chronological rate of decentralization of service sector employment density to distance from central 96
8.3 Morphological relationship of HDB new towns and MRT, 1960–2005 97
8.4 The relocation of Queenstown’s retail node from the fringe to around the station area after the operation of MRT system 101
8.5 Checkerboard prototype 9B, with MRT (left); Pedestrian network (middle); Sengkang new town planning (right) 102
8.6 Ridership and distance from city centre, 1990 (above); 2000 (below) 1048.7 Ridership and density, 1990 (above); 2000 (below) 105
9.1 The Round 1139.2 Madison Place 1149.3 Portland’s ridership growth outpaces auto use, percentage change,
1990–2006 116
10.1 TOD program elements 12710.2 Cockburn Central TOD 135
11.1 Key actors for TOD in the two case studies 147
12.1 Housing expenditure by neighbourhood type 15512.2 Housing units with one or less vehicles, 2000: Transit zones
vs. region 15512.3 Existing land use Fairmont/Indigo line, Boston, MA 15812.4 Existing land use South Corridor/Blue Line, Charlotte, NC 16112.5 Existing land use Downtown Streetcar, Portland, OR 164
13.1 Location of case studies in Melbourne 172
14.1 Net transportation per dwelling cost comparison of fringe and inner development (AUD$) 190
14.2 Costs and benefits for Varsity Station Village TOD 193
15.1 Transit oriented development 1920s style 20215.2 The Village at Wellard planned development 20315.3 Wellard: Staged land release to July 2005 207
List of Figures ix
15.4 Wellard: Increase in lot prices during staged release 207
17.1 Structure of Tokyo’s railway network 22617.2 The circular megalopolis concept 22817.3 Special FAR applied district 23217.4 The use substitution instrument applied in Marunouchi 23317.5 Tokyo station in 2011 234
18.1 Land value premium varies by the mix of land uses, density, and design 243
19.1 The toolbox for TOD implementation 265

This page has been left blank intentionally
List of Tables
2.1 Fuel efficiency and occupancy by mode in global cities, 1990 172.2 Modal capacities 182.3 Application of four part TOD strategy to Australian cities 22
3.1 Multiple regression results for predicting Metrorail station boardings and exits as functions of transit service levels and building activities for 7 Arlington County Metrorail stations, 1985–2002: Two-stage least squares estimation 29
4.1 Network City community planning strategy: Headlines 434.2 Implementing ‘Network City’: WAPC’s nine priority tasks 45
5.1 Metropolitan areas in the world: Population and residential densities 515.2 The RMS project, 2010: Infrastructures (invariant scenario) 535.3 Main lines opened 2000–2006 and lines under construction 555.4 Extra-urban public transportation modal share 575.5 Investment costs 59
8.1 Rate of decay of employment density and population density to distance from central according to Mills’ model 95
8.2 A flattening effect of the population density distribution, 1975–2003 98
9.1 Portland TOD toolbox snapshot 111
14.1 TOD related policy objectives 18814.2 Costs of development at the urban fringe 18914.3 Suggested criteria to maximize the success of TODs 19614.4 Comparison of TOD Corporation with Jones’ success criteria 199
18.1 Primary and secondary benefits of TOD 24218.2 TOD indicators available for collection in Western Australia 24618.3 Summary of key questions and recommended indicators
by stakeholder group 254

Transit Oriented Developmentxii
19.1 Occurrence of strategy elements and characteristics identified by Newman and Cervero in the cases 259
19.2 Classification of cases discussed in the book in terms of dominant challenge and existing transport and land use patterns 266
List of Contributors
Louise Ainsworth is Business Manager for Transit Oriented Development within the Western Australian state agency Landcorp. Landcorp is a development agency of state government.
g.B. Arrington is Parson Brinckerhoff’s most senior practitioner in the field of linking transit and land use.
verena Balz is a senior designer in spatial planning, urbanism and architecture at Atelier Zuidvleugel - a research and design studio for spatial and urban planning in the densely urbanized province of South-Holland.
Luca Bertolini is Professor of Urban and Regional Planning at the University of Amsterdam.
ennio Cascetta is Full Professor of Transportation Systems Engineering at the Department of Transportation Engineering of the University of Naples Federico II and since 2000 with the Ministry of Transportation of Campania region.
Robert Cervero is Professor at the University of California, Berkeley. He also chairs the National Advisory Committee of the Active Living Research Program of the Robert Woods Johnson Foundation, and is a Fellow with the Urban Land Institute and World Bank Institute.
Paul Chorus was a guest researcher at the University of Tokyu until April 2007. Currently he is continuing his PhD research at the Dutch National Railways and the University of Amsterdam.
Carey Curtis is Professor at Curtin University of Technology, Australia. She is also a Commissioner of the Western Australian Planning Commission and Chairs the Editorial Board of the journal Urban Policy and Research.
Janet edghill is a PhD student at Murdoch University in Perth, Western Australia, and the Director of Adaptive Sustainability Solutions.
geoff glass is currently Director Facilities and Planning at Western Australian Football Commission and formerly Director Development Services at City of Subiaco (1999–2006) during the major development phase of the Subi Centro project.
Transit Oriented Developmentxiv
Warwick Hemsley is the Managing Director of Peet and Company Ltd. He has overseen the rapid expansion of the company to its current position as one of Australia’s largest and most successful developers and syndicators of residential land projects. A total of 41 current and future land projects in growth corridors in major cities across Australia include local projects such as Perth’s first transit oriented estate, The Village at Wellard.
Andrew Howe is a Director within the private planning consultancy – The Planning Group – based in Perth Western Australia. He had a key role in the design concepts for Subi Centro TOD.
Bruce James is the Director of Transport Planning at the Queensland State Department for Transport.
Annette kroen is undertaking her PhD at RMIT University in Melbourne. Her PhD thesis investigates metropolitan governance and how it can contribute to a more efficient implementation of transit-oriented development in a city region.
seng How Lew has a Master of Architecture degree from the Department of Architecture, School of Design and Environment, National University of Singapore. He is currently practicing architecture and urban design in Singapore.
Dr Mike Mouritz is Executive Director, Urban Policy in the state planning agency – the Department for Planning and Infrastructure. His responsibilities include a key role in the TOD Coordinating Committee.
Peter newman is Professor of Sustainability at Curtin University of Technology, Australia. In 2006 – 2007, Professor Newman served as a Fulbright Fellow at the University of Virginia studying sustainability and government implementation.
francesca Pagliara is Assistant Professor at Department of Transportation Engineering of the University of Naples Federico II.
shelley Poticha is President and CEO of Reconnecting America along with its Center for Transit-Oriented Development. She is the former Executive Director of the Congress for the New Urbanism.
Dr. John L. Renne is an Assistant Professor of urban planning and transportation studies and Associate Director of the transportation research centre at the University of New Orleans. He is also the CEO of The TOD Group, a private firm specializing in the planning and development of TODs.
Janet Rice is a Councillor with the City of Maribyrnong in inner city Melbourne, Chair of the Melbourne Metropolitan Transport Forum, a Board Member of
List of Contributors xv
Victorian Local Governance Association and a member of State Council of The Greens Victoria.
Dr Jan scheurer is a lecturer and research associate in urban design and transport planning at the Australian Housing and Urban Research Institute (AHURI), RMIT University, Melbourne and at the Curtin University Sustainability Policy Institute (CUSP), Perth.
Professor Joost schrijnen is Director of the Department of Spatial Planning and Mobility at the Province of South-Holland and a part-time professor of Urban and Regional Planning at the Technical University of Delft.
Marilee A. utter is the President of Citiventure Associates, LLC. She has authored numerous articles featured in national real-estate and business publications, and is a sought out speaker on Mixed-Use and Transit-Oriented Development issues.
Jeff Wood is a Program Associate/GIS Specialist at Reconnecting America’s Center for Transit-Oriented Development.
Perry Pei-Ju yang is Associate Professor in the City and Regional Planning Program at the Georgia Institute of Technology, US. He is a member of two editorial boards for the journals: Progress in Industrial Ecology and Modern Urban Research. In January 2007, he was appointed the new board member of the International Urban Planning and Environment Association (UPE), an academic community with a special interest in sustainable urban development.

To planners around the world – get out there and Make it Happen!
Preface
The purpose of this book is to bring a new focus to the practice of city planning around sustainable transport – namely how to actually get Transit Oriented Development implemented! There are many excellent contributions to the field espousing the merits of TOD and explaining what the concept is, but few that seek to guide practitioners and advocates on the practice of ‘Making it Happen’. Our aim with this book is to inspire those people by showing case studies of implementation. In each case we have asked the authors to draw out the elements that ‘Make it Happen’. With draw these elements together in the final chapter in order to provide lessons of wider value.
The need to achieve sustainable transport within our cities is evermore important as we face the twin concerns of ‘peak oil’ and global warming. Not only this, TOD is an important strategy for individuals as they seek alternatives to the high cost of car travel. While everyone talks about TOD there remain many obstacles to its implementation. Our book seeks to identify what these obstacles are and how to overcome them in order that TOD occurs in everyday practice. The time for talk about the virtues of a concept is over – we hope this book will give guidance on achieving change.
Transit-Oriented Development: Making it Happen includes chapters from prominent authors and practitioners in land use and transportation planning from around the world. Their work is based upon their research and practice-based experience, in this way providing the essence of the reflective practitioner. Each chapter has been peer reviewed. The editors have worked with individual authors to ensure the flow and continuity of the book.
Carey Curtis, April 2009

This page has been left blank intentionally
Acknowledgements
I thank the authors for their contributions; I know all of them in their own ways are working with passion to contribute to our field in order to make that difference. I thank my co-editors – what a team! We had the benefits of literally working a 24 hour day given our spread across the world. I acknowledge my colleagues at Curtin University who have supported me as I whiled away many hours ‘working on the manuscript’. I dedicate the book to my family, especially to my Dad (Arthur ‘Tom’ Burch) who would have been really proud to see this, to my son Janni and partner David for their support.
Carey Curtis, April 2009
I would like to dedicate this book to my wife Kara, who not only is a fantastic spouse, but also my best friend and colleague. I am grateful to my co-editors; Carey Curtis and Luca Bertolini, for their hard work and dedication in making this book a reality. I thank all of the authors for their contributions. I thank both John Pucher and Peter Newman for being mentors. I would not be where I am today if it were not for my family and close friends. I want to thank God for providing me with a loving and supportive network of family, friends, and colleagues. I feel like one of the luckiest people in the world to be surrounded by such caring people. Finally, I plan to sign the very first copy to Mr. Paschal who has been expecting this book for 15 years.
John L. Renne, April 2009
My foremost acknowledgement goes to my fellow editors, Carey Curtis and John Renne. Without their determination and energy this book wouldn’t have even (and literally!) been thinkable. Next, I am immensely thankful to all authors, all very time pressed academics and professionals, for their willingness to share their unique experiences and insights. It has been exhilarating to feel such a unity of purpose across such a variety of contexts! Finally, and as always, I’d like to express a huge thank Valentina, Saskia and Mattia. Their support for my life’s undertakings is unconditional ... even when they don’t entirely understand the rationale behind them.
Luca Bertolini, April 2009

This page has been left blank intentionally
PART I The Context for Transit Oriented
Development

This page has been left blank intentionally
Chapter 1
IntroductionLuca Bertolini, Carey Curtis and John L. Renne
focus of the book
In cities around the world, the integration of transport and land use development at railway stations is high on the agenda of state and local governments, be it under the banner of ‘Transit Oriented Development’ (TOD) as in North America and Australia (Cervero, 2004; Dittmar and Ohland, 2004; Dunphy et al., 2005), or without, as in the numerous railway station area development projects across Europe, Asia and South America (Bertolini & Spit, 1998; Cervero, 1998; van den Berg & Pol, 1998; Bruinsma et al. 2007). The basic philosophy appears the same in all contexts: concentrating urban development around stations in order to support transit use, and developing transit systems to connect existing and planned concentrations of development.
Many of the arguments for pursuing TOD are similar despite the different contexts. TOD facilitates increased accessibility because it provides alternatives to automobile-based land uses. It attempts, at the very least, to create a land use pattern that facilitates transportation choice, which is increasingly important, particularly given today’s complex lifestyles and business practices. Even more compelling are arguments stemming from concerns about the sustainability of current urban mobility trends. Planners and policy makers across the globe are advocating for transit and non-motorized transport based on resource efficiency. A third, less explored, but in our view no less important argument relates to the implications of transport and land use patterns for the quality of urban life. The claim here is that TOD allows, at least potentially, a degree of human interaction in the public domain – or ‘urbanity’ – that is difficult, if not impossible to achieve in much more socially segregated car-dependent urban environments (Bertolini, 2000).
Further discussion of these claims, while important, is, however, not the primary focus of this book. Neither is our focus to further articulate what TOD as a planning and development concept entails. We believe that a healthy literature exists which examines benefits of TOD (see, for instance the overview on www.vtpi.org/tdm/), and there is certainly enough literature and examples to refer to as far as articulation of the concept is concerned (e.g. Calthorpe 1993, and the literature cited above). We, rather, want to deal with a third set of issues: the actual strategies that are needed for establishing TOD as a pattern of urban development, or ‘making TOD happen’. The focus of this book is thus not so much on why, or what, but rather on how. This is just as important, but much less debated, more poorly conceptualized,
Transit Oriented Development4
and comprises a more fragmented documentation of the issues. If the trend breaking impact that most TOD endeavours posit is to be achieved, this gap in knowledge urgently needs to be filled. This book is a contribution in this direction.
To expand upon this point, we argue that while an understanding of TOD as a physical concept is important, this alone will be insufficient unless we can show how TOD can be achieved across a range of situations. When attempting to achieving changes in practice these are often met with resistance; barriers are put in the way. There is an increasing interest in such barriers to change, not least because unless we understand these will we not find a way forward. Guy and Marvin (2000) argue that attention must also be “paid to social, economic and technical processes involved in shaping the feasibility of the concept” (p. 10) Both Banister (2005) and van Vliet (2000) remind us that there are many complexities and potentially conflicting interests which limit our ability to turn knowledge into action. Rietveld and Stough (2005) note that it is the institutional barriers that are a major impediment to action. Thus, in order to ‘make TOD happen’ these barriers must be overcome. This requires a need to address the ‘rules’ (legislation, policy, practice, roles and responsibilities) and the relationships (between organizations, between players within institutions, and between organizations and the wider community). This book starts to unravel these complexities by looking at the way in which cities around the world have found a way forward. In order to set the scene, below we briefly summarize the transport and land use development challenge of TOD, and from there we move on to introduce in more detail the governance challenge central to this book.
A transport and land use development challenge
Basic characteristics of the transport and land use systems determine the competitive position of transit relative to the car, and thus set the backdrop to the spatial challenge of TOD. There are two basic correlations (Figure 1.1; Bertolini and Le Clercq, 2003). The first is between the speed of a transportation system and the scale at which an urban system works, for instance, expressed in terms of distances between places of residence and places of work. The second basic correlation is that between the capacity and flexibility of a transportation system and the degree of spatial concentration of activities, as for instance, identified by residential and employment densities. The car – a low capacity, high flexibility, and high-speed transportation means – is best fit to high spatial reach/low density urban environments. Transit matches the speed of the car, has higher capacity, but lower flexibility. Non-motorized modes have both high capacity and high flexibility but miss speed and spatial reach. In order to provide a competitive alternative to the car (i.e. both fast and flexible transport) the strengths of transit and slow modes need to be combined. This is one central idea of TOD. However, this transport combination can only be successful in the presence of short distance and/or high-density spatial patterns.
This brief conceptualization points at the fundamental aspects of the transport and land use challenge of TOD. In terms of land use change it is above all a
Introduction 5
matter of increasing densities and functional mix. In terms of transport change it is a matter of improving the competitiveness of alternatives to the car, by increasing their flexibility (most notably of transit) and their effective, door-to-door speed (especially of non-motorized modes). This need not be so much the case in absolute terms, but relative to the car, implying that also policies aimed at either reducing the flexibility of the car (such as carpool-only lanes or parking restrictions) or its speed (such as speed limits) are favorable. A more general, and crucial, conclusion is that coordination between transport and land use choices and conditions is essential for TOD to be successful. Figure 1.2 schematically visualizes the spatial implications of these conclusions. Figure 1.3 contrasts this strategy with a traditional compact city strategy.
A governance challenge
For all its potentials, the integration of transport and urban development at station areas advocated by TOD is, however, a very complex challenge. Station areas
figure 1.1 Basic transport and land use correlations: TOD pursues a combination of transit and walking and cycling environments
Transit Oriented Development6
are both nodes and places (Bertolini and Spit, 1998): nodes of networks, and places in the city. Station areas are (or may become) important ‘nodes’ in both transport and non-transport (e.g. lifestyle, business, consumption) networks. On the other hand, station areas also identify a ‘place’, both permanently and temporarily inhabited area of the city, a dense and diverse conglomeration of uses and forms accumulated through time, which may or may not share in the life of the node. Accordingly, a multifarious array of both node- and place-based actors crowd the station precinct redevelopment processes. The state/local government and transportation agency are two examples. Depending on the local context, other actors may have a decisive role. These include different levels of the public
figure 1.2 schematic representation of an integrated strategy exploiting the synergy between transport and land use features
Introduction 7
administration, different transportation providers and most importantly, market actors: developers, investors, and end-users. Furthermore, and particularly at station locations set in existing areas, local residents and businesses will also have a significant stake. The objectives of this heterogeneous array of actors are often conflicting and at best uncoordinated. Even when there is enough agreement on the goals, existing organizational structures, regulations, professional practices, or public attitudes, may prove insurmountable barriers.
The cases and analyses in the book have been solicited in order to shed light on these challenges and on possible ways of addressing them by:
Providing a documentation and review of both established and emerging approaches to TOD implementation in four different continents;Organizing and structuring the cases in such a way that taken together they can amount to a state of the art, ready-to-use toolbox for TOD;Providing cases written from the ‘insiders’ perspective, in order to better penetrate the workings and the genesis of the approach;Focusing on the specific land use and transport choices and conditions that can support each other in establishing a self reinforcing process conducive to TOD;Addressing choices and conditions at different scales (single project, corridor, urban region, and state) and in different societal domains (public, private, non-profit);
•
•
•
•
•
figure 1.3 Left: Compact city policy: ‘build in or next to existing city’; Right: Transit oriented development: ‘build within walking/cycling distance of station’
Transit Oriented Development8
Understanding how such choices and conditions develop, what are barriers to their development and how these barriers can be overcome;More specifically understanding the role of different public, private and non-profit actors in developing such choices and conditions;Understanding how different actors can be enticed into TOD, and conversely how TOD can be made functional to different interests;Understanding how specific context characteristics (e.g. socio-economic, institutional, spatial) might affect the TOD development process and its outcome;Understanding how differences in context impact on the scope of generalization and transferability of all these lessons.
structure of the book
The book is divided in 6 parts. The first part includes three chapters that set the context for the rest of the book.
In Chapter 2 Peter Newman shows how developing centres linked to transit is essential for achieving sustainable transport, and how implementing these TODs requires a strategic planning framework as a set of policy tools. Accordingly, he suggests that each city should review its planning and transport strategies to ensure it has: a strategic planning framework that asserts where centres need to occur, in what density and mix; a strategic planning framework that links its centres with a rapid transit base, almost invariably with electric rail; a statutory planning base that requires development to occur at the necessary density and design in each centre, preferably with a specialized development agency; and a public-private funding mechanism that enables the transit and the TOD to be built or refurbished through a linkage between the transit and the centres it will service.
In Chapter 3 Robert Cervero, cites evidence from experiences around the world to show that integration of public transport and land use yields tremendous sustainability benefits. As long as TOD confers both public and private benefits, there is no replacement for public-private partnerships in advancing TOD implementation. Each party brings unique talents, insights, and resources to the table. Of course, public interventions are a necessary ingredient of successful TODs. In this regard, global experiences demonstrate that leadership, combined with forward-looking urban planning and efficient pricing of scarce resources, provides the necessary complement to make TOD a viable and sustainable form of urbanism.
The second part of the book further articulates these general guidelines by discussing the implementation of TOD tools in a variety of urban and national contexts.
In Chapter 4 Carey Curtis examines the way in which the Western Australian State Government has embraced the need to plan for TOD at the regional/metropolitan level. She traces the State’s unique model of regional planning since
•
•
•
•
•
Introduction 9
the 1950s and the way in which the regional strategy has been re-focused around TOD, so replacing the model of dispersed development framed around private car travel. An account of the way in which the new regional planning strategy, Network City, is restructuring the city around TOD principles is given. The chapter discusses the way in which the strategy is being implemented and in so doing highlights the new challenges this presents for planning and transport practices.
In Chapter 5 Ennio Cascetta and Francesca Pagliara describe the development of the Regional Metro System (RMS) of Campania, in Italy. The RMS is a far-reaching undertaking focussed on the integration of the existing railway lines into a single network by building some new interconnecting links, new stations and new modal interchange facilities, and by integrating transport development with urban development. The account focuses on the methodology and tools adopted to assess internal and external impacts of the RMS network and to plan and design it. The RMS’s impact forecast is analysed in terms of travel demand (i.e. modal split changes), level of service and externalities (i.e. impacts on non-users). The ongoing projects are presented as are the impressive results achieved between 2001 and 2006. The possible lessons for other contexts are highlighted.
In Chapter 6 Andrew Howe, Geoff Glass and Carey Curtis address the question of how to manage the impacts of creating a new TOD precinct within the existing urban fabric. Subi Centro, a new TOD precinct in Western Australia, is held up as the best ‘living’ example of TOD in Australia. The chapter considers the perceived issues and concerns in the pre-development phase, including impacts on existing retail and community reaction to major changes. An account of the design approach (land use, linkages, parking) and the implementation model (redevelopment authority) is given. The outcomes are measured post implementation, including retail impact, rental growth, travel behaviour, land values, planning codes and trading regulation. The reasons for success are examined.
In Chapter 7, Verena Balz and Joost Schrijnen discuss the ‘Stedenbaan’, a unique development taking shape in the southern section of the Randstad urban agglomeration, in the Netherlands. The construction of a new high-speed rail link to Paris released extra capacity on the existing railway network. The Stedenbaan plan uses that capacity for a high-frequency regional train service. The number of stations will be increased and housing and offices will be built in and around the stations. The plan aims at radically breaking with current mobility and urban development trends. The idea is that the Stedenbaan services will be so frequent that users will no longer need to worry about departure times. As a result of this, and by locating housing, work and facilities in higher densities at and around station locations, many more people are expected to use public transport as an alternative for the car. The chapter discusses how the Stedenbaan concept emerged and is being further articulated, and how the challenges of implementation are being addressed.
In Chapter 8 Perry Pei-Ju Yang and Seng How Lew explore some of the success factors behind the exemplary TOD case of Singapore. Singapore is world famous for its efficient public transportation system and its integration of land use planning,
Transit Oriented Development10
urban design and housing development. The urban growth pattern of Singapore has been highly influenced by a unique mode of planning and development of new towns, which focuses on the public transit system. The chapter investigates Singapore’s urban planning policy, the spatial and mobility consequences of urban density distribution, urban design and new town planning driven by TOD principles. According to the author, it is especially the strong articulation between land use density and its distribution, pedestrian environment design and transit ridership which has effectively shaped the integration of the practices of land use planning, urban design, and public transit operation in Singapore.
In the third part of the book, the focus is shifted from implementation tools to implementation process. In Chapter 9, GB Arrington, observes that Portland, Oregon is recognized as a model for regional and community planning, especially with respect to integrating land use and transportation planning. TOD is at the centre of the strategy. The author asks how this could be achieved in a country that is famed for its car-dependency and sprawl. The chapter focuses on the role of various stakeholders in creating a region of TODs. The main players are identified and an examination of their approach provided. Finally the extent to which the Portland approach can serve as a model for other urban regions in the US and elsewhere is discussed.
In Chapter 10, Mike Mouritz and Louise Ainsworth, remark that many TOD ambitions are often dramatically lowered, if not outright abandoned in the transition from the planning to the implementation phase. In order to counter this, Western Australia’s TOD Coordinating Committee (a forum of planning and land development agencies, the public transport agency and local government) highlights the value of coordination and collaboration in implementation. Through this mechanism a methodology was developed for identifying TOD potential, and a planning framework was developed aimed at integrating land use and transport, action was achieved by coordinating agency capital. Achieving development change occurred through different agency models and case studies of Leighton and Cockburn Central TODs highlight these different models in practice.
In Chapter 11, Janet Edghill, Annette Kroen and Jan Scheurer contend that local government has a vital role to play in implementing TOD strategies yet local government wields limited influence on the supply of public transport infrastructure or services. The authors outline an adaptive framework and processes in order for local government to optimize a TOD friendly environment within their realm of influence. Using case studies from Australia and Germany they demonstrate how local government can collaborate with other agencies and stakeholders, both informally and informally, to improve land use and transport integration.
The fourth part of the book turns to the role of the local community in implementing TOD. In Chapter 12, Shelley Potichia and Jeff Wood, observe that housing in TODs in the United States could become increasingly unaffordable to lower income households – those who need access to transit the most. This is due to the length of the approval process, which creates a context where mostly luxury housing projects can afford to absorb the time, uncertainty and cost of risk
Introduction 11
inherent in building TOD. This chapter frames the rationale for making mixed-income TOD in the U.S. a policy priority, summarizes the findings from three case studies, and identifies a series of strategies for practitioners seeking to ensure that transit-oriented development is available to all.
In Chapter 13, Janet Rice addresses the difficult issue of whether, when trying to introduce TOD, the local community will support it, and, perhaps more importantly, which arguments might be behind their support, or denial of it. TOD is at the core of the regional plan for the development of metropolitan Melbourne. Using case studies of Footscray, Camberwell and Sydenham, the chapter outlines the range of community views towards TOD (from strongly supportive to determinedly against) and the underlying reasons why these views are held. For some this is the sheer dislike of change, for others it is fear of traffic chaos resulting from increased density, or for the cultural attachment to wide open spaces and wide roads. Learning from this experience, the author identifies the main ways to increase community support for TOD.
In the fifth part of the book, the role of the market dimension in TOD implementation is explored.
In Chapter 14, Bruce James starts by observing that TOD is a concept originating in the planning domain and long promoted just by planners, or at best by a few enlightened, atypical developers. He argues that this is no longer the case. One of the most interesting present trends is the emergence of a definite market demand for TOD, and of a growing number of developers willing to cater to this demand. The level of interest in TOD in South East Queensland has been driven in part by the private property sector that have a strong interest in redevelopment of existing urban areas (Brisbane, Gold Coast). The chapter uses case studies to examine the different approaches to development from local authority facilitation, to redevelopment agencies to transit agency initiation, to private sector development.
In Chapter 15, Warwick Hemsley contends that finding ways of actively involving the private sector is proving a key factor of successful TOD implementation. There are now several examples of TOD precinct developments in Western Australia but the Village at Wellard represents the first outer suburban and greenfield TOD coinciding with the development of a new railway in Perth’s south-west corridor. The chapter describes the way in which a ‘joint venture’ approach was employed in order to optimize the competitive advantages and strengths of the public and private sectors in developing the Wellard precinct. The use of a negotiated outcomes approach ensured agreement on both design of development and its staging in relation to patronage outcomes.
In Chapter 16, Marilee Utter remarks that despite much excitement for TOD in the Untied States, the market reality is that TOD is only now gaining momentum. Mixed-use precincts around transit stations are still rare outside of older, well-established transit cities. Despite the major investments made by the public sector to build the transit systems and plan the station areas, it nonetheless ultimately falls to the private sector to actually build the villages they have envisioned. And
Transit Oriented Development12
of all the players essential to produce TODs, the private sector developers may be the least well understood. This chapter examines these issues through the lens of the market-driven, private developer, and suggests strategies to address the challenges. This chapter begins by discussing the demographic and market support for TODs in the United States, looks at requirements for successful TODs, examines the developer’s risk-return trade-off, describes the developers best suited for TOD, introduces public-private partnerships, and projects future trends of TOD in America.
In Chapter 17, Paul Chorus, observes that most urban redevelopment projects carried out in Tokyo focus on areas around railway stations and in particular the areas around the existing sub-centres. The government has introduced several instruments to promote private sector involvement in these projects. In the chapter the workings of these instruments are illustrated. The author contends that transit-oriented development as a specific planning concept does not need to be encouraged in Tokyo as it will happen anyway given the huge built-in incentives. The zoning system and its associated floor-area-ratio values give the private developer basically the freedom to determine whatever they want to develop. In this flexible approach the role of the government is to facilitate development rather then than carry it out themselves. What is interesting about this planning style is that in the end both the government and the private sector seem to benefit: the government receives public infrastructure for which it does not need to pay while the private sector in return receives an additional floor area, which provides a greater profit.
In the sixth and final part of the book conclusions are drawn.In Chapter 18, John L. Renne presents a framework to measure TOD success
based on the different perspectives of various stakeholders, including 1) State and regional government, 2) Transit agencies, 3) Local government, 4) Communities and 5) Private developers. The chapter poses key questions about TOD goals for each stakeholder group and then recommends indicators to measure progress towards these goals.
In Chapter 19, Luca Bertolini, Carey Curtis and John L. Renne review the findings from the different chapters and identify the transferable lessons for the TOD strategy as a whole and the particular tools needed to address specific issues. The aim is to provide a toolbox for ‘Making TOD Happen’.
Chapter 2
Planning for Transit Oriented Development: Strategic Principles
Peter Newman
Introduction
Transit Oriented Development (TOD) requires a commitment to centres and to transit as its core ingredients together. Building centres linked to transit requires a strategic planning framework as a set of policy tools to help implement these TODs. This chapter sets out four strategic planning tools for implementing TODs. The model is applicable anywhere but is applied to Australian cities to demonstrate their application.
The four strategic planning tools for TODs are:
A strategic policy framework that asserts where centres need to occur and at what kind of density and mix;A strategic policy framework that links centres with a rapid transit base, almost invariably electric rail ;A statutory planning base that requires development to occur at the necessary density and design in each centre, preferably facilitated by a specialized development agency, andA public-private funding mechanism that enables the transit and the TOD to be built or refurbished through a linkage between the transit and the centres it will service.
A strategic Policy framework that asserts where centres need to occur and at what kind of density and mix
Why do we need centres in a strategic plan?
Centres provide services and amenity based on economies of scale and density
Most urban services and amenity cannot be provided unless a certain minimum number of people are there to make them viable. This has been understood for centuries as the basis of the existence of cities as distinct from rural areas (Jacobs, 1984; Mumford, 1961). However in the era of the automobile where transport to
1.
2.
3.
4.
Transit Oriented Development14
services and amenity could be assumed to be by car, the provision of centres of activity has been downplayed or decried (Troy, 1996). The UK Town and Country Planning Association’s motto was ‘nothing gained by overcrowding’ (King, 1978) this became the signal in many Anglo cities for the planning of car dependent suburbs and the denial of the need for centres.
Car dependence has reached its limits. Cities are now breaking down because of car dependence and the problems of climate change and peak oil are undermining the extremities of cities built this way. Governments and the market cannot provide the services and amenities of centres in any kind of viable system if houses and jobs are scattered and spaced without focus. In particular they cannot provide a decent public transport system and hence households are increasingly vulnerable to the price of driving, especially fuel prices. Thus centres are being reinvented in car dependent cities in Australia, North America and those parts of European cities developed around the car, to help create the viability required across the city (Newman et al, 2003).
The question that then follows is what kind of density and mix of activity can give rise to urban services and amenity in centres? Data from a series of studies have been collected to provide a basis for this (Newman and Kenworthy, 2006). We have found that there is a clear exponential increase in the use of cars and hence transport energy as the density declines. This holds when we compare cities and when we examine patterns of transport and land use within cities. In Figure 2.1 the kind of data found across many cities is used to illustrate how transport fuel use and density are linked. These data are from Sydney where the transport fuel per capita used by residents in each of the city’s local government areas are graphed against the density of population and jobs in those local governments known as activity intensity.
The curve is found to be universal and suggests a critical density at which car use increases dramatically. The data from global and Australian cities by local government area suggests:
figure 2.1 Activity intensity and transport energy: sydney
Planning for Transit Oriented Development: Strategic Principles 15
A minimum of 35 people and jobs/ha of urban land is required before transit, walking/biking and short car trips combine to reduce the need for driving;This kind of density is associated with a minimum range of urban services and amenity in a local centre;If established within the limits of a 1 km radius, a local centre can be created with about 10,000 people and jobs; andIf within a 3 km radius, then a town centre can be created with around 100,000 population and jobs.
These relationships are explained further in Newman and Kenworthy (2006).
Centres enable car dependence to be reversed without destroying the character of suburbs
The kind of TOD strategy outlined here suggests that if centres of an appropriate density and mix can be created then not only are viable centres created but the pressure on suburbs for unpopular infill is considerably reduced. Many suburbs will continue to be redeveloped, especially those where populations and services are declining, however the wholesale rebuilding of suburbs can be avoided if centres are the focus of development. The kind of city envisaged by a TOD oriented future can build on the character of many suburbs yet still provide the services and amenity people are demanding, particularly a viable transit system. But central to this is the building of viable centres.
A strategic Policy framework that links centres with a rapid transit base, almost invariably electric rail
Why do we need rapid transit in a strategic plan? Rapid transit is being built for the following reasons:
It assists cities in their wealth creation
Car dependence is expensive. The link between a city’s wealth and its car use is very weak, it is certainly not statistically significant and only 18 percent of the variation is explained (see Newman and Kenworthy, 1999, 113). European cities tend to be the wealthiest in the world yet have half the car use of US cities. Wealthy Asian cities like Hong Kong, Tokyo and Singapore have ten times the per capita wealth of Bangkok, Jakarta, Kuala Lumpur, Manila, Surabaya, Seoul and Beijing, but per capita car use is less. Many wealthy cities have put their wealth into good transit infrastructure. The result is not a city that is poorer because it wastes money on public transport as suggested by many economists, particularly Treasury officials. Indeed the data suggest that the more a city has committed itself to public transport infrastructure the less the city spends overall on transport; and the more a city has
•
•
•
•
Transit Oriented Development16
built itself around car dependence the more of the city’s wealth is wasted on just getting around (Newman and Kenworthy, 1999). Car travel is estimated to cost around 85c per passenger kilometre compared to 50–60c (in Australian currency) per passenger kilometre in transit (House of Representatives, 2005).
There is an equity argument here too as the poor in Australian and American cities are increasingly moving out to car dependent areas where they save money on housing but lose heavily on transport, some families spending up to 40 percent of their income on transport (see STPP and Center for Neighborhood Technology, 2005). Households in car dependent cities in the US are now spending more on transport than on their mortgages which helps explain why oil price increases have helped to create the sub prime mortgage meltdown in late 2007. Continuing non-viability of such car dependent urban sprawl threatens the abandonment of whole suburbs similar to the kind of inner city abandonment found in US cities in the 1960s.
On the other hand TODs can offer cities economic advantages without this vulnerability. Much of the marketing benefit of TODs has been outlined by a study which showed that people living in TODs in the US had the same age and income as those not living in TODs but had one less car per household (0.9 cf 1.7) (STPP and Center for Transit Oriented Development, 2005). This was found to lead to a 20 percent increase in their available household wealth. As a tool for marketing TODs it is not just of value to households, local governments soon find that this extra available household wealth is largely spent on local goods and services whereas buying a car would not do the same thing. Hence TODs are a means of helping create local economic development.
It reduces the external costs of car dependence
It has been well documented that car dependence is costly in terms of environmental, social and economic externalities, for example McGlynn and Andrews (1991) suggest an extra 20c per passenger kilometre (Australian currency). Government costs due to accidents, pollution and noise have been estimated and compared to the government revenue benefits of the road system in Australia and there was an overall ‘road deficit’ of $8 billion in the late 1990s (Laird et al, 2001). The biggest looming problem of car dependence is oil vulnerability and here the ‘coalition of the willing’ are US and Australian cities which have by far the biggest vulnerability to the looming global oil production peak (Newman, 2007). Electric rail systems with TOD built around stations, will withstand this crisis far better than urban areas with extensive car dependence. Electric rail continues to be the most efficient form of motorized transport as it alone does not have to carry its own fuel. The data from our Global Cities Database are outlined in Table 2.1.
It saves time
People do not want to travel more than an hour a day on average – this has become known as the Marchetti Principle (Marchetti, 1994). The switch to more sustainable
Planning for Transit Oriented Development: Strategic Principles 17
modes of transport will not occur if it means people go beyond their travel time budget. Thus a city will only be truly moving towards a less car dependent future if it can:
Build a rapid transit system down every corridor faster than traffic, andBuild centres where walking, biking or a short bus or car trip become the means of reaching urban services as they are local and hence quick to reach.
TOD can thus be used to save time for local and long distance travel. But TOD centres only attract the necessary development potential around them if they are linked by fast transit. Almost invariably this is electric rail due to its speed (acceleration/deceleration, cruising speeds and egress/ingress speeds which are all significantly better than buses). Bus cities have transit speeds of around 20–25kph whilst rail cities have transit speeds of 35–40kph which are competitive with overall traffic speeds (Kenworthy and Laube, 1999). Rail gives transit an edge in speed which is crucial to being competitive. In many developing country cities and in some corridors where rail is not available bus rapid transit is providing the extra speed required over the traffic though rarely as fast or with the capacity advantages of rail.
It saves space
The reason that many cities switch from buses to rail is that their city centres get completely jammed with very slow buses. The Bangkok effect or ‘bus bunching’ is due to a capacity factor that is even more obvious with cars. Table 2.2 shows the relative capacities of modes.
Thus the space requirements of car dependence are 20 times those of rail. The costs of such space are considerable and help to explain why most central cities cannot function without rail access. If the 200,000/day of people who access central Sydney had to get there by car it would mean an extra 65 freeway lanes and 782 ha for car parks. Rail makes spatially constrained cities work.
••
Table 2.1 Fuel efficiency and occupancy by mode in global cities, 1990
Mode MJ per passenger kilometre (average all cities)
Measured average vehicle occupancy (average all cities)
Car 2.91 1.52Bus 1.56 13.83Heavy Rail (electric) 0.44 30.96Heavy Rail (diesel) 1.44 27.97Light Rail/Tram 0.79 29.73Note: Heavy rail occupancy is per carriage.
Transit Oriented Development18
It creates city spaces suitable for the knowledge/services economy
The key to the new economy based on transactions between knowledge/services professionals, is the ability to meet and interact. Electronic communication can be used to follow up the creative interactions that occur face to face (Hall, 1997). Cities therefore need centres which are dense, mixed and walkable, to facilitate such interactions. This is the philosophy of the New Urbanists (Calthorpe, 1993) and although their human-oriented urban designs are critical, so is the role of rail in creating spaces where bitumen is not the dominant land use.
It creates certainty for investment
Transit, especially rail, is fixed and it lasts a long time, certainly beyond the period which most investors need to get their investment back. Bus routes change; even bus lanes and bus ways are flexible though major rail and bus rapid transit systems cannot easily be moved. Transport planners have been heavily oriented to flexibility but nothing can compete with the flexibility of cars if road space is sufficient, certainly no bus system can. But once road space is constrained, the existence of fixed rail and Bus Rapid Transit (BRT) systems becomes critical. If built they provide the certainty investors need. Rail and BRT thus offer both a real transport solution and a real land investment opportunity. Cervero (2003) has shown in over 30 studies in the US, that access to rail station land provided proven land value premiums. An Australian developer has created a fund for doing TOD in Perth as its rail projects offer potential for at least 15 percent higher return in the areas around stations due to the attraction of the new rail system.
A statutory planning base that requires development to occur at the necessary density and design in each centre, preferably facilitated by a specialized development agency.
Why do we need a statutory planning process to require development in centres?
Table 2.2 Modal capacities
Mode Carrying capacity (people per hour)Freeway lane 2,500Bus lane 5,000 to 7,000Light rail 10,000 to 20,000Heavy rail line 50,000Source: Vuchic, 2005
Planning for Transit Oriented Development: Strategic Principles 19
TODs cannot be left to local politics
Strategic planning is necessary but not sufficient. It needs to be translated into a statutory planning mechanism that requires density and mix in centres. This requires clear zoning and an urban design and planning system that can facilitate TODs. This is generally a partnership between local and state governments as invariably if it is left just to local governments the regional perspectives are lost.
Local government is usually closely tied into local politics and there are often groups opposed to redevelopment and density increases that undermine such TOD projects (see for example Birrell et al, 2005). Australian and American cities are littered with examples of lost TODs. The rationale for the local reaction is often that density is socially dangerous and unhealthy though the evidence for this is not found in the literature (Newman and Kenworthy, 1989) or on the ground after such development. If TOD implementation is going to be left to local councils to do by themselves there will be much less achieved as projects are generally watered down by local reactions.
One of the key benefits of TODs is that they enable affordable housing to be built as part of the project. Density can enable such affordability but generally needs to be required as part of the development through a statutory mechanism. Affordable housing strategies are needed to make the most social benefit out of TODs though this is not usually what local communities would prioritize. Every city has different needs for affordable housing and different potential policies that can work. Vancouver has mostly required 15 percent affordable housing and Boulder now requires 40 percent in each new development. Gorowitz (2007) has summarized affordable housing techniques.
Regional planning perspectives are necessary in the local political mix but they do not often get a hearing in local media and decision making. Australian and American planning in particular will continue to emasculate TODs by local politics if that is all that is considered.
TODs require regional planning resources
Most TODs require repackaging of land parcels, redesign of roads and reorientation towards the rail system. Proactive planning processes that create these land packages and do the detailed urban design are usually beyond local government resources. In the US this is often done by private developers and in Australia by land development agencies. Both need local government involvement but the history of TOD development in Australia is such that without State Government intervention little happens. The best TODs in recent times came from the Federal Better Cities projects which were linked to state development agencies. In the US, proactive partnerships between local and state government has created a positive momentum for creating TODs in states such as New Jersey (Renne, 2005).
The role of government in facilitating Australian TODs (such as Fortitude Valley in Brisbane, Pyrmont in Sydney and Subiaco or East Perth in Perth) is
Transit Oriented Development20
not just in technical planning but also in public engagement and communication processes. Regional perspectives are needed to show why centres are required and viable regional transit systems cannot happen without such centres. Development corporations for TOD can bring the creative human resources for charettes, visioning workshops and citizen juries and so on to enable these issues to be considered.
In order to assist TODs there needs to be zoning that enables the specific benefits of TODs to be built into the planning system. A specific TOD zoning which enables these kinds of mixed use, dense centres with minimal parking and a proportion of affordable housing, can assist considerably in their delivery (Gorowitz, 2007). Developers should be given special incentives if they build there perhaps using density bonuses or time benefits in the approval process. Communities need to see there are benefits in such a zoning perhaps with a Vancouver like process where 5 percent of the cost of a development in a TOD goes to social infrastructure such as community centres and public space landscaping, determined in partnership with the local community.
A public-private funding mechanism that enables the transit and the TOD to be built or refurbished through a linkage between the transit and the centres it will service
Why do we need a financing mechanism for transit in TODs?
Rail development has .ounder ed while road development has creatively found financing mechanisms
Transport funding in many western democracies has had two radically different approaches in recent history Centrist Road Planning and Market Road Planning.
1970s to 1990s: Centrist Road Planning Federal funds in the US and Australia were the major input into transport from the 1970s but this was tightly controlled and channelled into roads. In this period in Australia $25 billion went to roads and $1 billion to rail (Laird et al 2001). Rail managed to survive through state government but it was rarely expanded. Only Perth did anything of significance in this period with new rail and this was because of an intensely political process (Newman, 2001). Brisbane’s rail was electrified by a Federal grant from the Whitlam Australian Labor Party (ALP) Government and this was the only significant venture by Federal transport into rail. This era saw major roads built in all Australian cities feeding rapid urban sprawl and car dependence. The cost effectiveness of this was never challenged. Rail was never able to generate the political clout during this period to have tied funding like roads, where no market process was ever considered necessary.
Planning for Transit Oriented Development: Strategic Principles 21
2000s: Market Road Planning Tied road funding in Australian cities has stopped and has been given just to States, though regional roads often seem to come into cities still. Federal transport funds are mostly for roads still but can include freight rail in the AusLink program. States can fund roads or rail but the politics of funding transport when health, education and police are always higher on the agenda means that road funding has mostly had to go elsewhere. A market process was thus discovered by the States using toll roads and after early models where government guarantees were needed, the system is now delivering major projects where the state government can not only get a road but a substantial cash grant from the private consortium just for the right to build. Thus in Sydney over $10 billion worth of toll roads has been built from the mid 1990s. Most other Australian cities are moving to tollways, only Perth has withstood this move. Similar processes have happened in the US where increasingly road funding is through toll roads. The difference in the US is that Federal funds can be used to fund rail through partnership agreements.
No market-based financing method has yet been developed for rail in Australia and the US apart from Portland’s tram. Proposals for building fast, heavy rail using tollway financing have been suggested in Australia, such as the Western Sydney Fast Rail, and proposals for building light rail using land development opportunities have also been considered in most cities though none have proceeded. Examples of both are found in other parts of the world; however no mechanism has yet been facilitated or approved by state governments in Australia or in the US (Hass Klau, 2004).
Public-private partnerships for rail projects automatically integrate centres
Building a rail line entirely as a transport proposition by a state government can mean that it is optimized around rail operations without any consideration for the linking of centres or building of TODs. This has mostly been the history of rail development in Australia and the US in recent years. However if the private sector were to build it in partnership with government, with land development financing, rail would automatically be integrated with land use as that would be the major way of paying for it. Thus public-private funding arrangements for rail are an inherently more effective way of creating TODs than state funding alone.
Applying the four principles to Australian cities
These four strategic planning approaches have been evaluated and summarized in Table 2.3 to see how they apply to Australian cities.
Transit Oriented Development22
Conclusion
TODs are now the focus of a lot of strategic urban planning. The market is now exercising a bigger role in urban development and the financial logic of TOD is coming to the fore. However there are many TODs that do not happen despite the strategic and financial opportunities being available. The four part strategy developed here is suggested to facilitate TODs. Thus this chapter would suggest that each city reviews its planning and transport strategies to ensure it has:
A strategic planning framework that asserts where centres need to occur, in what density and mix;A strategic planning framework that links its centres with a rapid transit base, almost invariably with electric rail;A statutory planning base that requires development to occur at the necessary density and design in each centre, preferably with a specialized development agency; andA public-private funding mechanism that enables the transit and the TOD to be built or refurbished through a linkage between the transit and the centres it will service.
1.
2.
3.
4.
Table 2.3 Application of four part TOD strategy to Australian cities
City strategic policy for centres
strategic policy for rail transit
statutory process to implement TOD
Public-private funding mechanism
sydney Yes Weak in past decade. New rail project huge potential
Yes in new areas; centres being given major overhaul
Possibly but not yet
Melbourne Yes, but struggling Weak. Present rail mostly
Yes but not strong in implementation
No
Brisbane Yes, but not well defined with clear goals for each centre
Yes. Present rail mostly but new rail lines and busways being built
No No
Perth Yes, but not well defined
Yes No No
Adelaide Yes, but not well defined
Weak on rail No No
Others: Canberra, Hobart, newcastle…
Yes, but not well defined
No No No
Chapter 3
Public Transport and Sustainable Urbanism: Global Lessons
Robert Cervero
Transit oriented development (TOD) is a viable model for transportation and land-use integration in many developed and rapidly developing cities of the world. TOD is a straightforward concept: concentrate a mix of moderately dense and pedestrian-friendly development around transit stations to promote transit riding, increased walk and bicycle travel, and other alternatives to the use of private cars. In a way, Asian cities have historically been transit oriented; featuring fine-grain mixes of land uses, plentiful pathways for pedestrians and cyclists, and ample transit services on major roads. However, the recent ascendancy in car ownership and rising incomes are unravelling the historical transit-supportive urban forms of many Asian cities, giving rise to an increasingly car-dependent built form. By focusing new construction and redevelopment in and around transit nodes, TOD is viewed as a promising tool for curbing sprawl and the car dependence it spawns. By channelling public investments into struggling inner-city settings, some hope TOD can breathe new life and vitality into areas of need. And by creating more walkable, mixed-use neighbourhoods with good transit connectivity, TOD is thought to appeal to the lifestyle preferences of a growing demographic, like childless couples, young professionals and empty-nesters.
On the global stage, TOD is most fully developed in Europe, and in particular Scandinavia. Step one in bringing TOD from theory to reality has been the formulation of a vision and conceptual image of the future metropolis, such as the celebrated ‘Finger Plan’ of Copenhagen, Denmark and the ‘Planetary Cluster Plan’ of Stockholm, Sweden. In both of these instances, corridors for channeling overspill growth from the urban centres were defined early in the planning process, and rail infrastructure was built, often in advance of demand, to steer growth along desired growth axes. As importantly, greenbelt wedges set aside as agricultural preserves, open space, and natural habitats were also designated and accordingly major infrastructure was directed away from these districts. The evolution of Copenhagen from a Finger Plan, to a directed rail-investment program along defined growth axes, to finger-like urbanization patterns is revealed by Figure 3.1.
The ability of inter-mixing land uses along linear corridors to produce an inter-mixing of bi-directional flows is an under-appreciated benefit of sub-regional land-use balancing. There is no better example of the efficiency and sustainability gains that come from balanced growth than Stockholm, Sweden. The last half-century of
Transit Oriented Development24
strategic regional planning has given rise to a regional settlement and commutation pattern that has substantially lowered car-dependency in middle-income suburbs. Stockholm planners have created jobs-housing balance along rail-served axial corridors. This in turn has produced directional-flow balances. During peak hours, 55 percent of commuters are typically travelling in one direction on trains and 45 percent are heading in the other direction. Stockholm’s transit modal share is nearly twice that found in bigger rail-served European cities like Berlin and even higher than inner London’s market share. Perhaps most impressive, Stockholm is one of the few places where automobility appears to be receding. Between 1980 and 1990, it was the only city in a sample of 37 global cities that registered a per capita decline in car use, a drop off of 229 annual kilometres of travel per person (Kenworthy and Laube, 1999).
TOD in Asia: singapore
A good model of TOD is Singapore, underscored by the island-state’s Constellation Plan and development of compact, mixed-use new towns around many suburban MRT stations (see for additional details the Chapter 8 on Singapore). The city-state of Singapore is internationally renowned for its successful integration of transit and regional development, placing the urbanized island of 2.8 million inhabitants on a sustainable pathway, both economically and environmentally. As part of a national economic development strategy, Singapore has embraced Scandinavian planning principles that call for radial corridors that interconnect the central core with master-planned new towns. Its structure plan, called the Constellation Plan, reflects its namesake, from plan view, it has the appearance of a constellation of satellite ‘planets’, or new towns, that orbit the central core, interspersed by
Figure 3.1 Copenhagen’s “transit first” spatial evolution: From finger plan, to five-axis radial investment, to corridors of satellite, rail-served new towns
Public Transport and Sustainable Urbanism: Global Lessons 25
protective greenbelts and interlaced by high-capacity, high-performance rail transit. Like Stockholm and Copenhagen, this rail-served settlement pattern has produced tremendous transportation benefits: low VKT per capita (lower than any urbanized region worldwide with per capita GDRP over US$10,000) and high transit modal splits (480 annual transit trips per capita in 2002) (Singapore Land Transport Authority. 2005).
Housing development closely followed Singapore’s radial rail network. Based on housing and commercial units built by Singapore’s Housing and Development Board (HDB), which actively builds housing in this land-constrained city-state, rail-oriented development peaked in the mid 1980s but remains strong today (see Figure 3.2)
Singapore adopted the approach of building new towns that are not independent, self-contained units but rather nodes with specialized functions that interact with and depend upon other new towns. Some satellite centres are primarily industrial estates, some are predominantly dormitory communities, and most are mixed-use enclaves. Around three-quarters of residents of master-planned new towns work outside of their area of residence. Most, however, commute within the radial corridor that connects their new town to Singapore’s Central Business District. This means travel is predominantly within, not between, rail-served corridors. Also, the dispersal of mixed land uses along corridors has created two-way travel flows and spread travel demand more evenly throughout the day.
Singapore is also noted for its progressive ‘transit first’ policies that complement its transit-oriented Constellation Plan. The city has introduced a three-tier fiscal program that comes as close to ‘getting the prices right’ within the urban transport sector as any city in the world. The first tier of charges is subscription fees for
Figure 3.2 HDB’s dwelling units and commercial developments since 1960Source: The Housing and Development Board (HDB)

Transit Oriented Development26
owning a car. Comprised of high registration fees, import duties for automobile purchases, and a licensing surcharge based on a quota system (indexed to congestion levels), these charges principally cover fixed costs associated with providing basic levels of road infrastructure and parking facilities. The second tier of charges are use-related, in the form of fuel taxes and parking fees, that cover incremental costs for scaling road capacity to traffic volumes and maintaining roadway infrastructure. The third set of charges, in the form of real-time electronic road pricing (ERP), force motorists to internalize the externalities they impose in using their cars during peak hours. Fees fluctuate according to congestion levels, meaning motorists bear some of the costs they impose on others such as time delays and air pollution. Within a month of initiating electronic road pricing, traffic along a main thoroughfare fell by 15 percent and average rush-hour speeds rose from 36 to 58 kph. Vehicle quotas, congestion prices, and an assortment of fees and surtaxes (that add as much as 150 percent to a car’s open market value) have reduced Singapore’s annual vehicle population growth from 6 percent, fifteen years ago to under 3 percent today (Singapore Land Transport Authority, 2006), a remarkable achievement for a city where per capita incomes have risen faster over the past two decades than virtually anywhere in the world.
TOD in the united states
As the world’s most car-dependent society, the United States might not be considered a model for examining TOD; however there are several positive experiences that are worth noting. Over 100 TOD projects currently exist in the United States, found overwhelmingly in and around heavy, light, and commuter rail stations.
No place in the United States has witnessed more high-rise, mixed-use development along a rail corridor over the past three decades than Arlington County, Virginia. Arlington County, Virginia is a textbook example of creating a vision (the “bull’s eye” concept plan, shown in Figure 3.3) and putting in place appropriate implementation tools to achieve the vision. Through a collaborative effort that engaged local stakeholders and an ambitious campaign that targeted supportive infrastructure improvements to rail stops along the corridor, Arlington County managed to transform the Metrorail Orange line into a showcase of transit-supportive development, with mid-to-high rise towers and multiple uses today flanking the Rosslyn, Courthouse, Clarendon, Virginia Square, and Ballston Metrorail stations. With the bull’s eye metaphor in place to guide on-going planning, borrowing from the experiences of great “transit metropolises” like Copenhagen and Stockholm, Arlington County proceeded to leverage Metrorail’s presence and transform once dormant neighbourhoods into vibrant clusters of office, retail, and residential development.
In a recent national study, I probed the potential ridership benefits of TOD even in a car-dependent country like the United States. Arlington County’s two major rail axes – Rosslyn-Ballston and Jefferson Davis – have experienced a tremendous increase in building activity since Metrorail’s 1978 opening: 24.4 million square
Public Transport and Sustainable Urbanism: Global Lessons 27
feet of office space, 3.8 million square feet of retail space, some 24,000 mixed-income dwelling units, and over 6300 hotel rooms (Arlington County Department of Community Planning, Housing and Development, 2002). Of the nearly 190,000 people today living in Arlington County, 26 percent reside in Metrorail corridors even though these corridors comprise only 8 percent of county land area. If the development added to these two corridors had been built at suburban density standards, such as in neighbouring Fairfax County, Virginia, seven times as much land area would have been required.
The addition of more than 35 million square feet of new development along two rail-served radial axes was hardly the result of good fortune or happenstance. The transformation of once rural Arlington County into a showcase of compact, mixed-use TOD has been the product of ambitious, laser-focused station-area planning and investment. Prior to Metrorail’s arrival, Arlington County planners understood that high-performance transit provided an unprecedented opportunity to shape future growth and proceeded to introduce various strategies – targeted infrastructure improvements, incentive zoning, development proffers, permissive and as-of-right zoning – to entice private investments around stations. After preparing countywide and station-area plans on desired land-use outcomes, density and setback configurations, and circulation systems, zoning classifications were changed and developments that complied with these classifications could proceed unencumbered. The ability of complying developers to create TODs ‘as-of-right’ was particularly important for it meant developers could line up capital, secure loans, incur upfront costs, and phase-in construction without the fear of local government ‘changing its mind.’
Figure 3.3 Arlington County, Virginia’s “Bull’s Eye” vision for the Rosslyn-Ballston corridor
Source: Arlington County Department of Community Planning, Housing and Development
Transit Oriented Development28
The pay-off of concentrated growth along rail corridors is revealed in Arlington County’s transit ridership statistics. The County today boasts one of the highest percentages of transit usage in the Washington, D.C. region, with 39.3 percent of Metrorail corridor residents commuting to work by public transit (Arlington County Department of Community Planning, Housing and Development, 2002; United States Census, 2000). This is twice the share of County residents who live outside of Metrorail corridors. Self-selection is evident in that around two-thirds of employed-residents in several apartments and condominium projects near Rosslyn and Ballston stations take transit to work (JHK and Associates, 1987 and 1989). An important outcome of promoting mixed-use development along rail corridors has been balanced jobs and housing growth which in turn has produced balanced two-way travel flows. Counts of station entries and exits in Arlington County were nearly equal during peak hours as well as the off-peak. During the morning rush hours, many of the county’s Metrorail stations are both trip origins and destinations, meaning trains and buses are full in both directions. The presence of so much retail-entertainment-hotel activities along the County’s metrorail corridors has further filled trains and buses during the midday and on weekends. Arlington County averages higher shares of transit boardings and alightings at its stations in off-peak hours than other jurisdictions in the region with the exception of downtown Washington, D.C. Balanced, mixed-use development has translated into as close to 24/7 ridership profile as any U.S. setting outside of a CBD.
In probing the ridership bonus of TOD yearly data on building activities and station entries/exits for Arlington County station areas over the 1985 to 2002 period were examined. Using multiple regression equations that simultaneously estimated ridership, development, and service levels as joint functions of each other (Table 3.1), the analysis revealed the following. Ridership has been most responsive to increases in office and retail development. Every 100,000 square feet of added office and retail floorspace increased average daily boardings by nearly 50. Residential development increased ridership in part by prompting increases in service frequency. In combination, the two factors – new housing and more frequent headways – boosted patronage: every 100 additional residential units, when combined with 100 additional rail-car passenger spaces per day, led to more than 50 additional boardings per day.
Bus-based TOD: Bogotá and Curitiba
Many medium-sized global cities are looking to Bus Rapid Transit (BRT) as the most affordable form of high-performance public transit investment. Two noteworthy experiences with BOT and TOD are Bogotá, Colombia and Curitiba, Brazil. Bogotá, the Andean capital of Colombia, has gained global recognition for its highly efficient and productive bus rapid transit (BRT) system, called Transmilenio.1
1 BRT aims to achieve the speed and performance advantages of grade-separatedBRT aims to achieve the speed and performance advantages of grade-separated services at a fraction of the cost by cleverly using bus-based approaches. Among its key
Public Transport and Sustainable Urbanism: Global Lessons 29
For a city of 7 million inhabitants facing civil conflict and deep economic problems, Bogotá’s emergence as one of the world’s most sustainable metropolises is all the more remarkable. In the late 1990s, Bogotá began operating a high-speed, high-capacity bus system, called Transmilenio (Figure 3.4), building upon Curitiba, Brazil’s much-celebrated successes with dedicated bus ways. A big difference, however, is that Curitiba relies principally upon circular, cross-town bus routes to interconnect radial bus ways. Outside of downtown, relatively little was invested in pedestrian and bikeway improvements. Bogotá, on the other hand, actively embraced pedestrian and bicycle access.
The 42 kilometre, three line Transmilenio bus way is the centrepiece of Bogotá’s vast bus network. The dedicated system will eventually expand to 22 lines covering 391 kilometres. Bus lanes are situated in boulevard medians, with weather protected, attractively designed stations spaced every 500 metres or so. Because of dual carriageways that enable buses to overtake each other and high-level platforms
features are: exclusivity, notably physical segregation; seamless (same-level) transfers; advanced bus technology: clean fuels, light-weight materials, low floors, advanced communications, docking systems; supportive armature: signal priorities, bus turnouts, curb realignments, automated vehicle location (AVL) systems, automated routing and dispatching; expeditious fare collection and boarding: off-vehicle payment, smart cards.
Table 3.1 Multiple regression results for predicting Metrorail station boardings and exits as functions of transit service levels and building activities for 7 Arlington County Metrorail stations, 1985–2002: Two-stage least squares estimation
Transit service Level variable Coefficient T-statistic Probability Rail Service Frequency: No. of passenger-seats passing through Metrorail Station per day**
0.2096 1.190 0.236
Building Activity variable Office-Retail Development: Square Footage of Office and Commercial Floorspace (in 1000s) in station area
0.4740 2.186 0.031
Residential Development-Service Frequency Interaction: (Dwelling Units, in 1000s * Rail Service Frequency)
0.0055 2.124 0.036
Constant 1239.3 0.748 0.456Summary StatisticsN = 126R2 = 0.772F = 137.3 (prob. = .000)** Instrument variables used to estimate predicted value were: mean regional gasoline price ($); office-retail development; time-series dummy (1985=1, 1986=2, etc.); and station area (0-1) dummy variables for Ballston, Clarendon, Courthouse, Crystal City, Pentagon City, and Rosslyn stations.
Transit Oriented Development30
that allow expeditious boardings and alightings, Transmilenio has a throughput of some 35,000 persons per direction per hour, a number than matches that of many metro-rail systems. Some 850,000 passengers ride Transmilenio buses each weekday, three times the ridership of two rail lines in Medellin, Colombia (achieved at less than one-fifth of the Medellin Metro’s construction costs) and providing for a social rate of return2 of 61 percent (Consejo Nacional de Politica Económica y Social, 2000). Particularly important to the transitway has been Bogotá’s attention to pedestrian and bicycle access, in the form of ‘green connectors’. Perpendicular and grade-separated ped ways and bikeways connect some of the poorest barrios and informal housing settlements with highly transit-dependent populations to the bus ways. Other innovative features of Bogotá’s sustainable transport program include license-plate rationing, parking management, and car-free districting. Bogotá is an extraordinary example of matching infrastructure ‘hardware’ with public policy ‘software’: Latin’s America’s most extensive network of cycle ways (250 km), the world’s longest pedestrian corridor (17 km), and the planet’s biggest Car Free Day (covering an entire city of 35,000 hectares). Today, 43 percent of the city’s transport investment budget goes to ancillary policy measures.
Transmilenio’s numbers are impressive. Average bus speeds increased from 12 kph to 27 kph along the two busiest bus way corridors. This led to a 32 percent
2 Social rate of return reflects total societal benefits that accrue from public benefitsSocial rate of return reflects total societal benefits that accrue from public benefits like travel time saving, improved air quality, and accessibility for the poor.
figure 3.4 Bogota’s Transmilenio: Dual-carriageways at stations
Public Transport and Sustainable Urbanism: Global Lessons 31
reduction in average trip times for users of the system (Sandavol and Hildalgo, 2002). Accidents have fallen some 93 percent and air pollution has improved: from 1999 when Transmilenio opened to 2001, injuries and collisions along bus served corridors fell by 75 percent to 80 percent and sulphur dioxide, nitrogen oxides, and particulate matter had dropped 43, 18, and 12 percent respectively (Sandavol and Hildalgo, 2000). During its first year, Transmilenio had a 98 percent passenger approval rating. 11 percent of Transmilenio riders are former car drivers.
While Bogotá’s Transmilenio system has not dramatically altered the cityscape to date, at least when compared to cities like Curitiba, Brazil (as discussed later), recent research shows that commercial properties have reaped benefits from proximity to bus way stations. Figure 3.5 shows properties that were surveyed by
Figure 3.5 Commercial properties studied in relation to Bogotá’s TransMilenio system, 2002
Source: F. Targa and D. Rodriquez: Analysis of Bogotá’s Bus Rapid Transit System and its Impact on Land Development”, Carolina Planning Journal, Winter 2003-2004, pp. 26–36
Transit Oriented Development32
Targa and Rodriquez in a study of Transmilenio’s land-rent capitalization impacts. Using hedonic price models, the authors measured a monthly rental discount of 1.87 percent for every additional 0.1 km from a BRT station, all else being equal (Targa and Rodriquez, 2003). This suggests a pent-up market demand for the accessibility benefits conferred by high-quality bus-based transit in cities of developing countries.
As with many successful transit investments, it has been the attention to design details, matched by good macro-scale planning that has contributed to Tranmilenio’s success. Car parking is mainly limited to the end stations of the Transmilenio busway. Nearly half of the 57 intermediate stations are served by skywalks/pedestrian overpasses. A phalanx of sidewalks and bikeways feed into all stations, most embellished by vegetative landscaping. Some two dozen civic plazas, pocket parks, and recreational facilities lie within a half kilometre of bus way stops. Today, 45 percent of Transmilenio users reach stations by foot or bicycle.
Bicycle facilities extend well beyond Transmilenio stations. Currently, Bogotá boasts over 200 kilometres of dedicated bicycle paths and lanes. The Dutch-advised long-range plan calls for the figure to almost double over the next 30 years. The $178 million spent to date for bicycle improvements is about half the total amount the entire United States spends annually on cycling infrastructure. Over the past decade since bikeways have been introduced, the share of daily trips by cycling has grown from 0.9 percent to 4 percent. A hospitable environment has helped. Perched in a flat valley high in the Andes, Bogotá enjoys a mild climate. So have high densities (at 12,000 persons per square kilometre, Bogotá is one of the densest cities in the Western Hemisphere) and mixed land-use patterns. As a result, 77 percent of daily trips in the city are less than 10 kilometres. Bicycles can often cover 10 kilometres faster than cars because many of the city’s traffic-snarled roads.
To further promote cycling; Bogotá officials have held car-free days on the first Thursday of February since 2000. On Sundays, the city closes 120 kilometres of main roads for 7 hours to create a ‘Ciclovia’ (‘Cycling Way’) for cyclists, skaters, and pedestrians. When weather is good, as many as a million and a half cyclists hit the streets of Bogotá on Sundays. Bike friendly initiatives have been matched by car restricted ones. Through a tag system (Pico y Paca), 40 percent of cars have to be off of central-city streets during peak hours every day. Bollards have been installed throughout the core to prevent motorists from parking on sidewalks and bikeways.
How can a city in a developing country, saddled with guerrilla warfare and armed conflict, one might ask, justify investing scarce public resources in amenities like ped ways and bike paths? Aren’t education, health care, sanitation, housing, and other pressing urban concerns of much higher priority? Bogotá’s channelling of funds into the transport sector reflects, in part, the visions of several liberal mayors who have openly embraced smart-growth planning under the premise that a functional, world-class city can halt a brain drain and, over the long run, entice
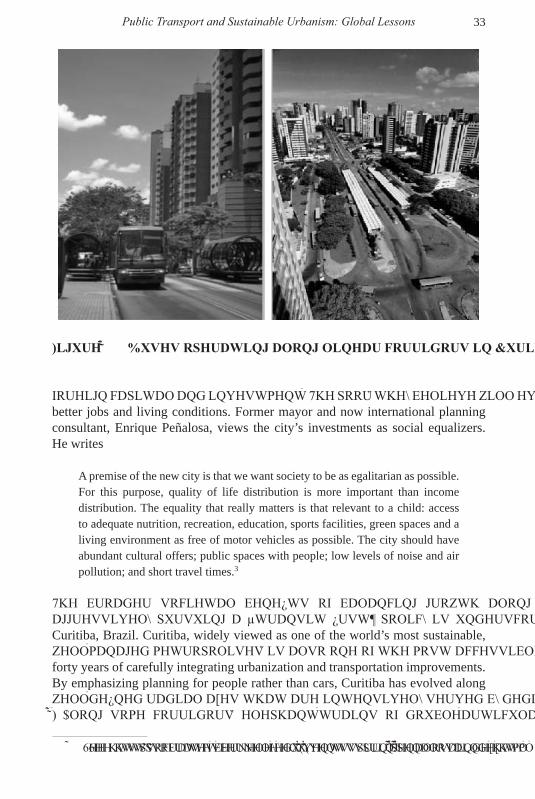
Public Transport and Sustainable Urbanism: Global Lessons 33
foreign capital and investment. The poor, they believe, will eventually benefit from better jobs and living conditions. Former mayor and now international planning consultant, Enrique Peñalosa, views the city’s investments as social equalizers. He writes
A premise of the new city is that we want society to be as egalitarian as possible. For this purpose, quality of life distribution is more important than income distribution. The equality that really matters is that relevant to a child: access to adequate nutrition, recreation, education, sports facilities, green spaces and a living environment as free of motor vehicles as possible. The city should have abundant cultural offers; public spaces with people; low levels of noise and air pollution; and short travel times.3
The broader societal benefits of balancing growth along linear axes and aggressively pursuing a ‘transit first’ policy is underscored by experiences in Curitiba, Brazil. Curitiba, widely viewed as one of the world’s most sustainable, well-managed metropolises, is also one of the most accessible, a product of some forty years of carefully integrating urbanization and transportation improvements. By emphasizing planning for people rather than cars, Curitiba has evolved along well-defined radial axes that are intensively served by dedicated busways (Figure 3.6). Along some corridors, elephant-trains of double-articulated buses haul
3 See http://socrates.berkeley.edu:7001/Events/spring2002/04-08-penalosa/index.html.See http://socrates.berkeley.edu:7001/Events/spring2002/04-08-penalosa/index.html.
Figure 3.6 Buses operating along linear corridors in Curitiba

Transit Oriented Development34
16,000 passengers per hour, comparable to what much pricier metro-rail systems carry. A design element used to enhance accessibility is the ‘trinary’, three parallel roadways with compatible land uses. An important benefit of mixed land uses and transit service levels along these corridors, besides phenomenally high ridership rates, has been balanced, bi-directional flows, ensuring efficient use of available bus capacity, just as in the case of Stockholm. On a per capita basis, Curitiba is one of Brazil’s wealthiest cities yet it averages more transit trips than much-bigger Rio and São Paulo. It also boasts the cleanest air among any Brazilian city over 1 million inhabitants, despite being a provincial capital with a sizable industrial sector.
A comparison of Curitiba’s experiences with Brazil’s master-planned capital city, Brasilia, is particularly insightful in gauging Curitiba’s successes. The two cities make for good case comparisons for in many ways they are quite similar. Both are of similar size, roughly 3 million inhabitants at the metropolitan scale; are among the wealthier middle-to-larger size Brazilian cities; and within their built-up areas, actually have similar overall population densities. However densities vary quite a bit between the two in terms of how they are organized, Curitiba’s high densities are along radial, bus-served corridors (matched by low suburban-like densities) where Brasilia’s densities are more uniformly spread, mean for private automobile travel. As importantly, land-uses along Curitiba’s bus-served linear axes tend to be intermixed whereas in Brasilia, land uses were consciously segregated, part of the formalistic formula of the master-planned capital wherein government offices are in one part of the city, the retail sector in another part, and housing in separate areas. Most noticeable, however, is the fact that Brasilia was designed and scaled for private motorized travel, reflected by segregated and uniformly spread land uses, whereas Curitiba was designed to encourage bus travel. Two statistics underscore the radically different impacts of transportation-land use arrangements in these otherwise somewhat comparable cities. One, in 2005, Curitiba averaged 355 transit trips per person per year compared to just 97 in Brasilia. Two, on the basis of what is arguably the best metric of sustainable transportation; the average annual vehicle kilometres travelled per person in Brasilia in 2005 has been estimated at 16,700, compared to a value of 7,900 in Curitiba (Santos, 2007). Due to more sustainable transportation/land-use arrangement, the carbon footprint of the typical Curitiba resident, one might estimate, attributable to travel is about half that of the typical inhabitant of Brasilia. The strong, workable nexus that exists between Curitiba’s bus-based transit system and its mixed-use linear settlement pattern deserves most of the credit.
Conclusion
Global experiences show that integration of public transport and land use yields tremendous sustainability benefits. As long as TOD confers both public and private benefits, there is no replacement for public-private partnerships in advancing TOD
Public Transport and Sustainable Urbanism: Global Lessons 35
implementation. Each party brings unique talents, insights and resources to the table.
Even in car-dependent America, TOD resonates with the general public and often finds support across political and ideological lines. In America today, transit-oriented housing stands as one of the most promising mechanisms for promoting multiple urban policy objectives – affordable housing construction, sprawl containment and reduced car-dependence. Bold new policies are beginning to surface across the U.S., ones that push conventional boundaries and acknowledge the unique market niches that are being served. These include market-based initiatives like Location Efficient Mortgages and unbundling of parking and housing costs as well as government incentives such as targeted infrastructure investments and the flexing of parking standards. Standard designs, cost proformas and building code templates need to be challenged for each and every transit-oriented project in large part because the TOD market is not ‘standard’. Experiences show that new housing built near rail stops often appeals to single professionals, childless couples and empty-nesters who value amenities as much as the amount of living space and who often own fewer cars and log fewer miles on their odometers than the typical urban household. Standards for mortgage qualifications, building designs, and parking supplies need to reflect these market realities. To the degree that market-responsive policies are introduced, shifting demographics and lifestyle preferences will reduce the need for government subsidies and regulatory interventions save for those that aim to help the poor. Ultimately, the marketplace will drive station-area planning and designs, with policy interventions focused mainly on making neighbourhoods surrounding transit nodes better places to live, recreate, shop and do business.
Perhaps it is the fact that TOD is centrally a market-based concept that it is taking a foothold in traditional car-dependent settings like the U.S. While critics charge that TOD is a form of social-engineering, in truth it is market based because it diversifies urban landscapes and modal options. As American and many other global societies becomes more plural and heterogeneous, land-use and transportation arrangements that widen choices will allow individual households and firms to better satisfy their lifestyle and business preferences. Choice and variety are important elements of successful marketplaces. Fortunately, TOD enriches choices.
Of course, public interventions are a necessary ingredient of successful TODs. In this regard, global experiences demonstrate that leadership, combined with forward-looking urban planning and efficient pricing of scarce resources provide the necessary complements to make TOD a viable and sustainable form of urbanism.

This page has been left blank intentionally

PART II Implementation: Tools

This page has been left blank intentionally
Chapter 4 Implementing Transit Oriented
Development through Regional Plans: A Case Study of Western Australia
Carey Curtis
Introduction
This chapter examines the way in which the Western Australian State Government has embraced the need to plan for TOD at the Perth regional/metropolitan level. It traces the State’s unique model of regional planning since the 1950s and the way in which the regional strategy was recently re-focused around TOD, thereby replacing the model of dispersed development framed around private car travel. An account of the way in which the new regional strategy, Network City, will restructure the city around TOD principles is given and an overview of the new challenges this presents for planning and transport practices.
The planning choices made for metropolitan form and transport investment since the 1950’s have resulted in a low density suburban city region which now houses a population of 1.4 million spreading some 130 kilometres along the Indian Ocean coast. The result is a car dependent city where car ownership and use is the highest of all Australian cities (723 vehicles per thousand people).
Since the 1990’s, however, Perth has seen strong investment in public transport infrastructure to the envy of other Australian cities. The most recent investment has been the building of a new 72 kilometre long railway line (operational from December 2007) to serve Perth’s southern suburbs (Figure 4.1). Clearly this is not the first railway for the city, but the planning and routing of this new railway has been more strongly grounded in land use planning in a way not seen before. State planning and transport agencies have worked hard to pursue the long standing planning objective of ‘land use transport integration’. Both public agencies together with private developers have actively pursued opportunities for transit-oriented development (TOD) along the new railway line. Other opportunities to achieve TOD are also being pursued beyond the railway lines using bus-based transit along activity corridors as a means of diversifying TOD opportunity.
The implementation of TOD has been strongly grounded in a system of regional planning accompanied by the development of a suite of more specific planning policies. The use of these tools together with the support of a strong planning system has been important in ‘making TOD happen’. The tools and the system of
Transit Oriented Development40
planning have also provided the opportunity to work collaboratively across the agencies and with the community and this has assisted positive implementation.
The re-focusing of Metropolitan Regional Planning around TOD
The essence of TOD is achieved through the close integration of land use activity and public transport infrastructure. Clearly ‘land use transport integration’ has long been the basis of the planning discipline, however at different stages in planning history this
figure 4.1 greater Perth Metropolitan Area
Implementing Transit Oriented Development through Regional Plans 41
has applied to different transport modes. The dominant post war planning approach for Australia was premised almost exclusively on car-based mobility. In Perth, while there has been a long history of planning strategies and policies promoting land use transport integration, it has been the ‘love affair with the car’ which has seen the main focus of implementation in providing access for cars. In contrast, in the more recent past Perth can be regarded as a pioneer in the emphasis and re-focus on public transport planning as the means for land use transport integration.
The 1955 plan
The first strategic plan for the metropolitan region in 1955 argued for land use transport integration to be achieved by creating a series of self-contained communities including land for employment in close proximity to residential areas (Carr, 1979). This approach can be traced back as early as the 1930’s, when the Metropolitan Planning Commission acknowledged the need for land use transport integration (McManus, 1993). The 1955 plan proposed a relatively compact region with a transport network which included two new suburban rail lines and a substantial regional road network focussing on radial routes from the Perth CBD (Stephenson and Hepburn, 1955). The railway proposals, however, were never implemented but the development of the road network proceeded at speed. The car was popular; it was seen as a sign of a modern prosperous city and viewed as the main mode of travel, with public transport provision seen as serving only a social welfare function (MTT, 1961).
Catering for mobility through private car travel was to dominate city planning from the 1960s until the late 1980s. The late 1950s saw debate about the removal of the early railways and their replacement with buses, which “were considered a more appropriate form of transport because the infrastructure required was the same as that required by cars and it was partly funded by the Commonwealth” (McManus, 2002, p. 198). New suburbs were developed away from railway lines and the car was seen as the primary means of transport. By 1979, the Fremantle line was closed to make way for a proposed freeway, with a bus-way proposed to replace the rail link (Newman, 1992).
1970–1990: Regional corridors and regional centres
The next two metropolitan planning strategies (The Corridor Plan, 1970; Metroplan, 1990) also made the case for land use transport integration. The proposals were for this to be achieved by dispersing the city to regional centres at the periphery of the region (Midland, Armadale, Joondalup and Rockingham). The intent was to serve the regional centres both by public transport and an extensive high speed road network. The land use transport integration principles of these plans included the notion of self-contained communities at these regional centres and the provision of radial public transport routes between these centres and the CBD.
Railway lines built in the late 1800s already served Midland and Armadale, a new railway line to Joondalup opened in 1992. Yet despite this approach car-based
Transit Oriented Development42
travel continued to grow. The average per capita kilometres by car per annum rose from approximately 6,000 km in 1979 to almost 10,000 km in 2000 (WAPC, 1999). Trips per capita per day remained fairly static for car and walking but, until recently, public transport and cycling trips were in decline. The mode share for all trips show that car trips increased (from 70 percent in 1976 to 80 percent in 2000) with a consequent decline in walking (from 16 percent to 12 percent) and public transport (from 8 percent to 5 percent), while cycling has remained at 3 percent (Curtis, 2001). One reason for this has been the failure to achieve a concentration of employment uses at suburban centres served by public transport (outside of Perth CBD itself).
Emerging TOD policies
The late 1990s saw a new premise for land use transport integration, this time framed around public transport access. The new focus aimed at achieving changes to the physical form of the city at both the regional and the neighbourhood scale and supported a move away from car use towards providing for transport choice. In advance of a regional planning strategy a suite of new state policies, strategies and planning codes were gradually introduced. None of these, however, had the statutory force of a regional planning strategy. Arguments were made for ‘balanced transport’, meaning provision for all modes of transport not just for private cars, and were later seen reflected in such policy documents as the Metropolitan Transport Strategy (Department of Transport et al., 1996). Other state government initiatives supported this change in direction, promoting the need to control urban sprawl and overcome car dependence by ensuring public transport and non-motorized options were feasible for many trips, rather than the previous approach dominated by car travel. A state-wide experimental planning code, drawn up using new urbanist principles, promoted the development of ‘walkable communities’ where day-to-day activities can be served within a local area (WAPC, 1997).
One operational planning policy of direct interest was the introduction in 1988 of state ‘Development Control Policy 1.6 Development around Metropolitan Railways Stations’, now called ‘Planning to enhance public transport’ (Ministry for Planning, 1999). This policy requires that all planning applications on land adjacent to metropolitan railways stations support rail use and access by providing for higher density residential development. Clear this is a pioneering policy for TOD but its implementation has been slow to take effect, especially through conventional private sector led development processes. The most successful examples have been products of a redevelopment authority approach (see chapter 6). Implementation outside of the redevelopment authority approach has been quite limited.
2004–: Network City
The latest 25 year planning strategy for metropolitan Perth, ‘Network City’ (WAPC, 2004), has at its heart a spatial framework designed to realise the integration of
Implementing Transit Oriented Development through Regional Plans 43
land use and public transport networks. TOD is conceived around both railway stations and along bus-based transit routes. In recognition of the “need to deal simultaneously with both transport and urban development issues” (Bertolini and Spit, 1998, p. 17) the transport network and its relationship with activity centres is based on achieving a high level of accessibility. ‘Network City’s spatial framework comprises three elements. ‘Activity corridors’ are centred on either a main arterial road or suburban railway line utilizing land up to 400m on either side of this transport spine. ‘Activity centres’ are developed at intervals along the activity corridor as the focus of daily activity needs including small-scale employment, shopping and services, and medium to higher density housing all placed within walking distance of the public transport node at the centre. ‘Transport corridors’ are paired with one or more activity corridors to form a network, and provide a fast moving route for inter-urban travel, so overcoming the need for longer distance through-traffic to use activity corridors.
The significance of the ‘Network City’ is its attention to regional structure, accessibility and the land use/transport function of roads. Of importance is for a strategy capable of being retrofitted to existing urban areas as well as guiding development in new urban areas. Many theoretical models of ‘ideal’ urban form contemplate a ‘blank canvas’, but in reality this is rarely the case (Gordon and Richardson, 1989; Owens, 1984).
There was an unprecedented involvement of community in the preparation of ‘Network City’, and this strengthens the regional strategy. ‘Network City’ was adopted by the State Government in 2004 following a year long planning phase which involved a new approach to collaboration and engagement with the wider community in a way not previously undertaken. A one-day dialogue with the community started the process. Working groups were drawn from that day and spent one year producing the strategy. This is in contrast to the approach of previous regional plans produced since the 1950s.
The planning strategy is guided by eight clearly stated headlines (Table 4.1). Headline 5: Encourage public over private transport sets a clear direction not seen so clearly stated in earlier regional planning strategies. As development of operational policy (see below) unfolds this is tested against these principles. Applications for sub-division of land and accompanying structure plans are also tested by the state planning agency in the same way.
Table 4.1 network City community planning strategy: Headlines
1 Manage growth by sharing responsibility between industry, communities and government
5 Encourage public over private transport Encourage public over private transportEncourage public over private transport
2 Make fuller use of urban land Make fuller use of urban landMake fuller use of urban land 6 Strengthen local sense of place Strengthen local sense of placeStrengthen local sense of place3 Plan with communities Plan with communitiesPlan with communities 7 Develop strategies which deliver local jobs Develop strategies which deliver local jobsDevelop strategies which deliver local jobs4 Nurture the environment Nurture the environmentNurture the environment 8 Provide for affordable housing Provide for affordable housingProvide for affordable housing
Transit Oriented Development44
new challenges for planning and transport practices
A strong planning system
In Australia there is no nationally adopted policy on sustainable transport that gives direction to state or local government. Town planning is a State-led rather than a national activity. This is also the case for most urban transport planning, albeit drawing on federal funding for road building. However, the system of regional planning in Western Australia provides a good basis for implementation. Not only is there a long history of regional planning, but also the State has maintained strong control over local and regional planning processes through a State planning department, and a State-appointed WA Planning Commission (WAPC). A Metropolitan Region Scheme, controlled by the State, provides the statutory mechanism to zone land for development in accordance with the regional planning strategy. The State monitors and coordinates the servicing of land development through its Metropolitan Development Program. The State is in an extremely powerful position to influence the nature of development through its own land development agency LandCorp and the Department of Housing and Works (responsible for public housing), as well as its control over all local government’s town planning schemes and subdivisions. The amalgamation in 2001 of the transport and planning agencies into one super agency was seen as key to the ability to integrate land use and transport.
Adapting planning tools and practices
While the regional planning strategy provides the key tool to ‘make TOD happen’, implementation of ‘Network City’ has seen the need to adapt traditional planning tools that sit under the strategy and for changes to planning practice requiring new professional skills. The WAPC recognized the need for such change by adopting nine priority tasks. These represent the work needed to achieve the shift towards TOD implementation (Table 4.2).
The work required for tasks 1–6 is clearly interrelated; it is not possible to deal with each task sequentially. This has been a challenge for existing work practices, and has required a number of inter-disciplinary project teams to work in an integrated way allowing for the cross-fertilization and development of ideas. Individual officers work on several projects so breaking down the traditional professional silos. The team work across the traditional state planning, transport and infrastructure portfolios, for example in redefining functional road classifications and in integrating public transport with land use.
Defining and planning for Activity Centres
The regional strategy requires the setting of a clear structure of activity centres where increases in residential density and employment intensity around public
Implementing Transit Oriented Development through Regional Plans 45
transport interchanges will take place. There is a need to understand the potential of dispersing employment to the activity centres is new ground for planning practice. The current approach defines a hierarchy of activity centres based on retail floor space alone, rather than mixed land use. The delivery of past employment uses has been ad hoc and poorly coordinated. For example, while planning schemes define industrial areas, the reality is there has been an invasion by retail warehouses and leisure based uses so fragmenting activity and dispersing it across the region in a way that is difficult to achieve sustainable accessibility. Targets for each local government area have never been set before and this is taking place through the new WAPC/Western Australian Local Government Association joint committee. This process is now supported by infrastructure providers who are feeding knowledge on infrastructure constraints, such as the capacity of sewerage systems and energy, into the process. Their role in supporting the process is essential, equally they see the benefits of certainty that strong planning direction will bring.
Detailing the metropolitan structure requires a consensus on the design detail of the three ‘Network City’ elements. This is another challenge as there are different interpretations of the activity corridor in terms of density, spread of development and overall metropolitan structure. Until now there has been no practice of considering accessibility to activity centres by public transport
Table 4.2 Implementing ‘network City’: WAPC’s nine priority tasks
TAsk Involves…1 Detailing the metropolitan Detailing the metropolitanDetailing the metropolitan
structureExpanding and explaining the overall metropolitan structure of activity centres, activity corridors and transport corridors (including the principles that will govern their local planning and management).
2 Population, housing and Population, housing andPopulation, housing and job targets
Determining and applying methodologies for setting these (and other targets) collaboratively.
3 Managing growth Managing growthManaging growth Locating, staging and managing infrastructure and greenfield and infill development.
4 Developing the activity Developing the activityDeveloping the activity centre concept
Determining the character, location and management of activity centres.
5 Developing the activity Developing the activityDeveloping the activity corridor concept
Determining accessibility principles as well as the character, location and management of activity corridors.
6 Developing the transport Developing the transportDeveloping the transport corridor concept
Determining the character, location and management of transport corridors.
7 Enhancing institutional Enhancing institutionalEnhancing institutional structures and decision-making
Enhancing and improving the way all levels of government and civil society work together.
8 Relating sustainability to Relating sustainability toRelating sustainability to decision-making
Planning and managing growth according to sustainability principles
9 Accessing time, money Accessing time, moneyAccessing time, money and skills
Ensuring that all stakeholders have access to skills and funds needed to deliver planning through participatory mechanisms.
Source: WAPC, 2005
Transit Oriented Development46
or in directly integrating service provision with land use planning. Instead the public transport agency has aimed to meet a minimal service level primarily as a community service obligation rather then a real alternative mode of travel to the car. The result has been an inefficient pattern of development where patronage of the bus service in the morning peak is over capacity in the peak direction (CBD bound) but under capacity in the counter-peak direction. An urban structure capable of supporting an efficient public transport service suggests particular parameters for the composition, size and location of activity centres within the network of activity and transport corridors. The rationale for the network of centres is now being based on the integration with public transport and analysis of the extent of accessibility by public transport for centres in the network is informing the choice of centres. Underpinning the regional framework in this way will provide for robustness in a way not previously seen.
Arterial roads framed around TOD as well as transport function
‘Network City’ aims to deliver TOD based around bus-transit as well as rail-transit. In the Perth context this inclusion of bus-transit is essential if TOD is not to be limited to the relatively few rail-served locations in order to have a system-wide rather than marginal impact. This will require a new approach to the design of arterial roads. Currently many major arterial roads in Perth are ‘controlled access highways’ where the intent is to limit direct access in order to maximize traffic efficiency. There are, however, limited restrictions placed on land use abutting the road and high trip generating land uses are common as are land uses that would be more appropriately located in town centres. A change to the current functional road classification system is needed to take into account not only traffic function, but also land use and quality of the urban environment (Westerman, 1998). ‘Network City’ distinguishes between arterial roads for movement of traffic across the region (transport corridors), and sub-arterial roads (activity corridors) where traffic management is needed to create safer, more attractive pedestrian environments around activity centres. Following the philosophy of the Dutch ABC location policy (MHPPE, 1991), the desire is for land use abutting transport corridors to be restricted to low trip generating uses in order to maintain the transport function of the corridor.
Capturing this intent is some current work seeking to develop planning strategies aimed at designing of TOD places and accompanying management of traffic based on new ways of assessing road capacity, contrary to traditional transport planning based on roadway capacity, level of service, speed and travel time reduction. Assessment based on a mode split predicated on behaviour change towards public transport and non-motorized modes will be needed, as will a focus on land use function and the role of streets as multi-use meeting spaces where public transport dominates rather than the carrying capacity of the road for vehicular traffic alone (Barton et al, 2003). It is already acknowledged at the state level that the same generous level of service cannot be maintained and therefore planning studies should adopt a lower level of service. But this approach essentially maintains
Implementing Transit Oriented Development through Regional Plans 47
the traditional ‘predict and provide’ approach to road planning rather than fully embracing the need for a new methodology.
Complementary actions
Other clear actions have been taken to deliver the new paradigm. A cross-agency committee has been established tasked with identifying station precincts where public interventions can be made (see chapter 10). This TOD committee comprising members of the state governments planning, infrastructure, public transport and development agencies jointly establishes priorities for action across the 100 or so centres and transit nodes (bus and rail) in the metropolitan area and then produces a coordinated action plan. The priorities are set using six simple evaluation criteria: strategic significance of location; potential for maximizing ridership; transport infrastructure need and/or opportunity; potential for jobs, amenity, services, activity, mixed uses; partnership potential (by state government, local government, the private sector and others); development (or redevelopment) opportunity. The types of actions include acquisition and protection of land to enable TOD development to occur either now or in the longer term. Already considerable progress as occurred following the opening of the southern suburbs railway in December 2007. 11 new railway stations were opened in the first phase and there has been considerable development activity within the corridor. This is evidence that the railway has acted as a catalyst for new development. Indeed many property developers chose to promote access to the railway as a key draw card in their development.
Conclusions
There has been a long history of regional planning in Western Australia. This and legacy of a strong system of planning control has finally born fruit in providing the tools for the delivery of TOD in a low density suburban city. While such a planning tool will pave the way for TOD it is evident from the work currently in progress that the regional plan must be accompanied by a set of measures which:
define and plan for TOD centres based on public transport accessibility;mandate housing and employment targets for these TOD centres in order to provide certainty for infrastructure providers (including the public transport agency)and local government;design for some arterial roads to achieve TOD at centres rather than simply maintaining a car-based traffic function;establish a framework for cross sector and cross-agency collaboration;provide for collaboration with the community.
These measures are critical for the on-going success of TOD implementation.
••
•
••

This page has been left blank intentionally
Chapter 5
Rail Friendly Transport and Land-use Policies: The Case of the Regional Metro
System of Naples and CampaniaEnnio Cascetta and Francesca Pagliara
Introduction
Despite the evident interrelations between the two systems, land use and transportation planning have tended to be separate operations in practice. On one hand, the “transport system can be defined as a land-use sub-system, made up by the combination of elements and their interactions, which produce the demand for travel within a given area and the supply of transportation services to satisfy this demand” (Cascetta, 2001, p. 9; 2006; p.15). Transportation planning has tended to be based on standard future land use patterns, which are usually derived from market projections or from exogenous land use plans. Transport systems therefore generally tend to reinforce past development trends rather than new development directions (Giuliano, 1999). On the other hand, land use planning typically takes account of the transport plan outside of the decision process, with a mere acceptance of the proposed transport interventions rather than coordinating the transport plan with future land use or, even better, using transportation infrastructures as tools to obtain desired land-use patterns. In fact, the urban plan defines the densities and the location of the activities often without considering the future impacts of these choices on the transport system (Papa et al., 2007).
Both transport and urban planning disciplines need a new holistic approach, based on complex systems theory supporting transport/land use systems integration. In practice, approaches and methods have been developed to define strategies for a more coordinated and cooperative planning process between urban and transport policies. These approaches aim to balance the assumption of land use policy as an input to transportation planning with a realization that transportation is a determinant in land use transformations and land use planning. In particular, the combined and integrated set of strategies involving transit infrastructure investments, urban development along transit lines and integrated policies have been analysed by many Transit Oriented Development (TOD) and Transit Joint Development (TJD) experts (e.g. Cervero 2004; Dittmar and Ohland 2004). The concept of transit-oriented development (TOD) is not new, but it is an idea that many developers and architects since the 1950s have shelved in favour of what
Transit Oriented Development50
is sometimes called traditional suburban development, or sprawl development. Today, with sprawl eating up open space and causing congestion problems in many communities, TOD has been rediscovered as one “smart growth” alternative.
In his book, Cervero (1998) provides an on-the-ground look at more than a dozen mass transit success stories, introducing the concept of the “transit metropolis”, a region where a workable fit exists between transit services and urban form. The author makes a compelling case that metropolitan areas of any size and with any growth pattern, from highly compact to widely dispersed, can develop successful mass transit systems.
Campania, and in particular the high density metropolitan area of Naples, have all the problems and opportunities to make it a “text-book” case of rail friendly policy. During the last four decades the road network was expanded while the rail network remained substantially unmodified, contributing to urban sprawl, increased use of car and severe congestion. Things have changed in the last ten years when a different policy based on the Regional Metro System (RMS) project carried on in Naples and the whole Campania region was initiated. The project will be presented as an example of combined and integrated set of strategies involving transit infrastructure investments, urban development along transit lines and integrated Travel Demand Management (TDM) policies.
This chapter is organized in five sections. After this introduction, in section 2 the RMS project is presented, starting from the concepts, the strategies and the actions identified in the Municipal Transportation Plan of the city of Naples (City Council of Naples, 1997) and extended to the whole region in 2001 (Cascetta, 2005). In section 3 the methodology adopted to assess internal and external impacts is described together with the design of the RMS network focusing on the transportation services and on the new infrastructures needed. RMS impacts forecast is analysed in terms of travel demand (i.e. modal split changes), level of service and externalities (e.g. environmental impacts). Section 4 focuses on the main results achieved so far in terms of new railways sections put into service, new opened stations, new rolling stock, integrated pricing and TDM policies together with some results in terms of transit ridership and car ownership compared to other Italian cities. Finally, section 5 describes the political and technical conditions that have made possible a project of this scope and magnitude in Naples and Campania, providing some insights for other locations.
An integrated railway system
With approximately 5.7 million inhabitants and a total surface area of 13,590 square kilometres, Campania is the second largest region in Italy. It is divided in five administrative provinces and two areas of very distinct natures. On the one hand there is an expansive metropolitan area centred around Naples and spanning from Caserta to Salerno, with 3.5 million inhabitants and one of the highest population densities in all of Europe and the world (2.305 inhabitants per km2 on
Rail Friendly Transport and Land-use Policies 51
average, with a peak value of 13.323 inhabitants/km2). On the other hand there is the mountainous internal area which is less accessible and shows lower population densities (average: 189 inhabitants/km2) (see Figure 5. 1). The Large Urban Zone (LUZ) of Naples is one with the highest density in the world (see Table 5.1). A LUZ is an area with a significant share of the resident commuting into the city.
During the second half of the last century, very limited investments were made to expand and/or upgrade the existing railway network. Also, these efforts followed an un-coordinated process in which decisions were taken by individual companies and there was no integrated vision of the regional railway system. Moreover, expansion projects were not coordinated with land-use decisions; in fact, the latter were often made independently of or even in open contrast with the railway system (de Majo, 2006). On the other hand during the same period major road projects were implemented both as new urban and inter-regional highways and as grade roads.
The Regional Metro System (RMS) project, which started in 1996 in Naples and extended to the whole of Campania in 2001, adopts a very different approach. Based on the insight that only a highly integrated and comprehensive railways system will provide sustainable mobility in such a densely populated area, it aims
Table 5.1 Metropolitan areas in the world: Population and residential densities
LuZ Population (inh:1000) Density (inh/km2)Istanbul 10.291 5.169Tokyo 35.197 2.607Naples 3.791 1.967Lisbon 2.363 1.602London 12.629 1.416Brussels 1.750 1.085New York 18.747 1.077Athens 3.895 1.023Paris (LUZ as Ile de Fr) 11.634 969Budapest 2.453 967Milan 5.153 918Rome 3.700 691Madrid 5.372 670Copenhagen 1.807 655Barcellona 4.805 620Varsavia 3.050 590Wien 2.122 460Munich 2.446 444Berlin 4.936 284Prague 1.942 278Source: Eurostat 2007
Transit Oriented Development52
to integrate the existing lines into a single network by building new interconnecting lines, new stations, and new modal exchange facilities.
Existing infrastructures and the new Alta Velocità (High Speed) line Rome-Naples-Salerno, which is currently under construction, provide a unique opportunity to develop such a system. In particular the 300 km/h new line, which will enable the intercity and part of the freight traffic to be re-located, will make available significant extra capacity for regional and metropolitan services on the historic lines.
The concept, however, aims further. All elements of the transportation systems – from infrastructures and services to prices and regulations – have been considered. The RMS project aims at improving the level of service of the public transportation systems (car as an option not a necessity); improving accessibility to urban activities;
Figure 5.1 Residential densities in the Campania regionSource: ISTAT 2001
Rail Friendly Transport and Land-use Policies 53
improving the liveliness of the city and promoting sustainable urban development (rail-friendly developments). Main characteristics of the RMS project are:
High frequencies for rail services;Even-spaced (easy-to-memorize) rail timetable;Connections between different lines;Homogeneous performance and high quality standards for the rolling stock fleet;An integrated (bus and rail) fare system;Integration with other transportation modes (bus and car);High standards for architectural quality and urban renewal for new stations;Integration with other land-use policies.
To achieve these objectives, the planning process defines two levels. At a first planning level, a set of “priority projects” is identified, to be completed in 10–15 years, maximizing the social benefit with respect to current physical and economic constraints. This so-called “Invariant Scenario” of the system design comprises new infrastructures and transportation services, aiming at optimizing the budget currently available, and outlining a first hypothesis on the public transport network. Specifically, the total extension of the railway network will be increased by 14 percent, from currently 1,179 to 1,349 kilometres. There will be new national and regional lines, new urban lines, 92 newly built stations and new terminals (see Table 5.2). In the city of Naples alone, the overall number of railway kilometres will be increased by 25 percent, the number of stations by 31 percent, and the number of railway interchange nodes by 60 percent. The existing lines, the ones under construction as well as the planned lines are reported in Figure 5.2. From 2000 to 2006 the railway endowment of the city of Naples has increased by 37 percent; at the end of the project the railway endowment will be among the highest
••••
••••
Table 5.2 The RMS project, 2010: Infrastructures (invariant scenario)
Total extension of the railway network Base 1179 km2015 1349 kmChange 170 km% change 14 %
new infrastructures new national and regional lines 153 kmnew urban lines 17 km
no. of stations Base 3402015 467% change 37 %
new terminals total no. of new stations 92stations improved 15park and ride 28
Transit Oriented Development54
in Europe. Table 5.3 reports the main lines opened in the period 2000–2006 and currently under construction.
Consistent with emerging concepts of planning processes, the system will be incrementally developed further by integrating, and partly redesigning, these first hypotheses, taking into account the recent evolution of the transport/land-use system, mobility needs, and the economic resources available (Cascetta, 2005). In fact, at a second level of planning, the design of the overall public transportation system is completed by a set of options (“Options Scenario”), to be verified through feasibility studies and carried out over the long term.
At the same time, a new strategic role has been assigned to the train stations. They have been conceived as a means of urban and territorial renewal, the objective being to improve the accessibility and interconnectivity of urban sites, but also as “trade marks” of the new quality provided by the RMS.
Another important perspective of the project consists in the interconnection with the national high-speed railways system. The new high-speed station will be built in Afragola, 3 kilometres to the north of Naples, and cover a surface are of 20,000 m2 with a possible extension of over 10,000 m2. Necessary investments have been forecast at over 70 million euros, operation is planned to start in 2010. The station will be in the midst of several settlements of average size, with a population between 50,000 and 100,000 inhabitants.
The architectural design by the Iranian architect Zaha Hadid will strengthen the identification with the whole area. The station has been designed in the shape
Figure 5.2 Network for the city of NaplesSource: Secretary of Transport for Campania Region
Rail Friendly Transport and Land-use Policies 55
of a bridge which, vitalized by commercial functions, traces a path in a structure of concrete and glass. For this station, the number of transit passengers has been forecast at approx. 12 millions per year (33,000 per day) with an average of almost 5,000 during peak hours. Approximately 300 trains will be in service, with a maximal service interval for local trains of 6 minutes.
expected and actual changes in transport and land use systems
As the new system involves significant alterations to both infrastructures and transportation services, it will also change the supply parameters perceived by users (travel time, frequency and reliability of services, monetary costs, etc.) as
Table 5.3 Main lines opened 2000–2006 and lines under construction
Projects completed Lines km new/renewed stations
Naples Metro - Line 1 5.2 6Naples Metro -Line 3 29.6 10Naples Metro -Line 6 2 4Regional Metro: Piscinola – Aversa 3.2 2Regional Metro: Acerra - Pomigliano 3 1Regional Metro: other Lines – 9Regional Metro Total 43 32High speed/High Capacity Line 56
Interventions under constructionLines km new/renewed stations
Naples Metro - Line 1 3.5 5Naples Metro – Piscinola - Capodichino 4.4 4Naples Metro - Line 5 5.4 2Naples Metro -Line 6 3.8 4Naples Metro – Line 7 3.2 2Naples Metro – Line 8 3.5 1Salerno Metro 7.6 7Regional Metro: Piscinola – Aversa 6.6 4Regional Metro: Teverola – S.Maria Capua Vetere 10 4Regional Metro: Naples – Pompei - Poggiomarino 6 3
Regional Metro: Naples-Sorrento 5.5 0Regional Metro Total 59.5 34High speed/High Capacity Line 58 1
Transit Oriented Development56
well as the accessibility of the different zones. As a result, travel demand will probably change with regard to frequency and length of trips, shares of different modes of transportation, and network flows. The studies described below were used to design and evaluate different scenarios as well as the basis for feasibility studies of the single lines.
To forecast these effects for the different scenarios, a model has been developed which is capable of simulating users’ behaviour with regard to their travel choices (see Figure 5.3 for the underlying framework). From the modelling point of view the model system is the four-stage demand-assignment model applied to several trip purposes and users’ classes.
According to this model, the modal share of public transportation in extra-urban traffic will increase from 40 to 60 percent within greater Naples, from 36 to 51 percent for exchange trips to Naples, and from 20 to 33 percent for exchange trips to Salerno (see Table 5.4). In the Campania region as a whole, the number of passenger kilometres will increase by 110 percent on railways and by 11 percent on buses (Nuzzolo and Negro, 2005).
Figure 5.3 Transportation system model for the Campania regionSource: Secretary of Transport for Campania Region
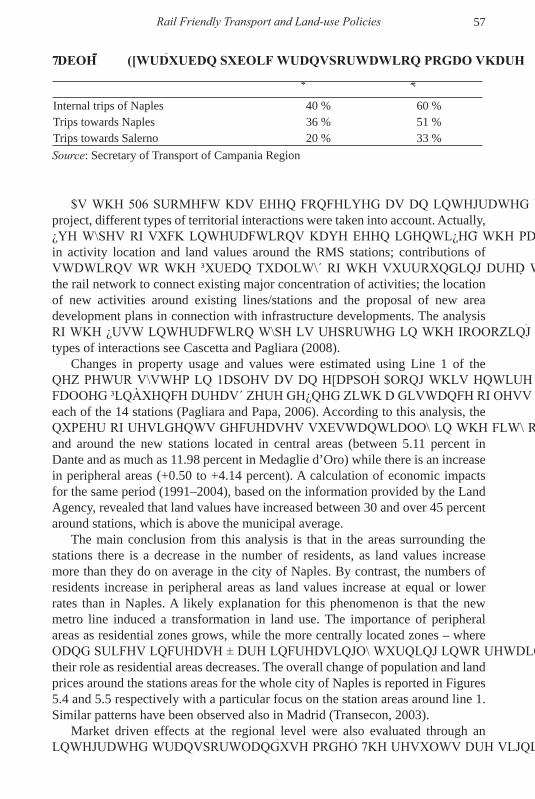
Rail Friendly Transport and Land-use Policies 57
As the RMS project has been conceived as an integrated transport land-use project, different types of territorial interactions were taken into account. Actually, five types of such interactions have been identified: the market-driven changes in activity location and land values around the RMS stations; contributions of stations to the “urban quality” of the surrounding area; the “branching out” of the rail network to connect existing major concentration of activities; the location of new activities around existing lines/stations and the proposal of new area development plans in connection with infrastructure developments. The analysis of the first interaction type is reported in the following. For details of the other types of interactions see Cascetta and Pagliara (2008).
Changes in property usage and values were estimated using Line 1 of the new metro system in Naples as an example. Along this entire railway line, so-called “influence areas” were defined with a distance of less than 500 metres from each of the 14 stations (Pagliara and Papa, 2006). According to this analysis, the number of residents decreases substantially in the city of Naples (-6.76 percent) and around the new stations located in central areas (between 5.11 percent in Dante and as much as 11.98 percent in Medaglie d’Oro) while there is an increase in peripheral areas (+0.50 to +4.14 percent). A calculation of economic impacts for the same period (1991–2004), based on the information provided by the Land Agency, revealed that land values have increased between 30 and over 45 percent around stations, which is above the municipal average.
The main conclusion from this analysis is that in the areas surrounding the stations there is a decrease in the number of residents, as land values increase more than they do on average in the city of Naples. By contrast, the numbers of residents increase in peripheral areas as land values increase at equal or lower rates than in Naples. A likely explanation for this phenomenon is that the new metro line induced a transformation in land use. The importance of peripheral areas as residential zones grows, while the more centrally located zones – where land prices increase – are increasingly turning into retail and office locations and their role as residential areas decreases. The overall change of population and land prices around the stations areas for the whole city of Naples is reported in Figures 5.4 and 5.5 respectively with a particular focus on the station areas around line 1. Similar patterns have been observed also in Madrid (Transecon, 2003).
Market driven effects at the regional level were also evaluated through an integrated transport/land-use model. The results are significant as they show that
Table 5.4 Extra-urban public transportation modal share
2000 2015Internal trips of Naples 40 % 60 %Trips towards Naples 36 % 51 %Trips towards Salerno 20 % 33 %Source: Secretary of Transport of Campania Region
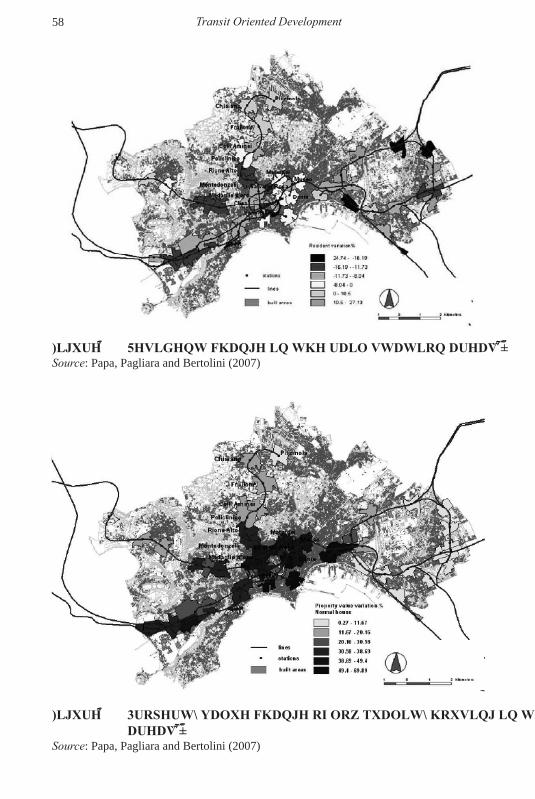
Transit Oriented Development58
Figure 5.4 Resident change in the rail station areas, 1991–2004Source: Papa, Pagliara and Bertolini (2007)
Figure 5.5 Property value change of low quality housing in the station areas, 1991–2004
Source: Papa, Pagliara and Bertolini (2007)
Rail Friendly Transport and Land-use Policies 59
the RMS is able to increase by 9 percent the population in the influence areas of the new stations and by 7 percent the workplaces in the service sector for the same cities with respect to the reference scenario with no RMS extension. It is also interesting to observe the effects on land-use which induce a significant increase in terms of modal share on rail ridership as rail-oriented developments increase the demand to be served by rail (Nuzzolo and Coppola, 2007).
As far as environmental impacts are concerned, simulations have revealed a general improvement in air quality: CO emissions are expected to decrease by 7.5 percent, HC by 8.2 percent, NO by 8.0 percent, and CO2 by 10.5 percent. In addition, the RMS project will contribute considerably to road safety, promoting specific road safety programmes at the level of both municipalities and provinces of Campania region.
A cost-benefit analysis of the whole RMS project has been carried out using the methodology proposed by the European Commission (Harberger and Jenkins, 1998). The ratio between costs and benefits is 1.86; considering an Internal Return Rate of 22.8 percent it follows a positive NPV of around 1,000 million euros. The fact that the RMS project has been conceived in the first place as completion and/or upgrading of the existing, historical network is, incidentally, an important explanation of the high values of the C/B ratio and of the IRR. The total investment costs are reported in Table 5.5. The project has greatly benefited from the joint, synergistic use of different funds: European, national and regional. In particular, the opportunity of using European funds for Objective 1 regions (such as Campania) and national investment programmes in infrastructure have given the chance to build a complete programme of interventions in terms of infrastructure.
Implementation and intermediate results of the RMs project
As the RMS started over ten years ago, some significant results are already visible. In 2000 the railway network comprised 1,179 kilometres with 153 stations; by 2006 some 40.5 kilometres of new lines and 24 new railway stations had been added. Together with the additional 129.5 railway kilometres and 59 new stations planned for the next ten years, this will result in an overall increase by 14 percent in railway kilometres and 24 percent in the number of stations by 2010. Eleven high-frequency trains were acquired between 2002–2003, with the region contributing 13 million euros. Each of the four railway companies involved
Table 5.5 Investment costs
Total costs (M€)
Already spent (M€)
Other available resources (M€)
To be raised (M€)
Railway network (km) 7.957 2.800 1.950 3.207Source: Secretary of Transport of Campania Region
Transit Oriented Development60
(Trenitalia, Circumvesuviana, Sepsa, and Alifana) is investing significant funds in the acquisition of new vehicles. By 2015, another 220 new trains will have to be acquired, requiring a further investment of over 381 million euros (Nuzzolo and Negro, 2005).
The new integrated timetable for the regional railway service (“Metrocampania”) supports the integrated system approach and also facilitates the synchronisation of services offered by presenting the timetable of the operators as a single network of lines with rendez-vous at critical interconnecting stations. The overall strategy is to improve the attractiveness of public transportation in the whole door-to-door chain, thus facilitating the use of environmental-friendly transportation modes and reducing the use of private vehicles.
Another crucial element of the RMS project is the integrated fare system “Unicocampania”, one of the most extensive of its kind in Europe (Negro and Gentile, 2005). It offers one single fare structure for services provided by no less than thirteen public transport companies operating 27,000 bus runs and 1,500 train runs every day. The purpose of this fare system is to promote an integrated use of carriers and modes, foster customer loyalty, and encourage the use of monthly and annual tickets. There is an “UNICO” ticket for travelling the whole region which covers twelve zones, including Naples and all other municipalities, and there are “UNICO” tickets to travel within the five main urban areas of Campania.
The significant role of the railway stations in the re-qualification and urbanization of the surrounding areas is best exemplified by Line 1 (Gravagnuolo, 2005). Focusing on wide, bright and “smart” places, the concept aims to make the use of public transport more pleasant and attractive. Moreover, the involvement of famous architects, such as Gae Aulenti, in (re-)designing the stations and the introduction of artistic elements to the interior and exterior of the stations, such as sculptures, innovative building materials, and works of modern art, make the new section “Art Metrò” unique on a worldwide scale. With its extravagant combination of art and urban planning, it is something to be included in tour guides. Rather than just being used for travelling fast, comfortably and ecologically within the city, it will be another important vehicle to communicate to the world the new image of the city of Naples.
One example of modern architecture, designed by the Italian architect Alessandro Mendini, is Salvator Rosa station. It has two exits, which have completely renewed the area – former symbol of property speculation. Forms, colours and mosaics now give life to the blind sides of the big buildings surrounding the area of the station. The entrance is located in a wide environment characterized by marbles, dominated by a high pinnacle with coloured arched windows. In the surrounding area, there is a wide terraced garden, within which there are, restored and so recovered from their abandoned state the ruins of a roman bridge and a nineteenth-century chapel with mosaics and sculptures. Like in a small Neapolitan Pompidou centre, there is also an amusement park whose forms have been designed by the Italian sculptures Mimmo and Salvatore Paladino, as well as a long external escalator stretching until Leonardo square (see Figure 5.6).
Rail Friendly Transport and Land-use Policies 61
Also the stations outside the centre of Naples, both in the periphery of the city and in the towns connected by RMS are being designed by architects with different backgrounds and experiences, from Neapolitan architects to international stars as Peter Eisenman.
Afragola station will represent the core of the new natural-technological park proposed in the urban development and renewal plan for the area, which further includes high-tech labs, centres for agriculture experimentation, sports facilities, and a large exhibition area. For the areas surrounding the station, a complete transformation is envisaged which will result in two different territorial ambiences. The first will be an agriculture area of 474 hectares, representing the “green area” of the metropolitan city of Naples. The natural/technological park and the services area will form a “green entrance” into the city, made up of free areas not covered by buildings, integrated in a services and economic activity system including the new rail infrastructure. The objective here is to create new services, facilities and green areas by re-developing all abandoned spaces and re-locating some of the industrial facilities.
All the above efforts to increase the attractiveness of public transport in conjunction with severe park pricing policies in the centre of Naples have resulted in significant increases in transit ridership in the city as well as in the whole region. These increases are more significant if they are compared with the rest of the country.
In Figure 5.7 the changes between 2000 and 2005 of car ownership and of transit ridership reported by ISTAT, the official Italian Institute for Statistics, are presented. For the city of Naples, it is possible to see an increase in transit ridership equal to about 27 percent, which is the highest in Italy, and a decrease in car ownership of around 7 percent.
Figure 5.6 Salvator Rosa before and after the station projectSource: Munipality of Naples
Transit Oriented Development62
some lessons learnt from the project
The RMS project can be considered an encouraging example for other cities and regions, because of its results and because it shows that radical, trend-breaking change is possible, when the right conditions are in place. The main ones can be summarized as follows:
Integrated approach. The RMS project has been conceived as an integrated project including infrastructures, rolling stock, technologies, pricing, timetable. Furthermore, the RMS project has been planned as an integrated transport / land-use project (Wegener and Furst, 1999; Transecon, 2003). Throughout its development, different types of territorial interactions have been taken into account, such as changes in activity location and land values around the RMS stations; contributions of stations to the “urban quality” of the surrounding area; the “branching out” of the rail network to connect focal points of economic or tourist activity; the location of new activities around existing lines/stations; the proposal of new area development plans in connection with rail-infrastructure developments.Innovative design and marketing. The combination of transport infrastructures with architecture, contemporary art and archaeology is key to the new way of marketing public transportation. Rather than a low-cost public service, it’s now something that displays quality and innovation. Some of the stations recently built are of outstanding architectonic merit,
1.
2.
Figure 5.7 Changes of car ownership and transit ridership, 2000–2005Source: ISTAT
Rail Friendly Transport and Land-use Policies 63
designed by internationally renowned and local architects, and giving evidence of the quality of architectural expertise in the region. Also contemporary art is now perceived differently, no longer withdrawn inside museums but exposed to the public.Political continuity. The fact that in Campania the same government has been in place for 14 years is certainly one of the key success factors. The strong leadership of Antonio Bassolino, first as Mayor of Naples (for 7 years since 1993) and then as President of Campania region (5 years since 2000 and re-elected for other 5 years in 2005), has provided an opportunity to start long-term programmes led by political vision.Federalistic process in Italy. Substantial institutional changes took place in Italy in the past 15 years. City mayors and regional presidents are now directly elected (since 1993 and 2000, respectively), making both offices politically stronger. In addition, the country has undergone a phase of deep change in the transport field which, above all, can be attributed to the new role of the regions. Through the reformed Constitution and the policy of administrative federalism, regions have been given power and resources mainly for railways and ports. An additional national reform and new regional regulations followed for local public transport. As a result, the citizens have gained more political influence and more institutional tools to reach objectives.Involvement of all political levels. The new regional bill entitled “Reform of Local Public Transport and Systems of Mobility in Campania region” modifies the transport sector’s organization and programming. It specifies the competences of the region, municipalities and provinces; it transfers important resources and know-how to local authorities, and it defines the market conditions for the production of transport services, while at the same time safeguarding citizens’ interests. Local communities were involved in the decision process on new lines, stations, and urban investments, which has created a strong consensus and high expectations toward the project.Combined use of European, national and regional funds. The opportunity to use European funds for Objective 1 regions, such as Campania, as well as national investment programmes in the integrated infrastructure field provided a chance to set up a complete programme supported by several funding sources.Joint involvement of the public and private sectors. The use of private capital funds for improving transport infrastructures (such as stations) by selling commercial spaces is being explored. An example is the main Central station of Naples in Garibaldi square. Increases in real estate taxes due to underground stations are used to pay for long-term loans.
3.
4.
5.
6.
7.

This page has been left blank intentionally
Chapter 6
Retrofitting TOD and Managing the Impacts: The Case of Subi Centro
Andrew Howe, Geoff Glass and Carey Curtis
Introduction
This chapter addresses the question of how to manage the impacts of creating a new TOD precinct within the existing urban fabric. Retrofitting TOD presents a significant challenge compared to creating TOD on a greenfield site. Subi Centro, a new TOD precinct in Western Australia, is held up as the best ‘living’ example of TOD in Australia. It is a highly awarded transit oriented redevelopment project centred on a sunken railway station that has become the new hub for an array of successful commercial and residential developments. An outline is given of the perceived issues and concerns in the period before the development of Subi Centro. These include concerns about the impacts on existing retail and community reaction to major changes. An account is given of the Subi Centro design approach and rationale. This is followed by a consideration of the outcomes of the redevelopment after implementation. The reasons for success are examined. As the development has been retrofitted within the existing urban structure, the story is completed by examining the steps taken to ensure that the new development did not impact adversely on the existing area. In this way the implementation model examines both the actions of a redevelopment authority (RDA) and the actions of the local authority within which the RDA sits.
Case study: subi Centro
The Subi Centro project raised an extensive set of planning challenges in that it involved complex engineering in the undergrounding of an above ground railway, significant environmental remediation of a previous industrial area, the desire to build a new and stimulating urban form hitherto unseen in Western Australia for almost a century and the requirement to have extensive community input.
The redevelopment area of some 80 ha sits on the northern boundary of the inner city suburb of Subiaco (710 ha), one of Perth’s oldest suburbs located 3 kilometres west of the Perth CBD (Figure 6.1). The history of Subiaco is one of boom and bust. The development of this suburb began in 1850 with the Benedictine monks building a monastery and later a hospital. In the 1880s the gold boom resulted
Transit Oriented Development66
in demand for housing, mostly workers and trades accommodation. During this time the Fremantle to Guildford railway line opened and this has always played a key role in the development changes of the suburb. Subiaco’s relationship with the Perth CDB has varied over the years. In the early days with its proximity to the CBD its role was predominantly as a dormitory suburb and service yard. Built on a traditional grid pattern the suburb’s residential areas are typically leafy with Federation dwellings displaying a very conservative built environment. Today Subiaco is regarded as vibrant, successful and fashionable, having developed a role as a regional shopping area and an entertainment centre sporting numerous bars, cafes and restaurants centred on the Rokeby Road main street. However, as a commercial centre in the 1980’s that was not the case and it was perceived to have major shortcomings. The buildings had become tired, the scale of shopping on offer did not match the major regional shopping centres and retail vacancy rates were relatively high. In response to this the ‘Subiaco Mainstreet’ project emerged with a mission “to unite all retailers, businesses, residents and shoppers together for the same goal – to promote and revitalize the Subiaco area” (Subiaco Business Association, 1993, p. 3). But despite considerable effort and good intentions the project struggled and collapsed after a few short years. Agreement on priorities was not able to be reached and there was criticism from the owners of other commercial centres within the City. In addition the Council only provided limited support and the business community by itself was not able to fund the implementation of the plan.
North of the railway line was the Jolimont Special Area zone and this was to become the focus for the Subi Centro TOD redevelopment project. The area was in decay with a number of large industries closed and either relocated or planned to close and relocate to newer industrial estates in the middle and outer suburbs. This led to the State Government exploring the possibility of selling its land holdings in that locality. At the time a proposal was presented to raise the railway line by 2 metres to overcome problems at the Hay Street underpass which for a long time
Figure 6.1 Subi Centro redevelopment area
Retrofitting TOD and Managing the Impacts 67
had been a traffic bottleneck. However, the community reacted strongly against the proposal seeing it as accentuating the already existing physical barrier posed by the railway line through Subiaco. As an alternative the City developed a concept called ‘Subiaco 2000’. That concept proposed the lowering of the railway line instead. The City engaged the Institute for Sustainability and Technology Policy at Murdoch University to develop a comprehensive mixed use redevelopment. The concept fitted well with the then Commonwealth Government ‘Building Better Cities Program’ which had objectives relating to promoting integrated urban planning, providing housing choice and affordability and improving links between housing, employment and services. After considerable lobbying, AUD $5m of the ‘Building Better Cities Program’ was set aside as a contribution towards sinking the railway.
To achieve the TOD concept and redevelop the surrounding lands the City of Subiaco envisaged the formation of a new statutory authority, the Subiaco Redevelopment Authority (SRA). In 1994 the Subiaco Redevelopment Act, modelled on the East Perth Redevelopment Act, was passed through State Parliament and the Subiaco redevelopment project was created. The idea was that the SRA would oversee the redevelopment project based on the expectation that it be totally self-funded with initial seeding money provided by the State through loans utilizing the land as collateral. This required legislation in order to transfer the City’s endowment land into freehold and thereby allow its sale to enable new development that needed freehold title (rather than leasehold) to be established. Once the project was implemented and sufficient land sold to meet the cost of the project the statutory authority would be terminated.
The City agreed to the formation of a redevelopment authority because it was regarded at the time as probably the only way that such a project could be achieved. The City of Subiaco as a small local authority typically operates with a high sensitivity to established interests. In representing that local interest they appear to be aided by a planning system that is designed to preserve the status quo rather than to facilitate future development. To enable the redevelopment to proceed with the necessary powers and will a statutory authority was accepted as the appropriate vehicle. But this was on the proviso of up-front public opportunity for input in developing the plan and on the assumption that Council membership of the governing Board of the SRA ensured a true partnership took place.
The design approach
The concept, shown at Figure 6.2, comprised the under-grounding of the existing train station and railway line in order to provide a strong north-south axis between the Rokeby Road main street and the redevelopment area. This strong axis was a critical component to the success of the retrofitting providing both physical and psychological links to Rokeby Road and directly through to the residential areas of the project. The project really only made sense financially if Subiaco’s land values
Transit Oriented Development68
could be translated north to the redevelopment area, so the links, both physical and psychological needed to be strong and clear. Under-grounding the station also provided new opportunities for redevelopment in close proximity to the station. On the east-west axis the design concept provides for a ‘Greenway’ linking the city to the sea. The core retail area is presented as an extension and at the same time a ‘full stop’ to the ‘mainstreet’ and includes an urban square. Adjoining this are mixed use areas that provide the employment base for the area and build on Subiaco’s growing market in this area. Employment uses are integrated with higher density residential uses. Surrounding the core area are medium density residential areas.
A great deal of attention was given to specific components of the design concept in relation to its development context. One important aspect was the recognition that not every new TOD should compete with the existing urban structure; rather it should find its niche. For example commercial analysis for Subiaco indicated that the city could sustain a further 20,000 sq. m. of retail floorspace, but the community disagreed so a compromise saw a reduction to 10,000 sq. m. The rationale was that Subi Centro was to be a supporting centre to Subiaco not a competing one. This was a critical issue in a retrofit model.
Despite being a TOD development, parking provision was one of the issues that dominated the consultation process. The SRA considered reducing parking but this raised concerns about the impact on the town centre. The majority of the Subiaco town centre is particularly pedestrian friendly; however it was important to plan for both cars and pedestrians in Subi Centro. The agreed outcome was to place the majority of parking underground, under buildings and under the roads. This required an innovative three dimensional land titling system to be utilized, allowing private basements to be developed under local authority roads and services. Above ground, parking was provided around the central square as an interim measure. This was on the basis that cars would provide for access and activity during the week or until strong pedestrian activity was established. The design provides for the possibility of restricting vehicular access within the square
Figure 6.2 Development concept plan
Retrofitting TOD and Managing the Impacts 69
if pedestrian activity increases because an alternative access is available. The SRA had to fight to achieve this component and it has proved essential for now.
The design of the urban environment in Subiaco is contrary to local authority standards. This is because it provides for kerb-less, multi-serviced (power, water points etc) street space. It is also flexible in that the various spaces within the Square can be utilized for special activities while at the same time providing access for pedestrians, cyclists and cars in other areas. Design speed limits are also lower than the norm. In many cases the local traffic management standards sometimes needed to be broken or rewritten. For example, reciprocal car parking rights for uses not ordinarily seen as being compatible were accommodated within the precinct and have by and large proved to be a success.
An important consideration was the need to design transit with development in mind. The idea was to plan the land use first with the transit system designed to serve it. The railway line already existed in Subiaco, but theoretically its location could be varied. In the end, however, it was the engineers who worked out the most cost-efficient place to put the station and then land use solutions had to be planned around this. This resulted in some lost opportunities. For example, had the station been located to the east a few more metres the development block would have been far more efficient. In addition the levels of the whole street had to be lowered at some cost but these costs were not taken into account when being ‘engineered’. The Public Transport Authority insisted on there being no building over the railway tunnel itself and this presented an additional design constraint. As a result while the railway was removed from sight, the constraint of its alignment had to be designed around. This was turned into a positive outcome by the creation of the east-west greenway and by relocating one of the major through roads over the tunnel.
The need to plan for a mix of uses was an important design component. In Subi Centro this has been achieved as vertical mix rather than horizontal and this has made this approach acceptable (such as offices above shops). It is not restricted by arbitrary plot ratios which are used elsewhere mostly as an arbitrary limit for negotiation purposes. This approach was unique at Subi Centro, but has paved the way for such an approach elsewhere in Perth. It was important to set guidelines for both built form and plot ratios to produce the land use mix required.
The inclusion of civic uses was an important design element but this created some tension because the local authority wanted the project developer or the Public Transit Authority to pay for and manage civic uses. One problem was that it was not clear what was needed. For example a request for a building to provide for a police presence was questioned by the developer who did not want to effectively donate a building to the Council where the police were not sure they wanted it or would use it effectively. There was a similar issue with the amount of public open space to be provided. The community, backed by the Council, requested a greater amount of public open space. While this may have been a legitimate request, it was not supported by an open space strategy and as it was not originally budgeted for its provision resulted in an expensive outcome.
Transit Oriented Development70
While there were some design constraints, overall it can be seen that the total concept presented new forms of development, new approaches to street design and to parking arrangements hitherto unseen in metropolitan Perth. These attest to the need for a redevelopment authority as a model because this approach provided the opportunity for experimentation and innovation outside the constraints of the typical local democratic and conventional development process.
Development outcomes
The Subi Centro redevelopment is almost complete. The railway line has been sunk, the public infrastructure works completed and virtually all the original concept plan developed. It is an attractive area, high quality public spaces have been created (Figure 6.3) and not unimportantly the redeveloped railway station is well integrated into the public space and urban area. At the macro level Subi Centro can be considered a model of ‘new urbanist’ development. A strong argument of TOD is that a station precinct should not just be a place of departure but it should also function as a place of attraction in its own right. In the case of Subiaco prior to the redevelopment the railway station simply functioned as a transport facility. The redevelopment has created a ‘place’ function. Within months of the under- grounding of the railway a new café opened oriented towards the railway. This has been followed by other cafes, restaurants and a food supermarket.
Development change has been significant. In 1996 there were no dwellings in the area, by 2005 there were over 1000 dwellings together with 70,000 sq.m commercial floorspace and 9,000 sq. m. retail floorspace. The dwelling density has increased by 10 percent but there are suggestions by some that this is not a great enough increase. Some have also argued for height increases, suggesting that five to six storey developments would have been acceptable immediately around the station rather than the two to three stories actually achieved. It is interesting to consider this aspect from the perspective of transit ridership. The project has added approximately 6000 workers and residents which equates to a 20 percent increase. As a result, Subiaco station boarding’s have increased considerably (from 9000 in 1996 to 15000 in 2002). Nevertheless, while there is no requirement for a minimum density within close proximity of a railway station this issue remains unresolved.
Subi Centro has exceeded all financial expectations moving from the original goal of being self-funding to generating a healthy profit both for the State and the Council. Land values to the north of the railway line rose from $80 per square metre in 1994 to $2700 in 2005. Commercial land is around $2000/m2 and rents are up to $400m2 per year. Complex projects (which TODs can be) are usually difficult for the public to comprehend. Artists impressions do not seem to provide the comfort those communities need to accept such change. The initial vocal local opposition and pessimism about the impacts of the proposed redevelopment project, both from the residential and business sectors have over time been silenced, while
Retrofitting TOD and Managing the Impacts 71
the commercial negatives have simply not materialized, in fact the opposite has occurred. Far from being the imagined threat to the established businesses, it has enlarged the commercial cake. The old and the new have created a synergy that has been to each others benefit. This has had a spill over effect in raising property values and rents; this is an important measure of success.
Subi Centro’s success, however, cannot all be attributed to good planning and quality management. As much it has been about being in the right place at the right time. Context is all important and recognition of the fact that this is not a model that can simply be transplanted and applied in other circumstances and so be expected to replicate success. Subi Centro has had certain features common to other successful TODs and some distinctly local that have contributed to that success. The relatively large area of land, with almost all of it held in public ownership was important. The land was of a size able to generate a critical mass of new development and it was also either vacant or considered to be largely underutilized. The location of the site was critical to success enabling the new development to become attached to an established and diverse town centre that had a distinctive heritage based character. This attests to the value of the retrofitting approach. The fact that the site was additionally located within proximity to the Perth CBD was an asset by providing accessibility and convenience. Under the redevelopment authority model the primary developer was the planning authority, although the private sector has also invested over $1billion into the project subsequently. This not only provided an initial direct grant of public monies but under public management the development project was able to absorb a long time horizon before requiring a financial return. While the change of land uses exploited the greatest value uplift the timing was a factor in success as the development caught the boom in property prices. These features, some of which are more readily able to be reproduced than others provided the foundation for success, irrespective of the quality of the planning, design and management. What can be said is that all projects have a window of opportunity at some point. The key is to recognize that opportunity and act accordingly.
Managing the impacts of a successful TOD: Retrofitting in an established area
As the project nears completion its economic success is now impacting on the established town centre with the near saturation of site take-up in the SRA project area. The development approach seen on the SRA land is now being tested on land within the established area. These impacts and consequences beyond the SRA’s immediate boundaries need to be planned for and this is an important component of the full implementation model.
The ‘old town’ of Subiaco is experiencing development pressures that threaten to undermine the very features that make it an attractive and healthy local economic centre. There are fears that the Rokeby Road ‘mainstreet’ could be a victim of the project’s success. There is a need to ensure that the town centre is a successful
Transit Oriented Development72
blending of the old and new and that the scale of any proposed new development is not at odds with the existing community’s expectations for an ‘urban village’. This requires the need to avoid the potential for over-development to be at the expense of good design and to manage the risk of over-scaling of adjacent new developments impacting on existing heritage buildings. Another issue is the need to resist the pressure for site consolidation which can break down the existing fine grain of development and diverse ownership pattern. There is also a need to ensure the diversity of uses is maintained including the provision of ‘daily needs’ goods and services to fashion, and other non food comparison shopping. In addition there is potential for loss of certain businesses due to redevelopment pressures, mainly for residential development. Other concerns included the need to specifically counter the tendency for licensed premises to congregate and transform perceptions about the safety and attractiveness of the town centre. Despite the city centre’s proximity to the railway there are also continuing demands for more parking and so a need to avoid the way in which such provision could dilute the character of the centre.
As a result of these concerns the City of Subiaco has developed the ‘Subiaco Central Development Plan’ (City of Subiaco, 2006). This plan draws on a set of principles which were highlighted to the City initially in the late 1990’s by a US urban designer, Cy Paumier. He had been engaged to give advice regarding revitalization of the town centre through the introduction of design improvements. The principles followed a basic philosophy as follows:
Diversity of use – take maximum advantage of the potential for market synergy by encouraging a balance of functions that attract more people frequently and hold them for as long as possible.Compactness – the town centre needs to be compact and walkable with a tight physical structure and an efficient spatial arrangement to create a critical mass of activity.Intensity – the development density should allow the town centre to be recognizably the community’s central place, however, intensive use need not always mean high rise as the potential for over-zoning may give rise to pressure to replace the existing older character.Balance – over-concentration of any one use should be avoided and activity generators should be interspersed to keep the centre alive day and night, weekday and weekend.Accessibility – while vehicle access and parking should be convenient and efficient there needs to be a clear emphasis on the primacy of the pedestrian environment.Functional linkages – convenient links between activity centres should be direct, physically attractive and edged by interesting activity.Positive identity – culture, entertainment and special events programming are influential in building an attractive image of a town centre where people want to belong, not just shop or work at.
•
•
•
•
•
•
•
Retrofitting TOD and Managing the Impacts 73
These principles in turn have been applied to a number of plans. The first plan is the ‘Indicative Development Plan’ (City of Subiaco, 2006) which expresses the medium term potential for improvements to buildings and the public domain. The second plan, the ‘Framework Plan’ (City of Subiaco, 2006), translates the principles and opportunities explored in the Indicative Development Plan into simplified urban design elements. Finally, the Framework Plan is enlarged into segments (Framework Tiles) to provide greater detail. These plans collectively provide an understanding of the form and function of the Subiaco town centre, and form the basis for an implementation strategy and recommendations. They provide the basis for identifying prospective growth sites and their character and a reliable assessment of likely future land use needs, and identify opportunities to integrate residential or other forms of development around the centre. Specifically on identified strategic sites where major redevelopment is anticipated and where there is likely to be significant public interest, development guidelines and illustrative sketches prepared to give a sense to both the development industry and the public of what is a desirable form of development.
The overarching aim is that within the constraints of a zoning-based planning system, that is inherently reactive at the local level, the City is able to be proactive and promote a form, type and use of development that is desired and that contributes to the successful long term functioning of the town centre. That is, a centre that continues to thrive following the completion of the TOD and where the diversity, character and urban grit that made it attractive initially are not sacrificed and replaced with a uniform interpretation (i.e. cookie cutter) of what it means to be urban.
Conclusion
This case study demonstrates the value of a redevelopment authority in delivering an integrated outcome. This enabled land to be consolidated under one ownership. This together with the statutory powers awarded to the RDA provided a powerful control over any development within the area. As a result a set of integrated design guidelines could be applied across the whole precinct so overcoming the fragmentation problems often experienced in other redevelopment projects. This design approach also provided the opportunity for experimentation, enabling traditional design solutions to be challenged and measured against new ideas about the physical form of TOD. The RDA approach also offered a way out of the community resistance to change issue which has so often prevented TOD occurring in other locations (the Rice chapter attests to this). Instead local concerns were balanced against regional benefits.

This page has been left blank intentionally
Chapter 7
From Concept to Projects: Stedenbaan, The Netherlands
Verena Balz and Joost Schrijnen
As cities tend to spread and coalesce into lower density urban regions, public transport systems are evolving from mono-centric hierarchical structures into multi-nodal horizontal networks. This evolution of metropolitan regions with a multitude of relations and dependencies require not only new forms of transport but also new methods of spatial planning. The biggest danger to an emerging metropolitan area is that of fragmented development and consequently missed opportunities. The project Stedenbaan strives to establish a planning context within which cities are not competitors but partners that work on diverse and complementary developments.
The south Wing of the Randstad
Zuidvleugel, literally South Wing, is the name given to the densely populated 60-by-40-kilometre area in the Dutch province of South Holland. The South Wing is part of the Randstad conurbation that has historically evolved around the Rijn delta and forms today, with Schiphol (one of the largest airports in Europe) and the harbour of Rotterdam an important link between European and global networks. The Randstad is embedded in a set of other European regions: the regions around Greater London, around Antwerp and Brussels, Lille and the Ruhr.
The Randstad is the largest and economically most important urban network in the Netherlands. However, over the last few years the Randstad’s international competitive position has deteriorated in comparison with other metropolitan regions of Europe. This decline is also reflected in the economic development of the southern part of the Randstad, the South Wing. Since 2003, the South Wing Administrative Platform, a partnership of the South Holland provincial council, local and regional authorities in the area, has been carrying out extensive research into the region’s problems and future prospects. This research has provided the basis for a number of coordinated operations in which the partners work together to strengthen the South Wing’s internal cohesion and economic competitiveness. The South Wing Administrative Platform and the Ministry of Housing, Spatial Planning and the Environment have developed a joint strategy for the area, which gives special attention to the improvement of infrastructural networks; both road
Transit Oriented Development76
and public transport (Ministerie van VROM en Bestuurlijk Platform Zuidvleugel 2006, 7). The urgency to improve accessibility in an area that functions as an international logistics and distribution centre has been underlined in governmental advice to the region and reports of the Organisation for Economic Co-operation and Development (OECD 2007, 102–11).
Regional transport in the south Wing
The South Wing area has three and half million inhabitants and one and a half million employed people, making it one of Europe’s most densely populated regions. This high population density is not concentrated in one centre, but is spread out over a large area. Few places within the urbanized area of the South Wing have a higher density than 120 inhabitants per hectare, but on the other hand, few have a lower density than 30 inhabitants per hectare. Urbanization in the South Wing has been polycentric; there are multiple centres such as The Hague and Rotterdam, and many smaller subsidiary centres. In this respect the region differs from other metropolises such as London or Paris, which have evolved around a dominant centre with a concentration of inhabitants and jobs.
Mobility within polycentric regions depends on well coordinated, fine mesh networks. The existing infrastructural network in the South Wing largely consists of parallel motorways and railway lines. This primary network is used simultaneously by international, national, regional and local transport, and is rapidly becoming clogged. It has been pointed out that within this situation a switchover to a more extensive and integrated network in which links are differentiated according to travelled distance and types of use is needed (Ministeries van VROM, LNV, V en W en EZ 2004, 58).
Research showed that the predominant amount of trips in the South Wing take place within a radius of between ten and forty kilometres. This connotation led to special attention to measures accommodating these kinds of regional trips within an overall transport strategy. The strategy aspires to give regional public and private transport a position of its own right in between local, national and international connections. In 2006 the opening of Randstadrail, a light rail connection between Rotterdam and The Hague, has been an important first step in this direction. Preparations are under way for a next generation of projects that will help create a public transport network at regional level. Stedenbaan is one of them.
stedenbaan
The Stedenbaan (City Line) will not implement new rail connections but will improve service on the already existing historically oldest rail lines within the South Wing. The Stedenbaan uses free capacity on three trajectories between Schiphol-Dordrecht, The Hague-Gouda and Rotterdam-Gouda. The capacity comes free
From Concept to Projects 77
since international trains will from 2008 run on a newly established high speed train corridor, the HSL line, stretching from the Belgian border to Amsterdam and thus connecting the Netherlands to Antwerp, Brussels and Paris. The extra capacity on the old rail lines will be used to improve regional transport in two ways: a more frequent intercity service will serve the large and medium stations and a more frequent ‘Sprinter’ service will increase service from four times to six times per hour and serve, beside the large stations, stations in the smaller cities, the suburban city extensions and the rural villages along the line. Together with the introduction of more modern train equipment, these improvements are supposed to lead to a metro-type service among the 34 existing and 13 potentially new stations along the Stedenbaan lines (see Figure 7.1).
The improved train service is also supposed to provide a strong stimulus for spatial development in the related station areas. The parties who have initiated the Stedenbaan project, regional and provincial governments and the cities of The Hague and Rotterdam, have chosen to include this effect into a development strategy for the project. This strategy of integrated spatial and network development is referred to as the dual purpose strategy. It has two objectives:
figure 7.1 City Line stations
Transit Oriented Development78
The creation of a high frequency public transport system on the existing national rail networkAn intensification of land uses around the stations on the rail network.
The dual purpose strategy rests on the assumption that transportation and spatial development influence each other. To identify the various links between urban development and the development of infrastructure networks and to expose their development potentials, will not only improve overall accessibility in the South Wing, it will also be a crucial element in formulating a growth strategy for the region. In this way the Stedenbaan project is supposed to have an important impact on the economic development and physical appearance of the metropolitan region, as well as its environmental, social and cultural potential (Bestuurlijk Platform Zuidvleugel 2006).
Planning context
The South Wing has a complex administrative structure. Beside state, provincial and local governmental layers, a range of intergovernmental bodies with a wide variety of responsibilities exist. In the Dutch planning culture many planning and development control powers are devolved to regional and particularly local authorities. The only spatial plans that are legally binding on private parties, for example, are local land use plans. Apart from a few major infrastructure and urban projects of national importance, most urban and infrastructure developments that exceed the boundaries of a single local authority have to be initiated, developed, coordinated and managed by provincial authorities or coalitions of local authorities. These constellations of administrative and political bodies are either statutory or informal arrangements and often in partnership with private developers and other stakeholders such as transport companies. Initiatives by these groups often have to be developed through a complex process of agenda-setting and negotiation in order to find consensus among the actors. The South Wing Administrative Platform who has been establishing the Stedenbaan project is an example of such a hybrid coalition. It consists of political representative’s of the five involved city regions, the province of South Holland and of the major cities Rotterdam and The Hague. Other crucial parties in the Stedenbaan project are the national rail company NS, the private development sector and the national government.
In 2005 the Province of South Holland established the Atelier Zuidvleugel (South Wing Studio) to focus on the spatial effects of the increasingly complex and widespread social and economic interactions within the South Wing and to facilitate discussion between the various stakeholders in the area. Apart from the parties involved in the South Wing Administrative Platform the studio is also supported by the Ministry of Housing, Spatial Planning and the Environment (VROM) and a set of research programmes.
•
•
From Concept to Projects 79
The South Wing Studio has been asked to develop the double purpose strategy based on insight into the relations between spatial and infrastructural development into a project involving 20 cities, five city regions, one provincial council, bodies of the national government and private stakeholders.
spatial survey
The mandate of the South Wing Administrative Platform to the Studio South Wing has been formulated in a request for a spatial survey of the station areas that are related to the Stedenbaan. The spatial survey adds to and builds up upon a series of other studies examining several aspects of the Stedenbaan project. The national railway company, who will run the Stedenbaan service, carried out a feasibility study. A study on housing offers and demands researched how the Stedenbaan project can contribute to the transformation of the station areas that are now, compared to Dutch averages, less multifunctional and more strained by social problems (Mattemaker and Brouwer 2005). Another study researched the potential differentiation of station areas based on existing facilities and travel patterns (Boelens 2005).
The spatial survey that has been accomplished by the Studio South Wing between 2005 and 2006 provides an overview of present and future spatial conditions in the station areas along the Stedenbaan line and reveals the opportunities for their development. The study also shows the benefits of coordinating development in the 47 existing and potentially new station areas (Atelier Zuidvleugel 2006).
The survey was carried out in three stages, examining (a) what developments are feasible in terms of quantity, (b) what developments are most promising, and (c) what local developments are desirable in terms of their contribution to the development objectives for the South Wing region as a whole.
feasible developments
As a first step, an inventory was made of the areas within the spheres of influence of the Stedenbaan stations that will undergo change between 2010 and 2020. This inventory was based on plans drawn up by local and regional authorities, and hence provides a widely accepted picture of the future development space around the stations (Figure 7.2a and b).
In order to account for the high amount of cyclists in the Netherlands, the catchment area of Stedenbaan stations has been, fixed to a relative to international standards large radius of 1,200 m. The zones within this radius of the Stedenbaan stations have a combined area of 18,000 hectares, or about a quarter of the urbanized area of the South Wing. About 20 per cent of this area will be subject to development between 2010 and 2020 (Figure 7.3). The local authorities have designated many of the station areas as housing or mixed use zones. Employment
Transit Oriented Development80
zones are also projected, mainly in the form of business sites rather than single use office parks.
The results of this inventory indicated that the initial targets for new uses set by the city regions can be met in station areas. If the land is developed at the average densities already found along the Stedenbaan line, the area around the stations will be able to accommodate more than 40,000 dwellings and 1,000,000 square metres of office space. Besides identifying a feasible development programme, this first step provided an overview of ongoing and projected spatial transformations
figure 7.2a Plans drawn up by local and regional authorities
From Concept to Projects 81
along the line, a crucial basis for the exchange of ideas in a development project consisting of several dispersed but interconnected locations.
Promising developments
The dual purpose strategy is based on developing a traffic and transport concept in combination with spatial development. However, this integrated urban and
figure 7.2b Plans drawn up by local and regional authorities
Transit Oriented Development82
network development is not just a simple equation for delivering a given number of trips and more intensive land use. Mobility networks influence a variety of spatial characteristics, such as the size of cities and towns, the intensity of functions, the degree of mixed use and the decentralization of activities (see Banister 2005, 97–128). In turn, spatial characteristics influence the development and use of networks.
Most of the station areas along Stedenbaan are, although not being intensively used at present, already built up. The main uses consist of housing, employment and mixed use functions. The second step of the survey consisted of an inventory of the existing relations between spatial conditions and networks along the Stedenbaan line. These relations were determined using a set of indicators which describe the positions of the stations within the network and characteristics of the surrounding areas that are potentially influenced by the network: (a) the degree of access by public transport and (b) by car, (c) local densities of inhabitants and jobs, and (d) the degree of mixed use.
Drawing on existing knowledge about how spatial and network development influence each other, nine potential developments were outlined for nine typical situations found along the Stedenbaan (Figure 7.4). These nine potential developments can be seen as ‘Stedenbaan typologies’. They describe development
figure 7.3 spatial transformation areas along City Line
From Concept to Projects 83
opportunities that are promising since they are based on the expected impacts of the transport network on specific areas and vice versa. The nine ‘Stedenbaan typologies’ are described briefly below.
Rural Areas: spaces in the middle of the landscape for housing development in the countryside and recreational use.Small Towns: new housing sites close to small towns that can expand into autonomous, compact, lively, multifaceted communities set in the countryside.Outskirts of Cities: restructuring areas on the quiet, spacious and green edges of the cities; these qualities can be consolidated, enhanced and used.Cities of the Future: easily accessible and dense housing areas; can gradually expand into mixed use developments with their own identity.Business Sites: extensively used areas along the motorway to be turned into intensively used employment zones.Regional Crossroads: areas linked to one of the major motorway intersections in the South Wing; highly suitable for developing services with a supra-regional function.Randstad Hubs: not intensively used areas, but highly accessible by road and local public transport; excellent places for experimental new employment and mixed use areas.
1.
2.
3.
4.
5.
6.
7.
figure 7.4 nine potential developments
Figu
re 7
.5
Ove
rvie
w o
f pot
entia
litie
sSo
urce
: Rep
rodu
ced
with
per
mis
sion
of H
iroki
Mat
suur
a of
Max
wan
Arc
hite
cts a
nd U
rban
ists
and
Ped
ro M
aia.
From Concept to Projects 85
Creative Cities: urban centres accessible by every mode of transport well suited to new urban-type dwellings and creative workplaces.City Centres: key sites, well served by every mode of public transport but less accessible by car; will have to be better designed for users of public transport.
The existing station areas often correspond closely to one particular typology. For example, the area around Rotterdam Central Station closely matches the City Centre typology; while a set of station areas that lie in open land between the large cities are more like the Rural Area typology. However, most station areas have a combination of indicators that corresponds to two or more different typologies (Figure 7.5).
The results of this analysis illustrate the existing potentialities of the stations based on the strength of their position in the network and their spatial characteristics. They also show what characteristics of the network or the station area must be changed in order to encourage a particular development.
Desirable developments
The integrated planning of urban development and network development can make use of the interactions between them not only to ensure better access within the South Wing, but also to make a broad impact on the economic development, the social and cultural potential and the physical appearance of this metropolitan area. For instance, urban sprawl and fragmentation of the landscape are caused partly by the growth of high speed travel. The low density this creates in turn reduces the support base for services and so generates even more travel. Higher densities will make public transport viable and good multimodal access is an important characteristic and prerequisite for attractive and sustainable mixed use areas.
The coalition of public parties involved in Stedenbaan – over 20 local authorities, five city regions, one provincial council and central government – have set a broad range of goals for the future development of the area. Furthermore, commercial and semi public organizations are also interested in a regional coordination of local development owing to ambitions such as the broadening of markets and the therefore required differentiation of housing and working environments within a metropolitan area. Unsurprisingly, there are conflicts between some of the objectives of the various stakeholders in the region and between the different administrative levels (local, regional, provincial and national).
Following the inventory of development sites in the Stedenbaan station areas and the review of the potentialities, the last stage of the spatial survey explored possible aspirations for the Stedenbaan project. Three scenarios were used to assess how these potentialities of the local areas can be exploited to achieve the goals that are set at the level of the South Wing. The Stedenbaan scenarios show how local choices can support objectives at a higher scale, and therefore also show how the ambitions of the Stedenbaan project can steer decision making at the local level.
8.
9.
Transit Oriented Development86
The nine potential developments that were described in stage two of the survey (the typologies) contribute to the higher level goals set out in the scenarios in varying degrees. At the same time the existing station areas often have conditions that correspond to more than one particular typology. In each scenario the typologies are assigned to the station areas based on their best contribution to the goal of the scenario. The scenarios are outlined below.
The Densification scenario
This scenario is in line with the National Spatial Strategy, which states that from a traffic/transport perspective it is important to make maximum use of the potential for densification within the sphere of influence of transport hubs in order to create attractive cities and towns.
The South Wing Network scenario
In this scenario the metropolis is not defined as a single urban planning concept, but as a coherent programmatic whole. The scenario offers maximum diversity of services and locations within given temporal and spatial constraints. The quality of the location is based on accessibility and on the sites designated for housing, recreation and employment. The main goal within this scenario is the formation of networks.
The Sustainability scenario
The aim of this scenario is sustainable development. Great value is placed on the potentialities for densification in existing urban areas, for mixed use, and hence more sustainable, development, and which preserve the characteristic cultural landscape of the South Wing. These potentialities support densification only where it will generate passengers for public transport and not in places where it is also likely to generate a good deal of vehicular traffic.
The modelled scenarios have been explored in a multi criteria analysis. The criteria that were established are the realization of the ambition for new houses set by the city regions, the satisfaction of projected qualitative and quantitative market demands for houses and offices, the increase of diversity of housing and working environments, the increase of public transport trips, an estimated increase of car use based on the supply of regional facilities and the reliance on car accessibility per typology, the use of already built up city area and consequently the preservation of open land.
The analysis shows that in all scenarios the quantitative goals for new housing and employment sites are met. In the Densification scenario the projected amounts for housing are even doubled, however the amounts of new housing in dense urban setting goes far beyond the projected market demand for these types of housing environments. The Densification scenario also demonstrates that, if densification is
From Concept to Projects 87
the leading goal, a one sided supply of working environments develops. The South Wing Network scenario delivers a much lower volume of development in terms of square metres of floor space, but illustrates that a broad variety of both housing and employment environments can be achieved along the Stedenbaan line. It also demonstrates how an emerging regional public transport network can contribute to the diversification of uses. However, the high proportion of development with regional functions will generate additional car traffic. The positive effects of the Sustainability scenario can be seen in the outcomes for the environment and the preservation of open landscape. As expected, this scenario generates the least amount of car traffic.
The results of the last stage of the spatial survey create, besides inspiration for a discussion on ambitions that the project Stedenbaan can aspire to, the understanding of the benefits of a coordinated development of the 47 local station areas along the Stedenbaan. The results also make it possible to pinpoint the strategically crucial station developments. Some of the station areas show, because of their preconditions, an only small variety of potentialities. Other station areas have a broad range of choices among development opportunities and are, since these developments serve different goals, more decisive for the achievement of these goals.
The process
The spatial survey has been published in 2006 and forms since then content of a broad range of processes that make the project Stedenbaan operational. In principle these processes can be distinguished in two consecutive types. In both types the insights into the mutual impact of local and regional developments that the spatial survey provides play a central role.
The first type of processes leads to signed agreements on quantitative and qualitative goals that are aimed at by the Stedenbaan project. The agreements are made between authorities and organizations operating on regional or national scale levels such as the city regions, the national rail company and the national government. The spatial survey inspires these processes by defining and refining the goals that the Stedenbaan project can strive for. The results of the scenarios, compared to predicted market demands, demonstrate that the coordination of local spatial developments is crucial for achieving a coherent regional development. Specifically the conclusion, that the ambition for densification is not sufficient, but that the diversification of living environments is an equally important objective, gains attention in the resulting documents (Bestuurlijk Platform Zuidvleugel 2007). The importance of the survey stems from the fact that its conclusions for the regional level are deducted from thorough research on the local conditions of the existing station areas.
A first declaration of the intention to realize up to 40,000 new dwellings and 1,000,000 square metres of new office space in station areas has been signed in
Transit Oriented Development88
2005 by the members of the Administrative Platform South Wing. This ambition has been confirmed by the results of the spatial survey and has consequently been adopted by the city regions. The commonly shared ambition for increasing the amount of houses and office space is crucial for the infrastructural development of the Stedenbaan. The national rail company NS has, since their feasibility study has indicated the requirement of additional travellers, signed a declaration of intent to increase frequency of service on the Stedenbaan. Other future agreements aim to stir the diversification of living environments along Stedenbaan, the concentration of commercial and leisure facilities around the stations, the establishing of a coherent regional park and ride system and bike storage system, the realization of four new stations and the increase of track capacity specifically on the intensively used line between Rotterdam and The Hague.
The second type of processes concerns the ongoing negotiation between the local municipalities to assign development profiles to the local station areas. In these processes the objectives that are set out for the project Stedenbaan are applied and finally translated into the formal spatial land use plans of the cities. In principle the municipalities tend to take their decisions about land uses according to local market demands. In a metropolitan area as the South Wing, where economical and social parties position themselves in a regional rather than a local context, this practice can become a critical factor. It leads to the repetition of types of developments, consequently a reduced support base for them and little choice amongst them. The negotiation process on quantitative and qualitative development profiles along the Stedenbaan line resolves the problem by steering not only for the densification of uses in the local station areas but also for more diversification of developments within the region. Private stakeholders such as large housing corporations underline the importance of this strategy and assure their support.
The spatial survey was an initial to these processes by establishing a broad understanding of the benefits of regional coordination of local developments. It contributes to the negotiation by creating an overview of potential developments in the station areas. The applied station typologies form a robust framework in this negotiation. Since the typologies are deducted from commonly acknowledged development criteria such as density, diversity and the position that a location has within the overall infrastructural network, an examination of all station areas with regards to these criteria delivers the possibility to compare their potentialities to each other. Another important base for negotiation was established through the inventory of the areas within the spheres of influence of the Stedenbaan stations that will undergo changes between 2010 and 2020. This research allows all municipalities to relate the results of the spatial survey back to the input that they originally gave.
The municipalities agreed in 2007 on the quantitative benchmarks for the increase of dwellings per city region. In a second phase of the discussion, starting in 2008, they will assign qualitative development profiles to the station areas. This phase of the negotiation will include next to the public sector also private stakeholders.
From Concept to Projects 89
The progress of development will be supervised by Stedenbaan coordinators that have been appointed by the city regions in 2007. The development of all station areas will be monitored by the project group Stedenbaan. A constantly updated inventory of spatial and infrastructural development will be made accessible to all involved stakeholders through an internet based interface.
from potentials to concrete ambitions
Western European cities have a tendency to spread and coalesce into low density urban regions. As new centralities emerge within these urban fields, public transport systems are evolving from monocentric hierarchical structures into multi-nodal horizontal networks. The Stedenbaan project in the South Wing of Randstad Holland contributes to the emergence of such a regional public transport network and supports a coordinated spatial development of the region. Because interaction within the region transcends traditional planning boundaries it addresses a number of questions, such as: Which developments should be planned and managed at the regional level? How much coordination among government authorities and between government authorities and market players is necessary? Which quality standards should be set and enforced at higher levels? And how can all this be organized and managed?
The spatial survey by the South Wing Studio contributes to the ongoing development of the Stedenbaan project and the South Wing as a whole. The first and foremost task of the survey was to put the Stedenbaan project onto the regional planning agenda. The survey has been published in 1,200 copies and distributed to all stakeholders. It has been repeatedly presented and discussed in many occasions and in front of a broad variety of audiences, ranging from parliament delegates, local aldermen; scientific staff at conferences to the general public. It has also been published in several national and international magazines, exhibited at the International Architecture Biennale Rotterdam and has been featured in local television broadcasts. Through this publicity campaign, the project received the attention required to perpetuate the political processes that make it happen.
Synergy and commitment can be stimulated by giving all the parties, both public and private, access to the same information and basic understanding. The parties involved do not have to make rash undertakings, but can work in a situation in which plans and development programmes are continually coordinated, refined and readjusted. The stakeholders can work in a network structure whose components are flexible and can respond to new developments. A sound, flexible and transparent process is vital for a project that encompasses the metropolitan area of South Holland, involves a wide variety of actors and will take half a generation to complete.
Last but not least the study assesses the merits of the project not only for the 47 individual station locations but for the entire South Wing. It provides a broad understanding of which qualities can be achieved at the regional level by
Transit Oriented Development90
a large scale project such as Stedenbaan: the satisfaction of property market and transport demands within the region, the creation of a variety of complementary living and working environments that offer a wide choice and flexibility to meet changes in market demands, and development that is environmentally and socially sustainable. These qualities are rooted in and steered by the existing potentialities of both, places and network found along the Stedenbaan line. They are therefore credible and raise comprehension for the needs and benefits of transforming existing urbanized areas instead of accommodating spatial claims on new land.
Emerging metropolitan regions require not only new forms of transport but also new methods of spatial planning. The biggest danger to the evolution of a cohesive metropolitan area is that of fragmented development and consequently missed opportunities. The project Stedenbaan strives to establish a context within which cities are not competitors anymore but partners that work on the basis of diversity and complementarities. It is assumed that with this approach the South Wing can utilize its potentialities better. The Administrative Platform South Wing has made this its core objective. The strategy is thereby not imposed from higher level governmental institutions but instead involves all stakeholders, provides them with information, insights, inspiration and a platform to exchange knowledge. In this sense Stedenbaan is a typical product of the contemporary network society, routed in common ambitions and driven by the will to cooperate.
Chapter 8
An Asian Model of TOD: The Planning Integration in SingaporePerry Pei-Ju Yang and Seng How Lew
Introduction
As an Asian model for modern city development, Singapore is known for its efficient public transportation, effective land use planning and quality housing development. Singapore’s urban growth pattern has been highly influenced by a unique mode of planning and development of new towns, integrating land use with the mass rapid transit system (MRT). The concept of a ring-shaped city and the principle of transit-oriented new town development were initiated in the first city-wide Concept Plan in 1971. It included three transit lines parallel to four development corridors with the concentration of urban cores, regional centres, sub-centres and peripheral new towns. It resulted in the decentralization of an urban development pattern which appears linear and radial in shape today. How did the transit oriented development (TOD) model of planning influence the urban spatial pattern of Singapore? More specifically, how were the compact city form, leap-frog urban density distribution and urban design influenced by the TOD mode of planning from the early planning initiative of the 1970s to the first operation of the MRT system of 1987, and the post-MRT period?
This chapter investigates Singapore’s urban planning policy, spatial consequences of urban density distribution, new town planning and urban design driven by the TOD planning principles. In the case study of Singapore, we have observed a strongly articulated density distribution, pedestrian environment and transit ridership, which had effectively integrated the practice of public transit operation, land use planning and urban design.
Historical process of singapore’s transit typology
The pattern of Singapore’s urban development has been influenced by the changing mode of urban transport and different ways of moving people in the city, from the traditional transit services such as streetcars and trolley buses, to the modern automobile and road system, and to the MRT system. The modes of urban transit of Singapore during the 1880s were marked by gas trams, electric trams, rickshaw, trishaw, bullock cart and trolley buses. Without strong control from the state, the
Transit Oriented Development92
transit services were planned and built by individual companies and many transit lines tended to overlap each other and concentrated around those intense urban zones of the downtown core area of New Bridge Road, South Bridge Road, North Bridge Road and Hill Street. These main catchment areas of the transit services were confined within a very limited area from 1880s to 1960s. There were many small companies running an insignificant number of services that tried to get a share off the most profitable congested service area. The congregation of transit service and the problem of congestion weakened the service efficiency. The fare collection and level were left to the freedom of the individual service provider, and many small companies opened and closed down shortly due to the fierce competition of transit service. There was no obvious extension of urban development that could provide more opportunities. To survive better, some companies like the Chinese Bus Companies amalgamated from 1950s to 1960s to form a stronger group that could better manage the service lines.
From the 1960s to 1970s, automobiles offered attractive alternatives to the poor public transport service. Automobiles thrived because the government was more concerned with housing and employment creation and the issue of public transport took a “back seat”. The rapidly rising income during the economic boom of the 1970s increased the affordability of car ownership. The GNP increased from $2862, $5092 to $9895 in 1966, 1975 and 1985 respectively, and the number of private cars more than doubled from 70108 in 1961 to 187972 in 1973 (Phang 1992, pp207). In the early 1970s, half of the population travelled by cars, posing a congestion problem. The early generation of public housing during the 1970s was planned to sit at the fringe of the existing city area and appeared to be auto-oriented. Its design and planning parameters favoured the use of cars. Approximately one third of the housing development site would be designated to surface car park. For example, a standard 10 hectare land parcel may contain a 3.3 hectare surface car park, which dominated the new town landscape. According to the planning parameters, an extensive surface car park was not considered undesirable as it was counted as open space in the definition of the development density or plot ratio.
The planning of public transit system was conducted by the government in the 1970s. However, the principles of transit oriented development were not included in the planning of public housing during the same period. As the former chief executive officer of the Housing Development Board Liu Thai Ker commented in 1973, “The need for shelter could not wait” and “Action, rather than the right answers to all the problems, was urgently required.” (Yeh 1973, pp117). Wang also commented in 1987 that the early South East Asia new towns were based on the “build-now-and-plan-later” philosophy (Phillips et al. 1987, pp38). There were no comprehensive planning or urban design guidelines adopted. Before the first operation of the MRT system in 1987, Singapore’s mode of transport relied heavily on auto-oriented development. The increasing use of cars and motorcycles was taken as a “self-help” transportation solution and public transport was not regarded as an urgent matter. The problem of traffic congestion was increasingly serious as the number of cars doubled from 1961 to 1970, and approximately one
An Asian Model of TOD 93
third of the population travelled by motorcycle and scooters from 1965 to 1973. During the same period of time, the construction of main roads increased by only 26 km from 214 km in 1961 to 240 km in 1970, and the number of private vehicle per kilometre of road increased from 328 to 594 (Phang 1992, pp207; Singapore Department of Statistics, Yearbook of Statistics, various years).
The private use of car and motorcycle rose during 1970s due to decentralization, and temporarily relieved the urgent need of providing public transport through the government. Besides, the geographic locations of new towns built in the 1970s were adjacent to the city centre. The first generation of new towns such as Queenstown and Toa Payoh were located within six kilometres of the river mouth of Singapore River. The proximity of the new towns to the city centre did not generate an immediate need to develop an extensive public transit network. The MRT system was not implemented and did not begin until the late 1980s when the catchment area was dense enough to support the ridership of the system.
The current urban pattern of Singapore is effectively influenced by the 1970 Concept Plan, which was driven by a decentralization strategy of urban growth along the transit corridor for relieving the congestion in the city centre. New residential and industrial development grew in parallel with the expressway and mass rapid transit corridor toward the east, west and north from the 1970s to the 1990s. In 1969, the Singapore Planning Department suggested two alternative public transit planning proposals that led to commissions of the MRT review team in the 1970s to recommend the future transportation plan in 1982–1992. The two proposals of public transit planning projected the island wide land use distribution with and without the MRT system. The first proposal is an “all-bus” system that emphasizes the express bus system. The proposal was dropped because it was forecasted that the congestion situation could not be possibly handled according to the post 1992’s demand. The second proposal that suggested the bus supplemented 3-line MRT system was selected. The new town developments as well as the urban density were distributed along the transit lines. The bus supplemented 3-line rail system connects to those transit centres along the urban congestion corridors in East-West direction and North-South direction.
The 1991 Concept Plan, also known as the Constellation Plan, was the follow-up governmental action from the 1970 Concept Plan for the realization of the ring pattern and radial urban corridors that connect hierarchical urban development nodes of the central business district (CBD), regional centres and sub regional centres (Figure 8.1). The concentration of development areas and satellite new towns in strategic locations along the transit corridors is a mode of transit oriented development with strong enforcement from governmental planning and control. The distribution of density is a leap-frog pattern similar to the theoretical model proposed by Cervero (1998, pp7). The constellation planning model in 1991 provided guidance for organizing a pattern of decentralized centralization of urban population through new town developments that are separated by green belts and open space. The planning of MRT system is a tool for achieving the urban growth
Transit Oriented Development94
pattern of decentralized centralization, whereby the MRT line is superimposed onto the proposed urban development centres.
The changing mode of urban public transit and its effect on urban development in Singapore is comparable to the three modes of development DOT (development oriented transit), AOT (auto-oriented transit) and TOD proposed by Dittmar and Ohland (2004), however, in a different urban context. In Singapore, the government’s initiative had significant influence on the TOD mode of planning as seen in the Concept Plan in 1970 and 1991 as well as a series of other policy and planning actions. These actions involved the intended decentralization of a series of compact residential new towns by Singapore Housing and Development Board (HDB) since the 1960s, and then followed by the layering superimposition of transit lines from 1988. It resulted in the superimposition of transit infrastructure and urban development corridors.
Impact of the TOD mode of planning on the density structure of singapore
What is the relationship between public transit and the urban development pattern? To what extent did the TOD mode of planning influence the urban spatial pattern and the urban density distribution of Singapore from the 1970s, and how do we measure it? We measured the degree of decentralization of Singapore’s urban growth pattern from 1921 to 2000 by revising the diagram of the population density to the rate of decentralization proposed by Phang in 1992. This was
Figure 8.1 Concept Plan, 1991Source: Singapore Urban Redevelopment Authority, Living the Next Lap 1991
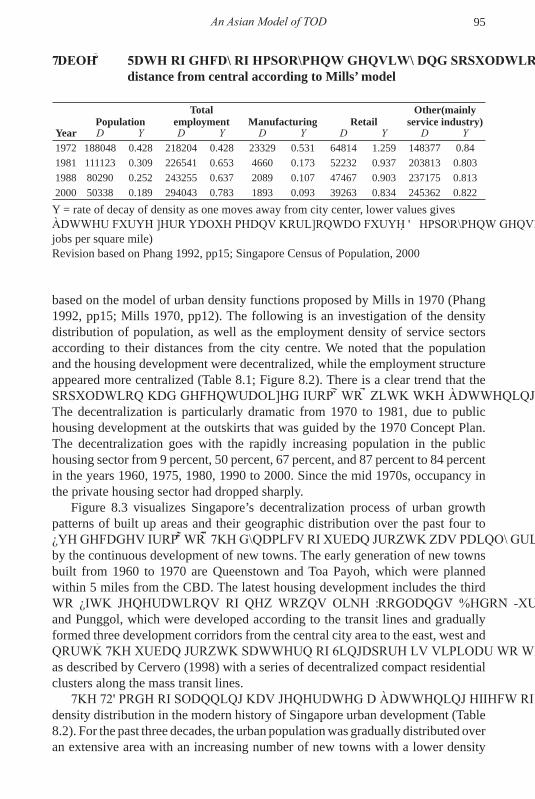
An Asian Model of TOD 95
based on the model of urban density functions proposed by Mills in 1970 (Phang 1992, pp15; Mills 1970, pp12). The following is an investigation of the density distribution of population, as well as the employment density of service sectors according to their distances from the city centre. We noted that the population and the housing development were decentralized, while the employment structure appeared more centralized (Table 8.1; Figure 8.2). There is a clear trend that the population had decentralized from 1921 to 2000 with the flattening of the curve. The decentralization is particularly dramatic from 1970 to 1981, due to public housing development at the outskirts that was guided by the 1970 Concept Plan. The decentralization goes with the rapidly increasing population in the public housing sector from 9 percent, 50 percent, 67 percent, and 87 percent to 84 percent in the years 1960, 1975, 1980, 1990 to 2000. Since the mid 1970s, occupancy in the private housing sector had dropped sharply.
Figure 8.3 visualizes Singapore’s decentralization process of urban growth patterns of built up areas and their geographic distribution over the past four to five decades from 1960 to 2005. The dynamics of urban growth was mainly driven by the continuous development of new towns. The early generation of new towns built from 1960 to 1970 are Queenstown and Toa Payoh, which were planned within 5 miles from the CBD. The latest housing development includes the third to fifth generations of new towns like Woodlands, Bedok, Jurong, Sengkang, and Punggol, which were developed according to the transit lines and gradually formed three development corridors from the central city area to the east, west and north. The urban growth pattern of Singapore is similar to the “pearls on a string” as described by Cervero (1998) with a series of decentralized compact residential clusters along the mass transit lines.
The TOD mode of planning has generated a flattening effect of the population density distribution in the modern history of Singapore urban development (Table 8.2). For the past three decades, the urban population was gradually distributed over an extensive area with an increasing number of new towns with a lower density
Table 8.1 Rate of decay of employment density and population density to distance from central according to Mills’ model
yearPopulation
Total employment Manufacturing Retail
Other(mainly service industry)
D Y D Y D Y D Y D Y1972 188048 0.428 218204 0.428 23329 0.531 64814 1.259 148377 0.841981 111123 0.309 226541 0.653 4660 0.173 52232 0.937 203813 0.8031988 80290 0.252 243255 0.637 2089 0.107 47467 0.903 237175 0.8132000 50338 0.189 294043 0.783 1893 0.093 39263 0.834 245362 0.822
Y = rate of decay of density as one moves away from city center, lower values gives flatter curve, zero value means horizontal curve; D = employment density (Thousands jobs per square mile)Revision based on Phang 1992, pp15; Singapore Census of Population, 2000
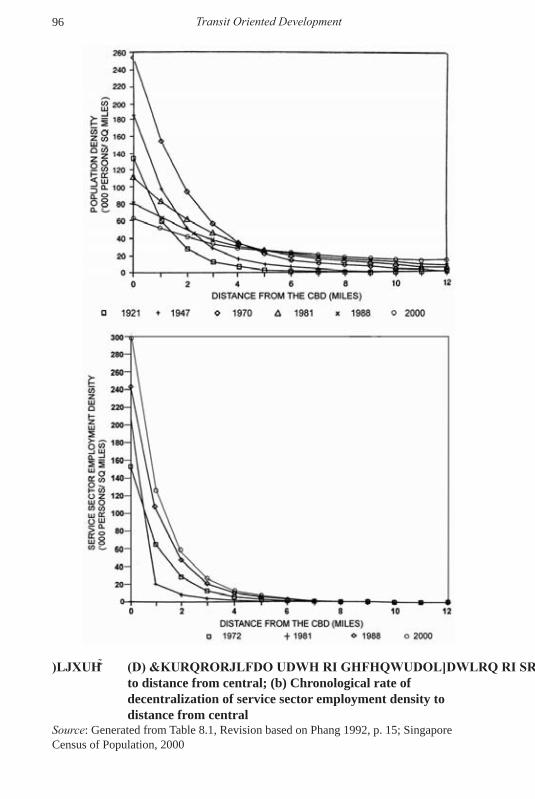
Transit Oriented Development96
Figure 8.2 (a) Chronological rate of decentralization of population to distance from central; (b) Chronological rate of decentralization of service sector employment density to distance from central
Source: Generated from Table 8.1, Revision based on Phang 1992, p. 15; Singapore Census of Population, 2000
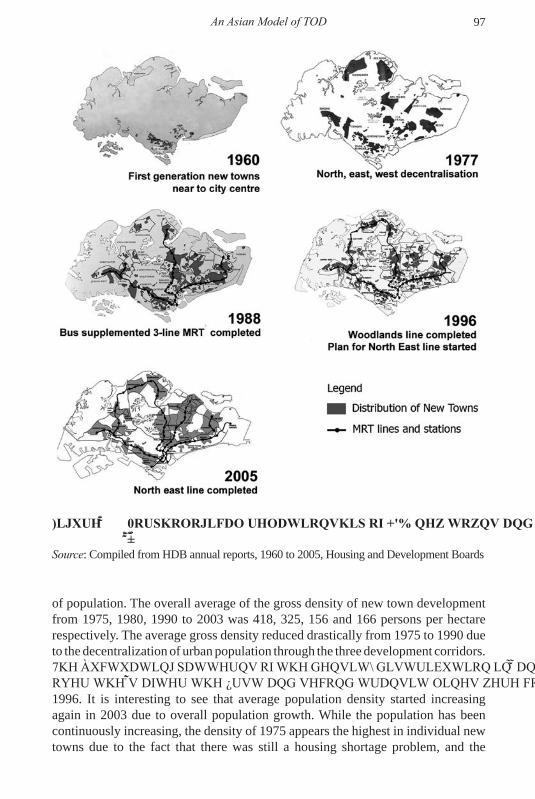
An Asian Model of TOD 97
of population. The overall average of the gross density of new town development from 1975, 1980, 1990 to 2003 was 418, 325, 156 and 166 persons per hectare respectively. The average gross density reduced drastically from 1975 to 1990 due to the decentralization of urban population through the three development corridors. The fluctuating patterns of the density distribution in 1975 and 1980 were flattened over the 1990s after the first and second transit lines were completed in 1987 and 1996. It is interesting to see that average population density started increasing again in 2003 due to overall population growth. While the population has been continuously increasing, the density of 1975 appears the highest in individual new towns due to the fact that there was still a housing shortage problem, and the
Figure 8.3 Morphological relationship of HDB new towns and MRT, 1960–2005
Source: Compiled from HDB annual reports, 1960 to 2005, Housing and Development Boards
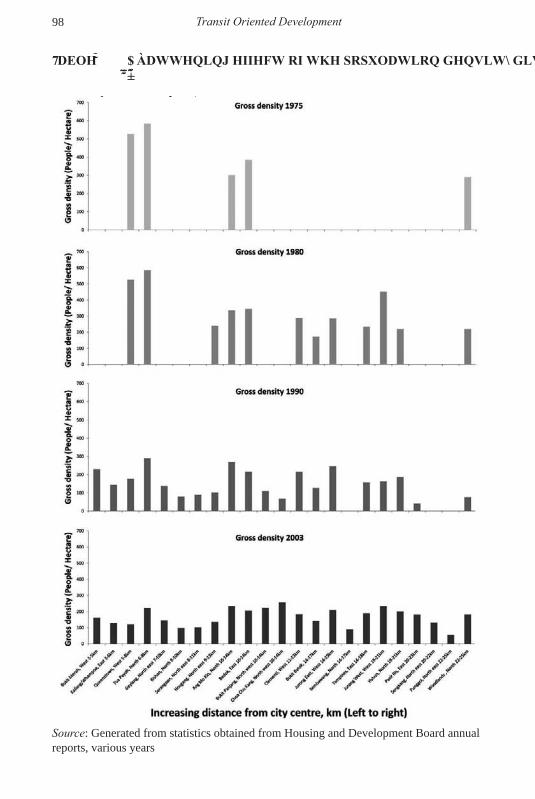
Transit Oriented Development98
Table 8.2 A flattening effect of the population density distribution, 1975–2003
Source: Generated from statistics obtained from Housing and Development Board annual reports, various years
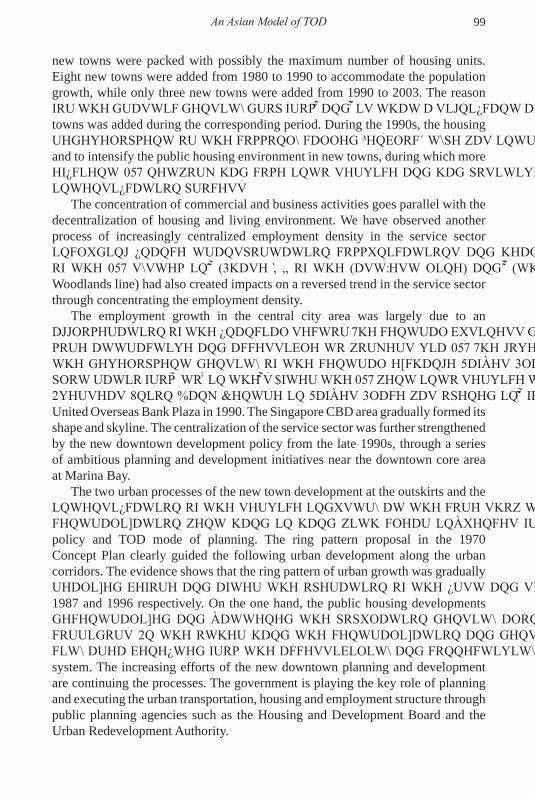
An Asian Model of TOD 99
new towns were packed with possibly the maximum number of housing units. Eight new towns were added from 1980 to 1990 to accommodate the population growth, while only three new towns were added from 1990 to 2003. The reason for the drastic density drop from 1980 and 1990 is that a significant amount of new towns was added during the corresponding period. During the 1990s, the housing redevelopment or the commonly called “en-bloc” type was introduced to rebuild and to intensify the public housing environment in new towns, during which more efficient MRT network had come into service and had positively stimulated the intensification process.
The concentration of commercial and business activities goes parallel with the decentralization of housing and living environment. We have observed another process of increasingly centralized employment density in the service sector including finance, transportation, communications and health. The completion of the MRT system in 1987 (Phase I, II of the East-West line) and 1996 (the Woodlands line) had also created impacts on a reversed trend in the service sector through concentrating the employment density.
The employment growth in the central city area was largely due to an agglomeration of the financial sector. The central business district (CBD) area was more attractive and accessible to workers via MRT. The government intensified the development density of the central exchange Raffles Place by adjusting the plot ratio from 5 to 10 in the 1980s. After the MRT went into service, the 60-storey Overseas Union Bank Centre in Raffles Place was opened in 1988, followed by United Overseas Bank Plaza in 1990. The Singapore CBD area gradually formed its shape and skyline. The centralization of the service sector was further strengthened by the new downtown development policy from the late 1990s, through a series of ambitious planning and development initiatives near the downtown core area at Marina Bay.
The two urban processes of the new town development at the outskirts and the intensification of the service industry at the core, show that decentralization and centralization went hand in hand, with clear influences from the governmental policy and TOD mode of planning. The ring pattern proposal in the 1970 Concept Plan clearly guided the following urban development along the urban corridors. The evidence shows that the ring pattern of urban growth was gradually realized before and after the operation of the first and second lines of MRT in 1987 and 1996 respectively. On the one hand, the public housing developments decentralized and flattened the population density along designated nodes and corridors. On the other hand, the centralization and densification in the central city area benefited from the accessibility and connectivity provided by the MRT system. The increasing efforts of the new downtown planning and development are continuing the processes. The government is playing the key role of planning and executing the urban transportation, housing and employment structure through public planning agencies such as the Housing and Development Board and the Urban Redevelopment Authority.
Transit Oriented Development100
Transit oriented urban design of new towns
The transit oriented urban design also played a significant role in the shaping of urban physical environment of Singapore. Some TOD scholars and professionals took the TOD model as a tool of urban design for condensing urban development within the walkable area from a transit station by providing a mixed-use urban environment (Calthorpe 1993; Bernick and Cervero, 1997). Transit oriented urban design emphasizes the shaping of a pedestrian friendly mixed-use environment to create the convenience of using public transit. The following case studies compare three new town design prototypes of Singapore that had been transformed to become more transit supportive from the 1950s to the 1990s. Based on the design and spatial characteristics of the three new towns, we investigated how the TOD mode of planning influenced the making of urban physical form and the quality of township.
The early forms of Singapore public housing in the new towns during the 1950s to 1960s period were similar to the archetype of Le Corbusier’s Unité d’habitation. The spatial flexibility appears in the building layout rather than in the dimension of land use. The prototype prioritized cars over pedestrians. Trees at the sidewalk were minimal and the outdoor environment was not as pedestrian friendly as the later generation new towns. The new town Queenstown of the 1960s was typical of this planning prototype. The mid-rise slab block typology is surrounded by a substantial proportion of open space, mainly utilized as the surface car park. The neighbourhood retail and town centres were not clearly concentrated in one location and there was no close link between them and the future transit station. However, the start of operation of the East-West line in 1987 stimulated the land use change of the Queenstown station area. The retail node was moved from the fringe to the centre of the walkable transit station area from 1958, 1980 to 2003 (Figure 8.4). The redevelopment of Queenstown’s retail node is also an intensification project of urban infill. The original floor area ratio (FAR) was 1.2 prior to 1990s, and was increased to the FAR of 3.5 to 4.0 during the 1990s to 2000s period.
The planning principle of new towns in the 1970s appears similar to Clarence Perry’s neighbourhood unit, which is organized by a clear hierarchy of neighbourhood centres, and designed based on the natural catchment area of community facilities (Hall 2002). The neighbourhood facilities were provided in the mixed-use neighbourhood centre that is proximate to the surrounding residential blocks (Yeh 1973, pp153–155). We can see the application of those principles to the new town planning of Clementi in 1973, in which there are five smaller neighbourhoods located within 1.5 kilometre radius from the town centre, and are linked by an intra-town shuttle bus to the town centre. The connection of the bus in between new towns prevailed from 1970s to late 1980s until the town centre was finally equipped with a bus-MRT interchange by 1988.
The new generation of new town planning in the 1990s applied the checkerboard prototype 9B (Singapore Housing and Development Board, unpublished). Major arterial roads are arranged along the edges of the new town for releasing the traffic
An Asian Model of TOD 101
pressure from the interior of the town development area. A pedestrian friendly network of roads and parks provides a spatial framework that incorporates a system of multi-level mixed-use centres, in which the MRT station is located at the largest town centre. The new generation of new towns like Sengkang was designed accordingly. The six smaller neighbourhood centres are connected by a light rail transit system (LRT) that provides an internal loop for the entire town (Figure 8.5).
The urban design principles appear differently in the three new town typologies of different historical stages. We observed that the urban design approach of Singapore’s new towns has been moving towards a more transit supportive pattern. The issues of walkability in pedestrian environment and the mixed-use component are becoming clearer design principles. The early generation new town such as Queenstown of the 1950s and 1960s contained very limited urban design consideration, based on the “build now, plan later” philosophy. The slab block typology prioritized the surface car park, with very limited landscape features. The Clementi new town built in the 1970s and 1980s has more porous open space because some flat blocks were raised on pilotis. The location of car park avoids possible conflicts with pedestrian with reduced ingress. The principle of the neighbourhood unit and its natural catchment area of community facilities provide a spatial framework that could easily adapt to the development of the MRT transit station at the town centre from 1987.
The latest new town planning at Sengkang is the post-1990s point block typology, which provides high openness of landscape features to allow pedestrians
Figure 8.4 The relocation of Queenstown’s retail node from the fringe to around the station area after the operation of MRT system
The highlighted Residential zone, Subjected To Detailed Planning in Master Plan 2003 could become a retail node near to the MRT station. The location of the retail node and buffer analysis is hypothetical according to the authors’ interpretation and site observation.Source: Maps for 1958 and 1980 compiled from Singapore Urban Redevelopment Authority [website] <http://www.ura.gov.sg/student/>, accessed on August 2007; Map for 2003 compiled from Singapore Urban Redevelopment Authority [website] http://spring.ura.gov.sg/dcd/eservices/sop/main.cfm?view=mpview, accessed on August 2007
Transit Oriented Development102
to walk under shelter. The typology of point towers lowers the building coverage that allows the ground level to be occupied by soft landscape. Sengkang marks a shift of new town planning that was guided by transit oriented urban design principles. The circulation structure of the entire township was structured by the MRT and LRT systems. The planning of the road structure, road hierarchy, land parcels, land availability, parking design, building layout and typology was driven by their relationship to the transit station and sought to enhance walkability with better integration of the mixed-use development. The redevelopment of Queenstown and Clementi had adjusted their planning according to the latest principles of Sengkang under HDB’s en-bloc upgrading scheme. The recent redevelopment projects intensified the station area with the introduction of the point block typology with better ground level porosity and more pedestrian friendly landscape quality.
The relationship of proximity, density and ridership
The geographic distribution of population density and its impact on the ridership have been significant issues of the TOD mode of planning. What is the relationship between the proximity and density factors to the ridership? To what extent can the transit line be extended, and how big is the urban transit catchment area or the urban transit boundary that can sustain the operation of transit system with substantial ridership? Pushkarev and Zupan (1977) argued that the ridership should drop with increasing geographic distance from the city centre, and the ridership will increase following the growing density. In the case of Singapore, however, we have experienced a different situation that is affected by dual urban processes, the decentralization of urban population through new town development from the 1960s and the centralization of urban services through the downtown planning
Figure 8.5 Checkerboard prototype 9B, with MRT (left); Pedestrian network (middle); sengkang new town planning (right)
Source: Unpublished internal documents of Singapore Housing and Development Board; Sengkang Planning Area Report 1997, Singapore Urban Redevelopment Authority
An Asian Model of TOD 103
and development from the 1970s. We conducted the survey based on ridership and density distribution data of the new towns, obtained from the census data based on Singapore government statistics (Singapore Department of Statistics 1990, 2000; Singapore HDB Annual Reports 1990, 2003). The geographic distance to the city centre is approximated from the Singapore River Mouth to the new towns. A linear regression is used for testing the relationships of density, proximity and ridership. The demographic group that is covered by the statistics occupies 50 percent of the total population in 1990 and 47 percent in 2000 respectively.
For the measure of proximity to ridership (by percentage), both the 1990 and the 2000 statistics show that with increasing distance from the city centre, the ridership of bus reduces and the usage of cars slightly increases. The trend of bus ridership is as expected. With increased distance from the city centre, the uncertainty of traffic jams and the reduced comfort of long rides could lower the bus ridership. For MRT ridership however, the proximity factor seems insignificant in 1990, the early stage of MRT operation. In 2000, MRT ridership appears steadily increasing as the distance of the new towns from the centre increases (Figure 8.6). Compared with the bus, the MRT offers a better comfort for long rides, which could be one of the reasons. The result supported the argument of the bus supplemented 3-line MRT proposal against the all-bus proposal during the MRT debate in 1980 (Source: Singapore Broadcasting Corporation 1980).
For the measure of density to ridership (by percentage), car ridership was declining while MRT ridership was gently increasing on both the 1990 and 2000 curve, following the density increase. However, the relationship between bus ridership and density distribution changed from 1990 to 2000. There were more bus rides when density was higher in 1990, but the trend reversed in 2000. The increasing ridership of MRT at the high-density transit stations couples with decreasing bus ridership (Figure 8.7). The changing ridership pattern implies how the operation of the MRT system after 1987 effectively affected the travel behaviour between bus and MRT. More riders tended to take the MRT in the densely populated new towns after the operation of MRT matured.
Singapore’s urban spatial structure has been transformed from a centralized compact city in the 1960s to a pattern of decentralized centralization of new towns and downtown development today, supported by a well connected island-wide public transit system. The evidence shows that a correlation between proximity, density and ridership exists. The decentralization of housing development together with the centralization of development increases the needs to travel, and there are more MRT riders for new towns at 23 kilometres away from city centre compared to new towns that are just 10 kilometres away. The ridership of MRT increases as the distance of new towns from city centre increases. It shows that Singapore’s MRT system is an effective tool for supporting the decentralization of urban population and housing developments in the spatial range of 22–25 kilometres extending from the city centre to the urban fringe. As expected, the use of cars is increasing following the increasing distance of new towns from the city centre. Nonetheless, the total car use increases for only about 5 percent from 1990 to
Transit Oriented Development104
2000, which is very mild as compared to that of 1960–1970, when the number of private automobiles doubled.
Conclusion
This case study of Singapore TOD is an attempt to investigate the urban and historical process of Singapore’s public transit development, and its impact on the decentralized centralization of urban patterns and population. It also outlines how the TOD mode of planning and urban design has influenced the development and redevelopment pattern of new towns. The Singapore TOD experience shows that an integrated planning approach plays key roles in transit system planning and the urban development process. At the macro-scale, the decentralization of
Figure 8.6 Ridership and distance from city centre, 1990 (above); 2000 (below)
Source: Singapore Census of Population 1990, 2000
An Asian Model of TOD 105
urban population and high density housing development and new towns goes hand in hand with the concentration of service sectors in the downtown central city area. At the micro-scale level, urban design tools and appropriate urban typologies were applied to enhance a more transit supportive environment with improving walkability and providing a mixed-use centre, a neighbourhood catchment area and a hierarchical new town spatial structure. We also observed that a greener and improved pedestrian friendly environment was achieved in the latest generation of
Figure 8.7 Ridership and density, 1990 (above); 2000 (below)Source: Singapore Census of Population 1990, 2000; Annual Reports, Singapore Housing and Development Board 1990, 2003
Transit Oriented Development106
new towns in the 1990s with similar or higher density urban population, compared to the old models in the 1960s and 1970s.
The chapter finally measured the MRT ridership in relation to the factors of proximity and density. This evidence supports our argument that the transit ridership continues to be high in new town developments in the urban fringe area as far as 22 to 25 km away from the city centre. At the same time, MRT ridership increases in relation to the density gradient. Density and proximity matter in the formulation of Singapore’s TOD strategies, making the Asian mode of TOD planning distinctively different from the challenges of many cities and regions in the North American or other regions that are dealing with low density suburban sprawl in an extensive geographical area. In the context of Singapore, the TOD mode of planning and urban design was an effective tool for achieving high density and pedestrian friendly environment based on the ring pattern decentralization strategy.

PART III Implementation: Processes

This page has been left blank intentionally
Chapter 9
Portland’s TOD Evolution: From Planning to Lifestyle
G.B. Arrington
This chapter takes a peak behind the curtain to examine the forces helping to propel Portland in a different direction than other communities with modern urban transit systems. The Portland region arguably has the most aggressive TOD program in the United States. In Portland, TOD is linked to many goals, supported by an array of implementation tools and has been broadly implemented. Nearly every one of the region’s light-rail stops and the corridor along the streetcar has witnessed TOD activity to some degree. Portland’s policy and implementation glove is only one part of the story; increasingly Portland’s residents are voting with their feet and making the lifestyle choice to live in TODs.
The policy framework for TOD
Portland’s experiences with TOD have evolved over 25+ years, from being largely an afterthought to becoming one of the primary considerations in rail facility planning. The next section describes how TOD planning has evolved over time and describes the “toolbox” used by various jurisdictions to facilitate TOD. This is followed by looking at TOD implementation at three Portland agencies and some of the opportunities and constraints of pursuing TOD. The concluding sections speculate on the future of TOD in Portland (e.g., whether it is trying to do too much and whether it can succeed on all fronts) and summarize lessons learned.
After two decades tilling the fields, TOD has become part of the underlying policy framework of Portland’s comprehensive growth management strategy at a community and regional scale. TOD is one of the primary policy and implementation tools that the state, the region, and local governments regularly call on to help maintain a compact urban form, reduce dependence on the automobile, and support reinvestment in centres and corridors. Over time, sophisticated developers have learned that sites adjacent to transit are more likely to come with incentives for development than sites that are not near transit. The result is a pattern of development linked to transportation investments which make Portland look different than other American cities.
The greatest attention to TOD is focused on the stations of the Portland Streetcar and the region’s four light-rail lines. For example, legally binding station-area
Transit Oriented Development110
plans were funded by TriMet, the regional transit agency, and adopted by local governments before the Eastside and Westside light-rail lines opened for service. Minimum densities, parking maximums, design requirements and prohibition of automobile-oriented uses (through interim zoning overlays) are features of the plans for areas within walking distance of the stations. Local governments along the corridors participated in these coordinated multi-jurisdictional planning programs because they saw light rail as a means to implement their comprehensive plans.
The core objectives of station-area planning in Portland have remained fairly constant over the decades. They include the following:
Reinforcing the public’s investment in light rail by ensuring (via re-zoning) that only transit-friendly development occurs near stations;Recognizing that station areas are special places and the rest of the region is available for traditional development;Seizing the opportunity afforded by rail transit to promote TOD as part of a broader growth management strategy;Re-zoning the influence area around stations to allow only transit supportive uses;Focusing public agency investment and planning efforts at stations with the greatest development opportunity;Building a broad-based core of support for TOD with elected officials, local government staff, land owners, and neighbourhoods; andSetting up a self-sustaining framework to promote TOD once the planning is complete (Arrington, 2000).
Making TOD an allowable land use and adopting station-area plans are just one slice of a much larger pie. The Portland region arguably has the nation’s most aggressive growth management program, but it has also placed the highest stakes on what it expects from TOD. The region’s vaunted growth management strategy is built around transit. The 2040 Growth Management Strategy (Metro, 2008) (“build up, not out”) features a tight Urban Growth Boundary (UGB), focusing growth in existing built-up areas and requiring local governments to limit parking and adopt zoning and comprehensive plan changes that are consistent with the growth management strategy. By 2040, two-thirds of jobs and 40 percent of households are to be located in and around centres and corridors served by buses and light-rail transit (Arrington, 1998).
The Portland region has raised the bar of what it expects from TOD and along with this it has continued to add new regulatory and financial tools to its TOD implementation toolbox – tools that are not generally available in other communities (Table 9.1). The breadth of regulations and incentives directed at TOD naturally raises the question of what the region is getting in exchange. Is TOD overly subsidized and loaded with incentives, as some critics argue? Is TOD something the market would not produce on its own? Portland’s TOD planners answer these questions by noting the financial incentives, such as tax abatements,
•
•
•
•
•
•
•
Portland’s TOD Evolution 111
are provided to push the private market further than it would otherwise go. The incentives are used to secure features and amenities desired by public policy: achieving higher densities, better urban design, reduced parking, cleaner air, and greater housing affordability.
Table 9.1 Portland TOD toolbox snapshot
statewide ToolsUrban Growth Boundary (UGB), 1979
A central tenet of Oregon’s Land-Use Planning Program. Ensures a 20- year land supply inside and preserves rural areas outside the UGB. Portland’s UGB includes 254,000 acres.
TransportationPlanning Rule, 1991
Requires metro areas to set targets and adopt actions to reduce reliance on the auto. Directs them to implement land-use changes to promote pedestrian-friendly, compact, mixed-use development.
Transportation &Growth ManagementProgram, 1993
Promotes high-quality community planning by providing localgovernment grants, Quick Response Teams, and Smart Development Code Assistance. Over US$6.7 million in grants from federal transportation funds were provided between 1993 and 2002.
TOD Tax Exemption,1995
Allows eligible projects to be exempt from residential property taxation for up to 10 years. The cities of Portland and Gresham have utilized this program.
Vertical Housing Program, 2001
Encourages mixed-use commercial / residential developments in areas designated by communities through a partial property tax exemption. Allows a maximum property tax exemption of 80 percent over 10 years.
Regional ToolsRegional GrowthManagement, 1994
2040 Growth Concept focuses growth on transit centers and corridors inside a tight UGB. Local governments must comply with the regional plan requirements by adopting growth targets, parking maximums, minimum densities, and street connectivity standards.
TOD ImplementationProgram, 1998
Uses a combination of local and federal transportation funds to spur the construction of TOD. The level of involvement in 12 TODs has ranged from US$50,000 to US$2 million. The primary use of funds has been for site acquisition and TOD easements.
Local Tools Joint Development,1997
TriMet has written down the value of project land reflecting “highest and best transit use” to leverage three innovative infill projects along the Westside and Interstate LRT
TOD Tax Exemption, 1996
The city of Gresham and Portland have of option of providing 10-year TOD tax exemptions for residential TODs
Tax Increment Financing (TIF)
The city of Portland has used TIF for TODs in Urban Renewal districts to make public investments, increase density and secure affordable housing
Westside Station-AreaPlanning, 1993–1997
TriMet, Metro and ODOT funded preparation and adoption of plans by local governments for the area within 1⁄2 mile of LRT stations. Plans included minimum densities, parking maximums, a design overlay for building orientation to transit, and prohibition of automobile-oriented uses.
Transit Oriented Development112
encouraging TOD through evolution
The Portland region’s approach to transit development has evolved continuously to reflect the region’s growing interest, needs and experience in using transit as a community building tool. The result is that today transit and TOD planning are linked inextricably.
The roots of the region’s progressive approach to land use and transportation integration can be found in Portland’s celebrated 1972 Downtown Plan. The Plan envisioned a transit mall as the centerpiece of the downtown revitalization strategy. When the Transit Mall opened in 1978, it was the region’s first major improvement in transit and the first installment in a signature strategy that would repeat itself over and over across the region – using transit infrastructure investments to help achieve broader community building objectives. The evolution of the region’s strategy has changed from TOD being largely an afterthought (with Portland’s first rail line) to proactively expanding transit to build new communities (a primary rationale for building the Portland Streetcar). As local decision-makers gained experience using rail investments to achieve broader community objectives, the design, financing, and rationale behind Portland’s growing rail network changed. Some milestones include the following:
The acronym TOD was not yet in use when Portland’s Eastside light-rail line was designed in the mid-1970s. Consideration of TOD did not occur until after the alignment and station locations were fixed. Station area plans to encourage TOD were adopted for the corridor before the line opened for service in 1986. Informed by the Eastside experience, the approach for the Westside light rail was markedly different. In the late 1980s, the Westside alignment and station locations were designed specifically with future development in mind (Figure 9.1). As Newsweek put it in 1995, Portland is “building transit first, literally in fields, in the hope development will follow” (Kandall, 1995). The gamble paid-off; before the line opened for service in 1998 over 7,000 transit-supportive residential units were underway in the station areas (Arrington, 2000).Planning for the Portland Streetcar in the early 1990s focused on spurring housing construction in the Central City, particularly in undeveloped areas like the Pearl District. Since the Streetcar opened for service in 2001 over US$3.4 billion in new development and 10,212 residential units has occurred along the route (Gustafson, 2008). The streetcar has been described as a housing and redevelopment tool as much as a transportation project (Figure 9.2).TOD was a central feature in the financing of the airport light-rail extension when planning for the line commenced in 1996. Bechtel Enterprises contributed US$28.2 million toward the US$125-million light-rail project. In return, Bechtel, in partnership with Trammell Crow, was to develop a 120-acre TOD at the entrance of the airport. To date, the development
1.
2.
3.
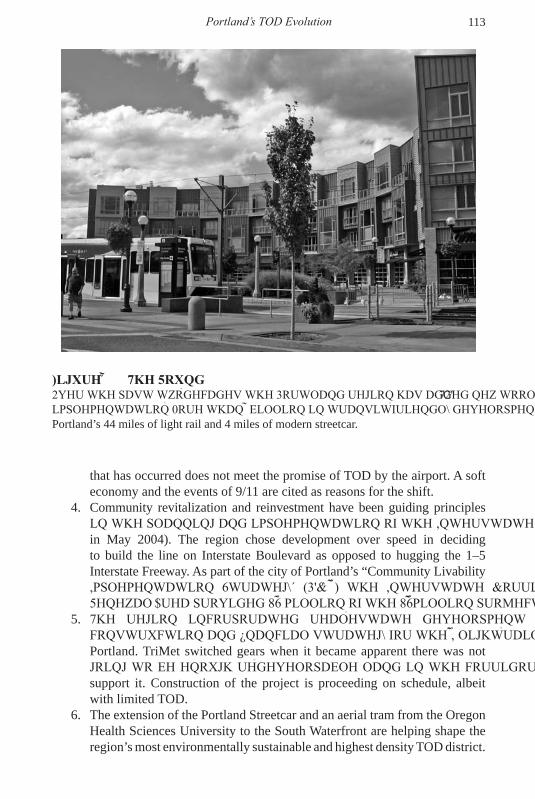
Portland’s TOD Evolution 113
that has occurred does not meet the promise of TOD by the airport. A soft economy and the events of 9/11 are cited as reasons for the shift.Community revitalization and reinvestment have been guiding principles in the planning and implementation of the Interstate light-rail line (opened in May 2004). The region chose development over speed in deciding to build the line on Interstate Boulevard as opposed to hugging the 1–5 Interstate Freeway. As part of the city of Portland’s “Community Livability Implementation Strategy” (PDC, 2003) the Interstate Corridor Urban Renewal Area provided US$30 million of the US$350-million project cost.The region incorporated real-estate development into the design, construction, and financial strategy for the I-205 light-rail segment in east Portland. TriMet switched gears when it became apparent there was not going to be enough re-developable land in the corridor or the market to support it. Construction of the project is proceeding on schedule, albeit with limited TOD.The extension of the Portland Streetcar and an aerial tram from the Oregon Health Sciences University to the South Waterfront are helping shape the region’s most environmentally sustainable and highest density TOD district.
4.
5.
6.
Figure 9.1 The RoundOver the past two-decades the Portland region has added new tools to accelerate TOD implementation. More than $9 billion in transit-friendly development has occurred along Portland’s 44 miles of light rail and 4 miles of modern streetcar.
Transit Oriented Development114
The waterfront site lay fallow for decades as an industrial neighbour to downtown unable to realize its potential until access to the district could be opened up. The streetcar now connects the district to downtown. 10,000 jobs and 3,000 housing units are expected by 2015 (PDC, 2003).
TOD puppet masters: What strings does government pull?
Nearly every light rail station and the corridor along the streetcar are the home to TODs. It wasn’t always that way. One of the important lessons from Portland’s first light rail line is that planning is necessary, but not sufficient to realize TOD. With the Eastside TOD plans were adopted but built TOD projects were slow to happen at many of the stations. Portland’s TOD advocates soon learned planning has to be followed up with a clear strategy to help realize the construction of TODs. In response, new tools and players have gradually been added to the mix yielding tangible results. Market acceptance and construction of TOD has accelerated since the opening of the region’s second light-rail line (Westside) in September 1998,
Figure 9.2 Madison PlaceThe streetcar was conceived as much as a development tool as a transportation project. Since the Streetcar opened for service in 2001 over $3.4 billion in new development has occurred along the route.
Portland’s TOD Evolution 115
in part because of a greater emphasis on planning with an eye to the real estate market and TOD implementation.
In comparison to the initial planning for TOD in the 1970’s Portland’s TOD planners now have new tools, new resources and new allies to complement their planning. Portland’s TOD toolbox includes an enhanced planning framework at the state and regional level, financial incentives for TOD and specialized staff working to accelerate TOD construction (Table 9.1).
TOD planning and implementation is today being pursued at multiple levels. Within the region TriMet, Metro (the regional government), and Portland’s urban renewal agency the Portland Development Commission (PDC) take centre stage in making TOD real by dedicating staff and resources specifically to implement TOD. In some cases they are taking advantage of a supportive real estate market and pushing it even further than it would go otherwise. Each is willing to bring their tool box of incentives to the table in exchange for higher density, more amenities, less parking, and/or greater affordability than would be financially feasible otherwise in a traditional market driven project. Some critics point to the use of these tools in TOD implementation as an indication of a failed strategy perpetuated by unnecessary regulations and subsidy to force people into dense development. TriMet, Metro and PDC point out they won’t fund projects that would be feasible on their own. Each agency applies different priorities and solves for slightly different outcomes in determining if they should provide public funding to a proposed TOD project. For Metro and PDC the evaluation process is asking fundamentally the same question: are we getting more of what we want than the market could otherwise provide?
TriMet, Metro and PDC are following complementary, but different paths to increase the amount of TOD in the Portland region. For others contemplating TOD implementation these variations on a theme help to illustrate there is no one way to implement TOD and the importance of partnerships in TOD implementation.
TriMet: Less is more
TriMet’s involvement in TOD has been as an advocate, an educator, a funder and sometimes a direct participant in development. The agency has been willing to provide substantial time and resources to further the implementation of TOD and the region’s vision of “growing up, not out.” At the same time, TriMet has been a major beneficiary of those regional policies.
By focusing growth next to transit stops, TriMet believes the policies help to fill it’s trains and buses. The data at a regional scale seems to support TriMet’s view (Figure 9.3) that linking transit and land use results in more transit ridership. Since 1990 TriMet’s ridership has grown faster than the growth of population, transit service hours or the use of the automobile (Vehicle Miles travelled VMT).
Part of TriMet’s success in TOD was an accident of history, a case of where less became more. The traditional route to transit agency involvement in TOD has been through selling land for development at fair market value. BART in the San
Transit Oriented Development116
Francisco Bay Area, WMATA in Washington, DC, MARTA in Atlanta and MTA in Los Angeles are all examples of transit agencies that have had plenty of land to offer for development as a consequence of owning land acquired from building a rail project. TriMet’s first rail line was in part an outgrowth of a citizen lead freeway revolt; in response, land takings were minimized. Without abundant land to work with TriMet focused on building partnerships and convincing others TOD was a good idea. TriMet’s route to TOD started through enabling TOD by using transit project funds to pay local governments to complete transit-friendly land use plans around light rail stations. In response, TOD has taken root beyond TriMet.
TriMet has one staff person dedicated to TOD and no special TOD tools or sources of funding. What sets TriMet apart from many of its transit agency peers is its attitude toward TOD. TriMet sees TOD as one of the ingredients that make the agency successful. To realize that vision TriMet staff has been given the latitude to think outside the box to make TOD work. The tool box includes: selecting rail alignments with an eye toward TOD; modifying station locations to facilitate supportive development; funding local government planning to get supportive policies in place; writing down land costs to get better design/density/ affordability in TODs; turning parking and rides into TODs; and, investing the savings from rail construction to create TODs.
The Crown Motel With no dedicated source of funds to encourage TOD TriMetWith no dedicated source of funds to encourage TOD TriMet has become quite entrepreneurial in freeing up resources. When the federally
Figure 9.3 Portland’s ridership growth outpaces auto use, percentage change, 1990–2006
Portland’s TOD Evolution 117
funded Interstate light rail line was completed for US$4 million under budget, TriMet’s TOD planners were able to re-capture the project funds for TOD.
Working within the framework of PDC’s corridor development strategy TriMet bought two sites for TOD. The focus of TriMet’s attention in the corridor is on the Crown Motel site. According to TriMet’s TOD Manager, Jillian Detweiler, the site was offered for development thru a Request for Qualifications (RFQ) process.1 Out of 10 responses, REACH Housing, a non-profit developer, was selected for the project.2
Unlike some selection processes, TriMet was careful not to make “a pretty picture” or price part of the evaluation. Instead experience, approach and interestingly the “understanding of TOD, benefits to TriMet and public transportation users” was the core of the selection criteria. Rather than solving for price TriMet was seeking proposals that would help to “activate” the station area, get ridership and address affordability. TriMet acquired the site for US$1m and sold it to REACH for US$300,000. The land write-down was possible after TriMet completed an appraisal taking into account the public policy conditions being placed on the site.
The Crown Motel project helps to illustrate how far Portland’s TOD planners are willing to go to achieve public objectives such as affordability. Part of REACH’s successful strategy was to target renters who are transit dependant and to take advantage of the wealth creation advantages of transit from not needing a car.
Metro: Investing in TOD
Portland’s directly elected regional government’s involvement in TOD dates back to its creation when Metro lead the region’s first TOD planning, station area planning for the Eastside in 1980. Today Metro’s TOD Program has evolved to into an innovative Implementation program with a staff of 3.5 FTE dedicated to making TOD, Centres and Corridors happen as part of an aggressive strategy to help implement Region 2040.3
1 An RFQ process for TOD is a tender where a government controlling a propertyAn RFQ process for TOD is a tender where a government controlling a property solicits proposals from private developers to develop a site. Selection is based on qualifications as opposed to a specific development proposal and price. In a RFQ the primary selection criteria is the developers experience and their project understanding. Developers tend to favor the simpler and less expensive RFQ process rather than a more structured RFP (Request for Proposals). In an RFP the potential developer will need to invest considerable time and expense to prepare a proposal containing a conceptual design, renderings and a price.
2 Jillian Detweiler, TriMet TOD Manager, telephone interview with the author,Jillian Detweiler, TriMet TOD Manager, telephone interview with the author, Portland, Oregon. August 3, 2007.
3 For more information on Metro’s Transit Oriented Development see their AnnualFor more information on Metro’s Transit Oriented Development see their Annual Report: http://www.metro-region.org/files/planning/transit-oriented_development_and_ce nters_2007_annual_report.pdf.
Transit Oriented Development118
Metro is currently working with 12 to 15 developers doing TOD projects. The TOD Program operates through a series of cooperative agreements between Metro and local jurisdictions, and utilizes development agreements with private developers. The primary use of TOD Program funds is site acquisition. The program has an annual budget of approximately US$2.5 million. Funding for the TOD program is subject to bi-annual funding through the Metropolitan Transportation Improvement Program (MTIP). The TOD program has received about US$20m competing for funding in the same highly competitive regional pot of federal discretionary funds which also can go to fund roads and transit.
In recent years Metro has avoided the strings attached with federal funding by “washing” its MTIP funds through TriMet. In other words, the two agencies agreed to exchange TriMet local funds for MTIP funds. TriMet’s local funds have much fewer legal limitations on how they can be used. Exchanging federal funds for local funds has resulted in more flexibility in how to use the funds and fewer headaches for the program. TriMet is able to exchange local transit funds on a 1:1 basis for Metro’s federal funds. The Program has been directly involved in the funding of 29 different TOD projects with a level of involvement ranging from US$50,000 to US$2 million in site control and direct financial participation in TODs.
Strong real estate markets are unlikely to get Metro’s attention. Instead they target emerging markets as areas to apply their tools. According to Metro’s Marc Guichard, “Metro’s TOD Program pushes the development envelope by using public-private partnership techniques to secure more TOD-like projects than would otherwise be developed on a given site. For example, on a site where the free market would likely produce three-story apartments with surface parking and no retail, the TOD Program would push for five-stories with podium parking and ground-floor retail that may have four to five times more dwelling units and induce significantly more transit ridership” (Cervero et al, 2004).
Property is acquired, re-parcelled, and planned, then sold with conditions to private developers for constructing TOD and/or dedicated to local governments for streets, plazas, and other public facilities where appropriate. In many cases, the land value is written down to cover the high development costs required to construct a specific TOD project. In such cases, a “highest and best transit use” appraisal is used to establish the sale price.
Gresham Station It is said good things come to those that wait. That is apparentlyIt is said good things come to those that wait. That is apparently the case for the Gresham Station, a mixed-use primarily retail transit-oriented community located 13 miles east of downtown Portland. The site is anchored by Gresham City Hall and Gresham Station, a 300,000 square foot retail centre designed as part of the 1995 Gresham Civic Neighbourhood Plan. The plan includes a provision for a second light rail station west of Civic Drive once the density of development is sufficient to support a station. The trigger point for adding a station has become more of a term of art than a precise number. Consequently it is difficult to speculate when Gresham Station will have a second station.
Portland’s TOD Evolution 119
The 130-acre site has seen a variety of plans come and go. The most spectacular was a 1990 proposal by the Winmar Company of Seattle for a US$100 million 900,000 square foot regional shopping mall, built over and incorporated directly into the light rail line. A change in market led to the plans demise in 1992. In 1995, the City of Gresham adopted the Gresham Civic Neighbourhood plan calling for 885 residential units, 390,000 square feet of office and 332,000 square feet of retail uses on a new street grid and a new light rail station as a focal point. The first TOD building blocks were the construction of a new City Hall, conference centre and plaza adjacent to the City Hall Max station in 1996. Gresham Station opened in 2003.
To help accelerate development on the site consistent with TOD principles Metro acquired 13 acres surrounding the future station. Metro’s first project out of the ground is The Crossings, a 5 story mixed-use building with 81 residential units and 20,000 square feet of ground level retail on 1.48 acres. The project was completed in the spring of 2006. The total construction cost of the project is US$11 million. The project has the highest density in Gresham and was the first suburban project in the Portland region with underground parking.
Metro staff go through a two step process to evaluate investments in projects like The Crossing. In simple terms, they are seeking to isolate whether the added cost premiums from the projects mixed use and density are equal to or less than the public benefit. If they are, Metro can fund the project. The evaluation works this way:
What are the added costs for building a project of this type? Metro evaluates the cost premiums from mixed use and density:
The costs are assessed against a base-line of what the market has been doing.Metro TOD staff isolate costs using a standard check list considering cost factors such as: parking, framing, elevator, sprinkler systems, plumbing core for mixed-use, and a “more complex building factor”
What is the public benefit is it worth doing? Metro wants to understand if the cost premiums equal the value? To calculate value:
Metro calculates the capitalized value of the fare box from new riders. The value of walk trips is also added to the equation.
For The Crossings Metro determined there were US$2.9 million in cost premiums associated with the project and re-sold the land (at about half the price) to the original owner, developer Mike Rossman of Peak Development LLC. Rossman was also able to obtain a Transit-Oriented Development Tax Exemption from the City of Gresham. The 100 percent tax exemption on the improvement value for all residential areas helped to make it possible to undertake the expensive structure envisioned by Metro. The project includes a TOD 10-year Tax Abatement, an agreement to reinvest system development charges on the site, land acquisition and write-downs, targeting regional MTIP funds for transportation improvements,
1.
a.
b.
2.
a.
Transit Oriented Development120
and reduced parking ratios for The Crossing. According to Phil Whitmore, who has directed the Metro TOD program since the early 1980’s, “part of the value of the program is that it ties Metro back to the reality of what it takes to do the projects we are advocating. We understand the reality faced by bankers and developers. Most of our developers have already swallowed the vision part, but they need help to make the projects work.”4
PDC: Bringing a big toolbox to TOD
Where TriMet and Metro were drawn to development to make TOD happen, the Portland Development Commission had been actively reshaping the face of Portland decades before TOD came onto the public policy agenda. Founded in 1958, PDC is the full service implementation arm of the City of Portland, with Urban Renewal, Economic Development and Housing all under one umbrella.
As Cheryl Twete, the Director of Development for PDC explains it, “TOD is part of our mainstream goal of creating mixed use, dense areas, with great pedestrian connectivity.” At the end of the day “TOD for PDC is more complex than creating great buildings clustered around transit, it is about lifestyle choices, a wider range of everyday living to choose from.”5
To realize those outcomes PDC has an annual budget of US$250 million of which 70 to 80 percent is from Tax Increment Financing raised in one of PDC’s 11 urban renewal districts. Like TriMet and Metro, PDC will only invest its funds in exchange for leveraging a substantial public benefit. PDC started with an emphasis on wanting financially successful buildings, now according to Twete, they also want buildings that are green, that support the community, that support transit, pay prevailing wages and meet minority and disadvantaged business goals.
Two of the other tools PDC uses are tax abatement programs and developer agreements. Programs like the 10-year Transit-Oriented Development Tax Exemption are very powerful tools because they allow PDC to push a project along with very little investment. Rather than investing money upfront in a project, with tax abatement PDC is simply foregoing revenue.
The Pearl District The Pearl District is perhaps the most profound example ofThe Pearl District is perhaps the most profound example of how PDC used TOD to change the shape of the city using tools like developer agreements and land assembly. The creation of the Pearl District is the most dramatic transformation of Downtown Portland in the last 20 years. The pace and scale of development in “The Pearl” (90 city blocks of former warehouses and rail yards on the north edge of Portland’s CBD) is exceeding expectations. The Pearl
4 Phil Whitmore, Director Metro TOD Program, telephone interview with the author,Phil Whitmore, Director Metro TOD Program, telephone interview with the author, Portland, Oregon. August 7, 2007.
5 Cheryl Twete, Director of Development. Portland Development Commission,Cheryl Twete, Director of Development. Portland Development Commission, interview with the author, Portland, Oregon. August 23, 2007.
Portland’s TOD Evolution 121
District is now an established mixed use neighbourhood of high density housing, parks, art galleries, boutiques, cafes, and restaurants (Cervero et al, 2004).
A major catalyst to the transformation of the Pearl District was the construction of the Portland Streetcar, the first modern streetcar system to be built in the United States. The streetcar investment has been strategically used to leverage large-scale redevelopment (Figure 9.2). The streetcar has been equal parts housing and transportation. The average density of the Pearl District is now the highest in the city. At build out, it will be home to over 10,000 residents in 5,500 housing units, and 21,000 jobs. The area will also have 1 million square feet of new commercial and retail space.
A central implementation tool for the Pearl was an innovative Master Development Agreement which was entered into by the city and Hoyt Street Properties (HSP), the owners of 40 acres of contaminated rail yards in 1997. With the Hoyt Street Yards under single ownership, the city recognized a unique opportunity to pursue large-scale redevelopment. In entering into the agreement, the city’s main goals were to preserve historic buildings, increase density to create vibrancy and attract business, promote transit use, and support existing and new arts organizations.
The essential elements of the Development Agreement were:
Housing: Proposed housing densities were significantly higher than for anything built previously. The developer agreed to increase the minimum density from 15 to 87 units per acre when the city commenced removal of the Lovejoy Viaduct that crossed the abandoned rail yards. Also, on completion of the Portland Streetcar, minimum densities would increase to 109 units per acre. Finally, when construction commenced on the Pearl District’s first park, density would rise further, to 131 units per acre. In addition to meeting density requirements, the developer also agreed to help meet the city’s housing-affordability goals. In exchange for density bonuses and financial incentives provided by the City of Portland 25 percent of the housing produced in the Pearl District is affordable. At least 15 percent of all rental units and 10 percent of all for-sale units must be 700 square feet or smaller. And at least 15 percent of the total housing units must be affordable to families earning up to 50 percent of the area’s median family income (MFI), and 20 percent of the units must be affordable to families earning up to 80 percent of the area’s MFI (Cervero et al, 2004).Parks: HSP agreed to donate 1.5 acres of land for new parks in exchange for the city’s commitment to build them. In addition, the city has the option to acquire up to 4 acres for public open space.Infrastructure: Transportation improvements were essential to develop the area. The agreement stipulated that HSP would donate the right-of-way for all local streets, sidewalks, and utilities (6 acres) at no cost. HSP also paid US$121,000 to remove the Lovejoy Viaduct and US$700,000 towards the Portland Streetcar.
1.
2.
3.
Transit Oriented Development122
To fund the city’s obligations, an urban renewal district was formed in 1998, allowing for tax-increment financing. In the first 5 years of its existence over US$70 million have been spent for removal of the Lovejoy Viaduct, construction of the Portland Streetcar, construction of affordable housing, and the development of Jamison Park and other amenities.
Revitalization and development of the Pearl District has been a success on virtually all fronts. Densities are now exceeding those required by the developer agreement. Underutilized land and buildings have been reclaimed, a new type of housing product has been successfully introduced, retailers have a greater variety of locations and building types from which to choose, and the Streetcar is popular among residents and visitors.
The future of TOD
TOD has taken centre stage in the Portland region’s growth management strategy. The Portland TOD story is actually a community-building and life-style choice story more than it is a TOD story. The jurisdictional support TOD enjoys in the region is due to community leaders who have learned to use TOD as a tool to help achieve broader quality-of-life objectives. TOD in Portland has become a means to the end of creating a livable community, not an end in itself.
The majority of Portland TODs are products of the private market – fuelled by supportive public policy and growing consumer preference for an urban style development product being seen across the United States.6 As TOD professionals ask developers to go further than the market would do otherwise the path to becoming a TOD has at times been rocky, but as lessons are learned and put to good use, the region is poised to be both smarter and more measured as it pursues the next generation of TODs.
To date, the evolution of TOD in Portland has experienced two major phases of TOD implementation. The first entailed building the institutional capacity to plan for TOD; that is now well established. The region is currently in a second phase of grooming sophisticated developers, lenders, and contractors to build TOD. In the end, TOD in Portland may become very prevalent and simultaneously less “visible” as it becomes more of the rule, not the exception, for new development.
6 According to The Centre for Transit Oriented Development changing demographicsAccording to The Centre for Transit Oriented Development changing demographics are causing fundamental shifts in the housing market which will increase the demand for TOD. They estimate by 2030 almost a quarter of all U.S. households looking to rent or to buy are likely to want higher-density housing near transit. The demand for TOD is reflected in ULI/PRICEWATERHOUSECOOPERS “Emerging Trends in Real Estate” report which ranked TOD as one of the best bets for investors each of the last three years. Center for Transit Oriented Development (2007), TOD 101, Oakland, California.
Portland’s TOD Evolution 123
Conclusions and lessons
The Portland region is unique in the United States for its scale, extent, and sustained commitment to TOD. While Portland’s ability to create innovative planning regulations seemingly knows no bounds, planning does not create real estate demand. The construction of Portland’s suburban and urban TODs is being fuelled by consumers purchasing the products built by suppliers, that is, the invisible hand of the marketplace.
Given the complexity and breadth of the undertaking, it seems unlikely that any other region will choose to completely replicate Portland’s approach to TOD. The lessons learned from individual projects and the evolution of the Portland approach; however, continue to have application to other communities as they chart their own course for TOD. Among these are the following:
Leveraging transit infrastructure can help achieve broader objectives. Since the Portland Transit Mall opened in the mid-1970s, the region has repeated its signature strategy over and over – using transit investments as a means to the end of accomplishing multiple goals. Portland’s policymakers see TOD as providing a sustainable alternative to the automobile, enhancing downtown revitalization, containing sprawl, and revitalizing communities.Planning is necessary, but not sufficient. Getting the plans and development standards in place is not enough. Urban transformation takes time and requires patience, perseverance and partnerships. The region has developed skilled professionals, redirected funding and a blend of targeted incentives to complement the plans in order to get more than the market would otherwise do on its own.Continue to raise the bar for TOD. Greater Portland’s policymakers have not been content to simply channel jobs and housing next to transit. They have sought to raise the density, lower the parking, increase the quality of design, gain affordability and increase the mix of uses in TODs. Whether developers will build these enhanced TODs on their own or will hold out for continued financial and regulatory incentives remains an open question.TOD needs “urban living infrastructure.” As TOD has grown in Portland it has evolved from a focus on buildings, planning and implementation to creating lifestyle choices for residents in the region. Getting the essential urban living infrastructure in place is critical, that has meant paying attention to the public spaces, the restaurants, the retail programming and the unexpected surprises that make you want to be a pedestrian and bring joy to your life.7
7 Portland Behaves Differently: The Portland story is significant because somethingPortland Behaves Differently: The Portland story is significant because something different is happening that sets it apart from other American cities. TOD is one of the key ingredients in the city building DNA Portland is using to shape its future. Consider this:
1.
2.
3.
4.
Transit Oriented Development124
More than US$9 billion in development consistent with transit-friendly land use plans has occurred along Portland’s 44 miles of light rail and 4 miles of modern streetcar. Compared to other large metropolitan areas in the U.S., Portland area residents travel about 20 percent fewer miles every day (Cortright, 2007).Portland residents are twice as likely to use transit to commute to work and seven times more likely to commute by bicycle than the average metropolitan resident of the U.S. (Mayer, 2007).Since 1990, ridership on buses, light rail and streetcar has grown at a rate significantly higher than growth in transit service hours, population and vehicle miles travelled. Over 8 in 10 of TriMet’s riders are choice riders, meaning they have a car available for the trip or chose not to own a car (Arrington, 2000).Portland’s quality of life is seemingly helping give it an advantage in the knowledge economy. Over the decade of the 1990s, the number of college-educated 25 to 34 year-olds increased 50 percent in the Portland metropolitan area – five times faster than in the nation as a whole (Cortright, 2007).Portland has the second lowest rate of spending on transportation costs of the 28 largest US metro areas. Residents spend about 4 percentage points less of their total household budgets on transportation than other Americans, about 15.1 percent compared to 19.1 percent nationally (Cortright, 2007).
•
•
•
•
•
•
Chapter 10
Successful Delivery Mechanisms: Coordinating Plans, Players and Action
Mike Mouritz and Louise Ainsworth
Introduction
This chapter presents initiatives from Perth, Western Australia, designed to enhance the link between transport and land use through a targeted program of Transit-Oriented Development (TOD). The work of a state-led coordinating committee is outlined and key issues for implementation discussed. Case study examples are provided in order to illustrate the way in which local TOD projects have been progressed.
Perth is the capital of the state of Western Australia (WA). It has been called the most isolated capital city in the world being over 2,700km from the nearest comparable city (Adelaide, South Australia). With 10,000km of coast line and occupying the western third of the Australian continent, WA is Australia’s largest state – three and a half times bigger than Texas. Perth has a population of 1.55m which is expected to grow to 2.39m by 2031. The State’s growth is underpinned largely by the mining sector and the State’s vast resources. While Perth is a highly automobile dependent city with an average density of only 6 dwellings per hectare recent investment in passenger rail infrastructure puts Perth in a favourable position to meet its population growth challenges.
Origins of TOD approach in Perth: network City
To respond to the diverse growth challenges the State Government, through its independent planning commission and planning agencies, has developed a long term strategy for the city – entitled “Network City: community planning strategy for Perth and Peel” (NWC) published in 2004. NWC seeks to enhance the liveability and sustainability of the city and the communities that make it up. A key objective of that strategy is to better balance the level of outward growth with urban regeneration, in particular existing activity centres and along activity corridors. The TOD program in Perth has and will continue to play a critical part in that effort. The reader is encouraged to review Chapter 4 for more detail of the WA planning context within which Perth’s TOD program has evolved.
Transit Oriented Development126
An important driver for enhanced integration in land and transport planning has been the bringing together of planning, transport agencies and development agencies, under the control of one State Minister for Planning and Infrastructure. This has enabled greater coordination between the development of planning policy and the delivery of public sector TOD based initiatives.
Network City calls for active management of urban growth through the establishment of a defined “connected network pattern” of development. This is to be achieved by the enhancement of existing centres and creation of new centres, based around public transport. These centres are to be medium and higher density urban villages and towns, joined by “activity corridors” made up of road and public transport links. Activity corridors are paralleled by clearly defined “transport corridors”, primarily designed to accommodate rapid car and freight movement around the city.
The TOD Coordinating Committee
The first cross-portfolio TOD committee was initiated in 2001 by the Public Transport Authority (PTA), to provide a planning context for the PTA’s capital works program aimed at enhancing existing rail stations. This became a catalyst for TOD opportunities in precincts where station redevelopment was scheduled. In response to Network City, the TOD Coordinating Committee, now chaired by Department for Planning and Infrastructure (DPI), the State’s principle planning agency, has gone on to develop a more formal TOD program.
Membership of the committee is drawn from key agencies within the Minister for Planning and Infrastructure’s portfolio including the Department for Planning and Infrastructure (DPI) who chair the committee, Public Transport Authority (PTA), Main Roads WA and LandCorp – the State’s land development agency. Other, non-portfolio agencies are invited to participate where projects require wider input allowing skills and knowledge to be drawn from the areas of planning, development, transit and housing. These include the Department of Housing and Works – the agency responsible for social housing and public works, Redevelopment Authority representatives for the areas of Midland, East Perth, Subiaco – public development authorities with specific geographic focus, the WA Local Government Association – representing local government and the Planning and Transport Research Centre – an academic research centre. Representatives from the development community are also invited to participate.
The TOD program’s main aim is to act as a delivery mechanism for Network City by aligning transport and land use to optimize accessibility and amenity. It does this by utilizing state government resources to facilitate private sector investment in and around transit locations in both existing and new urban areas. The aims are to improve the efficiency of urban land use and infrastructure, to improve urban design and to provide opportunities for greater diversity of housing.
Successful Delivery Mechanisms 127
Activities and achievements
The program is made up of seven key elements (Figure 10.1) and some of the key activities and achievements of the TOD program are now outlined.
Policy The committee has overseen the development and revision of policyThe committee has overseen the development and revision of policy documents aimed at encouraging TOD development in appropriate locations. It is envisioned that more prescriptive, location specific policies, will be developed at both state and local government level to enhance TOD outcomes, particularly at principle Activity Centres.
Partnerships The main focus here is establishing strong working relationships withThe main focus here is establishing strong working relationships with local government and the private sector on key projects. Experience has shown that a supportive local planning framework, community support and developer interest are required to maximize TOD opportunities. In some cases, the active participation of local government as a landowner is also required. Projects that lack consistent local government support and strong community engagement often stall or fail.
Priority projects Every passenger rail station and hub on the high frequencyEvery passenger rail station and hub on the high frequency (15 mins or less) bus routes cross the metropolitan area has been identified and prioritized for planning and/or project intervention. Priorities are reviewed using a simple set of criteria which recognize the uniqueness of each TOD location and include: partnership potential; strategic significance of location (type of activity centre, accessibility to services, jobs, sport, leisure etc); potential for maximizing ridership; development opportunities (public or private, under/unused government land); socio-economic benefit (social mobility for youth, aged and lower income groups – opportunity for affordable housing); and finally infrastructure needs (complements other investment, including station improvements, new health/
Figure 10.1 TOD program elements
Transit Oriented Development128
education facilities, etc.). These simple criteria provide the first sieve in deciding priorities. A more detailed quantitative assessment tool has been devised to test the total potential of a place for change through transit oriented development and therefore the cost-benefit for investment in capital works. The tool can be used in short listing those places for further consideration.
Strategic planning This part of the program takes a longer term view ofThis part of the program takes a longer term view of identifying TOD opportunities in both greenfield and redevelopment locations. A recent example is the review of the planning and public transport provision for a 10km long existing urban development corridor to the east of Perth’s CBD. Known as the Maylands-Guildford project and containing eight passenger rail stations, the project involves collaboration between the relevant government agencies and three local governments to prepare a district planning framework for the corridor which identifies the function/typology of each transit place within it. The Maylands-Guildford project will also seek ways to increase housing density, diversity and employment and review the provision of public transport to better suit development potential in the corridor.
Promotion The promotion part of the program has been focussed around creatingThe promotion part of the program has been focussed around creating awareness within the planning and development sector about the opportunities for TOD. This has been achieved by hosting talks, seminars and conferences including the 2005 “TOD – Making it Happen conference”. Such promotional tools complement work by PTA to provide a ‘clean and fast’ image for Perth’s public transport system. These are further supplemented via the TravelSmart Household Program which addresses the transport needs of customers with basic information on how to buy a ticket or plan a journey to result in the best door to door travel times. Local TravelSmart information is supported by direct personal contact, support services (including journey planning) for walking, bicycle and public transport trips.
Place management Recognition of the uniqueness of each location is the firstRecognition of the uniqueness of each location is the first step to creating a sense of place. A one size fits all approach to TOD should be avoided. While still in its early days, place management is likely to be tied into the Activity Centres policy which aims to create places which are a focus for community as well as economic activity. The policy will help to create: a robust mix of age and socio-economic groups, affordable housing, and small business opportunity for each place. Protection of environmental assets, minimum urban design standards and mechanisms for ongoing Local Government management are other aspects of place management being explored by the TOD Committee.
To help foster this concept a national conference with an international keynote speaker, was hosted in June 2005 by the TOD partners titled “Urban regeneration – creating communities through the art of place making”. This initiative has lead to the establishment of a ‘Place Makers Network’ of practitioners. This is a local network of professionals who share their experience in urban regeneration and TODs.
Successful Delivery Mechanisms 129
Research and evaluation The Planning and Transport Research Centre (PATREC)The Planning and Transport Research Centre (PATREC) is represented on the TOD committee. PATREC is a collaboration between the four universities in Perth and has taken up the TOD initiatives as a key part of its research agenda. Research to date includes a longitudinal study of behaviour change relating to the new Mandurah line; research into the attitudes, obstacles and opportunities surrounding TOD in Perth; the demand for housing in TOD; performance indicators for TOD and affordable housing in TOD in Perth.
Implementing TOD: steps to implementation
The transition from planning to implementation is complex but possible with a professional project management approach. The steps to implementation include:
Identify the site’s opportunities and constraints (including notional financial constraints).Establish a governance structure such as a steering committee, usually chaired by the landowner’s or developer’s representative.Develop a shared vision and a concept with stakeholders and the community. Experience shows that if financial, logistical and technical constraints are identified and outlined early on, involving stakeholders and community members in problem solving as part of the visioning and planning process can be a fruitful approach.A project implementation plan is required. Setting objectives and scoping the works under a sustainability framework, ensures place-making is addressed through the creation of socio-economic (or ‘soft’) infrastructure as well as physical infrastructure. Environmental targets can be included under such headings as conservation, contamination (clean up), water and energy efficiency, recycling, etc.Identify control mechanisms for building development and place-making. (eg through design guidelines, town planning schemes, structured sales, developer contributions, place manager, design competitions, etc.).For each item in the scope of work, including control mechanisms it is important to allocate clear responsibilities. The scope of work can all be costed, risks assessed and a feasibility study undertaken. The outcome of the study will help determine the type of overall implementation model (see below).The developer prepares a business case based on the implementation plan and the chosen implementation model.Where not all the scope of works are the developer’s responsibility (particularly where long term ‘soft infrastructure’ is required), a project agreement is important.
A recurring set of challenges has emerged for implementing TOD in Perth, although not all emerge on each project. This and the way the different project’s
•
•
•
•
•
•
•
•
Transit Oriented Development130
respond to these challenges shows again that each TOD project is unique. Three main challenges are evident:
Achieving density and housing affordabilityGetting the right mix of usesIntegrating infrastructure into urban design to achieve a sense of place.
Achieving density and housing affordability In general, the Perth communityIn general, the Perth community fears higher density. Improved communication around Network City principles is needed to dispel two myths: that densification aims to replace rather than complement single residential development; and that densification will re-create the social housing ghettos of the 60’s. The density fear is a construct of fears including: height, perceived parking and traffic problems, lost views, lost privacy, overcrowding, overshadowing, loss of character, poor architecture, decreased property values and just plain xenophobia! There is a local view that the only people who will occupy high density housing are social or affordable housing tenants who have no other choice. Overcoming the fear of density will therefore rely partly on demonstrations of well resolved design and high quality architecture that attracts a willing market. While minimum requirements for affordable and social housing may be built into statutory planning approvals, it will also be important to ensure this is ‘invisible’ in terms of design. It will also be important that urban design for new TOD shows a sensitive physical transitions between low density, existing development and higher density development.
Getting the right mix of uses It is important to engage business as well as theIt is important to engage business as well as the general community as part of the concept development for TOD projects. For about fifty years Perth metropolitan planning has accommodated the car and effectively separated land uses. Town planning schemes are now encouraging mixed use and town centre zones. However businesses are used to operating from malls or business parks. In contrast to the city, many country towns or older suburbs still have a walkable main street at the community’s heart. These are useful examples to help demonstrate how businesses can work in a main street urban environment. The land sales process can also be an effective way to influence outcomes.
Integrating infrastructure into urban design to achieve a sense of place TheThe dominance of park and ride areas and the (debatable) need for separate bus ways and transit lanes pose a serious design challenge when trying to create a place with a walkable human scale. To address this challenge, at Cockburn Central and Clarkson the park and ride area is set back behind commercial uses. The town square doubles as a drop-off area. For major activity centres, the park and ride area could be leased and as the town grows into a destination in its own right, the park and ride can be closed down and the sites developed. There is an emerging debate over the need to shift the balance of ridership from park and ride to more sustainable sources such as buses and walk-on. Better definition of the role of park
•••
Successful Delivery Mechanisms 131
and ride within differing types of transit oriented activity centres is required to help progress this debate.
Choosing an implementation model
In determining the choice of implementation model for TOD and other types of development three factors are important: who owns the land; the likely viability of the project; and the presence or absence of a capable development entity. A range of other factors also influence the choice of implementation model. These include: the size and complexity of the project and the need for expeditiousness (including developer approvals); the need for infrastructure (soft or hard) and the capacity of local government and the private development sector to participate or support are also key considerations in the choice of implementation model.
There is a continuum of implementation models which can be drawn upon to meet challenges of TOD. At one end of the continuum are private sector models and at the other end dedicated public sector models.
Private sector models Private sector models are usually in tune with the marketPrivate sector models are usually in tune with the market and expedient. On the whole they are less likely to take risks with initiatives in such things as place-making or environmental design unless the project is high return or is very long term. Wellard is a good example of the private sector implementing TOD at a neighbourhood scale (Chapter 15). Where the government holds land it may sell this to private sector developers with conditions attached to facilitate raised density and socio-economic development. Public/private joint ventures can also be used as stepping stone to ensure private sector developers ‘buy in’ to TOD initiatives.
Public sector models Public sector models (usually in the form of a redevelopmentPublic sector models (usually in the form of a redevelopment authority (RDA)) allow a single project focus, although they require an Act of State Parliament to set up and can be expensive to run as each requires its own Board, management, staff, accommodation and business systems. When redevelopment is complete, handing over planning control, maintenance and management to the local authority can be difficult. Despite removing planning control from the local authority, a strong relationship with the local authority needs to be maintained by the RDA from the outset to ensure smooth handover or normalization. RDA’s have produced some excellent results such as Subiaco (Chapter 6).
Land agency models The land agency sits between the public and private sectorThe land agency sits between the public and private sector models in many Australian states. LandCorp (WA) operates under an Act of Parliament under the Minister for Planning and Infrastructure and can offer a ‘sub-continuum’ of implementation models which bridge the gap between the public and the private sector models. A land agency is not geographically constrained and complements the skills between planning or infrastructure agencies by providing an understanding of state needs as well planning and implementation issues. The
Transit Oriented Development132
agency can tailor implementation strategies through its ability to assemble land; pre-fund infrastructure; provide project management expertise and enter into partnerships with local government, state government or private sector developers. Being tuned to state needs, land agency implementation models tend to maintain a focus on leadership and demonstration (in both land and building projects) while still providing a potential financial dividend back to the State.
Serviced (Re)Development Authority At one end of this sub-continuum the impostAt one end of this sub-continuum the impost of the public sector RDA can be reduced through an agency-supported model. An example is Armadale, where LandCorp provides expertise and development capacity in addition to information technology, business systems, recruitment, technical procedures and staff to the Armadale Redevelopment Authority through a service agreement, which is more cost-effective than a separate RDA.
Development Acts The land agency undertakes the project in-house governedThe land agency undertakes the project in-house governed by an Act of Parliament. A Development Act usually brings with it planning powers. LandCorp handles this through a special sub-committee of its own Board. Governance of the development project itself is separated from the planning function through a taskforce or steering committee. The Development Act may also bestow other special arrangements such as the transfer of land, or funding for resumptions and acquisitions.
Project management Planning and/or development can be undertaken for a fee,Planning and/or development can be undertaken for a fee, with funding from another source such as state Treasury or the landholding agency. In some cases LandCorp pre-funds development (and its own project management fee) with recoupment arrangements made from revenues or other sources. For example in the case of William Street, a major office and mixed use development above Perth’s CBD station, LandCorp resumed the land on behalf of the state and DPI then acted as project manager to procure a suitable developer through a design tender process (similar to a design competition). The state then sold the land directly to the successful tenderer with contract conditions ensuring the building(s) when built would actually deliver on the spirit of the concept accepted in the winning bid in this case Western Australia’s first five-star Green Star rated office building.
Program Aprogramisaseriesofprojectswithcommonoutcomes, implementationA program is a series of projects with common outcomes, implementation of which will lead to achieving an overall objective. With government approval, LandCorp could define a program to allow high value projects to support marginal projects to an agreed net value.
Cash or in-kind ‘top-up’ Based on a discounted cash flow (DCF) analysis toBased on a discounted cash flow (DCF) analysis to ensure transparency, a top up of funding may be provided to reflect the net present value (NPV) of any shortfall. This may be by direct cash injection, discount on the land, infrastructure contribution etc. A ‘top-up’ may be an agreement between purchaser and vendor agencies or may require a state government (cabinet)
Successful Delivery Mechanisms 133
decision. In WA, government landholders are required to transact at market rates unless express permission is given through a Cabinet (state government) decision to do otherwise. Once the top-up or land transfer has been paid or agreed, LandCorp usually acquire the land and take over equity of the project. In this model therefore, all future project risk and opportunity is likely to rest with the land agency.
Equity While needing to meet a hurdle rate set out in its Act, depending on risk,While needing to meet a hurdle rate set out in its Act, depending on risk, LandCorp also has a requirement to balance social, environmental and economic goals in assessing projects. It can take equity in projects with relatively long pay-back periods in order to meet government objectives. This allows the government, through LandCorp, to sponsor projects that the private sector might not have an appetite for. Any profits are reinvested in the State either through future LandCorp projects or through other State initiatives funded from the dividends and taxes that the land agency pays to the state from its operations.
Private sector joint venture Where projects on government land are potentiallyWhere projects on government land are potentially commercially viable, LandCorp may invite a private sector partner into a joint venture. This allows LandCorp to retain its influence over design and development outcomes without the capacity issues of having to manage the development process with its own people.
Currently local government does not fall within the continuum as it has very limited capacity to implement TOD. An investigation is under way however, to determine if it is appropriate to modify the WA Local Government Act to allow small scale TOD projects to be realized by Local Government. This could entail the establishment of arms length local government trading enterprises eliminating the potential for conflict between statutory planning and development roles. The model might be similar to urban regeneration and local trading companies used in New Zealand. While not currently being an implementation vehicle, ideally, local government sets in place land use and density requirements through the local government planning scheme so any development, private or public, is required to evolve in accordance with TOD principles.
Case studies
There are two case studies: Leighton and Cockburn Central. The two projects highlight how a different vision for TOD is required depending on the location, the opportunities and the unique way in which the density, land use and infrastructure design challenges present themselves at each site.
Leighton
Vision This project involves the transformation of redundant railway marshallingThis project involves the transformation of redundant railway marshalling yards adjacent to North Fremantle Station, into a transit-linked coastal village
Transit Oriented Development134
for 1,000 people in about 500 apartments and provides beachside recreation opportunities for many more in the broader region. The existing station is mostly used as an origin for park and ride for work commuters and as a destination by youth accessing the regional beach.
Location and opportunity Early attempts to intensively develop the full 17 haEarly attempts to intensively develop the full 17 ha site were met with public outcry. After significant further (political) consultation, the community agreed to a 4 ha development site to ‘pay for’ other infrastructure and the regeneration of coastal landscape on the remaining 13ha site. The land was sold to LandCorp at full market value. LandCorp has full equity in the development project. State Cabinet agreed that the money the government received from LandCorp for the sale of the development parcel should go to pay for other infrastructure, including the road and rail relocation and a contribution to regeneration of 17 ha parkland.
Implementation challenges With respect to density, height was the big issue. ItWith respect to density, height was the big issue. It was interesting however, that the community did not want the exclusivity of single mansions either. Fear centred on overshadowing the beach and loss of existing views. An agreed combination of survey height limits, (Australia Height Datum (AHD)) storey limits (5 story maximum) and weighting of height to southern end helped alleviate fears.
The community and the local government have strong ‘ownership’ of development control. Detailed design guidelines were devised in a consultative manner and a reference group set up (chaired by the government architect) to consider plans before they go to council. This approach is manageable in this case as there are only 5 superlots.
There is opportunity for beachside retail and leisure uses but there was concern for the viability of these as the use would be highly seasonal. Through the tender sale process, the developers were required to define proposed land uses, including their method for attracting and sustaining these. This has resulted in mixed-use proposals beyond expectation including boutique retail, a range of eateries and a hotel. Developers will also ensure apartment purchasers have access to the ‘TravelSmart’ program.
Cockburn Central
Vision Cockburn Central will be a vibrant regional hub for Perth’s rapidlyCockburn Central will be a vibrant regional hub for Perth’s rapidly growing South-Western corridor. It will provide a choice of housing, recreation, employment and commercial activity for all members of the community. The development is adjacent to one of the stations on the new railway line, thus adding value to state government investment in public transport infrastructure.
Location and opportunity Cockburn Central defined as a Regional CentreCockburn Central defined as a Regional Centre under state planning policy. The population of the catchment is set to grow to
Successful Delivery Mechanisms 135
nearly 200,000 in about 20 years. Cockburn Central will serve and provide job opportunities for this growing population. It will also provide housing choice to counter-balance the overwhelming dominance of detached family dwellings in the area. The estimated dwelling potential is 1000 for the 12 ha core area close to the station.
Implementation challenges Raising density is not an issue here as the site isRaising density is not an issue here as the site is somewhat isolated from surrounding residential uses. The shared vision was founded on city-type development and there is already approval for 12 storey apartments nearby so the height and density potential is quite exciting (Figure 10.2). Local government is preparing a multi-storey mixed-use development incorporating both civic services and residential. The area is generally affordable however LandCorp is also negotiating with affordable / social housing providers.
Achieving a good mix of uses is a challenge. Much of the retail capacity is taken up in an existing shopping mall separated from the town centre core by a main road. In a process similar to Leighton, building developers were asked to tender based on not only on price but also on architectural quality land use and place-making initiatives. In addition, efforts are being made to get Local and State Government agencies to commit to providing services from this location either as a building owner or as a tenant. These initiatives and a good mix of residential uses should generate a sustainable level of activity for complementary business and retail uses.
A separate bus way and a substantial park and ride area have the potential to dominate the landscape. While the economy may depend on park and ride in the early days it is important to create the expectation that this will later be removed.
Figure 10.2 Cockburn Central TOD
Transit Oriented Development136
To this end the state planning authority has retained ownership of the park and ride sites and leases them to the transport authority for a fixed term. In time, Cockburn Central will become a place of business and community activity, a regional town centre and a destination in its own right. At that time the lease of the sites can be terminated in favour of development.
Viability issues were overcome by an ‘in-kind top-up model’. The government owner cleared and filled the site prior to LandCorp purchase and agreed the land price based on town centre development costs, not highest and best use residential values. LandCorp has acquired the site and commenced site development, taking the equity, on this basis.
Lessons and conclusions
Over the last few years, much has been learned about TOD planning and implementation in the Perth context. While the program is still in its early days, some key observations and directions are evident. Development around transit makes good sense in WA, both private and public sector developers are seeing the benefits and exploring opportunities. The formation of DPI has been important in delivering integrated land use and transport planning. Along with operation and delivery agencies, DPI is also the key to leading the promotion of TOD through the Network City planning strategy and prioritizing the actions for implementation of TOD. Broad promotion of the Network City philosophy and the role of Activity Centres is critical for the community to understand and support the philosophy that city growth needs to be based around public transport if the liveability and sustainability of the city are to improved or even maintained. Promotion is also important for the public to begin to overcome its fear of higher density and for business to have the confidence to activate the high streets. It is crucial too that the vision for each TOD is developed and shared by the community and stakeholders and that each TOD vision reflects the unique needs and characteristics of the place. There are challenges, but many problems can be overcome by engaging the community and stakeholders to help to solve them.
The cross-government approach through the TOD Committee allows strategic planning and development proposals to be coordinated with improvements for new transport and/or road infrastructure. A focus on Activity Centre typologies will be central to not only ensuring a TOD approach to the planning of centres which already have good public transport, but to ensuring a stronger focus on planning for public transport infrastructure to support centres which do not currently have it. The role of the TOD Coordinating Committee continues to evolve in support of this and this approach will also be key to determining the rightful locations and role of park and ride. Excellent research is underway through the Western Australian Planning and Transport Research Centre in particular and it will be imperative to ensure the results of this research continue to be used to refine Perth’s TOD program.

Successful Delivery Mechanisms 137
While coordination of the policy, planning and research players is critical to making TOD happen, alone they are not enough. A government land development agency such as LandCorp must be included as a critical player if the gap between plans and action is to be properly bridged.

This page has been left blank intentionally
Chapter 11
Promoting Transit Oriented Development at the Local Level: The Opportunities
and Challenges for Local GovernmentsJanet Edghill, Annette Kroen and Jan Scheurer
Introduction
Transit-Oriented Development initiatives, whether they concern singular, localized projects or comprehensive programs to reform planning and development practice across larger geographical or jurisdictional entities, affect and engage the local level of government in fundamental ways. While the origins of strategic directives about TOD vary greatly between different tiers of government or non-government players, local councils usually hold statutory land use planning authority over the sites in question and are thus in a critical position to oversee the implementation of TOD-related measures. In some cases, such as Redevelopment Authorities, planning authority is delegated to public-private entities set up for the purpose of comprehensive planning. In other cases, councils themselves are the main facilitators of redevelopment activities around public transport, and their own strategic land use priorities on TOD sites and elsewhere within their jurisdiction can carry considerable weight towards supporting or undermining the viability and quality of transit-oriented development.
Commonly however, local government wields limited influence on the supply of public transport infrastructure and services that are critical for the mobility and accessibility aspects of TOD and their users. The cost of large-scale improvements to physical public transport facilities, such as the introduction, extension or upgrading of rail lines, is usually far beyond the budgetary means of local governments and inevitably requires substantial input of resources from State or Federal Governments, and/or the private sector. Public transport services, particularly in Australian cities, tend to be organized at a geographical scale that is above the immediate level of influence of a local transport planning department. Where public transport is owned or operated by a State Government agency, the specific service needs of a particular TOD initiative usually have to compete with other projects across the service area for a limited pool of funding. Where the private sector controls public transport services, commercial considerations may take precedence over the local interest in the provision of superior service for an activity centre specifically designed around public transport.
Transit Oriented Development140
Hence a number of aspects associated with transit-oriented development initiatives touch vital local government interests, yet transcend their traditional reach of policy making. Local governments can take a range of approaches to overcome or at least mitigate this dilemma. This chapter outlines an adaptive framework and process for local councils to optimize a TOD-friendly policy environment within their realm of influence. It explores how local councils can initiate and engage in formal and informal collaborations with other government and non-government stakeholders, aiming at improving land use and transport integration. Case study examples, familiar to the authors, from Australia and Germany are examined to demonstrate how local governments can collaborate using their combined political clout to lobby larger tiers of government towards TOD-friendly policy reform.
Local government and adaptive sustainability
Few would argue that the effective application of sustainability initiatives, in TOD planning as much as elsewhere, is critically reliant upon ensuring that those initiatives are contextualized and adaptive, and therefore practical and appropriate to the local situation. However, early ‘adapt and adopt’ approaches to sustainability initiatives, which attempted to ‘fit’ macro policies and tools into a generalist local mould without accounting for the uniqueness of place and the particularities of scale, have repeatedly proven to be less than ideal (Bell and Jayne, 2006). Similarly, attempting to create policy directives from the ground up, with little or no collaboration or guidance from the various tiers of government and from experienced non-government players, result in the apparently eternal reinvention of the proverbial wheel. It is becoming increasingly apparent amongst planning and sustainability professionals that a more substantive form of adaptability lies in embedding sustainability initiatives into the local policy domain by blending both the macro- and the micro-approaches: i.e. by blending the ‘Big Picture’ policy context (contextualization) with the localized places, values, needs and skills (localization).
Effectively embedding adaptive sustainability involves the interweaving of four distinct but related strands: Framing, Blending, Translation, and Review.
Framing
Framing relates to the emplacement of the sustainability initiative within both the broader policy directives, and the more specific, local contexts. With TOD initiatives, framing is critical as a means of encouraging and enabling locally-specific uptake, whilst facilitating a collaborative process of ongoing improvement of TOD implementation. There are two scoping processes involved in effective Framing: Contextualization, and Localization.
Promoting Transit Oriented Development at the Local Level 141
Contextualization Contextualisation refers to the identification of ‘Big Picture’Contextualisation refers to the identification of ‘Big Picture’ frameworks, guidelines, resources and procedural tools (i.e. top down ‘enabling structures’) associated with a project. In practice, contextualization appears deficient: there seems to be a lack of connectivity between various ‘enabling structures’ to streamline the translation of the ‘will’ for TOD projects into action. This creates considerable uncertainty amongst actors, as seen in the often deficient coordination of public transport and land use planning, or the relations of developers and associated development practitioners, and even amongst indirect participants, like lending institutions. The consequences of deficient contextualization include: decreased confidence levels of lending institutions to provide funding for TOD-related enterprises; extended time-frames associated with obtaining planning approvals; challenges in establishing informed, collaborative teams with a common understanding of the advantages, processes and procedures regarding the establishment of TOD initiatives; and not least in the ability of TOD projects on the ground to actually deliver on reductions in car trips and ownership due to superior conditions for non-car mobility and access.
Whilst it is beyond the direct authority of local governments to address some of the founding problems causing these issues, they can certainly take an active role in mitigating the consequences. This can occur, for example, through capacity building in public transport planning and advocacy (see later), or through specialist education of development professionals and other secondary stakeholders, or through more comprehensive regional collaborative mechanisms to facilitate transparency and responsiveness in the implementation process (Renne, 2005). Some local governments have begun establishing Sustainability Management Systems as an umbrella values framework with which all services undertaken by the authority must comply. This is a significant step in providing a uniform ethos-based approach across departments. Planning has a logical place within such a framework, and would appear to be a crucial component of it. The secondary advantage of establishing such a management system is its capacity for comparison through the understanding and recognition of common values and objectives across different tiers of government, with the potential to greatly enhance the connectivity of ‘enabling structures’ between both sectors and scales.
Localization Localization involves actively seeking the critical componentsLocalization involves actively seeking the critical components fashioning local character (collective wisdom, values, strengths and limitations), with the view to better harnessing locally appropriate resources, solutions and opportunities. At times, the fundamental components of localization are assumed rather than sought, resulting in ineffectual outcomes. For example, there is a broad belief amongst local government that the Australian people do not want the higher densities of TOD developments. This is unsubstantiated – either through quantitative research or through market indicators. In fact, there is a growing body of evidence that “[t]he cultural, social and economic structure of Australian society would appear poised to encompass the concept of Transit Oriented Developments into the mainstream of urban living” (Gilbert and Ginn, 2001, p33). This is partly
Transit Oriented Development142
due to a re-evaluation of personal and societal values through enhanced socio-ecological awareness, but also associated with the more pragmatic consequences of changing demographic, employment and leisure patterns (Morris and Kaufman, 1996). As such, demand for high density dwellings in pedestrian-friendly, mixed-use developments has far outstripped supply in recent years, causing inequitable prices and a shortage of affordable housing in such developments. Arguably, one of the most significant undertakings for local governments in this context is to open ongoing dialogue with their constituents, exploring and tracking local perceptions and values, needs and aspirations.
Blending
Blending involves merging the processes and tools identified through ‘Contextualization’ (i.e. ‘Big Picture’ support structures) which have been recognized as compatible with the skills, strengths and resources identified through the ‘Localization’ process. This is where the tools and guidelines become locally specific to the skills and resources of the target community, and where they inform potential opportunities for constructive growth and development.
Silos
We still seem to grapple with ‘silos’ mentalities and processes. This manifests itself, in part, in the paternalistic relationships which tend to evolve between development professionals and communities, or in the uneasy or non-existing collaborations between public transport agencies and land use planners. There is still a widespread attitude that ‘the professional knows best’, and that the community, if consulted at all, is not necessarily representative of a local area (as the participation process, unless consciously and carefully designed, is often ‘hijacked’ by special interest groups) (Hartz-Karp, 2004). In such cases, “[d]iscourse is divisive rather than collaborative, defensive rather than expansive”, and what emerges is a ‘fix that fails’: “Not only did we fail to resolve the original ‘problem’ – an issue we hoped would be resolved by civic engagement – but the ‘fix’, the consultation, has often exacerbated the problem” (ibid, p5). This silos mentality needs to change; the views of the wider community need to be sought, and valued, for their capacity for collective wisdom. It is a sustainability axiom that the wisdom of place informs the wisdom of authority (Edghill, 2007), which implies greater consideration and respect for community knowledge, particularly at the early stages of the development process when the opportunity to frame and influence development is highest.
Translation
After blending, the now locally specific process is identified in terms of social, cultural, economic and environmental opportunities, which can then be translated into plans for action. Local governments and development practitioners are more
Promoting Transit Oriented Development at the Local Level 143
aware than most of the impact of the built form to the ‘on the ground’ application of this principle. However, there is a tendency to view communities in terms of challenges to overcome, rather than opportunities to grasp. It is essential that local governments familiarize themselves with not only the philosophical and practical design advantages of TOD developments, but also of the socio-cultural, ecological and economic opportunities that stem from such designs. Actively encouraging cross-sectoral viability through a project, as opposed to simply meeting requisite mitigation objectives, requires a new way of thinking about ‘value’ and a new way of approaching development and development processes, such that the community can assess and avail itself of emerging opportunities.
Review
Like all learning processes, there must be scope for iterative review. The challenge is to establish a consistent evaluative framework. Ideally, this consistency would span local government agencies and be reflective of the various tiers of government. In Western Australia, there is an attempt to deal with this challenge: the state developed one of the first whole-of-government sustainability strategies (Government of WA, 2003), which has had a flow-on effect throughout not only the various tiers of government, but also on the business and community understanding of their role in sustainability. However, this is a new game; we are just beginning to learn how to implement ‘relevant consistency’ across the board, and we have a long way to go. Collaboratively developing evaluative sustainability frameworks is a significant step in the right direction, and there is much work being done in this field.
Case studies of local government action in influencing transit-oriented development
The role of local governments to bring about TOD, and to foster the necessary engagement with other stakeholders, public and private, is significant. The large number of actors and the steps of adaptive sustainability suggest that collaboration is of particular importance for transit-oriented development. A broad spectrum of individuals, organizations, and institutions with different goals, priorities and interests in outcomes usually seek to have a say in the process of making TOD a reality. For local governments this entails a multitude of possibilities, as well as challenges, for collaboration with other players such as with other local governments, with State Government, and with developers, public transport providers, retailers and residents (Cervero et al. 2004, Dittmar and Ohland 2004; Arrington, 2005).
The three case studies described here demonstrate the way in which the model for adaptive sustainability has been applied in practice to bring about positive opportunities. The first case looks at the way in which local governments have collaborated to effect change in strategic plan making. The second case looks at how state government and local government can cooperate to make TOD happen.
Transit Oriented Development144
The final case describes what a committed local government can achieve alone and in collaboration.
Engaging with strategic land use planning: Melbourne 2030 from the local level
In Melbourne during the mid-2000s, a roundtable of local governments known as the Metropolitan Transport Forum (MTF)1 assumed a critical role in formulating and building a consensus for sustainable transport policies at the metropolitan level, and exercised pressure on the State Government (which acts as the strategic planning authority for the metropolitan area) to take its own transport and land use priorities more seriously. In 2002, the Labour-led Victorian State Government released a new metropolitan strategy named Melbourne 2030 (DOI, 2002). The strategy addresses the needs of urban development over a period of three decades, during which it expects a population increase in metropolitan Melbourne of 1 million people, or more than 30 percent over the 2001 figure (ABS, 2002). The strategy aims to manage this growth by channelling urban fringe development into six designated growth areas contained by a legislated urban growth boundary, by identifying 115 existing activity centres to be subject to increased urban consolidation, and by setting a target to more than double the share of motorized trips by public transport between 2001 and 2020 (Buxton and Scheurer, 2007). Thus Melbourne 2030, on paper, embraces most of the key strategic planning elements in support of TOD.
A specific program known as Transit Cities was set up to facilitate collaboration between State Government, councils and the private sector on urban consolidation and place-making in selected rail-based activity centres. However, transport infrastructure priorities have remained skewed towards road over public transport investment, with a 2004 transport policy blueprint containing time and funding commitments for 90 km of urban freeways or tollways, but only for 12 km of rail or tram extensions (Government of Victoria, 2004). The institutional arrangements for public transport in Melbourne, with each of the three modes of train, tram and bus franchised to private operators and overseen by a regulating authority with limited influence on service planning, have so far had the effect of inhibiting large-scale network or service improvements designed for passenger growth on the scale anticipated in Melbourne 2030 (Mees et al, 2006). Rail extensions to serve the outer urban growth corridors and other gaps in the network have been progressively shelved, and the reality of new suburban development in those areas largely continues to follow a low-density, functionally segregated template with
1 MTF represents 18 out of 31 local governments in metropolitan Melbourne andMTF represents 18 out of 31 local governments in metropolitan Melbourne and is an advocacy group for councillors, local government transport planners and associated bodies including community, environment and local government organizations, transport companies, and participants from State Government Its mission is ‘to promote effective, efficient and equitable transport in metropolitan Melbourne by providing a forum for debate, research and policy development, and by disseminating information to improve transport choices’ (Scheurer et al, 2005, p33).
Promoting Transit Oriented Development at the Local Level 145
facilities located and designed around car access and only a marginal role for (bus-based) public transport (Goodman and Coote, 2007). Meanwhile in established areas, communities often remain unconvinced of the benefits of densification in activity centres, as public transport is perceived to be insufficiently prepared to absorb the growth in travel demand from additional residents, jobs and visitors. Development pressure in these areas, successfully defended on occasion in legal disputes by referring to the provisions in Melbourne 2030, left many councils struggling to elaborate a suitable local planning framework for their activity centres that would integrate such projects into a more holistic vision of these places.
Despite these shortfalls, however, an overwhelming majority of local councils in metropolitan Melbourne support the strategic directions of Melbourne 2030 and proceeded to reform their planning framework accordingly. However, councils were unable to take significant action, individually or collectively due to resource, capacity and institutional constraints, on the provision of better public transport services, and the larger-scale infrastructure improvements required for this purpose.
In late 2004, State Government released Linking Melbourne, a transport policy blueprint intended to detail the transport components derived from the policy directions of the Melbourne 2030 strategy (Government of Victoria, 2004). Linking Melbourne received a negative response in the public arena, particularly due to its heavy bias towards additional road investment over public transport (as mentioned above), which was widely regarded as counterproductive to the Melbourne 2030 goal of shifting mode share away from the car. It was further criticized for its narrow interpretation of the economic benefits of mobility, identified purely in terms of efficient movement of freight and commercial traffic while failing to recognize the vital role of traffic constraint, superior public transport access and place-making in creating successful hubs of economic activity, advocated for example in Florida (2002) and by Engwicht (1992). Linking Melbourne was also considered to be out of tune with the state of the international debate that had moved on from advocating to ‘solve congestion’ by expanding road capacity to more sophisticated approaches of influencing the interplay of land use and transport, and the behavioural and logistical determinants of transport users (Goodwin, 1998; Banister, 2002).
The MTF responded to the shortfalls of Linking Melbourne by publishing its own transport policy blueprint, ‘Most Liveable and Best Connected: The Economic Benefits of Investing in Public Transport in Melbourne’ (Scheurer et al, 2005). Comparing Melbourne with 13 other cities around the world that commonly score highly in liveability surveys (a status Melbourne takes considerable pride in), the report found that Melbourne’s public transport performance indicators (adapted from Kenworthy and Laube, 2001) were almost consistently among the poorest in the sample. A comprehensive case was made around how superior public transport was critical to serving Melbourne’s economic wealth, and a list of policy recommendations formulated including rail upgrades and extensions, broad network connectivity and service improvements, and a moratorium on further road expansion projects outside designated growth areas at the urban fringe.
Transit Oriented Development146
Prior to publication, in-principle endorsement for the content of the report was sought and obtained from a number of key organizations, including tacitly from several State Government agencies. Separate launches of transport policy statements by other advocacy groups were coordinated over a period stretching for several weeks. Melbourne’s broadsheet daily newspaper accompanied the launch of Most Liveable and Best Connected with a front-page headline, supportive editorial and an award-winning four-day series on public transport in Melbourne, initiating an ongoing, high-profile media campaign for transport policy reform that continues into the present (Silkstone, 2005; Millar, 2005; Silkstone and Millar, 2005). The State Transport Minister, though tangibly discomforted by the directions the campaign was taking, nonetheless honoured his earlier commitment to speak at the launch and engage with the debate (Batchelor, 2005). Almost overnight, the MTF had become a key player that was now setting rather than merely reacting to the transport policy agenda in Melbourne.
The State Government was now under considerable pressure to raise its game in transport, and prepared a further major transport policy statement released in May 2006 under the name of Meeting our Transport Challenges (State of Victoria, 2006). This document committed a further $10bn on transport investment in the state and for the first time, struck a relative balance between road and public transport funding. Critical capacity upgrades for the metropolitan rail system that has experienced rapid passenger growth in recent years, and the roll-out of an orbital bus system were the key infrastructure components; however, no rail extensions into growth areas within the next ten years were included, and no functional link between transport upgrades and urban development can be discerned in the document. Meanwhile, Meeting our Transport Challenges also called for an investigation into another potential tollway through Melbourne’s inner north (East-West link) which, if realized, would become by far the costliest single transport infrastructure project ever undertaken in Victoria. The inevitable public controversy surrounding a single such transport mega-project in Melbourne threatens to relegate the vital debate about how to improve the transport and land use interplay across the city to the sidelines. TOD thus runs the risk of descending from the status of a visionary blueprint for the future of urban growth – introduced, if imperfectly, in the Melbourne 2030 strategy – to a technical issue to be addressed by individual local governments with their State Government and private sector counterparts. This would all but eliminate the opportunity for blending the layers of contextualization and localization of policy making in the spirit of the Adaptive Sustainability template discussed earlier.
Cooperation between state and local government: Frankston, suburban Melbourne
The experience of Frankston in suburban Melbourne shows that cooperating with the state helps municipalities to get funding and to organize projects they would not be able to implement on their own. But it also shows that some areas are beyond the reach of an individual municipality. Located at the south-eastern edge
Promoting Transit Oriented Development at the Local Level 147
of the Melbourne metropolitan area and the eastern shore of Port Phillip Bay, Frankston is the terminus of the suburban train line carrying its name. Frankston was already a significant township before suburbanization filled the roughly 40 km distance to central Melbourne. At the heart of a municipality of about 110,000 inhabitants (ABS, 2002), the Frankston inner city acts as a gateway between Melbourne and the popular recreational areas of the Mornington Peninsula to its south. However, recent decades saw the town centre in decline, blighted by poorly designed and integrated commercial development unconnected to the nearby waterfront, insufficient residential uses, a lack of social and economic diversity, and sub-optimal public spaces that were widely perceived as unsafe.
In this situation, the Victorian Government’s Transit Cities program (see section above) represented a critical opportunity, and effectively the first serious attempt, to undertake comprehensive precinct planning in central Frankston. Frankston is one of the thirteen Transit Cities in the program, which led to the exploration of redevelopment scenarios that would reconnect the town centre with the bay, attract new educational and entertainment facilities around improved public spaces, and open up under-used land for new housing and businesses (Cox, 2005).
The Frankston city council worked together with the State in form of the Department of Sustainability and Environment (DSE) and the Department of Infrastructure (DOI), and also with developers, the business community and citizens (Figure 11.1). As example, the Frankston City Council and DSE jointly sponsored a design workshop where architecture teams were invited to develop planning proposals for a precinct at the bay (DSE, 2004). The workshop included a forum with community representatives and land owners, where the results of the community consultation were discussed. Another workshop was held for the Transit Interchange Precinct and several forums and displays were organized. This process led to the production of a structure plan for the Transit Cities precinct (Cox, 2005). Another example of cooperation is a Community Safety Centre jointly operated by the City Council and the Victorian Police opposite the train station to address safety concerns in the area. These projects present the framing and blending of the macro- and micro-approaches through Transit Cities.
figure 11.1 key actors for TOD in the two case studies
Transit Oriented Development148
However, despite the potential for additional patronage from the urban consolidation of the station precinct, to date the Frankston train line has not been subject to service improvements of any kind since the inception of the program, and while there have been physical improvements to the bus interchange at the station, the same holds true for the connecting bus services (though an improved orbital bus service to neighbouring regional centres has been announced for early 2008). So far the Transit Cities project in Frankston has been far more about the ‘City’ where a comprehensive revitalization strategy has been put together, than about ‘Transit’, where Frankston city council lacks formal influence on either State Government or the rail and bus operators to improve the level of service. Another issue for Frankston is the relative lack of a self-regenerating momentum for redevelopment (Van Boxtel, 2007), prompting the city to rethink how to intensify and redirect their collaboration with developers or other stakeholders to make it happen.
Thus the Frankston project has been successful in framing and blending the layers of contextualization and localization as far as the land use and place making components of the TOD program are concerned, but has so far failed to meaningfully integrate public transport service planning, and its actors, into this process. Possibly in parts as a consequence of this shortfall, it now also suffers from difficulties in translating the aspirations and directives of the successful collaborative elements into sufficient development and action to transform Frankston into a fully–fledged Transit City. Similar difficulties are experienced by the local council with the step of the iterative review where again a cooperation with the state is necessary. The state has commissioned a study with baseline data to monitor changes in Activity Centres (ACIL Tasman/Tract Consultants 2005), and Frankston is also developing indicators but no joint development of a review is happening so far.
Commitment and cooperation: Rheinbach, Germany
Rheinbach in North-Rhine Westphalia, Germany, exemplifies that a committed municipality, in cooperation with other stakeholders (Figure 11.1), can control urban development and how it is implemented, but also that a regional cooperation of municipalities can help TOD to emerge. Rheinbach lies about 20 km west of Bonn and 50 km south of Cologne, on the edge of the Eifel, a rural and popular recreation area. The city has about 26,000 inhabitants, a historic town centre and a variety of shopping, education and leisure facilities (Raetz 2005). A mixed-use neighbourhood was developed between 1999 and 2000 on former agricultural land at the back side of the train station, incorporating residential and commercial uses and a ‘university precinct’ (ILS/rak 2002). The project serves the goal of integrating the newly-founded University of Applied Sciences Rhein-Sieg as well as a business incubation and technology centre in a self-contained precinct (BMVBW/rak, undated).
Promoting Transit Oriented Development at the Local Level 149
The proximity to the university, the historic city centre and the railway station are essential quality features of the residential area, as nearly all important facilities can be reached on foot. The municipality aimed to integrate this ‘back side’ of the city better into the urbanized area and to offer attractive and affordable homes, in spite of high land prices in the region. Therefore, the city acquired the necessary properties at an early stage and zoned them for medium density (roughly 50 dwellings per gross hectare), with 20 row houses and 42 apartments (Raetz, 2006). In a small city like Rheinbach, this unusual density mix helped provide residences for lower income households. The other important aim for this precinct was to offer good pedestrian connections to the train station for residents, students and employees and thus to increase rail patronage (Prètsch et al, 2005). This development is an expression of the translation of local strengths and processes into opportunities.
The city pursued further avenues for increasing rail patronage by revaluating the station building, putting in a new station for a new development area, and by improving the frequency of the trains to every 15 minutes from and to Bonn at peak times. Rheinbach found a new investor for the station building who opened a restaurant and made it more vibrant (Raetz 2006). For the new station the city cooperated with the rail operator and convinced them to put the station in. To increase the frequency of the train service, an informal cooperation of councils in the region (Regionaler Arbeitskreis or rak) was instrumental, because together they had more influence and more possibilities to negotiate with the rail operator (Prètsch et al, 2005). These projects show the opportunities collaboration offers and also processes of framing and blending.
In elaborating a vision of regional development, rak was in a crucial role to promote the concept of urban development along rail lines (rak, 2007). Hence, the regional view and cooperation is as important for the emergence of TOD as the commitment of each municipality. The collaborative framework in this example allows for the adaptive sustainability stages of framing, blending and translation of contextualization and localization into a process of change that succeeds to integrate both the land use and transport service planning elements under local government leadership. For the review first steps can be seen in the vision of regional development elaborated by the rak.
Conclusion
Successful TOD programs need to embrace a series of steps in the policy making process, integrating the broader (state, national or international) policy context with the values, resources and opportunities that exist at the local level. Local governments have a critical role in facilitating the sequence of framing these elements and blending them into viable policies and plans jointly with communities, the private sector and decision makers at all levels. This can occur through direct collaborations or through efforts of advocacy and political pressure where bodies
Transit Oriented Development150
of greater authority are insufficiently responsive to local needs. Where successful, these efforts merge into the vital task of translating policy and plan into action on the ground, accompanied by a process of iterative review to fine-tune and continuously adjust policy directives to realities.
The comparison between the Melbourne, Frankston and Rheinbach case studies has highlighted the challenge to integrate the land use planning and place making components of TOD with the necessary public transport network and service improvements. In Melbourne, responsibility for both tasks is split between state government departments, and the privately owned public transport operators have no formal accountability to the local level of government. As a result, the Transit Cities program as collaboration between the State Government’s DSE, local government, community and private sector stakeholders lacks a formal lever to influence public transport service levels, which are the domain of the private operators under contract with the DOI. In North Rhine Westphalia, an informal collaboration of local governments was successful in negotiating with the rail operator, which acts under a tighter State Government planning authority regarding service standards than in Melbourne, to offer improved services and meet the increased public transport requirements of TOD in the region. It remains unclear whether a body such as the MTF can fulfil a similar role in the Melbourne context while the current franchising arrangements between DOI’s Public Transport Division and the public transport operators remain in place, and while the Transit Cities unit in DOI is not involved in the negotiation of those agreements.

PART IV Implementation: Community

This page has been left blank intentionally
Chapter 12
Transit Oriented For All: Delivering Mixed-Income Housing in Transit Served Neighbourhoods
Shelley Poticha1 and Jeff Wood
Introduction
As the market for TOD heats up and as government, development and business interests recognize its potential; there is an increasing danger that virtually all of the new development near transit could be unaffordable to lower income households. It is also probable that new or enhanced transit service could trigger considerable displacement in existing low-income and mixed-income neighbourhoods. This is because presently, for the most part, only luxury housing projects can afford to absorb the time, uncertainty and cost of risk inherent in building TOD in the United States. In many communities, TOD is not yet supported by appropriate zoning codes, which leads to lengthy and costly permitting processes and parking standards are higher than necessary. Both the time it takes for developers to get permits and the high parking requirements increase construction costs. Furthermore, the cost of land in and around existing and future transit stations is rising due to speculation or is broken into small parcels, making it difficult for developers to find sites that are large enough to economically produce high density housing that could keep prices down.
These are inhibiting the general TOD market are making it even harder to deliver mixed-income housing near these transit locations. Increased development costs surrounding transit stations make it difficult to produce projects that include lower-income households and build to the full spectrum of demand. Because of this, it is easiest for developers to respond to moderate and high-income market segments, as low-income households are not the only ones looking to live near transit. The Center for Transit-Oriented Development (CTOD) has found that while the demand for housing near transit in America is likely to more than double by the year 2030 to encompass roughly a quarter of all renters and buyers, 40 to 50 percent of this demand is likely to come from moderate and low-income households. More than half of this demand will come from singles and couples
1 This work would not have been possible without the help of several key partners: Mariia Zimmerman of Reconnecting America and Dena Belzer, Shanti Breznau, Robert Hickey and Abigail Thorne-Lyman of Strategic Economics.
Transit Oriented Development154
without children; aging baby boomers and young and childless professionals who prefer urban amenities to suburban space will continue to drive the housing market around transit stations (CTOD 2005). But as land near transit gets bought and locked away for housing targeted at the upper ends of the market, the window of opportunity for those that could benefit the most from the convenience and affordability of TOD may be lost.
This chapter frames the rationale for making mixed-income TOD in the U.S. a policy priority, summarizes the findings from three case studies, and identifies a series of strategies for practitioners seeking to ensure that transit-oriented development is available to all.
Joining forces: The synergies of mixed-income transit-oriented development2
Transit-oriented development and mixed-income neighbourhoods have clear benefits of their own. Transit-oriented neighbourhoods make transit ridership possible and convenient; in doing so, they help improve air quality and reduce regional traffic congestion. And, mixed-income neighbourhoods are an important component of neighbourhood revitalization: they can mean less crime, higher quality education, and better health for low-income residents, benefits that can resonate throughout the region and help all communities. Expanding transit-oriented neighbourhoods and developing mixed-income communities together reaps important new synergistic benefits for stakeholders, including: providing truly affordable housing, stabilizing high-percentage riders, broadening access to opportunity, and expanding the health benefits of TOD to all.
Providing truly affordable housing Transit use is less expensive than owningTransit use is less expensive than owning and driving a car, and mixed-use neighbourhoods further reduce transportation expenses by making it easier to walk to frequent destinations like schools, shops, and services. As a result, on average, households with access to good transit service spend 50 percent less on transportation expenses than other households. For very low-income households, who currently spend nearly two-thirds of their income on housing and transportation combined (see Figure 12.1), such savings can make a huge difference, offering them the possibility for genuine affordability.
Stabilizing high-percentage riders Lower-income households are less likely toLower-income households are less likely to own cars than other income segments and thus are more transit dependent (see
2 Portions of this work were published in two previous documents: Transit-Oriented For All, which was published jointly with the Great Communities Collaborative, the UC Berkeley Center for Community Innovation and the Center for Transit-Oriented Development, June 2007 and Realizing the Potential: Expanding Housing Opportunities Near Transit, published by Reconnecting America with support from US Department of Housing and Urban Development and the Federal Transit Administration.
Transit Oriented For All 155
Figure 12.2). In fact, in the U.S., almost two-thirds of all transit users live in households earning less than US$37,000 a year. As a result, increasing opportunities for lower income households to live near transit is one of the most cost-effective mechanisms for increasing and stabilizing transit ridership. Furthermore, since car-less households often use transit for non-work trips as well, low-income households also play a crucial role in filling seats during off-peak times, making transit services more efficient.
figure 12.1 Housing expenditure by neighbourhood typeSource: Centre for TOD Housing and Transportation Affordability Index, 2004 Bureau of Labor Statistics
Figure 12.2 Housing units with one or less vehicles, 2000: Transit zones vs. region
Transit Oriented Development156
Broadening access to opportunity Enhanced transit availability for low-incomeEnhanced transit availability for low-income households can increase their access to employment, education, and homeownership opportunities. Furthermore, employers in industries with the most diverse ranges of occupations tend to have the greatest preference for transit accessible locations (Strategic Economics 2006). Accordingly, opportunities to live near transit will be most useful for commuters in a range of income brackets, including lower-income households. Mixed-income transit-oriented neighbourhoods also enable a broader range of households to live in communities with well-funded schools, good city services, and access to a wide variety of jobs.
Finally, transit-accessible housing can help low- and moderate-income households achieve homeownership, one of the greatest wealth builders for Americans. The transportation cost savings of living in TODs makes it more possible for lower-income households to afford homeownership. Fannie Mae’s Location Efficient and Smart Commute Mortgages allow households living near transit to qualify for larger mortgages, enabling those otherwise on the edge of qualifying to make the move to homeownership. These two mortgage products allow consumers to qualify a larger portion of their income (35 percent vs. 30 percent) for housing expenditures based on the assumption that if they live in neighbourhoods with both walkable destinations and high quality transit service they will have more disposable income.
Extending the health benefits of TOD to all Transit-oriented communities’Transit-oriented communities’ characteristics, a diverse mix of land uses, close destinations, and accessible transit, are all highly correlated with multiple health benefits. Residents of such neighbourhoods have higher rates of physical activity, lower body mass indices, and reduced risk of respiratory ailments such as asthma due to better air quality (Frumkin and Jackson 2004). Those who live in less walkable neighbourhoods are more likely to be overweight or obese, which increases the likelihood of developing life threatening illnesses such as high blood pressure, high cholesterol, type 2 diabetes, heart disease and stroke. Lower-income households already have higher rates of obesity, as well as more barriers to physical activity and healthy food, factors that increase their risk of developing life-threatening illnesses (Frumkin and Jackson 2004). Including affordable TOD housing for lower-income households can better enable this at-risk demographic group to address obesity-related health problems. From a public health perspective, it is important that all households, regardless of income level, have the opportunity to reap the health benefits of living in a transit-oriented community.
Learning from case studies
There is no single effective approach to promoting mixed-income housing in neighbourhoods near transit. Rather, all stakeholders, including federal government, state government, regional government, local government, the community and
Transit Oriented For All 157
private-sector developers, are grappling with the challenges of simultaneously removing barriers to building mixed-use neighbourhoods where transit is convenient and ensuring that a full range of households can access the lifestyle and affordability benefits of TOD. Context is key, however. An honest assessment of local and regional market conditions, land availability, trends toward income diversity or segregation, the capacity of local for-profit and non-profit developers and specific regulatory barriers is a very important first step toward identifying the right mix of tools and strategies. Typical obstacles to building mixed-income TOD housing in the U.S. include:
Land prices around stations are high or increase because of speculation once a new transit line is announcedAffordable housing developers don’t have the capital to acquire land before the prices go up and then hold it until it’s ready to developFunding for building affordable housing is limitedMixed-income and mixed-use projects require complex financing structuresSites for TOD projects often require land assembly and rezoning, which can lead to lengthy acquisition and permitting processes, which increase development costsParking requirements for TOD are unnecessarily high, which also drives up costsCommunity opposition to density and affordable housing is hard to overcome.
Boston, Charlotte and Portland provide three informative case studies of communities hoping to make mixed-income TOD a priority.3 The geographic diversity of these case study regions and the differing levels of maturity of their transit systems provide insights regarding the market response to new transit investments, the challenges of preserving and creating mixed-income housing near transit, and the strategies for capturing the value creating by TOD to achieve community benefits. A host of innovative strategies is being tried in these three very different places, with varying degrees of success.
Boston
The Fairmount/Indigo Line case study corridor is a 9-mile commuter rail corridor serving a potential 88,881 residents or 30,169 households within the Transit Zone
3 The case studies presented here are summaries of more extensive analysis sponsored by a joint effort of the US Department of Housing and Urban Development and the Federal Transit Administration. Results for Realizing the Potential: Expanding Housing Opportunities Near Transit are posted at www.reconnectingamerica.org.
•
•
••
•
•
•
Transit Oriented Development158
figure 12.3 existing land use fairmont/Indigo line, Boston, MASource: Centre for TOD and City of Boston, 2006
Transit Oriented For All 159
(TZ).4 The current density is 18 dwelling units per acre (44.5 du/ha) (ha=2.47 acres). The corridor runs through low- and mixed-income communities (the median income in 1999 was US$35,252 in the TZ, $52,792 in region). The ridership in 2008 was 2,400/day. The service began in 1896 and a service upgrade is expected soon. The number of stations was decreased from 11 to 5 in the 1970s as the white population moved out and ridership declined. The Massachusetts Bay Transportation Authority (MBTA) now plans to build four new stations (see Figure 12.3), increase the frequency of service and make other infrastructure improvements. Less than 10 percent of regional residents commute by transit, which is more than double the national average of 4.6 percent, but below the average of 35 percent for metro regions with populations of more than 5 million.
The housing market The Boston region, as a whole, was a hot housing marketThe Boston region, as a whole, was a hot housing market as of early 2008 with almost half the housing stock as single-family, which is a high percentage in one of the nation’s highest-priced markets. From 2000 to 2005, home values increased 81 percent to US$394,800, and rising prices are blamed for continued population decline in the central core of the region.
Local policy and funding Massachusetts is a national leader in promoting mixed-Massachusetts is a national leader in promoting mixed-income TOD. There is significant coordination at all levels of government, even though state policy restrictions limit local decision-making power. The city and state both share the goal of increasing housing production, maintaining neighbourhood stability, and promoting development near transit. The state created a US$30 million TOD Infrastructure and Housing Support program, and new smart growth housing laws provide financial incentives for more compact housing. MBTA has an extensive inventory of land and air rights at stations, and partners with MassHousing, a state agency that works to increase affordable housing, to provide technical assistance and resources to TOD proponents. MassHousing provides US$100 million for mixed-income housing projects, with specific funds set aside for affordable projects near transit.
Development prospects There are limited redevelopment opportunities in theThere are limited redevelopment opportunities in the Fairmount/Indigo corridor, as the majority of underutilized sites are small, infill parcels, and the few large industrial sites are probably contaminated. While new stations could stimulate development of up to 5,000 new housing units this would fall far short of the projected demand. Moreover, developers are frustrated with the zoning and regulatory environment and it is clear that zoning is needed that mandates transit-supportive land uses. Developers lack certainty about what kind and how much development will be permitted, which adds time and cost to projects. MBTA, meanwhile, faces financial shortfalls limiting the agency’s ability to help out as a financial partner. But the size of the transit system is recognized
4 Transit Zone is defined as the ½-mile radius around all of the transit stops in the corridor.
Transit Oriented Development160
as one of the region’s most undervalued assets, and new stations will provide substantial development opportunity. Several well-established community development corporations (CDCs) are leading the campaign to improve the line and create mixed-income projects, and they are able to secure funding, leverage assets, and engage the community. Moreover, the corridor has not seen much market-rate development and affordable housing developers have been working with the MBTA, the state and the city to secure properties.
Lessons learned The State can be a powerful TOD partner. Creating a statewideThe State can be a powerful TOD partner. Creating a statewide TOD framework encourages greater regional coordination and levels the playing field between cities and suburbs. Strong brownfield legislation also provides funding and liability protection for non-responsible parties, and allows for-profit and non-profit entities to access assumable tax credits for redevelopment projects. And, coordinated deployment of state financial resources helps catalyze projects that might otherwise be challenged.
Community Development Corporations (CDCs) can play a critical role, especially with small sites. CDCs have a community base and access to outside funding, and their organizing experience can help allay concerns about density, traffic and gentrification. CDCs should be included in planning initiatives and given access to public resources and technical assistance.
It is important to create flexible affordable housing funds. In this case CDCs are the only developers that are used to assembling a patchwork quilt of funding sources, each with different requirements and timeframes, for a single project. Government should make these funds more flexible and accessible with limited application and reporting requirements.
Private sector interest is unlikely until zoning is revised. The lack of a clear vision or local land use regulations that are consistent with the principles of TOD adds time and uncertainty to a proposed project, a factor that few for-profit developers are willing to accept in a corridor with a weak market.
Affordable housing developers do not have the capital to land bank. Acquiring and holding land, also known as land banking, requires considerable capital, especially when it may be 5 to 10 years before a rail station is built. This presents steep holding costs for any developer, particularly non-profit developers that are most likely to produce below-market-rate housing. Furthermore, many traditional funding sources cannot be used to purchase land, whereas transit properties are increasingly reluctant to purchase excess land during project construction out of concerns that increased project costs can negatively affect their chances at federal funding.
Charlotte
The case study focuses on the South Corridor light rail line of 9-miles with 15 stations,opened in late 2007, which connects Charlotte’s Uptown neighbourhood to suburban Pineville. Existing housing stock along the line is low-density (6.7 dwelling units per acre or 16.5 d.u./ha), but most of the land near the transit line is occupied
Transit Oriented For All 161
figure 12.4 existing land use south Corridor/Blue Line, Charlotte, nCSource: Centre for TOD and Mecklenburg County, 2006
Transit Oriented Development162
by underutilized and obsolete commercial and industrial uses (see Figure 12.4). Ridership is estimated to be 9,100/day with 21,063 residents, 9,406 households in the TZ. The median income, 1999: $39,388 in TZ, $46,119 in region.
The housing market Charlotte’s sprawling, moderately priced housing market isCharlotte’s sprawling, moderately priced housing market is growing rapidly: 66 percent of homes are single family, with more than 17 percent built after 2000. This rapid increase in housing production appears to be constraining prices. From 2000 to 2005 prices increased just 8 percent to US$150,900, compared to a national average of 24 percent. The region is one of the nation’s fastest growing, and is expected to grow 57 percent to 848,539 households by 2030, 10 percent of which can be expected to want to live near transit.
Local policy and funding Charlotte and Mecklenburg County share jurisdiction,Charlotte and Mecklenburg County share jurisdiction, and the City manages the Charlotte Area Transportation System (CATS), which has enhanced the coordination of transportation and land use planning and initiatives. The City approved a comprehensive land use plan in 1998 to direct the region’s rapid growth by coordinating development with transit, and five new light rail lines and a modern streetcar line are planned. At present there is only a bus system, which carries a relatively low percentage (1 percent) of commuters. The comprehensive plan laid out a process for planning and implementing land use regulations and infrastructure improvements. Walking areas have been defined for the half-mile radius around stations, and station area plans, transit-supportive zoning, and “pedscapes” have been adopted in some neighbourhoods. The City developed transit-supportive overlays to begin transitioning other station areas to appropriate land uses, and is improving sidewalks, bike paths, medians, park and ride lots, and drainage around stations.
The City has created a TOD Response Team to assist developers in obtaining entitlements, necessary public improvements and financial assistance. The Charlotte-Mecklenburg Planning Commission has also been proactive with site-specific re-zonings for TOD in areas where station area plans have not been adopted. A South Corridor Land Acquisition Fund was created to enable public assembly of key opportunity sites; a critical tool for creating development opportunities at a scale that can be profitable and transformative.
Development prospects The City, County and CATS are all working to linkThe City, County and CATS are all working to link affordable housing to TOD, but it’s too early to assess their efforts. A fair-share housing policy limits the number of subsidized units to 10 percent in any “neighbourhood statistical area,” but an exception has been made allowing for 20 percent within a quarter mile of stations. The City and County are providing gap financing to help proposed projects score better in the competition for state affordable housing funds. But South Corridor neighbourhoods are higher-income than those along the Fairmount/Indigo line in Boston, with its long history of CDC involvement and support for affordable housing, and they don’t view affordable housing as an asset.
Transit Oriented For All 163
Transforming neighbourhoods along the South Corridor into walkable, multi-modal, mixed-use places will take time and require significant investments to improve connectivity, safety and neighbourhood character. These improvements could pull some of the momentum of the downtown housing market south along the corridor, but could also tap out funding otherwise available for affordable housing. The Uptown and South End neighbourhoods, where stations will be built, are complex urban environments with many uses, street networks and physical character. There are many large and underutilized industrial and commercial sites that will provide significant redevelopment opportunities. The City needs to preserve some commercial uses, however, to maintain a diverse and healthy economy.
The Charlotte light rail corridor is different from the other case study corridors in that there are so many large underutilized commercial and industrial properties around stations. The transit investment has the potential to catalyse new development, residential development in particular, on a scale that could transform the character and liveability of these neighbourhoods. Siting a transit line where there is a high potential for transit-supportive development, and then creating plans and tools intended to create and preserve income diversity will be a potent combination that can be adopted and adapted by other communities.
Lessons learned Transit can act as a tool for focusing growth and revitalizingTransit can act as a tool for focusing growth and revitalizing underutilized properties. Charlotte’s South Corridor is unusual, in that policy-makers deliberately chose an alignment with few existing residents or major destinations. Instead, the investment in light rail is seen as a tool to focus growth and create new neighbourhoods, while revitalizing an under-utilized part of the community. All the public partners have worked hard to create an integrated policy framework to support TOD and mixed-income housing using station area plans, zoning updates, the identification of critical infrastructure improvements, funds for those improvements and a revision of the city’s affordable housing policy.
City staff is organized effectively in interdepartmental teams to focus on all aspects of implementing TOD, from the provision of new streets and sidewalks, to the delivery of affordable housing. This approach provides prospective developers a clear point of entry to local government and a level of communication that is appropriate to address the complexities of TOD.
Planned growth corridors like the South Corridor require comprehensive implementation tools: The city and its partners have created important tools, including the voter-approved $50 million infrastructure bond to fund improvements in the corridor and the land acquisition fund; the TOD Response Team with dedicated staff; and a joint development program.
Portland
The case study corridor is a 3-mile streetcar line with 38 stops, which opened in 2001; two extensions, to Portland State University and to the South Waterfront redevelopment district (in 2006), have opened since (see Figure 12.5), and more
Transit Oriented Development164
Figure 12.5 Existing land use Downtown Streetcar, Portland, ORSource: Centre for TOD Housing and Metro, 2006
Transit Oriented For All 165
extensions are planned. The streetcar connects to the regional light rail transit system. Ridership was 7,783/day in 2005 drawing from 30,731 resident or 19,555 households in the TZ. Dwelling density averages 39 dwelling units per acre (96.3 d.u./ha). The median income in 1999 was US$27,921 in the TZ, US$46,090 in the region. Regional transit usage by commuters in transit zones is almost 14 percent, and an additional 4 percent of work trips are made by bicycle or on foot, well above the national average of 2.4 percent.
The housing market Portland is a moderately growing housing market; 63Portland is a moderately growing housing market; 63 percent of housing units are single family, with 10.5 percent built in 2000 or later. The growth in housing units combined with the increasing attractiveness and high median incomes in the region have put pressure on prices, which rose 22 percent between 2000 and 2005 to US$228,400, higher than the national average. The region is expected to grow 54 percent, from 741,776 to 1.15 million households in 2030, with 27 percent expected to want to live near transit.
Local policy and funding The City and Metro, which is the regional government,The City and Metro, which is the regional government, together with TriMet, the regional transit agency, are often cited for their innovative and comprehensive approach to promoting TOD and transportation alternatives, including a modern streetcar and aerial tram. The state also supports TOD by authorizing tax abatements to provide additional incentives. TriMet plays an active role in acquiring land and establishing development criteria through its joint development authority. All visioning and planning are done with significant community input, and the private sector has been instrumental in implementing the vision of an environmentally and socially sustainable region.
Development prospects Approximately US$2.3 billion in development hasApproximately US$2.3 billion in development has occurred along the streetcar line in the Pearl District, a substantial return on the US$52 million transit project, and another new neighbourhood called South Waterfront is being developed on underutilized industrial land that is also connected to downtown by the streetcar. Once an abandoned rail yard on the river near downtown, the Pearl is now home to a vibrant mix of uses including 7,000 residential units, 25 percent of which are affordable. The 1998 Central City plan introduced the idea of redeveloping these two large parcels into high-density mixed-use neighbourhoods served by the streetcar. Both were established as urban renewal areas, and a local improvement district assessed non-owner-occupied residences to help pay for the streetcar and other improvements. The Central City plan was reinforced by both regional and state land-use policies, as well as continued investment in pedestrian, bicycle and transit infrastructure. It was also supported by political leaders, powerful neighbourhood associations and civic-minded developers. Given the industrial nature of the rail yards and the large parcels of land, the Pearl lacked even the most basic infrastructure necessary to accommodate residential development. Moreover, the property was contaminated, creating delays and additional costs, which were eventually recovered from the former landowners.
Transit Oriented Development166
The Portland Development Commission (PDC), the city’s urban renewal, housing and economic development agency, was the conduit for millions of dollars of public investment in the Pearl and South Waterfront, and used development agreements to leverage public objectives like affordability, parks and density. The PDC, which had no financial resources to bring to the table, negotiated a deal with Hoyt Street Properties, the single largest landowner, that centred on the City making two improvements: The City would remove an overhead ramp that ran through the middle of Hoyt Street’s 40 acres, rendering adjacent land un-developable, if the developer would commit to building a minimum of 87 dwelling units per acre (214.9 du/ha). The City also agreed to choose a streetcar alignment adjacent to Hoyt Street’s property if density were further increased to 109 dua (269.2 du/ha) . Density was boosted to 131 dua (323.6 du/ha) when the City completed a park on land donated by the developer. The developer also contributed nearly US$1 million to the City and local improvement district, donated other rights of way, and agreed to meet the City’s affordability requirements. These densities would not have been possible without the streetcar because developers would have had to provide significantly more parking. Most projects in TZs are parked at much lower ratios than elsewhere in the region, which would have dramatically increased the cost of development and reduced the number of housing units.
The large single-owner parcels provided major development opportunities, whole new neighbourhoods were being built, allowing for the creation of a very different urban environment. Prior to the streetcar there was very little housing downtown and high-quality high-density development and the lifestyle it supports were unknown in Portland. The pent-up demand for higher-density housing near transit coincided with demographic changes across the country resulting in smaller, older, more diverse households, boosting the market for urban housing. Moreover, because there were no existing residents, there was no community opposition.
Hoyt Street Properties and the City had acquired large portions of the rail yard prior to the escalation in value that typically accompanies up-zoning. This increased value helped pay for infrastructure and amenities through the use of tax-increment financing. Hoyt Street developer Homer Williams had mostly done single-family projects before the Pearl, and he took on significant risk for this unproven housing product. Williams is now a key owner and developer in South Waterfront.
Lessons learned A TOD framework is critical. Having a clear plan, the CentralA TOD framework is critical. Having a clear plan, the Central City Plan, and appropriate zoning was critical for negotiations, implementation and successful place-making. Flexibility is key. Market changes and unexpected costs resulted in a different scenario than originally planned in the Pearl District. Flexibility is necessary to enable the developer to profit. A broad range of uses was allowed, though buildings had to respond to design standards.
Development agreements are an important value capture tool. Large parcels can provide for whole new higher-density transit-oriented urban neighbourhoods. Significant public investment may be needed, but it provides an opportunity
Transit Oriented For All 167
for public-private partnerships. Comprehensive agreements outlining the responsibilities of all parties are effective for complex large-scale public-private partnerships and help pay for infrastructure, affordable housing and other amenities in return for entitlements and public support.
Different tools are required for different redevelopment opportunities. The development agreement is an effective tool for large parcels but not for built-out areas with small infill parcels since there are numerous property owners with sites that may or may not be contiguous.
Inclusionary zoning, a commonly used program that requires developers to set aside a minimum percentage of housing units in a particular project for low and/or moderate income residents, is not the only tool for affordable housing. Portland used development agreements, and set a goal of building the same percentage of affordable units as existed citywide. The mix of affordable units is re-evaluated at each phase of the project.
Value capture strategies should fund an array of benefits. A variety of community benefits besides affordability are necessary to make a neighbourhood work. The goal of affordability must be balanced with the need for open space, transit, density (where it involves more market risk), and other public amenities. Community input is required to determine the best balance.
It is important to create equal opportunity for developers: Tax abatements are another powerful tool to shape development. Incentives should be available to both for-profit and non-profit developers to stimulate the production of affordable housing.
Moving forward: Proactive strategies for mixed-income TOD
Strategy 1: Build public leadership
An overarching observation from the case studies is that better coordination of housing and transportation policies is needed. Transit investments and housing markets are influenced at the corridor level, whereas housing and transportation policies are often made at the state and regional levels. Given the different scales of investment and policy decisions, transportation and housing needs to be more closely aligned. While transit agencies are not responsible for local land use or regional housing policies, transit investments should be closely coordinated with each.
Strategy 2: Assess the context for mixed-income TOD
Mixed-income TOD can occur in different contexts. But the challenges and tools associated with achieving mixed-income TOD vary considerably from setting to setting. Ultimately, identifying the right tools for each setting depends on assessing factors such as:
Transit Oriented Development168
Neighbourhood and housing stock characteristics – What is the proportion of renters to homeowners? The quality and age of the housing stock? Is permanent affordable housing available nearby?The nature of development opportunities – How close is it to the transit station? Are parcels underutilized or vacant? What is the size of available parcels?Local, corridor and regional real estate market conditions – Are local sales price trends the same as or different from regional patterns? Is there high turnover activity? What types of housing opportunities are available at other stations along the corridor?The neighbourhood’s relationship to its region – How close are employment centres?Transit station area land use patterns – Is there a healthy and appropriate mix of uses in the station area? What is missing or could add to the quality of life of residents?The dynamics of neighbourhood change – Is the community becoming more or less segregated? At what rate is change occurring?
Strategy 3: Think comprehensively about the transit district
It is important to think about TOD as a District, not just a Development. New development will impact the half-mile-radius district surrounding a station. What will its impact be? How will new housing relate to the old? Are there social seams in place that could create opportunities for integration? To create truly successful mixed-income TODs, the entire neighbourhood must be considered.
Strategy 4: Think comprehensively about housing affordability
Affordable housing in TODs can be provided in a variety of ways, such as:
Constructing new housing, either mixed-income or stand-alone affordable.Providing regulatory assistance (e.g. lower parking requirements) and/or financial assistance (e.g. land acquisition support) for developers to help reduce the high costs of building affordable housing.Acquiring low-priced housing and making it permanently affordable.Developing programs that induce greater private investment in preserving existing affordable housing (e.g. code enforcement, targeted home improvement loans).Changing policies to protect or permit a diversity of housing unit types.Providing assistance to help households afford housing (e.g. location-efficient mortgages).
•
•
•
•
•
•
•
•
••
••
Transit Oriented For All 169
Strategy 5: Encourage public-private partnerships
In Boston, a group of four community development corporations have come together to advocate for improved transit service and affordable housing within the Fairmount/Indigo Line. The CDC collaborative is partnering with the City, MBTA and MassHousing to try and achieve results. In Portland, local for-profit developers were early leaders in creating an urban, infill market located near the proposed streetcar alignment. Their leadership and financial commitment, and willingness to try a new market product yielded substantial benefits to the developer and to the public. Business and community leaders also were instrumental in getting the Portland streetcar funded and constructed. A flexible strategy for working with for-profit and non-profit developers can often be the difference between success and failure.
Strategy 6: Be proactive
A recent study by CTOD and the Ford Foundation (2006) found that neighbourhoods within walking distance of transit already support more racial and economic diversity than the average census tract, and that they are home to a greater share of a region’s lower-income households. But as the demand increases and the market heats up for land and housing in these neighbourhoods, the threats of gentrification and displacement of lower-income households is very real. Creating permanently affordable housing units is the most critical step, but many places are ripe for new mixed-income housing. Early planning allows a community to develop the tools needed to remain inclusive before new transit investment and other development begins to affect the market and constrain choices.

This page has been left blank intentionally
Chapter 13
There Goes the Neighbourhood? Or Saving the World? Community Views about Transit
Orientated DevelopmentJanet Rice
Introduction
Planners and activists who support transit orientated development (TOD) are ardent proponents because of its social and environmental benefits. Yet changes to people’s hometowns arouse great passions and can face substantial opposition. This chapter outlines the range of views that people have about TOD, from strongly supportive to determinedly against and explores in three cases studies (Figure 13.1), some of the underlying reasons as to why people hold these views. The chapter concludes by proposing some ways forward to build community support for TOD.
I want to start with three admissions. Firstly, this chapter is based on my observations and interpretations of how people feel about higher density development that is in someway connected to public transport, rather than documented research. It’s supported by many discussions I’ve had over many years with a wide range of people, but I’m the first to acknowledge that it’s not definitive. Secondly the observations are based in Melbourne. I’ve lived there all my life, all my professional work and community activity has taken place in Melbourne. Take from this what you will about how these observations pertain to communities in other parts of Australia, or the rest of the world. Thirdly, this piece reflects my background as an activist for a better world, and a politician, in the nicest possible sense of the word. I’m not an academic, nor a public servant or bureaucrat. I’m subjective and biased. I support the concepts of TOD; I think the environmental and social benefits far outweigh the social impacts. My outlook in life is one of embracing change, of being flexible and enjoying the possibilities that change brings, in the context of a driving passion for environmental sustainability and social justice.
What do I mean by TOD?
I use the term broadly, as meaning higher density development which is associated with public transport nodes. TOD is at the core of the plan for the development of metropolitan Melbourne, Melbourne 2030. (DOI, 2002; see also chapter 11). This
Transit Oriented Development172
figure 13.1 Location of case studies in Melbourne
There Goes the Neighbourhood? Or Saving the World? 173
plans for a more compact city, better management of metropolitan growth and better transport links.
The Victorian government states that Melbourne 2030 will deliver high quality activity centres that are easy to reach and serve the whole community; more community services in and around shopping centres, and more new housing close to services and public transport. Melbourne 2030 states that new fringe development will be confined to specified growth areas that are well-served by public transport and where community services are carefully planned and staged. These activity centres are identified as neighbourhood activity centres, major activity centres and principle activity centres in ascending order. There are 25 Principal Activity Centres across metropolitan Melbourne. Nine of the principal activity centres are identified as transit cities, which are defined as ‘regional cities and suburbs that are important in managing Melbourne’s future population growth and the demand on housing and transport’. Transit cities are planned to help meet a growing demand for higher-density housing … [and]… create diverse housing choices close to a wide range of transport options, and give people more ways to get around (DPCD, 2007)
Who likes TOD and why?
My observations are that TOD is supported by people who appreciate that it:
Reduces reliance on cars, which has substantial environmental and social benefitsImproves the viability of public transport and so facilitates the provision of better public transport services Enables a more compact city, providing housing and development opportunities without adding to city sprawl. Enables more affordable housing. A basic apartment in an activity centre takes up less land and should be able to be provided more economically than an outer suburban greenfields developmentCreates more activity and vibrancy and community life in a centre by having more people living closer together, who are walking, cycling, catching public transport and generally interacting with each other much more than if they lived further apart.Improves the economic viability of businesses in the centre by creating a bigger market with easy access for their productsCan revitalize older centres and shopping strips that have struggled to compete with car based shopping mallsBrings new development to replace areas which are perceived as being old and rundownAllows for more intensive development that would otherwise be considered as inappropriate if it was car dependent.
•
•
•
•
•
•
•
•
•
Transit Oriented Development174
Critically, to support implementation of TOD in practice not just theory TOD supporters also need to be convinced that the development sites either have adequate levels of public transport or they trust that public transport will be improved as the development is built to make it competitive with the car.
Support for TOD fits in with a broader concern about sustainable lifestyles, the future and others, and a concern about social justice and equity issues, as TOD enables the young, elderly, poor and disabled to access services where services are clustered together and served by efficient public transport.
TOD supporters can also be characterized as people who have a strong sense of community and who are happy to interact with a wide cross section of community, embracing diversity, including multicultural and socio-economic diversity. They are not threatened by difference, and are happy to live in places that have a rawer edge to them than what can be homogenous car based residential and commercial developments.
TOD supporters will generally embrace change, accepting that cities are living, breathing dynamic places.
These motivations can come together in some communities to create very strong levels of support for TOD. A good illustration of this is Footscray, as discussed below.
Example 1: Footscray
Footscray is 6km west of Melbourne. It was originally closely settled and working class, with a strong sense of community and belonging. People looked after each other when times were tough which they often were. It has been home to wave after wave of migrants from the Greek, Italian and Slavic communities of post World War 2, Vietnamese refugees and migrants through the 1970s and 1980s and ongoing, to refugees and settlers from Ethiopia, Eritrea and Sudan over the last decade. Today almost half the population speak a language other than English at home.
After settlement Footscray developed as a centre of manufacturing and heavy and some noxious industries, so began life as a not very desirable address. Although only 6km from the city it missed out on the gentrification of the 1970’s and 1980’s of the rest of inner city Melbourne largely because it is separated from Melbourne CBD by the Port, railway yards and port related transport industry. There are relatively high levels of public housing in Footscray which house low income earners, people with chronic social and health disabilities and new settlers to Australia. Compared to the Melbourne metropolitan average, a greater proportion of Footscray residents struggle with a range of social problems including illicit and licit drug use, gambling addiction and mental illness (Maribyrnong City Council, 2002).
In general the people that choose to live in Footscray are not people that value what is trendy and smart – they are people that value the community, the diversity, the good value of life here, the public transport, and accessibility. They know they are living in an inner city ‘edgy’ environment, and know that life around them will often be interesting! The vision for Footscray that Maribyrnong Council developed
There Goes the Neighbourhood? Or Saving the World? 175
after extensive community engagement was that Footscray would be ‘safe, artsy, edgy, affordable, regional, diverse/mixed and multicultural’ (Maribyrnong City Council, 2005).
Footscray is now experiencing significant gentrification, as real estate prices reflect the desirability of period housing in established communities with established infrastructure close to the city. However people who aspire to live somewhere ‘nice’ still largely prefer to live elsewhere!
Footscray is at the junction of three rail lines and has a tram line and 13 bus routes servicing it, a very rich public transport infrastructure. 2001 Census statistics showed public transport use is relatively high compared to the Melbourne average (20 percent of journey to work trips) and 25 percent of households do not own a car (Maribyrnong City Council, 2007). It is a designated Transit City under Melbourne 2030.
The Footscray shopping centre is large, spread beyond a core of 4 streets. Its size reflects its past as the regional shopping centre for the western suburbs of Melbourne, prior to car based shopping malls, particularly Highpoint Shopping Centre. Footscray’s retail strength is its multicultural vibrancy which includes a thriving Asian shopping hub and growing numbers of African businesses. Highpoint is the second largest shopping mall in Melbourne. It was established in the mid 1970s, it’s huge and still growing, has thousands of car parking spaces surrounding it, and is 4km from Footscray.
So as a site for Transit orientated development, Footscray pretty much has everything going for it, scoring highly in the TOD supporter’s belief system:
Sustainable transport: Footscray already has a rich public transport infrastructure and substantial numbers of people who don’t rely on cars, so there is a significant proportion of the population who know that reduced reliance on cars is possible. The environment in which they live is already closely settled, and so the increasing density of TOD is also more likely to be acceptable, as long as it is well designed, high quality and environmentally sustainable.More sustainable and just environment and society: The local community includes significant numbers of people concerned about the quality of life of others, and people in the community who are more disadvantaged; don’t have access to private cars and for whom high quality public transport is an important element of social inclusion and support.Community: There is already a lively diverse community and people value and celebrate that. Most members of the community are not fearful of newcomers.Economic development: Footscray is struggling economically. It needs an injection of resources. It has the land available for residential development– as the shopping centre is too big for its current use and large areas of railway owned land around the station that is currently used for vast expanses of car parking. Critically there is acceptance of change; most people think that the
•
•
•
•
Transit Oriented Development176
physical environment could well benefit from an injection of new development, as long as the significant heritage values of the centre are maintained.
There have been two 5 storey apartment buildings and a six storey student housing development built in Footscray in recent years with very little fuss. There was more concern about an earlier ten storey apartment building because of its height and potential overlooking of nearby single storey residential properties. A four storey block of student apartments was also more controversial because it abuts an existing low rise residential precinct and has very little parking provided. Work is about to start on an eight storey affordable housing development, with no parking provided for the residential units. This planning application had only two objectors. Over AUD$200 million worth of further development, mostly of five to eight storey commercial and residential developments have been given planning approval by Council over the last 5 years. Council has developed a ‘heights policy’ across the business district which identifies the parts of the centre where taller buildings will be welcomed, and other areas where heritage values and potential impacts on neighbouring low rise residential properties mean development will be more constrained. Under these conditions most people don’t have problems with ongoing high density development, though there is considerable debate about the amount of car parking which should be provided for such developments.
A recent success is the commitment from the state government to invest in a major upgrade of Footscray station and surrounds, and to facilitate private sector investment. However what is still required is significant improvements to public transport services, particularly the frequency and speed of bus services, and frequency of rail services to nearby areas. It’s all very well having a transit city at Footscray but if people who live two stations away in Yarraville are expected to choose to catch the train to Footscray then a better service than every 20 minutes during the day and every 30 minutes after 8pm is needed.
Who doesn’t like TOD and why
Like those who support TOD the motivations of TOD ‘resisters’ are many, depending upon circumstance and locality specific issues. The concerns people have about TOD include:
Dislike of change, and the closer to home the change is occurring, the stronger the passion. This fear or dislike of change may simply be based on a feeling that TOD developments don’t belong in the area, with existing residents liking things the way they are. Fear of impact on their amenity and their lives.Loss of place and heritage and neighbourhood character, changes to things they value, and find comforting which give them a sense of a connection with an area and/or the past.
•
••
There Goes the Neighbourhood? Or Saving the World? 177
Fear of traffic and parking chaos, either because they don’t believe that the public transport improvements will happen or even if they do that people won’t use the service.Concern about the development of natural environments, or in the case of ‘brownfields’ sites places that could be rehabilitated to have natural, recreational or open space value.Psychological attachment to the low density, high car use lifestyle. People feel that having a big house on a big block is what they aspire to and what they feel embodies a high quality desirable neighbourhood. Many people also have a psychological and cultural attachment to cars, and a belief that high status equals a car. If people think they have bought into a lifestyle of ‘big house, big block, open space and wide open roads’ then TOD doesn’t fit!Cynicism that TOD is just about developers making a lot of money at their community’s expense.
People who are concerned about TOD may not have an understanding of what TOD is trying to achieve, or may place low value and importance of the benefits of TOD, or are sceptical that the benefits will actually occur. There may be an allied lack of understanding that not everyone feels the same way, and a lack of belief that people can live lives where cars are not central to ones identity and being.
In summary TOD resisters feel strongly about keeping the status quo of place and people. They wish to protect their home from challenging impacts, which may include new different people, or living closer together than is desirable. This may reflect a desire to be able to control interactions with other people by only interacting with people that one chooses to interact with rather than enjoying spontaneous interactions with the whole diversity of society. They also value their car culture, particularly the individual freedom of car travel and allied scepticism of the value of public transport.
Some TOD resisters may see TOD as a Trojan horse. They may well be people who would otherwise value TOD and like living in such urban environments, but they don’t believe that that’s what they are going to get. They don’t believe the improvements in public transport services are going to be sufficient to get people to substantially reduce their car use and so TOD is just an excuse for higher density development that otherwise wouldn’t have been permitted to occur.
It’s not necessary to have all or even most of these concerns to create quite an aversion to TOD, usually one on its own is quite sufficient! Here are two examples.
Example 2: Camberwell – keep the status quo
In 2004 actors Barry Humphries and Geoffrey Rush protested along with 1000 others about a proposed development on the railway owned car park next to Camberwell station. Camberwell is a highly desirable inner eastern suburb of
•
•
•
•

Transit Oriented Development178
Melbourne, which features large period homes on large blocks on tree-lined streets. In general people live in and move to Camberwell because they like the comfortable, established lifestyle that it offers. Barry wrote a poem (in the voice of a planner) for the rally, and made headline news,
Now that several years have passed since the ministry’s eye fell, On that sleepy little suburb that is known as Camberwell… So they asked a kind developer to help them save their skin, ….But we struck a bugger of a problem – the residents found out. (The Age, 2004a)
Humphries was quoted in the article in The Melbourne ‘Age’ newspaper where this poem was reprinted as saying “I like Melbourne the way it is. Why spoil it?” “Camberwell is my spiritual resting place.” Geoffrey Rush, who lives near the station, dubbed the likely impact of VicTrack’s development proposal “Godzilla’s footprint”, with “all the character and charm of mid-1960s ‘box’ architecture”. Rush feels that Melbourne 2030, is “a little driven by the crassness of developers’ ideas” and “will fundamentally alter the tone and character of Melbourne in a way that I don’t believe people are quite aware of”. He fears the death of “that hidden, quiet, beautiful city aesthetic”. Rush stated that high-rise living was not “Melbourne’s tone” and “not very Camberwell” (The Age, 2004b).
Mary Drost, the vice-president of the Boroondara Residents’ Action Group, said the site was not suitable for residential development. She said a five-storey building would block city views, dominate the historic station and result in a loss of open space. “The huge thing would absolutely swamp the poor little station down there,” Ms Drost said. “We are so opposed to it, it’s just unbelievable” (The Age, 2004c) Boroondara Mayor Jack Wegman said “I think it would detract from the heritage qualities of the area” (op. cit.).
The protests about this development have been largely based on a desire to keep the status quo of a highly valued place. The community’s concerns were exacerbated by initial inadequate consultation, and that the first design presented for the development was not sympathetic to the heritage listed station next door. Traffic impacts have also been identified as an issue. Camberwell residents have high rates of car ownership and use. However Camberwell is identified as a Principal Activity Centre for good reason, with trains every 5 minutes in peak and every 15 minutes out of peak, a tram service with a 10 minute frequency and a cross-suburban bus service (but that’s a classic Melbourne bus service, it runs every half hour during peak, every hour out of peak, and finishes running at 6pm).
A year after the rally that Barry Humphries attended, the local Council considered and did not support a revised proposal for a five storey residential and commercial development. Two and a half years on, a new design for the site including two 6 and 7 storey buildings is about to be considered by Council, with the developer confident they “have it right this time, having responded to heritage concerns, with buildings redesigned to protect views of the station ” (The
There Goes the Neighbourhood? Or Saving the World? 179
Age, 2007). But Boroondara Residents Action Group spokeswoman Mary Drost said she was “absolutely appalled” with the latest plan. “This is worse than we expected,” Ms Drost said. “Apart from a small strip of land near the station, the entire site will be covered in buildings and the ambience of Camberwell will be destroyed forever” (op cit).
Example 3: Sydenham – protecting low density spaces, car culture and public transport scepticism
Sydenham is an outer suburban new development area. It’s the fastest growing suburb in the Brimbank municipality, with 34,000 people living in the locality. The housing developments of Sydenham are classic low density outer suburban archetypes, with densities of just under four dwellings per hectare. It is one of the ‘end of the line’ Transit Cities identified under Melbourne 2030. Sydenham station is adjacent to Watergardens Shopping Centre. Car ownership is high (1.6 cars per household) and public transport use at under 7 percent of journeys to work lower than the Melbourne average (DSE, undated).
Brimbank Council and the Department of Sustainability and Environment (DSE) proposed a draft Masterplan for the Sydenham Transit City area in August 2004. The Masterplan proposes medium and high density development within 400m of the station and shopping centre, although it notes that “apartment living is a relatively new concept for Brimbank and that the demand for apartments is likely to remain small for the foreseeable future” (Brimbank City Council, 2005b).
The draft Masterplan was not well received. After a public outcry during the formal consultation period for the Masterplan, Council commissioned a more detailed consultative study (Brimbank City Council, 2005a). The outcomes of this study were very clear, and highly instructive for anyone considering superimposing or retrofitting TOD in new low density growth areas. People did not think the medium-high density TOD concepts outlined in the Masterplan fitted with what they understood their neighbourhoods to be. They felt that the type of development outlined in the Masterplan would exacerbate the problems they already perceived as existing in their suburb, including the lack of physical and social infrastructure.
People were also unhappy with the consultation process itself, which to that stage had consisted of a questionnaire to residents and two consultation meetings. Many people felt that there had not been adequate consultation with the community prior to developing the plans, and not enough adequate consultation since the release of the plans. The study authors commented that this caused anxiety in the community and subsequent loss of faith in the process, and in government at both local and state levels.
The issue of gravest concern amongst the community was fear that medium/high density housing would negatively impact on neighbouring residents for reasons including loss of privacy; attracting undesirable people to the neighbourhood and creating a future slum area, loss of value of existing houses, unattractive design of
Transit Oriented Development180
units/town-houses, incompatibility with the existing suburb design and increasing traffic congestion. Comments included:
I wouldn’t live in a town centre. I like privacy. I like to make noise when I want too.More people, more neighbourhood problems.No units – they attract riff-raff, drugs, road hoons, people who do ‘runners’, robberies. We came here to get away from that.Units are untidy damn things. They don’t mow their lawns. They let anybody rent them.My house will be worth nothing if all those flats get built.Multistory places are really ugly, drab. The architecture is really bad. Why can’t they make them more attractive? More like homes. More like the other houses in the streetStick units in the city where they belongWe lose the identity of our suburbs when units are built.Why do we need high levels of immigration, perhaps we could preserve the single dwelling way of life with a smaller population.More housing equals more cars. Most homes have two cars.Most people have to drive their kids to school. I feel sad for younger families in this area. It takes half an hour to take kids to schoolWe’re moving out of the area because of the traffic. I wouldn’t want to raise kids here because of the traffic.More car parking is required. Current parking spaces at shopping centre and station are not enough. (Brimbank City Council, 2005a).
Public transport was already seen as inadequate. Trains were reported to be over-crowded, and both bus and trains were considered to be too infrequent.
Can’t go from here to Laverton or Broadmeadows by train, have to go into the city and out again. It’s stupid.If they want to encourage people to use PT why don’t they improve the service, need a 20 minute service and the railway station is windy and not at all friendly.More buses would be good – I walk half an hour to the station.Bus takes a long time. It goes through every suburb to get to Moonee Ponds. They’re encouraging people to use PT but it’s just not adequate.Would like to use public transport but it’s too hard.You have to get in a car to do everything, shopping, taking the kids to school (otherwise they have to cross a freeway).Upgrade PT first before building more. (Brimbank City Council, 2005a).
Many people expressed concern that infrastructure, social and leisure services had already failed to keep up with the growing population in the area, and consequently
•
••
•
••
•••
••
•
•
•
•
••
••
•
There Goes the Neighbourhood? Or Saving the World? 181
there was a lack of confidence that this trend would be reversed in the foreseeable future.
There is no benefit in being a Transit City. It doesn’t address social needs/issues.Taylors Lakes is very under serviced. Social services almost don’t exist.We need a social plan.Increased population needs increased social services and infrastructure.
People’s concerns relate to both higher density development in itself and also to the lifestyle that they thought they knew what they were buying in to when they moved to Sydenham. They may have been driven to move here because it was where they could afford, but they value the wide open spaces and the big blocks, and are fearful of what higher density means, who might it attract, how will it change people’s perception’s of their wide open ‘natural’ suburban landscape. They like their new house, and they like their cars. They don’t want to be too close to the neighbours. How many are sufferers of ‘affluenza’ to quote Hamilton and Dennis of the Australia Institute, where people have a deep association between the acquisition of goods and a sense of self–worth. Their cars are likely to be significant contributors to their self image: ‘the interface between the self and the world, the bridge between who we actually are and who we want to be seen to be’ (Hamilton and Denniss, 2005). When people’s experience of already inadequate infrastructure is added to this underlying level of suspicion about higher density development then a potent combination is created.
The Sydenham Transit City Masterplan was adopted in September 2005, with some modifications. Council made an acknowledgement that ‘medium to high density housing in the Transit City area is a major concern for local residents’, and made a ‘commitment to protect existing residential areas from high density housing developments’. The Masterplan states that ‘Sydenham’s status as a Transit City will enable Council to seek improved commitments from the state government for investment in the area including improved transport and community facilities’ (Brimbank City Council, 2005b).
In summary it is stretching credulity to think that a transit city with high public transport use is going to develop here without not just major investment in public transport services and other infrastructure, but even more significantly substantial work on changing the culture.
It’s worth emphasizing the culture change which is going to be required for TOD to work in the outer suburbs of Australian cities. Graeme Davison (2004) makes it abundantly clear how car-based all post-war development in Melbourne has been, and how public transport systems since then have been merely considered a safety net for those who can’t drive, not a serious means of mass transportation. Davison notes:
•
•••
Transit Oriented Development182
It was along the cream brick frontier of the new middle class suburbs that the car-owning habit advanced furthest and fastest. In the 1960’s … the suburban frontier … advanced hand in hand with the rise of the two car household.
The car brought a new sense of time and space to the city. It reinforced the suburban sprawl that had been a feature of Australian cities since colonial times. It reshaped the suburbs, …, transforming the regular oscillations of commuters from city to suburb into a more complex web of movements across the metropolis. It created a new engineering, a new architecture, a new aesthetic.
The car promised to give everyone access to their own bit of semi-rural seclusion, to offer Everyman and Everywoman their own little Eden.
That’s what we are up against in introducing transit oriented development to the outer suburbs, so many of the people who live here still want to live this dream. Davison contends that this suburban dream has now begun to lose its allure. For some it has, but I contend that for your average outer suburban residents, the dream still holds true, and is reflected in their negative responses to higher density urban living in their dream world.
Further it will be a real challenge to increase public transport use for these residents. Other than for journeys to work for the small proportion of the workforce who both live near a train-line and work in the far distant CBD, people haven’t experienced public transport working and simply don’t believe in it. People settling in outer suburban Melbourne are likely to have grown up themselves on the frontiers of Melbourne 20 and 30 years ago. They didn’t have public transport that worked then, and they haven’t got it now. And the culture bombards them with the message that driving and owning the car of your dreams is fundamental to your existence. Why is it then surprising that public transport use in the outer suburbs is only in the 2 to 3 percent of trips range? And why would we think that people living there could conceive that it is possible for it to be any different?
Building community support for TOD
So what can be done to increase community support for TOD in Australian cities? How do we reinforce the values and reasons and support for TOD and overcome the opposition? Reflecting on the underlying values and motivation of TOD supporters and resisters I think there are 4 critical directions. First, make sure it really is transit oriented development. In most cases in Australia that means substantial improvements in public transport as part of the development. The worst outcome, and what Melbournians fear the most is that we get the development but the public transport service falls way short of the mark in genuinely competing with the car.
Secondly, overcome the fears of traffic chaos and parking by challenging the car culture. That means not just good public transport but actively discriminating against cars in TOD zones. There are ample examples around Australia where good public transport is provided but the car culture remains. If there’s abundant free
There Goes the Neighbourhood? Or Saving the World? 183
parking, roads designed to be ‘efficient’ for cars and a wider culture of executives driving their company cars each day from public transport rich locales to the city then the traffic and parking chaos associated with the development are likely to be a reality.
Next, choose the site well. Start with the sites where there is a good chance of success – the Footscray’s of the world. Once we have some TOD successes under our belt in Australian cities then it will be much easier to sell the concept to other places.
Finally, ensure there is excellent community involvement. Adopt best practice, using the expertise of excellent practitioners in community involvement. Best practice means quite a lot more than having a draft master plan out for public comment for a month. It takes time and costs money, but not much money compared to the dollars associated with the development, and not much money compared to what is spent or foregone in fighting against the community over many years. It’s an investment that is likely to result in a supportive community working with Council and state government, and most likely a better development given the wisdom of the community is taken into account. Provide a long lead time to give people time to get used to the idea, and to allow thorough extensive community involvement in the final design. Provide excellent information and education about why TOD is a good thing. This community education needs to be sophisticated, and have a context of the cultural change and behaviour change that is being asked for. Just producing a brochure and sending it out to the ‘usual suspects’ isn’t going to be enough. Be upfront about what is being proposed, don’t try and paper over aspects of the development that seem more controversial. As Barry Humphries said you’ll strike a bugger of a problem when the residents find out. Negotiate with the community. Although this may result in a more modest development if it’s supported by most of the community that’s a huge achievement. Pushing through things regardless may work in the immediate circumstances but builds resentment and cynicism towards TOD in the future.
It is important to be genuine in your community engagement. It is people’s homes and lives that are being planned. Respect their views, because everyone is entitled to their views and shouldn’t have them ridden roughshod over. Instead of labelling all people who don’t agree as troublemakers who need to be beaten, engage, understand, discuss and negotiate. Not everyone is likely to agree in the end, but if you have the majority in support the consultation will have built a good platform for further development in the future.

This page has been left blank intentionally

PART V Implementation: Markets

This page has been left blank intentionally
Chapter 14
The Property Sector as an Advocate for TOD: The Case of South East
QueenslandBruce James
Introduction
Queensland is one of six states in Australia and has a population of 4.2 million. The south east region of Queensland, Australia’s fastest growing region, has a current population of 2.46 million which is forecast to reach 3.7 million by 2026. In 2005 the Queensland Government released the South East Queensland Regional Plan 2005–2026 (SEQRP). The SEQRP was developed in response to the need to coordinate and integrate land use and infrastructure planning across the south east region. The aim of the SEQRP is “to manage this growth and associated change in the most sustainable way and to protect and enhance the quality of life in the region” (Queensland Government, 2005, p1).
Transit oriented development in South East Queensland plays a key role in achieving the economic, social and environmental sustainability of the region. This chapter outlines the policy and financial settings for transit oriented developments (TODs) in South East Queensland. In particular, the drivers for the private sector are considered as these are critical to whether TODs are delivered in a meaningful way.
Queensland policy setting
The SEQRP sets the policy context, targets and mechanism for the achievement of infill with desirably much of this infill close to public transport. The SEQRP has twelve desired regional outcomes (DRO) that provide the policy direction for the future management of growth in SEQ. The relevant DRO for transit oriented developments is number eight. Each DRO is supported by principles and policies, as outlined in Table 14.1.
The targets identified in Policy 8.2.4 are defined for each of the 18 local authorities within SEQ. The target for Brisbane City Council, the largest local authority, is 115,000 dwellings for infill (80 percent) out of a total target of 145,000 new dwelling. The key question is how these targets will be achieved. The key
Transit Oriented Development188
process to achieve these targets is through each local authority developing a local growth management strategy that identifies how the local authority will achieve its infill dwelling target.
It is worth noting the current mainstream approach to increasing dwelling density is by the splitting of large lots into two small lots with the existing dwelling relocated on or removed from the site and a new dwelling built on the newly created lot. This redevelopment is determined by lot sizes and the form of dwelling construction rather than any relationship to public transport routes. With declining household sizes, the increase in population is not necessarily double. There is evidence that the growth in lone-person households has not been matched by an increase in demand for higher density multi-dwelling alternatives relative to the separate detached dwelling (Wulff, Healy and Reynolds, 2004). As a result, most dwelling density increase takes place in non TOD sites.
Added to this is a relative abundance of developable land in the outer local authorities. The State Government has been under great pressure to facilitate the approval of ‘greenfield’ land with detached dwellings at the urban fringe to counter the declining housing affordability evident in many of the Australian capital cities. These areas are poorly serviced by public transport infrastructure and services. The policy challenge confronting local and state governments is to achieve many more new dwellings at affordable prices located adjacent to public transport stations.
Table 14.1 TOD related policy objectives
DRO 8 Urban development
A compact and sustainable urban pattern of well-planned communities, supported by a network of accessible and convenient centres close to residential areas, employment locations and transport.
Principle 8.1 Urban structure Accommodate the majority of regional growth in existing urban centres or within identified urban growth areas.
Policy 8.1.1 Contain urban development within the Urban Footprint.Principle 8.2 Urban form Make the most efficient use of land allocated for urban
development.Policy 8.2.4 Achieve targets to progressively increase the proportion
of new dwellings created by infill and redevelopment of existing urban areas.
Policy 8.2.5 Focus higher density and mixed-use development in and around regional activity centres and public transport nodes and corridors.
Principle 8.7 Integrated land use and transport planning
Integrate development with transport infrastructure, community services and employment.
Policy 8.7.6 Facilitate appropriate forms of transit oriented development in proximity to regional activity centres and high capacity public transport nodes and corridors.
Source: Queensland Government, 2005.
The Property Sector as an Advocate for TOD 189
TOD policy rationale
The achievement of the TOD policy objectives is most likely based on an intuitive view that the community benefits are greater than the community costs of extending all of the residential development out from the current urban areas (fringe development). There is limited empirical evidence to show that TODs, for example, reduce congestion and pollution or have broader economic benefits (Cervero, 2004).
A major study in the US identified three main benefits of TODs (Steuteville, 2004):
Increased public transport patronage.Increased land values.A good source of revenues for public transport agencies.
Newman (1999) undertook analysis to quantify the costs and benefits of fringe versus inner urban development in Western Australia. He estimated that the infrastructure and servicing cost for a new dwelling in a fringe development in Perth was AUD$73,100 while an estimate for inner city development was AUD$20,000 (this excludes health and education infrastructure costs). There are two categories of infrastructure costs and a third category of non-infrastructure costs on which Newman has based his costs and benefits (Table 14.2).
Newman also estimates the difference in the transportation costs between inner and fringe development in Australia, with the net differences shown in Figure 14.1. It is worth noting that the relative difference between transportation costs (capitalized over 15 years at 10 percent per annum) is about one and a half times greater than the initial infrastructure and servicing costs.
The validity and quantum of these costs and benefits between inner and fringe developments are likely to be debated. There must, for instance, be a threshold point where the impact of increased inner area development would trigger the need for additional infrastructure costs for water, sewerage, health and education.
1.2.3.
Table 14.2 Costs of development at the urban fringe
Category Infrastructure Cost per fringe lotHard or economic infrastructure
Water supply, drainage, roads, electricity, telecommunications and transport facilities
$36,600 *
Social infrastructure
Education, recreation, community health and welfare
$8,700 *
Non-infrastructure costs
Car capital and operating costs, time and parking costs, transit costs
$23,200 *
* These costs were derived by the Western Australian Water Authority (Industry Commission, 1993). The total of these costs (AUD$68,500) is less than Newman’s AUD$73,100.
Transit Oriented Development190
This threshold issue has not been considered in the above cost estimates as it is likely to vary greatly depending on the specific circumstance in each local area.
Assuming these benefits are real, the question then is whether many of the benefits are identified and quantified by the buyers of dwellings and what impact this has on the market. If buyers do not identify these benefits, the government will need to intervene into the market place by either informing or providing some form of financial incentive to buyers or providing greater financial returns for developers. The financial incentive for developers could be in the form of tax discounts or subsidies, planning regulation bonuses or relaxations, or infrastructure improvements funded by the public sector that enhance access and/or amenity. Cervero and Newman’s evidence suggests there are public benefits to be gained from infill to support the SEQ Regional Plan objectives but this is likely to be contingent of local circumstances.
Implementing TOD: An evolution of approaches
The public and private sectors have been progressing TODs in a number of locations in South East Queensland since the early 1990s. Four case studies have been chosen to illustrate the different approaches that have been taken, primarily by different public sector arrangements and the private sector.
Case 1: Local authority as a facilitator of development: Brisbane Urban Renewal
Brisbane City Council with the support of the State and Federal Governments established the Urban Renewal Task Force, now Urban Renewal Brisbane, in 1991. The role of the Taskforce is to forge strong partnerships between developers,
figure 14.1 net transportation per dwelling cost comparison of fringe and inner development (AuD$)
Source: Data – Newman 1999
The Property Sector as an Advocate for TOD 191
community networks, local businesses and government agencies. The Taskforce facilitated and brokered the redeveloped large pockets of unused land within the inner eastern areas of Brisbane.
The aim of Urban Renewal is to create vibrant living and working environments through innovative planning that:
Increase housing and employment opportunities.Improve public transport and reduce congestion.Provide more open space and public access to the river.
Since 1991 Urban Renewal has redeveloped 76 hectares of obsolete sites and buildings, built over 5 kilometres of riverfront promenades, developed pocket parks, upgraded street scapes and provided 211 low-cost housing units. A number of these are in close proximity to railway stations while others are near ferry terminals and bus routes. The location of a number of the sites suggests that proximity to transit is secondary to the other elements of TODs (for example, mixed use).
In summary, the Urban Renewal Brisbane model was one where they facilitated various partners/stakeholders in a proactive way to achieve TOD outcomes.
Case 2: State government authority: South Bank Redevelopment Authority
The South Bank Corporation was established by the state government to redevelop the land on the south side of the Brisbane River that was used for the World Expo in 1988. The Authority’s area has evolved over the past 18 years and emerged as a mixed use urban precinct and one of Australia’s great public places. The Corporation applies a partnership approach with the public and private sectors for both place-making (land use planning and urban design) and place-management (festivals and so on). A key feature of South Bank has been the creation of the recreation area adjacent to the river which has high active amenity that attracts thousands of local residents every year.
The South Bank Corporation model is a combination of land owner, facilitator and public realm manager with the aim of achieving TOD outcomes around two joint railway and bus way stations.
Case 3: Transport agency as a development initiator: Varsity Station TOD
Queensland Transport (QT) has also facilitated TOD opportunities primarily through planning activities around future railway corridors and bus ways. QT in this situation is a transport infrastructure planner and customer with the delivery undertaken by Queensland Rail or, in the case of bus ways, the Major Projects Office within the Department of Main Roads. The planning regulator is the Gold Coast City Council.
The work undertaken on the Gold Coast was innovative for QT in that it also took the step of acquiring land immediately adjacent to the proposed Reedy
1.2.3.
Transit Oriented Development192
Creek railway station for non-public transport purposes. The TOD planning and packaging for development is integrated with the extension of the railway south of Robina. Robina is a major activity centre seventy kilometres south of the Brisbane CBD. The original and approved development on the land purchased by QT was for light industry with tilt up buildings and there would have been negligible synergies between the railway station and this intended land use.
It is worth noting that Arrington suggests that public transport agencies are “learning that they are not just in the people-moving business, they are also in the community building business” (Arrington, 2004 cited in Steuteville, 2004). The traditional approach to the delivery of railways has focussed on solely achieving public transport objectives with land around stations acquired for uses such as park and rides and bus feeder services. The integration of this with supportive land use development, in terms of acquiring land for this activity, was therefore an innovation for QT. This project will be returned to the private sector with certainty around station location and timing, local planning approvals in place and basic infrastructure and site works in place.
The key to the Varsity Station Village is the commercial/retail core at the entrance to the railway station. QT undertook a small enquiry-by-design process to integrate land use development incorporating TOD principles with the railway station, park and ride and bus feeder operational requirements. The site for TOD purposes comprises 8.5 hectares purchased for the TOD plus 2.5 hectares of useable land within the rail corridor. The 8.5 hectare site is currently encumbered with a 18 metre wide easement for a high voltage (110 KV) power transmission line. Potential yields for the site, subject to local planning approval, are 500 to 1,000 dwelling units, 50,000 sq metres of office floor space and 5,000 to 9,200 sq metres of retail floor space.
The proposed Varsity Station Village TOD has been subject to a cost benefit analysis as a part of the state government’s business case considerations. The costs and benefits used to derive the benefit cost ratios have been grouped into three categories:
Direct costs – Earthworks, road works, park and ride, powerlines.Direct benefits – Property value appreciation, undergrounding powerlines, mode shift savings, travel time costs savings.In direct benefits – Safety, air quality, water pollution, noise pollution.
The analysis period of 50 years was used, compared to the traditional 20 years, due to the long term nature of the project and a discount rate of 7 percent to calculate the net present value was applied to derive the benefit cost ratio. Two options were considered that involved under grounding and not under grounding the high voltage power lines. The quantified costs and benefits are shown in Figure 14.2. The benefit cost ratios are 3.06 and 3.11 respectively.
Based on this cost benefit analysis, it is evident that most of the benefits will be gained by the future residents and employees. As a result, it may be more
1.2.
3.
The Property Sector as an Advocate for TOD 193
appropriate for the public sector rather than the private sector to carry the risk for these benefits if the proposed TOD doesn’t provide a sufficient internal rate of return. The carrying of this risk by the public sector could be in the form of a subsidy to the private sector or, as is the situation for this case study, direct intervention by the public sector.
In the case of the Varsity Station Village TOD, the arbitrage benefit range1 in excess of the non-TOD option and with and without the undergrounding of the power transmission lines is between $17 m and $23 m.
In summary, the transport infrastructure planner performed the role of a partial developer within the different roles of the public and private sector outlined as follows:
Public sector: (QT) – Purchase of the land and resale back to the private sector with a TOD local area plan and development approval. The SEQ Regional Plan desired outcomes likely to be achieved through the access to the proposed station, master plan with design guidance contained in the local area plan.Private sector: – Implement the proposed development at the time the railway station becomes operational and undertake the marketing for this type of development.
1 Arbitrage is the practice of taking advantage of a price differential between twoArbitrage is the practice of taking advantage of a price differential between two or more markets: a combination of matching deals are struck that capitalize upon the imbalance, the profit being the difference between the market prices – Wikipedia.
•
•
Figure 14.2 Costs and benefits for Varsity Station Village TODSource: Data – State Government business case internal document
Transit Oriented Development194
Case 4: Private sector developer: FKP Property Group
FKP Property Group is a private property developer currently tackling difficult two TOD sites on the existing suburban railway network in Brisbane. The two sites are adjacent to existing railway stations are Albion and Milton, both a short distance from the Brisbane CBD.
In October 2005, the FKP Property Group announced the acquisition of a 5,566 square metre site at Albion for a future mixed-use development. The site comprises the former Defiance Flour Mill and includes a Brisbane City Council heritage-listed building which will be refurbished as part of the development. Plans for a mixed-use precinct include residential apartments configured in two separate towers together with the refurbishment of the existing flour mill building. Complementing the residential apartments will be ground floor convenience retail.
The FKP Group has also acquired air rights over the Milton Railway Station and 3,200 square metres of adjoining properties. This mixed-use development will be the first of its kind built over an operating railway in south east Queensland and includes large floor plate office space, residential units and potentially a hotel in a premium inner city commercial location. Proceeds from the sale of the air rights will be used to upgrade the Milton Railway Station.
In this case study the private sector entity undertook all of the planning and delivery with the private sector playing the role of planning regulator. The role of QT in both the Albion and Milton has been to protect the integrity of the operating railway and acquire a reasonable return on the sale of air rights.
Private sector perspective
The private sector is the primary deliverer of TODs, especially where large numbers of new dwellings in TODs are to be delivered. Active participation by the private sector is fundamental in the main streaming of TODs and the public sector understanding of the drivers and barriers confronting the private sector is critical if main streaming of TODs is to be achieved. The section of the chapter endeavours to build ths understanding.
The private sector has been advocates for TODs in SEQ providing they are able to deliver reasonable cost product to a market that is prepared to purchase the product with a reasonable rate of return relative to the risk.
The Queensland Property Council identifies the following major obstacles to achieving successful TODs:
“fragmented land ownership and titles;difficulties of integrating private titles and current crown and other public lands (similar difficulties exist involving air space rights);the high construction costs associated with this form of urban development;
1.2.
3.

The Property Sector as an Advocate for TOD 195
lack of market demand for such a product; anda lack of leadership and vision within the relevant local authorities.” (Property Council, 2005, p8).
Conversations with individual property developers identified further obstacles of:
lower quality of amenity at potential TOD sites around railway and bus stations versus inner areas along river foreshores;density or height limitations imposed through local government planning schemes that constrains the ability to gain sufficient yield;requirements for higher parking provision based on bank financing models; andspeculation by small lot holders when specific TOD locations are identified.
A review by developer Delfin Lend Lease of the redevelopment potential of many of the possible TOD sites identified in the draft SEQ Regional Plan (Queensland Government, 2004, p38) revealed that few were financially viable without some form of public sector intervention to resolve the above barriers and that the likely dwelling yield would be relatively insignificant compared with the forecast dwelling demand in the region over the next twenty years.
Evan Jones’ synopsis of the success criteria, see Table 14.3, required to develop TODs echoes the obstacles identified by the property sector (Jones, 2006). Jones identified four key areas required to achieve positive TOD outcomes. A number of these success criteria have been evident in each of the four case studies.
Sadik-Khan’s (2006) survey identifies the characteristics that affect private sector leadership and therefore private sector financing. Like Jones’ success criteria, the characteristics are mix of regulation, physical attributes and political support. Proximity to transit and the right location in the city that will attract potential buyers were considered the highest two characteristics. The next two characteristics, public sector financial support and less parking, involved direct financial aspects while the last two relate to political support for the TOD project. The public sector financial support and political support by the public sector characteristics were also identified by Jones.
Development finance is also a major consideration in determining what constitutes a feasible project which in turn underpins private sector leadership. According to Mackay there are many success criteria required for mixed-use developments, which include:
The value assigned to the land;The desired rate of return;Funding finance terms;The duration of ownership;The construction cost of the urban and built form;
4.5.
1.
2.
3.
4.
1.2.3.4.5.
Transit Oriented Development196
The mix of uses anticipated;The depth and breadth of the market;The rents that retail and other commercial operators are prepared to pay;The willingness of the developer to negotiate with major tenants; andThe desire of major tenants to locate to a particular centre, which, in turn, relates to:
The location of the centre;The size of its present and future catchment; andMarket exclusivity (that is, the opportunity for a monopoly in a particular retail sector). (Mackay, 2003, pp. 11–12)
From the private sector financing point of view these will be success criteria in assessing the viability and risk for commercial and retail developments, either as stand alone or a component of mixed use development. The criterion that relates closest to transit is the impact the transit system would have on the present and future catchment
6.7.8.9.10.
a.b.c.
Table 14.3 suggested criteria to maximize the success of TODs
Category Criteria explanationPlanning Certainty and approvals time Clearer understanding of what is
permitted, such as minimum floor space for retail uses adjacent to railway stations
Appropriate zoning For uses adjacent to railway stationsSupportive Local Plan For example, flexible building heights are
required if lifts needed in buildings.Land assembly mechanisms Compulsory land acquisition powersRelevant design based codes These support the vibrant place making,
such as South Bank.governance Integrated workings of state and local
government across departmentsLinkage of different departments that support TOD’s, such as planning and infrastructure.
Proactive not reactive governance Public sector governance that facilitates TOD’s, such as Brisbane Urban Renewal.Integrated not adversarial governance
Public sector governance that is willing to take risks
Leadership behaviours by public sector officers, evident in the Varsity case study.
Governance focussed on action rather than regulation
Public sector striving to find solutions rather than solely applying regulations.
urban finance Activity centres priority. Priority by state and local governmentsProgram of works to catalyse private funding
Public capital works programs supporting TOD development.
Mix of public and private monies Combine improvements to infrastructure and public realm with private property enhancements.
Link developer dollars to works for TOD Developer contributions that help facilitate TOD’s.
Leadership Economic development. Leadership role by the private sector.Community development Leadership role by local government
The Property Sector as an Advocate for TOD 197
of the centre. Otherwise, most of the success criteria have little relationship to transit per se. The public funding of public transport infrastructure is usually assessed in terms of cost benefit analysis around the efficient movement of people. Mackay’s private sector success criteria therefore appear to have little in common with the success requirements for the private sector in this context can be tenuous.
In many instances, to achieve effective integration of transit infrastructure with TODs increases the uncertainty and capital costs for the transit infrastructure provider. Nevertheless, key questions emerging from this include what are the outcomes the transit infrastructure projects are striving to achieve and how does the infrastructure delivery model engages or partners with the local developers. The traditional project management approach to infrastructure delivery strives to contain and manage impacts as opposed to seeking other opportunities that support transit is unlikely to facilitate partnerships that lead to win wins. This project management approach discourages integration and is potentially risk averse which is contrary to some of Jones’ criteria. This was evident with the Varsity Station TOD however the anticipated financial return on the TOD will totally off set the additional capital cost.
Gyourko and Rybczynski view TODs as being higher risk unless “multiple-use development can be profitable if the payback period is short enough, the site is acquired at below replacement cost and/or the project is focussed on a dominant product that the financier understands well” (Gyourko and Rybczynski, 2000, p. 743). They conclude that complex large mixed-use developments require larger organizations having broader management resources and easier access to capital. This means that, depending on the market for TOD retail, commercial and housing products, at some point public sector involvement in part may be required for the criteria identified by Mackay, which is consistent with Sadik-Khan’s observation.
The conclusions to be drawn from these various authors is that to realize TOD opportunities there is a need for joint public and private leadership to find common benefits if the TOD objectives of the SEQ Regional Plan are to be achieved. This leadership needs to cover the areas of planning regulation, governance and financing. The current model to capture this leadership is through public private partnerships.
Public private partnerships (PPPs)
The principles developed by the US Urban Land Institute for the development of TODs, redevelopment of suburban strip and mall centres and suburban business centres consistently talk of the need for partnerships between the public and private sectors. Corrigan, et al (2005) identified the following ten principles required for effective public private partnerships:
Prepare properly for PPPsCreate a shared visionUnderstand your partners and key playersBe clear on the risks and rewards for all parties
1.2.3.4.
Transit Oriented Development198
Establish a clear and rational decision making processMake sure all parties do their homeworkSecure consistent and coordinated leadershipCommunicate early and oftenNegotiate a fair deal structureBuild trust as a core value.
It is evident from these principles that it is important to engage with potential TOD developers early in the process. The experience of integrating higher density development with trams or street cars in Portland, Oregon supports these principles with local stakeholders having a major decision making role (Ohland and Poticha, 2006). The question is then what are the mechanisms to implement and achieve the ten principles in the Australian context.
The Property Council of Australia, Queensland Division (2005) advocates the creation of a TOD Corporation with a range of characteristics to facilitate this public private partnership arrangement:
legislative powers to resume land and apply planning approval authority;produce planning frameworks for TOD sites involving the community, local councils and property owners;include relevant state and local governments on the Corporation Board;well resourced with talented staff from the public and private sectors;develop bundled infrastructure and services; andassume responsibility for public land holdings.
The assessment of the TOD Corporation proposal against Jones’ key success criteria is shown in Table 14.4. The proposed TOD Corporation structured in the right way, with the right powers, sufficient funding and organizational philosophy would meet Jones’ success criteria. The proposed TOD Corporation reflects many of the key success criteria.
The advocacy of a TOD Corporation by the Property Council appears to be born out of frustration by the development industry in their ability to achieve TOD developments on a large scale. Brisbane Urban Renewal achieved many successes, the South Bank Redevelopment Authority is very successful within its geographical area and the Varsity Station TOD was a specific opportunity.
urban Land Development Authority
The Queensland State Government has recently responded to the need for a TOD Corporation by deciding to establish an Urban Land Development Authority. The policy trigger for the Authority was community concern with housing affordability. The Queensland Government released in July 2007 a “Queensland Housing Affordability Strategy” in response to the growing community concerns
5.6.7.8.9.10.
1.2.
3.4.5.6.
The Property Sector as an Advocate for TOD 199
across Australia about the cost of housing for new home buyers and households struggling with high mortgage repayments (Queensland Government, 2007). A key element of the Strategy was the Government’s commitment to establish an Urban Land Development Authority.
The purpose of the Authority is to develop sites nominated by the Government to deliver a range of housing products to meet changing community demands for housing. The Authority will have powers to undertake land use planning, acquire, amalgamate and improve land, and sell on land and development rights to the private sector. Powers of land resumption were not provided to the Authority as advocated by the Property Council. Nevertheless the operations of the Authority address have the potential to meet Jones’ planning, governance, urban finance and leadership criteria.
In terms of transit featuring in the work of the Authority, the government directed the Authority to focus on five sites, with two of the sites adjacent to railway stations, one next an existing bus way station and one on a proposed bus way alignment. The fifth site is in a regional city in central Queensland experiencing a severe housing shortage and has no dedicated transit network.
Conclusions
The drive to pursue transit oriented development to achieve desired policy outcomes has gained momentum with the release of the 2005 South East Queensland Regional
Table 14.4 Comparison of TOD Corporation with Jones’ success criteria
Jones success Criteria Proposed TOD CorporationPlanning Certainty and approvals time
ZoningLocal PlanLand assemblyDesign based codes
Planning approvals and powers to resume/acquire, manage and dispose of assets are required. Design based codes are a form of planning regulation. The planning powers would be included with the corporation.
governance Integrated workings of state and local government across departmentsProactive not reactiveIntegrated not adversarialRisk takingAction not regulation
Board structure and mix of private sector staff and public servants can achieve integration. Powers and culture of Corporation important.
urban finance Activity centres priority for state and local governmentProgram of works to catalyse private fundingMix of public and private moniesLink developer funds to TOD works
Base funding provision and tasks assigned to the Corporation critical to these success criteria.
Leadership Economic development – privateCommunity development – local
Board structure and stakeholder engagement important.
Transit Oriented Development200
Plan. The development sector has been promoting TODs through proposing a TOD corporation as well as delivering TODs where their financial criteria are met. Brisbane Urban Renewal, the South Bank Redevelopment Authority and Queensland Transport have all contributed to developing TODs. The creation of the Urban Land Development Authority in 2007 provides an additional mechanism to successfully deliver TODs.
To achieve the urban consolidation targets through TOD there is still a need for larger scale joint public and private sector approach or a public private partnership. It is clear that the traditional role of the public sector covering regulation and infrastructure alone will not be sufficient. There is an ongoing need for public sector leadership supported by proactive and integrated governance, urban finance and land assembly mechanisms. There is also an ongoing need for the private sector to exhibit leadership and take risks in developing the market for TODs.
There is also a need for clearer understanding by the community of the public benefits of transit oriented development. The evidence and quantification of the public benefits of TODs will assist in prioritizing scarce public funding to TODs that will deliver the greatest public benefits. Nevertheless, to main stream transit oriented development there will always be need for the private sector to obtain a reasonable financial return.
Acknowledgements
The author is grateful for the assistance provided by Guy Gibson and Evan Jones.
Chapter 15
The Commercial Reality of TOD in AustraliaWarwick Hemsley
In developing its first transit-oriented ‘village’ at Wellard in the burgeoning southern suburbs of Perth, Western Australia, Peet Limited has tried to implement a classic definition of transit oriented development (TOD):
The transit village or TOD is a compact, mixed-use, walkable community, centred around the transit station that, by design, invites residents, workers, visitors, and shoppers to drive their cars less and ride mass transit more.1
Cervero (2004) describes the typical TOD in the following terms. The transit village extends roughly 400 metres from a transit station, a distance that can be covered in about 5 minutes by foot; the centrepiece of the transit village is the transit station itself and the civic and public spaces that surround it; the transit station is what connects ‘village’ residents and workers to the rest of the region, providing convenient and ready access to downtown, major activity centres like a sports stadium, and other popular destinations; and, the surrounding public spaces or open grounds serve the important function of being a community gathering spot, a site for special events, and a place for celebrations.
Transit oriented development is not new. Many neighbourhoods in the 1920s conformed to the description just given, as illustrated in Figure 15.1.
In recent years with the revival of Perth’s suburban passenger train network, there is renewed interest in the ‘transit village’ concept. Good examples are the outstanding ‘Subi Centro’ redevelopment on the City-to-Fremantle line, the new development at Somerly/Clarkson on the Northern Suburbs line, organic development at Claremont in Perth’s western suburbs, and The Village at Wellard being developed by Peet Limited in the Town of Kwinana in Perth’s fast-growing southern corridor.
Subiaco Centro is an award winning redevelopment encompassing townhouses, apartments, parkland, commercial office, retail shopping, home office, service industry and public transport. Over half a billion dollars has been invested by the private sector in transforming this former industrial land into a brilliant new urban environment. Subi Centro boasts spectacular new housing, shopping and
1 “New Urban Liveable Communities” (http://www.transitvillages.org/transitvillages.“New Urban Liveable Communities” (http://www.transitvillages.org/transitvillages.html). Accessed 29 July 2007.
Transit Oriented Development202
entertainment areas, mixed-use office precincts and an integrated recreation spine forming an East-West greenway.
The new development of Somerly-Clarkson uses innovative design to improve and facilitate community formation by promoting sense of place and nodal development. Walkable neighbourhoods come together in a town that strongly supports the use of public transit, by the integration of the Clarkson Train Station with a bus interchange and mixed use main street village.
Claremont is a long-established traditional mixed used shopping precinct with a closely adjacent railway station. It is compact with a strong sense of place. Pedestrian based retail and business/commercial land uses predominate and are surrounded by mixed residential development. As redevelopment occurs, Claremont’s centre is exciting with the potential to follow in Subiaco’s footsteps as a rejuvenated TOD.
Figure 15.1 Transit oriented development 1920s style
The Commercial Reality of TOD in Australia 203
The Village at Wellard will be the first greenfields TOD in Perth’s southern corridor, served by the planned new Southern Suburbs Railway. It will have mixed use including retail in a new commercial village centre, significant new educational facilities, and 2,700 residential lots.
The village at Wellard
The vision for the development of the Village at Wellard is to develop a sustainable and functional community with a range of transport, educational, recreational and employment opportunities, focused on the proposed Wellard station and bus interchange on the planned Southern Suburbs Railway, and to deliver an integrated development to complement and enhance the broader Kwinana region.2
2 http://www.thevillageatwellard.com.au/index.asp. Accessed 29 July 2007.http://www.thevillageatwellard.com.au/index.asp. Accessed 29 July 2007.
Figure 15.2 The Village at Wellard planned development
Transit Oriented Development204
The Village of Wellard is located 35 km south of Perth’s central business area and 1.5 km south of the established Kwinana town centre. It is bound by Wellard Road to the north, the Homestead Ridge Estate to the east, Leda Reserve to the south and the existing suburb of Leda to the west. It has a total planned area of 320 hectares.3
Development of the project at Wellard is planned to span a 10-year period, with 8,700 people living in the area at the end of the decade. It will include a range of commercial, residential and mixed-use floor spaces ranging from 30 to 2,500 square metres (m2). There will be approximately 5,000 m2 of village-style retail and 2,500 m2 of commercial floor space. It will also include two primary schools, a middle school, and private school. The whole development area will be pedestrian and cycle friendly. These areas will be complemented by nearly 60 hectares of public open space (wetlands, bushland and parklands) (see Figure 15.2).
Power through partnership
Wellard is a joint venture between the Western Australian Government’s Department of Housing and Works (DHW) and Peet Limited.4 Landstart has been a progressive partner, which has taken an innovation and flexible approach to development. They have been concerned to optimize the project and to facilitate progress on the project, and have been enthusiastic to develop creative solutions and mutually beneficial outcomes.
A very productive partnership has also been developed beyond the Peet/DHW joint venture. The partnership aims to optimize the competitive advantages and strengths of the public and private sectors. Key stakeholders in this partnership include the Town of Kwinana, the state’s Department for Planning and Infrastructure (DPI), Homeswest (the state’s public housing rental agency), and the Public Transport Authority (PTA).
Consultation with key stakeholders resulted in refinement of the joint venture’s development proposal. A Memorandum of Understanding was agreed by the parties, Wellard Joint Venture partners (the developer), the PTA and DPI, to facilitate simultaneous staged delivery of lots and related infrastructure to ensure sufficient passenger boardings at the Wellard Station during the first phase of the Southern Suburbs Railway.5
For the submitted structure plan, it was agreed by the partners to increase residential densities within 400 metres of the transit station. The proposed non-government primary school site was also increased to allow for a kindergarten to year 12 school. The aim was to provide a high school component to increase public transport use over what would occur with only residential land use.
3 See http://www.thevillageatwellard.com.au/Uploads/Downloads/wellard_estateplaSee http://www.thevillageatwellard.com.au/Uploads/Downloads/wellard_estatepla n.pdf for a detailed plan of the Wellard development. Accessed 29 July 2007.
4 For more detail see http://www.dhw.wa.gov.au/landsales/site_files/corporate/For more detail see http://www.dhw.wa.gov.au/landsales/site_files/corporate/initiatives2.htm#wellard. Accessed 29 July 2007.
5 http://www.newmetrorail.wa.gov.au/. Accessed 29 July 2007.http://www.newmetrorail.wa.gov.au/. Accessed 29 July 2007.
The Commercial Reality of TOD in Australia 205
The process of negotiation with state and local authorities resulted in agreement to a number of enhancements to the plan. These included a private school site (kindergarten to year 12), increased provision of density close to the transit station, a greater diversity in lot sizes, more intensive development within station catchment, delivery of infrastructure to coincide with station opening, staged commitment to lot creation close to the station prior to its opening, and retention of natural land forms and significant trees.
To support the opening of the Wellard train station the Wellard Joint Venture partners committed to deliver 283 homesites by April 2005 and 187 by April 2006, to provide key infrastructure and roads, and to a defined land use distribution/intensity.
The design of the Wellard station in the main street was also optimized through a very productive collaboration with the PTA, in which ideas about the form of the station precinct were usefully evolved. An emphasis was placed on walkability. A ‘kiss-n-ride’ facility was provided and the train service was integrated with services available from buses and taxis. There was a significant reduction of short-stay parking to reflect the very tight walkable TOD catchment.
TOD principles applied
The Village at Wellard aims to implement Cervero’s TOD principles through a variety of means. Land development is integrated with public transport systems and strategies, with the town centre being developed around the transit station. The transit system provides fast and efficient access to Perth, Rockingham and Mandurah for employment and entertainment.
The town centre has been planned to comprise mixed commercial, retail, residential, entertainment, leisure, education, health uses, civic spaces and amenities. The area surrounding the train station allows for a community gathering area in the Village Square comprising public art and surrounded by cafes/restaurants and a tavern.
The development at Wellard aims to maximize access to public transport by ensuring the train station and bus interchange are centrally located and surrounded by commercial and residential development. Residential density increases the closer you are to the transit station, with the highest density within 400 metres of the train station. The majority of dwellings are within a 10-minute walk of the train station, and the entire development is planned to be a walkable/cycle-friendly environment. Security in the area is enhanced through designing out potential crime spots.
The Wellard ‘village centre’ is planned to comprises a supermarket, specialty retail shops (liquor, video, newsagent, bakery), outlets for food and drink (café, sandwich bar, pizza, fish and chips), small commercial enterprises (estate agent, personnel, bank, migration agent), serviced and self contained offices, medical (doctors, dentists, pharmacy, vet), bulky goods stores (garden centre, furniture), leisure (child activity centre, health & fitness centre), child care and a community centre.
Transit Oriented Development206
Profile of purchasers of land at Welland Village
Residential purchasers
Purchaser surveys conducted by Peet Limited indicated that transport was a purchasing decision influence for 100 percent of purchasers. They were also attracted by good provision of community facilities, services and retail. Surveys indicate that 73 percent of purchasers plan to make Wellard their home. There is a diversity of age groups among purchasers of land in the estate, with a strong representation in the 30–39 year age group, closely followed by the over 1940s. The typical purchaser is married and has children under the age of 17. A high percentage of buyers have children aged up to 12 years, and there is clearly a desire to live in a family oriented environment. The vast majority of purchasers were from suburbs located south of the Swan River, but buyers were also attracted from Perth’s northern suburbs (such as Craigie), western suburbs and the Hills.
Purchaser cost savings
According to analysis by DHW, living in a TOD estate makes it easier for families to have one less car. By having one less car, families would have more disposable income with which they could buy an average-priced home over 12 years instead of 25 years. Alternately, some couples can accumulate an additional AUD$750,000 in superannuation or consider retiring ten years earlier. The transit oriented location also appeals to many as it suggests a lifestyle involving less environmental damage.
Commercial purchasing decisions
The Anglican Schools Commission has purchased the private school site within The Village at Wellard because of its proximity to the Wellard train station which significantly increases the catchment area for the school and in particular the high school. Research showed that the high school component of the private school would provide more public transport use than the equivalent area used for residential.
Development staging
Between commencement in May 2004 and mid-2005, around 290 residential lots were sold. By mid-2005, the first private dwelling was nearing completion, and construction of subdivision roads and infrastructure was complete on 152 lots. A further 173 residential lots were under construction, with 79 to be completed in August 2005. 6 Bulk earthworks for train reserve and station were completed. Stage 1
6 This chapter is based on a presentation made in July 2005.This chapter is based on a presentation made in July 2005.
The Commercial Reality of TOD in Australia 207
landscaping of the entry statement at the main entry road, the senior oval and linear park with stream were nearing completion. The first builder’s display home opened in May 2005 and another 13 display houses are nearing completion (see Figure 15.3).
While development has been occurring, land values have been quickly rising as the market recognizes the value in this development (see Figure 15.4).
Where are we going?
By early 2006, bulk earthworks will be undertaken at the Village Centre and servicing infrastructure will be provided for the station site prior to the rail track being laid in early 2006, and the main street, village square and supporting roads will be provided by the time the Wellard Station becomes operational. The Anglican
Figure 15.4 Wellard: Increase in lot prices during staged release
Release Release Date Average size Average Price (AuD) Time to sell
Release 1 29 May 2004 496 m2 $84,426 HoursRelease 2 3 July 2004 466 m2 $89,056 DaysRelease 3 2 October 2004 434 m2 $87,395 WeeksRelease 4 27 November 2004 385 m2 $89,706 WeeksRelease 5 12 February 2005 385 m2 $92,556 WeeksRelease 6 26 February 2005 327 m2 $85,692 WeeksRelease 7 28 May 2005 506 m2 $109,722 WeeksRelease 8 16 July 2005
Figure 15.3 Wellard: Staged land release to July 2005

Transit Oriented Development208
Community School is planned to commence construction in 2006 for the school to open in the first term of 2007. At the same time, railway construction will be undertaken, including the traffic bridge over the railway line on the north-eastern side of the Village centre. Construction of Wellard station itself will commence in July 2005 for completion late in 2006.
Chapter 16
Developing TOD in America: The Private Sector View
Marilee A. Utter
Despite much excitement for TOD, the market reality is that TOD is just beginning to gather momentum in the United States. Mixed-use precincts around transit stations are being touted by planners but built examples are still a novelty outside of older, well-established transit cities like New York, Boston, Washington, and Philadelphia. While the public sector has made major investments in transit systems and station area plans, it actually falls to private sector developers to implement and build these vibrant districts. And most developers still see TOD as too new and too risky. Of all the players essential to produce TODs, the private sector developers may be the least understood. Through their lens this chapter will examine why quality transit villages are happening more slowly than hoped, and why the quality of what is built is often less than the community envisioned. This chapter begins by discussing the demographic and market support for TODs in the United States, looks at requirements for successful TODs, examines the developer’s risk-return trade-off, describes the developers best suited for TOD, introduces public-private partnerships, and projects future trends of TOD in America.
The market for TODs in America
Successful developments are based on fulfilling consumer demand. “You can’t make the market” ranks right up there with “Location, location, location” in real estate textbooks. Hence, that is where most developers start when they are considering a project. Whether determined by expensive market research studies or local knowledge, conscious or subconscious, the first question is always, “Will the market support this development?” “Having a market” generally equates to getting high enough rents or sales prices to absorb the higher costs associated with TOD, and still earn a profit.
Since few American cities have several successful TODs, the developer is often building the first project of its kind in a market. Moreover, often it is transformational to the district, meaning there are no comparables to look to for value – and few role models. Accordingly, when trying to size up the market for a TOD that will come out of the ground in three to ten years, the developer has to look first to the demographic and market trends for the next decade and beyond.
Transit Oriented Development210
This is particularly challenging since America is experiencing profound shifts in composition and behaviour. The good news is that many demographic and cultural changes indicate that TOD will be a long-lived trend rather than just a planning “fad.” Highlights among them:
Aging of the population America is greying. Nearly 20 percent of the American population will be over 65 by 2030 (Ross and Dunning, 2005) Already, only 60 percent of the population drives an automobile, so that percentage will likely drop closer to half the population. As they cease driving, consumers value transportation alternatives and walkable access to services even more highly.
Immigration and race America is “greying” and “browning,” with an especially large percentage of Hispanic immigrants. According to the US Census Bureau, by 2010 Hispanics are expected to account for 15 percent of the population, 20 percent by 2030 and almost 25 percent by 2050. Asians, African Americans and Hispanics are expected to total 33 percent of the total population by 2010, 40 percent by 2030 and 47 percent by 2050 (US Census Bureau, 2004).
Ross and Dunning’s (1997) analysis of the 1995 National Personal Transportation Survey (NPTS) found that average auto ownership is lower, household size is bigger, and transit ridership is larger in Hispanic, Asian and African-American immigrant households. Another study found that Blacks, Asians, and Hispanics make 5.3 percent, 3.2 percent, and 2.4 percent of their trips on transit, respectively, compared to just 0.9 percent for Whites (Pucher and Renne, 2003). TOD can appeal to this growing market.
Climate change Estimates indicate that automobiles are responsible for over 30 percent of carbon emissions (EPA, 2008) and buildings are responsible for over 40 percent (UNEP, 2006). Strategies that reduce car usage and impact building design can have a measurable effect, with strong political support emerging from cities and states as well as the national level.
Healthy communities About a third of the US population is obese (CDC, 2008a), about 20 percent smoke (CDC, 2008b), and health care costs are rising (US HSS, 2008). The push for healthier lifestyles supports the walkable districts and alternative transit modes that characterize TODs.
Rising transportation costs Transportation currently represents 20–40 percent of the typical American household budget, depending on income level. With shelter usually representing another 30–33 percent, there is little capacity to absorb rapidly rising fuel costs. In the last decade alone, petrol costs have more than doubled when adjusted for inflation.1 Transit, and housing and jobs near transit
1 CPI from 1998–2008 is 1.31 (source: “Consumer Price Index – All UrbanCPI from 1998–2008 is 1.31 (source: “Consumer Price Index – All Urban Consumers.” Bureau of Economic Statistics. Feb. 2008. 12 Apr. 2008 <http://data.bls.gov/
Developing TOD in America 211
will continue to appreciate in value because they create an overall more affordable lifestyle as well as a better quality of life.
The intersection of these influences is powerful, and is motivating a growing demand among consumers to be in walkable, mixed-use districts associated with transit. And in case after case, consumers are willing to pay for the opportunity. While every project and every market is different, it is not unusual to find TOD price premiums of 15–25 per cent over similar product a mile from the station (Cervero et al., 2004). This is not a new phenomenon -- consider village resorts like Vail, Colorado or Santa Fe, New Mexico where residents and visitors can usually park once, and walk or shuttle to all their destinations. Real estate prices skyrocket because the mix of uses is appealing, the land-use/transportation connection is user-friendly and the pedestrian environment is attractive. TOD is really just a broader application of these principles and attention to detail, so value premiums in well-executed TODs should not be a surprise.
Does TOD work here?
While overall demographic pressures for TOD are undeniable, they do not apply equally in every market. There are some overarching conditions that communities with successful TODs usually share:
Congestion is perceived as badHousing prices are rising rapidlyDriving costs are increasingThe transit system is attractive and comprehensiveStations areas are attractive districts (TODs)
Beyond this general indicator, however, each project is unique. The list of elements that must come together in a mixed-use TOD is highly detailed and pages long. But an effective “acid test” for a particular site boils down to three considerations: market, land, and leadership.
Market Developers generally agree that you cannot create a market; you can simply capture what is there. So their first question is appropriately about supply and demand. They seek comparable projects to measure market acceptance and potential demand. It is especially difficult when the proposed development has not been done before, as is frequently the case with transit villages and mixed-use. It can be hard to determine whether the absence of similar product is due to a lack of
cgi-bin/surveymost>.) The Price of gasoline in 1998 was about $1.11, the price of gasoline in 2008 was $3.03 (source: “U.S. All Grades All Formulations Retail Gasoline Prices (Cents per Gallon).” Energy Information Administration. 7 Apr. 2008. 12 Apr. 2008 <http://tonto.eia.doe.gov/dnav/pet/hist/mg_tt_usw.htm>. Thus, 3.03/(1.11 * 1.31) = 2.1.
1.2.3.4.5.

Transit Oriented Development212
demand, or a lack of supply. New development types often have not been introduced to a market simply because it hasn’t been done before – no developer has chosen to take the risk to be first. (When polled, 25–30 percent of the population would be interested in a residential product that was more compact, walkable, and close to transit. In contrast, only about 2–5 percent of the product built by developers today meets that description – a glaring gap) (Centre for Transit Oriented Development, 2004; Levine and Inam, 2004; Renne, 2005).
While the new choices for housing and lifestyle offered at many TODs have tapped into pent-up demand and realized an overwhelmingly positive market response, this is never a certainly. Moreover, as will be detailed later in the chapter, the cost to develop compact, mixed-use TODs is higher than conventional development. This causes developers to first seek sites in higher income areas because higher household incomes are generally associated with the opportunity to charge higher rent rates to cushion higher costs and unproven types of development, and to potentially realize greater profits.
On the other hand, middle and lower income locations often don’t warrant the rents to absorb the higher development costs, and are thus more challenging and risky to a potential TOD developer. This can be offset by financial and political incentives, but requires a firm commitment for a public-private partnership. Since this is not the norm, the majority of TODs found in America are in higher income areas unless the local jurisdiction has made a concerted commitment to the development. This can be expected to change over time as mixed-use and TOD become more common but remains the unfortunate reality today.
Land Inability to assemble an adequately large parcel of ground is often the deal breaker that stops TOD. Land parcels must be big enough for a critical mass of development to create a destination district. A building is not a village, and a certain amount of land is needed to accommodate an interesting mix of uses, parking, street networks, plazas and open spaces. Outside the urban core, 10–15 acres seems to be a functional minimum, with many projects sized at 50 acres or more. Greyfields (old malls and under utilized facilities) and brownfields present excellent opportunities for TOD because the land is already assembled, and usually they are surrounded by valuable residential density, high volume streets and infrastructure. While brownfields routinely involve higher land reclamation / clean up costs, most often these fees are manageable compared with assemblage premiums or cases where land cannot be procured at any price.
The situation is complicated by the difficulty in assessing TOD land values. For even the most sophisticated appraiser it is a speculative exercise to determine highest and best use, then analyze the revenues and expenses of the would-be TOD to estimate an appropriate land value. Most often, appraisers instead use a comparables formula, which penalizes innovative and transformative projects. And most land sellers do not even go to the expense and trouble of getting an appraisal to determine a reasonable sales price for their property. Frequently they just look at comparable sales in the area, and then add a big percentage,
Developing TOD in America 213
speculating that a potential TOD will fetch the price. Rarely do they understand the expenses associated with place-making and TOD, leading far too frequently to such unreasonable land acquisition costs that the land assemblage and TOD become infeasible. Accordingly, the first advice to TOD developers is “get the land”.
Until recently, Urban Renewal Authorities were powerful institutions in America, carrying legislative authority for land acquisition and redevelopment of blighted properties – a natural for many potential TOD sites. Within the last decade, however, there has been a political and functional demise of eminent domain in the United States, as implemented through restrictive state legislation. Between Kelo’s passage in June of ’05 and the end of 2007, thirty-nine states have passed legislation limiting Kelo’s power (NCSL, 2007). Accordingly, public entities have little recourse to help with greedy or hold-out landowners, so the private sector is currently left on its own, even when regional economic development is at stake. While the political pendulum swings back and forth on this issue, and can be expected to swing back to more public powers at some point, it is not likely in the next decade. Accordingly, TODs must be prepared to absorb above-market land acquisition prices in addition to the other premiums involved.
Leadership Perhaps the most important item on this list is leadership, finding champions to lead the effort and work the myriad of development details. If the leadership is in place, virtually every other item can be worked out. And leadership needs to come from all three sectors. In the public sector, an elected official – preferably the mayor or a council person---has to believe in the project, and be willing to be its advocate for issues ranging from TOD zoning to financial assistance to make it happen. Staff is also critical – often different people at different stages of the project. Without the support of the Planning and Economic Development Directors of the City, TOD just doesn’t happen.
In the private sector, the champion is presumably the developer or landowner who is advocating for the TOD and willing to risk formidable amounts of money for predevelopment--determining the viability of the project in the first place. Project consultants, financiers, and tenants themselves are also important private sector champions bringing capital, expertise and users to the project.
The non-profit sector is equally important and often overlooked. This group includes the chamber of commerce or merchant’s association, neighbourhood groups, real estate and community service organizations, environmental coalitions, and other interested groups. These non-profits are important because they put the project on the table, convene and educate the public, lobby for good design, and provide critical support to elected officials making tough decisions.
If a site is proximate to a transit station with strong ridership, enjoys market demand, land availability, and champions from all sectors, it should be viable.
Transit Oriented Development214
TOD: The risk-return trade-off
Few US developers today know how and are taking the risk associated with a mixed-use TOD. Despite the powerful demographic forces supporting this type of development, it is a very new development type – less than twenty years old for most of America – and until there are more successes, it remains a daunting endeavor. To appreciate the developer’s perspective, it helps to understand the basic value proposition of a TOD – what creates the premiums and what are the costs and risks?
The value premium realized in many TODs comes far more from the “place” – the attractive, interesting district around the station – than from the transit system itself. The demand for walkable villages is well demonstrated around the world in resorts and tourist destinations where prices skyrocket. On the other hand, most new transit corridors have far fewer TODs than stations on the line. Transit is an amenity, but it does not create the demand or drive the value. Unless the transit system is well established and comprehensive – New York, Boston, Washington, DC – the place more than the transit drives the development value. Buyers first relate to the coffee shop on the corner, the neighbourhood services, park, library and daycare, and as an extra bonus, the opportunity to walk to the train station. Particularly in new transit markets where the transit can only be used for a limited number of destinations, TOD can be viewed largely as a planning tool focusing attention on a previously undifferentiated area, and encouraging a different, more people-oriented type of development. Indeed, TOD often has a much bigger impact in the suburbs than in the urban core where the pattern of compact districts is already established. Creating a unique, walkable village in the midst of automobile-oriented sprawl simply because a rail station has been sited, is truly transformative to the community, but a much bigger challenge and risk for the developer.
The public sector would like to think that once the train is built, the right kind of surrounding development will just happen. But it will not. Developers view TODs as mixed-use projects with the added complexity of a transit anchor that therefore need everything any project needs, and more. Like any other development, they need market, land, infrastructure, zoning, strong community vision, political advocacy and frequently, public funding, to be a financially attractive investment.
When TODs are successful, the value comes from very specific attributes:
greater project density which allows construction of more square feet of income producing spacethe mixture of uses enabling a faster absorption period than if it were all one product typereduced amount of parking to build because of transit use and shared parking among various usesrental premiums associated with introducing new building types (i.e. lifestyle flats or live-work units vs. all single family homes)rental premiums associated with bringing new users to that submarket
•
•
•
•
•
Developing TOD in America 215
good project access, circulation and visibility from people in autos as well as in trains and busescivic uses and active public spaces attracting a variety of populations to the districtincreasing value of the transit amenity over time to shore up rents as the project matures.
When all these factors come together, revenue premiums of 10–50 percent have been realized once the project is built, leased and established. Every project and every market is different, of course, but the trend is indisputable:
Dallas: +39 percent – 53 percent (APTA, 2008)Los Angeles: + 40 percent (CTOD 2007)Chicago: + 20 percent (TRU, 2006)Portland: + 10 percent (APTA, 2008)Santa Clara County: +23 percent (CTOD 2007)
Overall, over time, a developer can expect an average rent premium of 15–25 percent over comparable projects a mile away from the station. And the increment has a better long term outlook than conventional projects because of the location. There are a finite number of station areas in each regional market, and as a scarce commodity, they accordingly become more valuable over time. Moreover, the limited supply of these high-demand places means that their prices will appreciate faster in bull-markets and hold better value in bear-markets (Urban Land Institute and Price Waterhouse Coopers 2005).
This positive projection was validated in Emerging Trends in Real Estate 2003, the prestigious annual report issued by price Waterhouse Coopers and the Urban Land Institute to guide investment capital. In a watershed recognition of these powerful factors, for the first time they gave their highest recommendation to markets that offered: 24 hour cities, mixed-use places, access to transit. Reports since then have reinforced the value of TODs as strong long-term holds.
The revenue premiums, however, must offset the correspondingly high costs associated with TODs. Specifically,
Entitlements When the developer has to educate the community on the advantages of greater intensity and activity, the time, expense and risk of failure are daunting. Neighborhood objections to greater traffic, more people, and fear of falling land values are legend. Design and consultant fees for multiple designs and extensive public meetings are almost immediately in the hundreds of thousands of dollars, and quite frequently in the millions. This alone is a barrier to entry to many smaller but otherwise interested TOD developers. Moreover, the timing is unpredictable, and makes it very difficult to secure tenants with a move-in deadline. Well-conceived projects have fallen apart simply because the public process took too long, the tenants cancelled, and the bank accordingly pulled its financing. On the
•
•
•
•••••
Transit Oriented Development216
other hand, savvy jurisdictions recognize the value of predictability and expedited processing and are using it to capture desired development. Austin, Texas rewarded the development of a Lowes built as LEED Gold. Because Austin cut the approval process from 15 to 3 months, the Lowes opened up 12 months early earning over $3 million in profit for the developer. While developers are sometimes attracted to TODs because they enjoy strong political support, neighbourhood resistance to density and new uses can confound even the strongest advocate. Ideal is a site that is already zoned for mixed-use and density, or at least has been identified for such in the Comprehensive or Neighbourhood Plan.
Design complexity TODs are by definition mixed-use and comparatively compact, both of which cost more to design and build. In most jurisdictions, buildings over 5 stories trigger a different building code that requires more expensive materials (i.e. steel and/or concrete), more extensive fire and safety and heating/ventilating/air conditioning (HVAC) systems Moreover, when a building houses more than one use, it must accommodate different building depths, entrances and exits, parking systems, building codes, and wall separations. Both design and construction costs rise even higher when buildings are “vertical mixed-use,” hence developers often prefer to cluster several single purpose buildings of different uses for “horizontal mixed-use,” in order to be more cost effective.
Parking Parking requirements drive development decisions, especially in mixed-use projects. Compact, walkable places necessitate structured or below grade parking, which is expensive to build. With going rates of US$15,000–$30,000 for a structured space, and US$25,000–$60,000 for a below grade space, this is virtually prohibitive in all but the most urban places. Based on an average 350 square foot (sf) space, if project land values are less that US$40–$85/sf for structure, or US$70–$170/sf for below grade, the developer must use profit to subsidize the cost of constructing on every space that is built. Land prices in most American suburbs range from US$10 to $50/sf, creating a tremendous gap, and a major barrier for TOD and compact development. Accordingly, developers must be diligent about not building even one more space than is truly needed for the project. Maximizing and counting street parking toward requirements is the cheapest strategy for a developer, and is the logical first step.
Another powerful strategy to minimize the amount of required parking is to diversify the uses so they can share over the course of a day. Hence, day and night combinations (cinema and office) are particularly attractive, as are those with lower parking requirements (i.e. hotel, senior housing, student housing, and housing over office). Of course, this juggling presumes there is a market for all the uses in the first place, and this is not always the case.
Another approach to avoid paying the high price of unneeded parking is to separate it from unit rents. In most markets the cost of parking is “bundled” into the price of residential or commercial units, meaning that the buyer is paying for parking spaces which come as part of the purchase or rent of the unit. Bundling is
Developing TOD in America 217
primarily a suburban practice where land and surface parking are plentiful, but is far too expensive for compact TODs. Unbundling parking requirements, originated in pricey downtowns like Manhattan and San Francisco, and has now spread to areas throughout the country. This means that buyers do not have to automatically purchase or rent a parking space as part of the cost of acquiring a unit. At Highland Garden Village, an infill neighbourhood project in Denver, CO, that offers a wide variety of housing types, “unbundling” and offering a range of parking options at graduated prices cut demand substantially and saved the project millions of dollars and helped residents cut their occupancy costs. Had the developer presupposed that every unit needed two garage spaces instead of one, or a carport, or even an uncovered space, far too much parking would have been built and would have displaced other uses with greater revenue potential.
The parking problem is exacerbated by jurisdictions that set parking minimums, particularly at suburban, non-TOD levels. Residents and workers in transit districts tend to self-select, so a TOD parking reduction of 20–40 percent is realistic. Too much parking creates a hostile urban environment, even if it does not kill the project financially. Furthermore, if the transit agency requires park and ride spaces, particularly at no cost to the rider, this makes TOD projects even more difficult unless the transit agency pays for a structure and allows shared use with commercial properties. Accordingly, publicly funded parking is legitimately one of the prime tools for public agencies seeking to make TOD viable.
Public amenities Place-making and transit districts require higher levels of investment in sidewalks, landscaping, lighting, plazas, fountains and public art than conventional development. Moreover, to create an attractive, identifiable destination, these elements should be in place at the outset, not phased over time as is conventionally done. This “front-loading” of the amenities adds additional interest expense and further reduces project yield.
Community benefits To the extent the community desires non-market driven elements in the project, this also adds cost. Affordable housing, community and cultural facilities, “green design” can all fall into this category. While all valuable to creating the destination and brand of the TOD, to the developer, they are all expenses that have to somehow be paid from the project budget.
TODs must also absorb a higher financing expense than traditional developments. When a TOD is transformational to an area, it is by definition leading the market. Even if the community loves the concept and embraces it quickly, that does not mean that the developer reaps the rewards. For innovative developments, tenants tend to be conservative in projecting sales over stores in the surrounding area, and argue to at least start at lower rent rates. On day one, leases may be able to carry a small premium over competing developments, but it is just as likely some uses will have to be given below market rates for a period of time to bring them in (for instance, when first floor retail is required, especially a grocery store). Then, as the tenants in the TOD are successful, rental rates can
Transit Oriented Development218
be raised and/or percentage rents kick in. Residential leases can usually be raised after the first year while commercial leases often do not have that opportunity for 3 or 5 years due to the structure of leases. This means that many mixed-use TODs do not break even for five years or more. So the project budget has to include reserve funds to cover the operating deficits for a longer period than is conventional in the industry. Moreover, there is not a long track record of TOD successes to show that this is a normal pattern for TODs. Accordingly, investors and lenders lend less and charge more than they would for traditional developments, raising finance costs, reducing developer leverage and delaying profitability.
All in all, TOD developers must weigh the opportunity for revenue premiums against the higher costs. The averages give a slight advantage to the income side (increase of 15–25 percent on revenues vs.10–20 percent increase in costs), but every project is different, and each carries a substantial risk. Accordingly, many developers consider the risks too great, and decide to stick with single-use, conventional development.
TOD developers
One of the keys to successful TOD is finding appropriate developers. Few people outside the industry realize how greatly developers differ, and how few of them are structured to be able to do mixed-use and TODs in the first place. Basically, developers can be categorized by the type of product they produce, and by how they are funded.
Product type All development is risky, so the most common way for developers to mitigate the risk is to specialize in one type of real estate and to do the same type of project over and over and in several locations. For instance, land developers only buy and entitle land, perhaps put in basic infrastructure and then sell to other developers who construct the buildings. Vertical (building) developers specialize not only in retail, but in sub-specialties such as regional malls, grocery-anchored neighborhood centers, “big box” or lifestyle/Main Street projects. Residential developers break down into single family, multifamily rental apartments, multi-family for-sale, attached multi-family (town homes), affordable housing, student housing, senior and retirement housing. Office, industrial, resort, and hospitality all have similar sub-specialties and focus. These development types are surprisingly different in critical skills and network needed to succeed. By specializing, the developer learns the details of each business from concept through construction and management. Long standing relationships are built with specialty contractors, designers, brokers, lenders, tenants and investors. Over time, the track record of success reduces the risk and facilitates the next project.
Capital source While, virtually every project borrows money, the difference among developers is the source of their equity capital. While there are many variations, equity investors fall into three main categories:

Developing TOD in America 219
Personal/private capital This is money controlled by the developer, and has flexible requirements in terms of timing and rate of return. This type of equity comes from the developer, from “friends and family”, or wealthy individuals and is by far the most versatile. This category allows developers to realize profit over a long period of time, 7–10 years, even stretching to multi-generational holding periods.
Institutional capital Pension funds and insurance companies fall into this category. Their risk and return thresholds are low, and they have billions of dollars to place. Accordingly, they often prefer large budget, “core assets,” proven, conventional developments, and generally prefer to purchase buildings once they are built. Only recently have they begun to consider development of mixed-use and TOD anywhere other than in top urban markets. They like profitability and returns in 3–7 years.
Public capital/Real Estate Investment Trusts (REITS) These are publicly traded companies that hold portfolios of like-kind real estate (i.e. all hotels, all retail, geographic-specific properties). They are traded as a security, and have broad information disclosures. They do development and can be aggressive in their underwriting, but generally like capital and profits returned in seven years or less (Federal Investment Realty Trust, developer of Bethesda Row, Santana Row and several other mixed-use projects and TODs is an example).
In finding a developer suited for TOD, both product type and capital source play a major role. For most developers mixed-use is outside their area of proven expertise, relationships, and credibility. It puts their profitability and reputation at risk, and most are unwilling to do it. Those that decide to try it form a partnership with another developer that does a different product (i.e. retail and apartment developers); sell off part of the property to another developer, or by learning to do it themselves. Each approach is complicated and expensive, and hard to justify without confidence that the project will turn out well. Gradually, however, mixed-use at some level is becoming more common. Cities routinely want activated first floors with retail, and are increasing their mixed-use demands for public projects. Conferences on mixed use and TOD have become quite popular and professional organizations are helping developers learn techniques to branch out into other product types. Thus far, the most common alliances seem to come from multi-family residential developers partnering with retailer developers, and vice versa, though office, civic and entertainment partnerships can also work.
Despite popular belief to the contrary, the majority of developers are rather small enterprises without enough capital to provide their own equity. Large multi-disciplinary firms that can entirely self-finance a project are exceptionally rare (i.e. Forest City, Related Properties) thus, developers are primarily intermediaries for their investors, and their development capacity is largely dictated by the equity source. It determines the amount of risk that can be taken, the level of profit the investor must receive from the project, and when the asset must be sold to return
Transit Oriented Development220
the original capital. TODs can take 3–10 years to develop and another 5 or more years to get to profitability. Institutional and publicly traded Real Estate Investment Trusts want their capital and profit returned in a seven year timeframe or less, which often severely limits the project. This pressures the TOD to be smaller, more conventional in uses and design, and/or receive public investment.
Accordingly, the developers best suited to TOD thus far seem to use personal and private equity sources, enabling them to be “holders” instead of “flippers.” The profit curve of a TOD usually does not break even until five years after opening, but then keeps on a steady trend upwards for the long term. Meanwhile, a conventional, single purpose development will go through a predictable lifecycle and need replacement in as soon as 10–15 years. Developers that have a business model and partners allowing them to incorporate several uses in the project and to hold onto the project to capture the future value increment are the best TOD candidates.
Beyond these two characteristics, there are several other factors that determine whether a developer is well-suited for TOD. Since public process is a particularly extensive aspect, the developer (or team) needs exceptional communication and political skills. Patience and flexibility are essential. Previous experience is invaluable, particularly at scale. Everyone needs a first project, but when the development exceeds a couple of buildings, an expert partner is essential.
With all the challenges involved, the number of experienced, capitalized and capable TOD developers across the country is understandably small. Dozens of cities are seeking the expertise and leadership of a “master developer” to transform their station areas, particularly if they are more than a few acres in size. The fact is, there are now far more communities seeking them than there are qualified and interested developers available. Accordingly, government solicitations through a Request for Qualifications (RFQs) are replacing the Request for Proposal (RFP) approach which costs the developer more time and money, and therefore receives fewer responses. To build the inventory of developers, communities are also encouraging partnering between larger firms with capital and expertise and local firms with political and market knowledge.
Public-private partnerships
Given the development challenges of TODs, most projects of any size require not only public advocacy, but public capital as well, calling for public-private partnerships. From the developer’s standpoint, this is also a mixed blessing. On one hand, government funding introduces more players, more variables and more uncertainty in every aspect of the project – design, entitlements, tenanting, financing, and community support. It means the project will take longer because more sources of financing must be layered, more government processes must be respected, and more community review will be required. As a result, the project will inevitably cost more than if it had been financed privately. On the other hand,
Developing TOD in America 221
however, is the additional “gap” capital that the public sector can provide to convert an otherwise infeasible project to financially viable? The sources of public funds are as varied as the public sector itself. Commonly used sources at the federal level include LIHTCs (Low Income Housing Tax Credits), Environmental Protection Agency (EPA) funds for cleaning-up contaminated properties, Federal Transit Administration (FTA) pedestrian safety and enhancement funds, as well as dozens of other sources. At the state level, funds usually come from the departments of local affairs, economic development, or transportation, and are often low interest loans rather than outright grants. Generally, most public investment for TOD comes from the local jurisdiction because the revenue and community development benefits are most direct and most easily tracked at that level. Frequently used local government financing tools include:
tax increment financing (TIF)tax abatementslow interest loansparking revenueslocal improvement district bondingbusiness improvement district (BID) bondingcity capital improvement funds (CIP)low income housing tax credit (LIHTC) allocations.
Often, the local jurisdiction must request and be the recipient of state or federal funds, which intentionally reinforce the partnership needed between the private developer and the public sector entities. This accordingly involves diligent legal documentation and comprehensive development agreements to cover each party’s interests. Important to note is that most government funding is allocated to “but for” cases – projects that would not be feasible or proceed “but for” (without) the public money. To document and justify the use of public monies, the project accounting must become public record, which costs more money and effectively reduces the private sector control of the project. This in itself is a major deterrent to many developers, and to the realization of high-quality TODs.
Given the additional requirements and risks associated with public-private partnerships, it is no surprise that savvy developers shop jurisdictions before taking on mixed-use and TODs. The promise of financial incentives is no longer enough; entitlements and political will are often more difficult to secure than cash, so developers seek strong public sector champions and staffs they trust. They look for cities with demonstrated commitment and capacity, specifically cities that:
Understand TOD, have staffs and policies in place to support itHave a community vision for mixed-use and density at the TOD site, evidenced by comprehensive and/or neighbourhood plans and design guidelinesHave the mixed-use and TOD zoning in placeHave assembled land needed for development
••••••••
1.2.
3.4.
Transit Oriented Development222
Select developers based on Request For Qualifications or sole source contracts rather than Request for ProposalsCan expedite planning and permitting, and have a provision for a project ombudsmanHave identified financial incentives for qualifying projectsHave a sophisticated public sector real estate negotiator – be it consultant or employee – that understands developmentHave clear political champions for the project, especially the Mayor or City Council.
American communities with the best TODs have responded rather than resisted these requirements – for instance, Portland, OR and Arlington County, VA. The quality of the projects was directly attributable to the quality of the developers and the quality of the public private partnership that was forged. Each jurisdiction attracted sophisticated private developers that could work anywhere in the country, and very intentionally chose these communities to be their partners.
future of TOD in America
TOD has come a long way over the last decade in America, and based on the demographic trends discussed earlier, the market for TOD should continue to improve. Transit systems continue to expand for both mobility and community development reasons. In addition to the systems now underway, there are over $60 billion in transit funding requests at the FTA and dozens of communities contemplating transit tax ballot initiatives for locally funding.
TOD is no longer a new concept. It has been talked about for over a decade, and is quite well known among planners. Virtually every major real estate association, including the Urban Land Institute (ULI), the National Association of Industrial and Office Parks (NAIOP), the International Council of Shopping Centers (ICSC), and the Building Owners and Managers Association (BOMA) run courses and conferences on mixed-use and TOD in response to member requests.
Demographic and cultural trends more strongly than ever support public preferences for lively, unique destinations and lifestyle choices. Climate change, aging infrastructure, healthy lifestyles, rising fuel costs, and housing affordability are all directly benefited by TOD. It is a proven, specific strategy to address these issues, and is accordingly receiving more attention all the time.
Development implementation is benefiting from a growing inventory of case studies and research. There are more successful TODs for developers, cities and transit agencies to study. Development approaches are far less “cookie cutter” than a decade ago, and public private partnerships are far more common.
Many major developers have formed subsidiaries or alliances to expand into mixed-use and TOD. The pressure from jurisdictions for smart growth and sustainable communities started the trend, and it continues to grow.
5.
6.
7.8.
9.
Developing TOD in America 223
Going forward, expect to see:
More local jurisdictions realizing the value of mixed-use places, transit and TOD, and making it a top economic development priorityMore privatization of transit and TOD. Public-private partnerships will take on new dimensions stretching far beyond financial investment or land leases as government funding declines and TOD demand grows.More equity capital willing to invest in mixed-use and TOD as a favorable track record is established.More developers, large and small, enabled by more capital sources, doing mixed-use and TOD.More backlash from communities resisting density as TOD accelerates the urbanization of suburbiaMore rigorous design and development requirements from local jurisdictions as they begin to “run out” of stations and seek to make the most of what they have.More states participating in land use and transit issues, and thereby providing more support for TOD.Change in eminent domain valuations and policies to recapture more public sector powers to assemble land for TODDramatic increases in parking fees and the demise of free parking in order to offset the high cost of building structuresLegislation allowing TIF to be used in non-blighted areas simply because of the proximity to transit stationsMore research and documentation of the long term value premiums in mixed-use, transit districts.
Developers are too often painted as “black hats” by parties who do not understand the structure and constraints of the industry. When TODs don’t happen fast enough, or are not well executed, it is the developer who is blamed rather than the many players necessary for a successful project. Encouraging is that almost all of the trends suggested above will make TOD more viable to the private sector developers and their public sector partners alike, thus helping American TOD thrive in the next decade.
•
•
•
•
•
•
•
•
•
•
•

This page has been left blank intentionally
Chapter 17
Transit Oriented Development in Tokyo: The Public Sector Shapes Favourable
Conditions, the Private Sector Makes it Happen
Paul Chorus
Introduction
Tokyo is a topical example of a railway-oriented city. During its period of strong economic growth after World War II it was largely the railways that facilitated its development direction. As a result vast stretches of land around the railway lines radiating outwards from the city centre have been developed. What greatly stimulated the integral development of railways and their surroundings was that private railway developers owned the railway infrastructure as well as large parts of the areas surrounding it. These areas they developed, subdivided, and eventually sold as residential lots. In addition, the structure of the railway network of Tokyo proofed to be supportive for urban developments, especially for the formation of the sub centres. The railway network of Tokyo consists of several private radial lines that run from the suburbs to the centre of Tokyo. The centre of Tokyo is connected by a circular loop line, the Yamanote Line, on which all private railways, except the Chuo line, terminate (Figure 17.1). This structure created natural growth points at the intersection of the main radials with the loop (Sorensen, 2001). These natural growth points are the places where the sub centres have emerged.
At present everyday millions of people come together at these sub centres which illustrates how important they have become for Tokyo’s urban and railway network.
More recently, after a long period of economic growth in which land prices continued to increase for almost 40 years and Tokyo was spreading out into the suburbs, things drastically changed. The property bubble, marking a strong period of economic growth and soaring land prices, collapsed in 1991 and Japan entered a phase of prolonged recession. This diverted the interest back to the city centre of Tokyo. As a result many urban redevelopment projects have been carried out or are either underway in Tokyo. Most of them focus on areas around railway stations and then in particular the areas around the existing sub-centres. The government has introduced several instruments to promote the private sector’s involvement in
Transit Oriented Development226
these projects. In this chapter the workings of these instruments will be illustrated by giving an overview of the latest developments around some of these sub-centres. This will provide the reader with more knowledge about current transport-oriented developments in Tokyo. First, an historical sketch of how the approach originated and evolved will be given.
Transit-oriented development in Tokyo
After World War I the demand for transportation was rapidly increasing. Contributing to the expanding demand was the economic boom that attracted many people from the countryside to the city. The decisive factor in the transformation of the transportation network and city layout, however, was the Great Kanto Earthquake of 1923, which encouraged many people to move to the suburban areas in the western part of Tokyo. The development of these suburban areas went hand in hand with the development of the railway network. Private developers started to develop large residential areas in conjunction with their railway lines. Later this was followed by commercial facilities such as department stores and the development of tourist facilities. A typical development pattern was that at the end of a private railway line amusement facilities were developed. These were to attract passengers in the off peak hours and in the weekend when there were no commuters. The reason why they were located at the end of a private railway line was that this would generate higher fare revenues. The fare was based on the distance travelled and the further one had to travel the higher the price.
figure 17.1 structure of Tokyo’s railway network
Transit Oriented Development in Tokyo 227
The stations on the suburban line functioned as local centres for the surrounding residential areas. Large commercial and amusement facilities were concentrated at the terminal stations in the sub centres of Tokyo. Thereby it was common practice to construct buildings accommodating station facilities as well as department stores or retail shops in the upper floors. This pattern has been sustained until today, and owning a department store is still a status symbol for a private railway company (Aoki et al, 2000).
It was not a coincidence that the emergence of sub centres coincided with the terminal stations. Private railway operators were not allowed to extend their lines into the Yamanote loop. The reason for this was that the government did not want the competition from the private railway operators as both the Yamanote loop and the streetcar network within the loop were government-owned. Therefore private railway operators had to establish their terminals along the Yamanote line and suburban commuters that needed to go to the city centre had to switch trains here. The initial development of the sub-centres was thus largely the result of their location at the junction of private and public railways. The most famous sub centres at present are Shibuya, Shinjuku and Ikebukuro which attract each millions of visitor’s everyday.
Private sector development of sub centres and suburban areas occurred well before any government plans were made to encourage their formation. The government had its hands full on reconstructing the city after the devastating earthquake of 1923. By the time the reconstruction works were completed the sub centres had already developed spontaneously. A persistent feature of the government plans since the 1930s had been their focus on poly-nuclearity (Sorensen, 2001). Initially this started with promoting the development of the sub centres around the Yamanote loop line to relieve growth pressure on the Central Business District. In the 1960s this shifted into the idea of promoting the development of satellite cities far away from the city centre while restricting growth in the central areas. Finally, in the early 1970s the idea was launched to promote the development of a wide variety of sub centres and satellite cities throughout the metropolitan region. This so-called ‘multi-polar urban structure’ has since then dominated the urban growth policies of the government in Tokyo (Sorensen, 2001).
The most recent plan for Tokyo is the ‘Tokyo Plan 2000’. In this plan a new structure for Tokyo, the ‘Circular Megalopolis’, is proposed focusing on the development of a framework of urban axes and core cities (Figure 17.2). The core cities are the places where city functions should be accumulated while the axes should promote the exchange between them. A core city consists of multiple sub centres. For example, the area covering the whole Yamanote line is perceived as the central core.
Although the development of the sub centres is still strongly promoted they have in fact become a part of the Central Business District. This contradicts with the role the sub centres used to have in relieving the growth pressures on the city centre. Despite the promotion of a wider range of sub centres and satellite cities throughout the region the government has never stopped to promote the
Transit Oriented Development228
development of the main sub centres. This might have exacerbated the problem rather then solving it. One may therefore well conclude that the basic idea behind establishing Tokyo’s main sub centres has failed.
Planning in favour of railway stations
In Tokyo railway stations play a pivotal role in the urban structure of the metropolis as stations are the places around which the business and shopping centres have emerged. This was, as has been mentioned before, initially a spontaneous development triggered by their position in the railway network. From the mid 1960s onwards the government started to actively promote the growth of these centres. The main ‘weapon’ it used for this was the floor area ratio (FAR). This system was introduced in 1963 in response to the increasing pressures from the private sector to allow a more intensive use of the land. Until that time strict building regulations made it very difficult for the private sector to redevelop areas in a profitable way. For example, the allowable height of a building depended on the road it fronted based upon the principle the wider the road, the higher the building. Particularly in the areas that were characterized by small lots and narrow roads, this severely limited the building height and development capacity
figure 17.2 The circular megalopolis concept
Transit Oriented Development in Tokyo 229
of buildings. Many station areas contained such crammed areas and were because of this protected from being redeveloped. Furthermore, the Japanese Building Code did not allow buildings to be taller then 20 meters in residential districts and 31 meters in other land use districts, because of possible earthquakes.
Under the floor area ratio system it is no longer the building height that regulates the scale of a building, but the size of the plot a building is standing on. The maximum height of the FAR is linked to the type of land use zone and varies from 100 percent in the most restricted zone to a 1300 percent in the most flexible zone. In case a FAR value of a 1300 percent is designated, it means that a building is allowed to have a floor space equalling thirteen times the size of the building lot. The FAR system was first tested in some parts of Tokyo before it was fully adopted. One of the first areas that underwent a FAR-designation was the area around Shinjuku station. Already before World War II there were plans to redevelop this area into one of Tokyo’s main sub centres, but due to the war these plans were postponed. The redevelopment plans involved the relocation of schools, offices and a water purification plant to the west of Shinjuku station. In 1965 the West-Shinjuku area was designated with a FAR of 1000 percent1 which made it possible to construct several high-rise buildings here. In 1970 the FAR system was completely adopted and the building height controls were abolished as improved construction techniques on high-rise no longer justified their existence (Sorensen, 2003).
With the FAR the Tokyo Metropolitan Government disposes of a powerful tool to stimulate certain development patterns. For example, the further growth of sub centres and regional centres has been encouraged by assigning them higher floor area ratios then their surrounding areas. The central business district, that is the area around Tokyo Station, traditionally has the highest FAR values, as the land prices are among the highest here, followed by the sub centres around the Yamanote loop. The regional centres also have higher values then their suburban surroundings, but they are considerably lower then their counterparts in the city centre, as their development potential is simply less strong.
Besides being a place where activities tend to concentrate in high-densities, stations are also highly multifunctional areas. An explanation for this is to be found in the zoning system. Usually stations are located in the least restricted land use zone that is the commercial district. Virtually any kind of function combination is possible within such a zone except for factories that pose a certain threat for the environment. The railway infrastructure is included in this zoning, allowing for similar development rights as its surroundings. In addition, commercial districts are also the areas where the controls on building activities are the weakest which is why, for example, the highest FAR values are allowed here.
Interesting is that the sub centres, especially the ones along the Yamanote line, have their own specific functional profile. The station of Shibuya, for example, is a centre for the youth, which is most clearly expressed by the several department stores, aimed at these groups. Shinjuku is a business centre and boasts many
1 Before 2004 this used to be the highest floor area ratio possible.Before 2004 this used to be the highest floor area ratio possible.
Transit Oriented Development230
offices, while Ueno is a cultural node articulated by the many museums that are located here. The different characters of these centres have evolved gradually over time and were determined historically by their surroundings.
Usually stations are located near the centre of a city. However, in Tokyo the station itself is the centre as it is the place where most entertainment facilities, department stores and restaurants are concentrated. These facilities can thrive here as they are fed by thousands, and in some cases even millions, of people that daily come together here. Without the support of the land use zoning system and its corresponding volume controls the stations would have never been able to develop into the bustling centres they are today.
stimulating private sector developments
City planning in Japan is characterized by a continuous struggle for urban space. This started in the 1960s when the economy was growing rapidly and the pressure from the private sector for a more intensive utilization of the land was increasing. Until that time urban areas were limited in their development capacity as a fragmented landownership and strict building regulations made it very difficult for the private sector to redevelop them in an intensive way. This changed, however, in 1970 when the FAR regulation was introduced and suddenly many low-rise and mid-rise areas became ripe for a redevelopment into higher-rise buildings. The FAR became the key tool for the government to encourage a more efficient and safe land use. As the government was confronted with growing budget deficits the policy efforts were aimed at stimulating the private sector to invest. For this the FAR functioned as the main trigger.
Although the FAR values are specified in law several instruments exist that allow for a relaxation of the existing FAR-values. These instruments are used to persuade the private sector to invest in certain areas. In general, exemptions to the existing floor area ratios are given when a private developer includes the preservation of historical sites, the creation of public facilities and the guarantee of a certain amount of open space in its development. Depending upon the proportion a developer contributes, an additional floor area ratio, the so-called FAR bonus, is received. Furthermore, there are instruments that allow the FAR to be transferred from one building to the other. An owner that does not need to use its full development capacity can sell its unused capacity to another owner in the area who has already reached his development ceiling, but wants to use more. In this case the FAR is also allowed to exceed the existing value, but instead of being rewarded with an extra building volume, the developer simply bought the right to it. Both groups of instruments, the FAR-bonus and the FAR-transfer instruments, are not specifically aimed at one area in particular, but at all areas lacking an efficient utilization of the land. Station areas are just one of them.
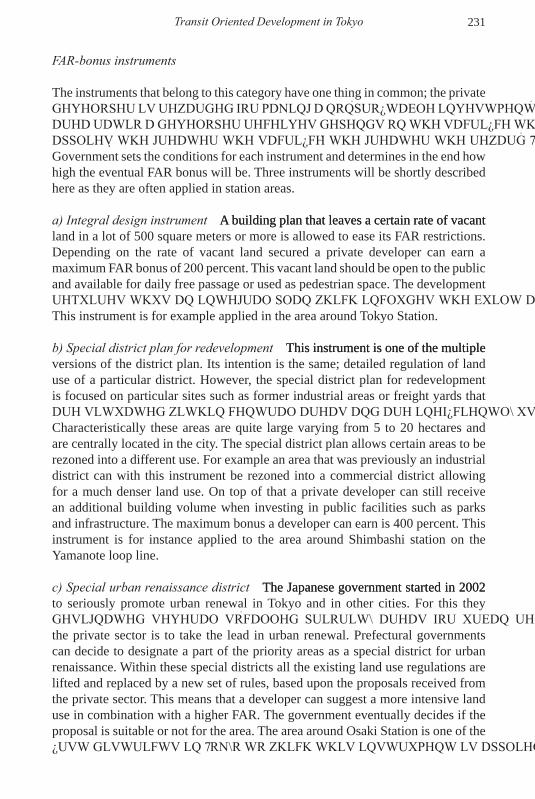
Transit Oriented Development in Tokyo 231
FAR-bonus instruments
The instruments that belong to this category have one thing in common; the private developer is rewarded for making a non-profitable investment. The additional floor area ratio a developer receives depends on the sacrifice they have made. In general applies; the greater the sacrifice, the greater the reward. The Tokyo Metropolitan Government sets the conditions for each instrument and determines in the end how high the eventual FAR bonus will be. Three instruments will be shortly described here as they are often applied in station areas.
a) Integral design instrument A building plan that leaves a certain rate of vacantA building plan that leaves a certain rate of vacant land in a lot of 500 square meters or more is allowed to ease its FAR restrictions. Depending on the rate of vacant land secured a private developer can earn a maximum FAR bonus of 200 percent. This vacant land should be open to the public and available for daily free passage or used as pedestrian space. The development requires thus an integral plan which includes the built and non-built part of a lot. This instrument is for example applied in the area around Tokyo Station.
b) Special district plan for redevelopment This instrument is one of the multipleThis instrument is one of the multiple versions of the district plan. Its intention is the same; detailed regulation of land use of a particular district. However, the special district plan for redevelopment is focused on particular sites such as former industrial areas or freight yards that are situated within central areas and are inefficiently used in the present situation. Characteristically these areas are quite large varying from 5 to 20 hectares and are centrally located in the city. The special district plan allows certain areas to be rezoned into a different use. For example an area that was previously an industrial district can with this instrument be rezoned into a commercial district allowing for a much denser land use. On top of that a private developer can still receive an additional building volume when investing in public facilities such as parks and infrastructure. The maximum bonus a developer can earn is 400 percent. This instrument is for instance applied to the area around Shimbashi station on the Yamanote loop line.
c) Special urban renaissance district The Japanese government started in 2002The Japanese government started in 2002 to seriously promote urban renewal in Tokyo and in other cities. For this they designated several so-called priority areas for urban redevelopment in which the private sector is to take the lead in urban renewal. Prefectural governments can decide to designate a part of the priority areas as a special district for urban renaissance. Within these special districts all the existing land use regulations are lifted and replaced by a new set of rules, based upon the proposals received from the private sector. This means that a developer can suggest a more intensive land use in combination with a higher FAR. The government eventually decides if the proposal is suitable or not for the area. The area around Osaki Station is one of the first districts in Tokyo to which this instrument is applied.
Transit Oriented Development232
FAR-transfer instruments
This group of instruments gives developers an additional development opportunity without having to do something in return. Additional floor area can simply be bought from other users in the area who do not fully use their development capacity. Three instruments are described here as they are often applied to station areas.
a) Specified block instrument An area that is at least 5000 square meters in sizeAn area that is at least 5000 square meters in size and surrounded by a road that is at least 6 meters wide can be designated as a specified urban block. The working of this instrument is quite similar to the integral design instrument. Also in this case a private developer is allowed to increase his allowable floor area ratio when he includes vacant land in his development. However, the total floor area bonus depends on more than that. A developer needs to also include cultural and community facilities in his development and in some cases, the urban centre, even residential facilities. These investments together determine how much the FAR is allowed to be increased. In addition, the FAR is allowed to be transferred within a specified urban block or in cases where multiple blocks are integrally planned, the allowable floor area ratio can be transferred among the blocks.
In the redevelopment of the Marunouchi Area, that is the area around Tokyo Station, there are several lots that have been redeveloped with the help of this instrument.
b) Special FAR applied district An area that is surrounded by a wide road or aAn area that is surrounded by a wide road or a railway and is zoned as commercial district can be given the status of an exceptional FAR applied area. In such an area it is allowed to transfer the unused floor areas to other parts in the area (Figure 17.3). This offers developers who need an additional floor area, but have reached their maximum, still development opportunities. This instrument is similar to the workings of the specified block instrument; however,
figure 17.3 special fAR applied districtSource: Adapted from Otemachi Marunouchi Yurakucho Redevelopment Project Council, 2005
Transit Oriented Development in Tokyo 233
the scale it is applied to is different. The exceptional FAR applied area allows a transfer within a certain area rather then limiting it to the same or adjacent building lot. This instrument has been applied to the area of Tokyo Station and made it for the first time possible to transfer development rights from the one side of the railway tracks to the other. Under the previous instrument, the specified block, such a transfer was not possible. The area around Tokyo Station is at present the only area that has been designated as such.
c) Use substitution Unlike the previous instruments the use substitutionUnlike the previous instruments the use substitution instrument intends to stimulate a multifunctional rather than an intensive land use. This instrument allows for functions to be transferred from one block to another and is mainly applied in areas where nowadays the land use is rather mono-functional such as the Marunouchi district. In this district the city planning guidelines prescribe that when a building with a FAR more than 1150 percent is constructed, the additional capacity needs to be devoted to non-office uses. Since in the Marunouchi district a FAR of 1300 percent is allowed, this means that 150 percent has to be devoted to other usages if one wants to fully utilize this floor area. However, this non-office part does not need to be realized in the same building as the ‘use substitution instrument’ allows for an exchange of usages between different buildings in the district (Figure 17.4). This means that non-office functions can be traded against office functions thus enabling a developer to devote a larger part than 1150 percent to office use. In the Marunouchi district several buildings have been redeveloped with the use of this instrument.
TOD in practice
In the last decades the urban landscape of Tokyo has changed drastically. Virtually everywhere high-rise buildings have appeared and the signs are there that this trend is not about to stop yet. Many new plans are underway stimulated not in
figure 17.4 The use substitution instrument applied in MarunouchiSource: Adapted from Otemachi Marunouchi Yurakucho Redevelopment Project Council, 2005
Transit Oriented Development234
the least place by the urban renaissance policy of the national government. The obsession for height is not surprising as many inner city areas were, and still are, characterized by inefficient land use patterns. For example, it is still possible to find extensive low-rise and mid-rise areas in the city centre where the land prices are so high that they would normally require a much more intensive land use. Since the 1960s the private developers have been urging the government to give them more abilities to redevelop these areas in a profitable way. In response to this the government has introduced several instruments that have given developers more freedom. This will be illustrated by describing the developments around two station areas; Tokyo Station and Osaki Station.
Case 1: Redevelopment projects around Tokyo Station
Tokyo Station is situated right in the heart of the Central Business District. Over 4000 companies, among them many (inter)national head offices, are located in the surrounding area contributing to approximately 20 percent of Japan’s Gross Domestic Product. Besides having a workforce of 240.000 people, the area attracts more than 700.000 visitors per day (Okada, 2006). At present the area to the west of the station, the Marunouchi district, is undergoing a massive transformation of which the first redevelopment phase (1998–2007) has almost come to an end. During this phase six office buildings have been redeveloped according to the same development principle; by converting a low-rise building into a high-rise structure. Prior to this redevelopment the Marunouchi district was a rather low-
Figure 17.5 Tokyo station in 2011Source: Adapted from JR East, 2004
Transit Oriented Development in Tokyo 235
rise area where strict building regulations did not allow buildings to be taller than 31 meters. At present a FAR of 1300 percent,2 the highest value specified in law, is assigned to this area which allows a private developer to use its land in a far more efficient way. The current redevelopments have all benefited from this and have used their development capacity to the fullest. In fact, most of these developments went even beyond that as the several FAR-instruments allowed them to use more. This is illustrated below by the Tokyo Station redevelopment project.
Currently the station complex and its surroundings are being redeveloped. On the west side of the station, the Marunouchi side, a new plaza will be created which extends into a walkway in the direction of the Imperial Palace. On the eastside, the Yaesu side, a large pedestrian plaza is planned with on each side a high-rise building. Another high-rise building on the eastside, the Sapia Tower, has already been completed (Figure 17.5). Furthermore, the roof of the station will be restored in its original state. By the end of 2007 both high-rise buildings will have been completed. The plaza will be finished in 2011.
The high-rise buildings marking the eastside of the station are the first outcomes of an instrument that the national government has introduced in 2001; the special FAR applied district. As mentioned before in such a district it is possible to transfer the unused floor areas to multiple sites. In 2002 the Tokyo Metropolitan Government designated the Marunouchi district as the first area to become a special FAR applied district. This instrument enabled the railway company JR East as the owner of the station building, to fully utilize its development rights. In the current situation approximately 200 percent is used for the station complex, while according to the land use zoning, as the station is situated in a commercial district, a maximum of 900 percent is allowed. This means that 700 percent remains unused. JR East is entitled to use the remaining development capacity, but before 2002 there was basically no instrument which allowed them to do so. The Specified Block instrument allowed only a transfer of the FAR within a building lot or between adjacent building lots. JR East, however, wanted to construct buildings on the other side of the railway tracks. As Tokyo Station and its surroundings were included in the special FAR applied district it became possible to do that.
The unused development rights of the station building were transferred to four different locations. For each transfer the approval of the Tokyo Metropolitan Government was required. Furthermore, it speaks for itself that besides JR East as the sender of the unused development rights also the receiver of the development rights (the land owner and/or building owner) has to agree with the transfer. In 2003 99.9 percent of the development rights were sold to Mitsubishi Estate and used for the redevelopment of the Shin Marunouchi Building. In 2004 98 percent was transferred to the Tokyo Building, which was a joint development by JR East and Mitsubishi Estate. In the same year 360 percent was transferred to the eastside of the station for the construction of two high-rise buildings; the Yaesu Towers. These buildings were developed by JR East and Mitsui Fudosan, another real
2 Before 2004 the maximum FAR was set at a 1000 percent.Before 2004 the maximum FAR was set at a 1000 percent.
Transit Oriented Development236
estate developer. The development of the Sapia Tower was carried out without a FAR transfer.
The actual building volume of the Yaesu Towers turned out to be much higher then the officially allowed ones and reached approximately 1650 percent. This volume was largely the result of the transfer of unused development rights, but also because JR East had used the integral design instrument for the redevelopment of its station area. According to this instrument a developer will receive an additional FAR bonus when including a certain rate of vacant land which is open to the public in its development. In case of the Tokyo Station project a pedestrian passage was included in the development plans for which JR East received an additional bonus.
Developments in Tokyo often use a combination of instruments for getting additional building volumes. This leads, when looking at the sites individually, indeed to much higher values than the ones designated by law. For example, in the case of Tokyo Station, the Yaesu Towers have a FAR of 1650 percent, while a FAR of 900 percent is allowed. But when considering the area as a whole the designated FAR is not exceeded.
As for Tokyo Station the railway tracks are also included in the zoning, but these are, until now, not built upon, although this is allowed by the zoning. The development capacity is thus not fully utilized which makes it possible to realize elsewhere in the land use zone a higher building volume. So although FAR-values are specified by law, they still give private developers a considerable amount of freedom to carry out their desired developments. Thereby it also helps that there is no absolute height regulation anymore.
Case 2: Urban renaissance in the Osaki Station district
In 2001 the urban renaissance headquarters was established by the national government in response to the several social-economic problems Japan is facing. Its mission is to revitalize the cities of Japan and enhance their attractiveness and international competitiveness as this is believed to affect Japan’s vitality as a whole. The revitalization is to be promoted through various urban redevelopment projects in which the private sector is to take the lead. For this in 2002 the special measures act for urban renaissance has been established. According to this law the urban renaissance headquarters is authorized to designate so-called priority development areas for urban renaissance. By designating these areas the national government is directly intervening in an area of local administration of urban development as this normally would be a typical task of the prefectural government. This is extremely rare in Japan and illustrates how urgent and important the revitalization of cities is for the national government.
In Tokyo 8 priority zones have been designated. Seven of them are located around the Yamanote loop line. The other one is located in the bay area, consisting largely of reclaimed land. Osaki Station is located in one of these areas. Around Osaki station many industrial and research facilities are to be found, among them
Transit Oriented Development in Tokyo 237
the technology centres of Sony Corporation. This land use has been strongly encouraged by the Tokyo Metropolitan Government as they labelled Osaki Station as a sub centre for research and development industries. Also Osaki station has, because of its status as sub centre, higher FAR-values then its surroundings. In a priority zone the government is stimulating private sector investments in two ways. First, a project that is authorized as a private urban renaissance project by the Minister of Land, Infrastructure and Transport will receive financial support and tax benefits. The financial support includes support for public facilities and/ or support for starting up a project. As for the tax benefits, these usually involve interest free loans. In addition, a private developer can apply for the status of special urban renaissance district allowing the developer to establish plans free from regulations applied to existing land use zones. For this they need the approval of 2/3 of the land owners concerned and the area needs to be at least over 0.5 hectares.
On the west side of Osaki station two areas have been designated as a ‘Special Urban Renaissance District’ by the Tokyo Metropolitan Government. For both areas the private developer has made a plan in which they proposed to rezone the current land use. One area, the West district, has a semi-industrial use with a FAR of 300 percent. The other area, the central district, was zoned as ‘semi-industrial’ and ‘neighbourhood commercial’ and also had a FAR of 300 percent. In the new situation both the West district and the Central district are zoned as commercial. The proposal that has been made for the West district uses a FAR of 750 percent while the Central district uses a FAR of 650 percent. Regarding the consent of the involved land owners, this has been more difficult in the Central district as this was a traditional residential area with many individual land owners involved. In the West district there was basically one owner, an industrial company called Meidensha. This company decided to relocate which made it possible to redevelop the area. Besides the special exceptions in city planning Meidensha managed to get the project authorized as a private urban renaissance project in 2005. Therefore the redevelopment of the West district received financial benefits as well.
When considering the relaxation of the floor area regulations the Tokyo Metropolitan Government does not only evaluate the area in terms of specified elements, such as how much infrastructure or open space is included in the development. The plan is also judged according to its ability to attract people, the economic ripple effect and the ability to generate employment as they also contribute to the urban regeneration of an area. As prescribed by law the Tokyo Metropolitan Government has to decide within 6 months from the date of its submission whether or not it will approve the plan. This has greatly reduced the time consuming process of obtaining an official approval for the private sector. The redevelopment of the West district has been completed in March 2007 and now houses a tower with offices and stores. Besides the tower a park has been created of which the surrounding residents can also benefit. One of the developers was Meidensha, the former landowner. The redevelopment of the Central district plan will be completed in 2009. It will then house two residential towers of 128
Transit Oriented Development238
metres in height. Furthermore the redevelopment includes offices, stores and a child care facility.
Conclusion
Transport-oriented development as a specific planning concept does not need to be encouraged in Tokyo as it will happen anyway. This is because the railways are the primary mode of transportation in Tokyo. Everyday the railways are used by millions of people. These people serve as a basis for the surrounding urban developments and vice versa. The flexible planning style conducted in Tokyo supports such developments. The zoning system and its associated FAR values give the private developer basically the freedom to determine whatever they want to develop. For a dynamic area as the station area this freedom is very important as it makes it possible to quickly respond to the changing demands from society. In this flexible approach the role of the government is to determine the conditions for a certain development while the actual planning is to be done by the private sector. The government facilitates developments rather than carrying them out by themselves. What is interesting about this planning style is that in the end both the government and the private sector benefit from this. The government receives public infrastructure for which it does not need to pay while the private sector in return receives an additional floor area, which enables it to make a greater profit.
Especially around railway stations where the supply of public infrastructure is a prerequisite for the private sector to actually invest, the use of planning incentives has proven to be decisive. However, although most of the planning is done by the private sector, the government will still have a significant role as it needs to protect the quality of the overall development. This is something a private developer sometimes tends to ‘forget’. For example, the Yaesu Towers that have been built on the north side of Tokyo Station are rather standard office buildings which could have been built basically anywhere in Central Tokyo. As Tokyo Station is regarded as the ‘entrance of Japan’ one would expect that this would also be reflected in the design of the buildings. The government could have set this as a prerequisite for the redevelopment of the area.
The special urban renaissance districts, such as the areas around Osaki station, are criticized by some researchers for lacking a clear vision and that they are only introduced to stimulate large-scale developments. The projects should follow the development guideline set for the priority zone. However, these guidelines are rather ambiguous and do not make it possible to draw up a clear future image for the area. As for the urban renaissance special district, a private developer has to simultaneously apply for the approval of the city planning and the project. However, the Tokyo Metropolitan Government only checks if the project plan meets the guidelines. The government does not check if the proposed city planning suits the area. The result of this is that many projects are going to be realized that do not fit into their surroundings.

CONCLUSION Making TOD Happen

This page has been left blank intentionally
Chapter 18
Measuring the Success of Transit Oriented Development
John L. Renne
Introduction
Defining the measurement of success for transit-oriented development (TOD)1 depends upon the various perspectives of different stakeholders. For example, most transit agencies are looking for TODs to produce higher levels of transit ridership. Developers need to deliver a return on investment while planning agencies often look to TOD for reducing automobile dependency and alleviating traffic congestion. This chapter discusses measuring TOD success given the perspective of disparate stakeholders, including: 1) State and regional government, 2) Transit agencies, 3) Local government, 4) Communities and 5) Private developers.
Underlying the discussion of TOD performance in this chapter is the theory that TOD should foster sustainability by creating walkable, mixed-use, and vibrant places around public transport nodes, especially in automobile dependent societies such as the United States or Australia. This chapter builds upon several studies that present TOD performance within a sustainability framework (Wells and Renne 2003; Renne and Wells 2005; Renne 2007). Before discussing each of the stakeholders view on success, the next section will summarize a background to evaluating TOD.
Background to evaluating TOD
Most previous studies evaluating TOD success focus narrowly on a few aspects of success, including: 1. Travel behaviour and vehicle ownership, 2. Property value and markets, and 3. Urban and regional design. A national study on TOD in the United States concluded, “The literature is replete with platitudes that have been heaped on the TOD concept; however, relatively few serious studies have been carried out that assign benefits to TOD in any quantitative … sense” (Cervero et al. 2004, p. 119). This same study classified primary and secondary benefits of TOD, as shown in Table 18.1.
1 A TOD is defined in this chapter as the precinct within a 10 minute walk (approximately 600 – 800 meters) of a high-frequency transit node.
Transit Oriented Development242
Travel behaviour and vehicle ownership
Travel behaviour studies in TODs can be classified into those that analyse commute trips and studies of non-work trips. Boarnet and Crane (2001) concluded that not enough evidence existed to fully understand the relationship of non-commute trips in TODs; however Chatman (2006) found that residents and employees near rail stations have a higher non-automobile share of both commuting and non-work travel, particularly for locations where automobile use is inconvenient or closer to job centres. Lund et al. (2004) found that California residents were up to five times more likely to commute via transit in TOD areas compared to non-TOD locations. This corroborates an earlier study in California, which found residents five to seven times more likely to commute on rail transit compared to an average worker in the same city (Cervero 1994). A study of over 100 TODs in twelve regions across the United States found TOD residents were two to five times more likely to commute on transit as compared to the average resident of the same region, however the data varied by region. In Atlanta, for example, residents in TOD precincts were five times more likely to commute via transit in 2000 as compared to regional averages. Higher shares of transit commuting were found in the TODs of heavy rail regions with higher levels of transit accessibility, such as
Table 18.1 Primary and secondary benefits of TOD
Class of BenefitPrimary Recipient of Benefit
Public sector Private sectorPrimary 1 Increase ridership and farebox
revenues5 Increase land values, rents, and
real-estate performance2 Provide joint development
opportunities6 Increase affordable housing
opportunities3 Revitalize neighbourhoods4 Economic development
Secondary/Collateral
A Less traffic congestion and VMT-related costs, like pollution and fuel consumption (1)
G Increase retail sales (1, 2)
B Increase property- and sales-tax revenues (5)
H Increase access to labour pools (A, 6)
C Reduce sprawl/conserve open space (1, 3, 6)
I Reduce parking costs (C, 2)
D Reduce road expenditures and other infrastructure outlays (1)
J Increase physical activity (C, E, F)
E Reduce crime (3, 4)F Increase social capital and public
involvement (3, 4)Note: Values in parentheses represent primary benefits and/or secondary benefits that are the source(s) of the secondary/collateral benefit listed.Source: Cervero et al. 2004, Table 7.1, p. 120
Measuring the Success of Transit Oriented Development 243
San Francisco and Washington, D.C. (Renne 2005). Cervero and Duncan (2002a) attributed 40 percent of a rail commute decision to self-selection – those that move to TODs because they want to use the train for commuting. Because zoning policies across America preclude TODs in many locations (Levine 2005) Cervero and Duncan suggest less restrictive land use policies to enable self-selection to drive the market for more TODs.
Two national studies found consistently lower vehicle ownership in TOD precincts. A Center for Transit Oriented Development (2004; revised 2005) study found households near rail stations owned 0.9 automobiles per household as compared to a regional average of 1.6 automobiles per household. Renne (2005) found that 37 percent of TOD households owned two or more automobiles compared to an average for 12 large regions of 55 percent.
Property value and markets
Empirical studies show consistently higher land values closer to train stations as compared to land further away. Figure 18.1 depicts the relationship between land value and proximity to a station. Many hedonic regression studies, which allow for isolating the existence of the train station on property value, show premiums range from eight to 30 percent and diminish with increasing distance to the station. Several reports summarize a number of these hedonic studies (Cervero et al. 2004: California Department of Transportation 2002; City of Cleveland 2001). For
Figure 18.1 Land value premium varies by the mix of land uses, density, and design
Source: Author
Transit Oriented Development244
examples, a study in California found commercial properties along the Santa Clara light rail were worth 24 percent more or an additional US$4.10 per s.f. due to the station while residential properties yielded an additional 28 percent or US$9.20 per s.f. (Cervero and Duncan 2002b and 2002c). Just as Cervero and Kockelman (1997) found that travel demand varies by the mix of land uses, density, and design, the shaded area in Figure 18.1 also depicts that land value premium also varies based on these same principles.
The overall market for TOD has been the subject of several studies, including the annual Emerging Trends in Real Estate (Urban Land Institute and Price Waterhouse Coopers 2005; 2006; 2007; 2008), which rated TOD as a top development prospect for the future in each edition since 2005. The 2008 edition rated TOD as “phenomenal over the next decade” (p. 15). Part of the reason is because the national market for TOD in America is estimated to be about 25 percent of all households (Levine and Inam 2004; Centre for Transit-Oriented Development 2007). Based on these estimates, Renne (2005) forecasted the need for 2,000 additional TODs to be constructed by 2030 to keep up with this demand. The Centre for Transit-Oriented Development estimated a more than doubling in the number of households that live within walking distance to rail stations from 6.2 million households across the country in 2000 to 15.2 million households in 2030 (Center for Transit-Oriented Development 2007).
Urban and regional design
The term “TOD” was coined by Peter Calthorpe in The Next American Metropolis: Ecology, Community, and the American Dream (1993). This book proposed an urban and regional design that mimics land use and transportation concepts of Ebenezer Howard’s Garden City Concept of the late 19th Century (Howard 1898; reprint 2003). Urban and regional design has been the subject of studies in the US and elsewhere since the mid-1990s. Loukaitou-Sideris and Banerjee (2000) analysed reasons that the Blue Line in Los Angeles failed to spur development despite transit ridership growth along a 22-mile rail corridor from Downtown Los Angeles to Downtown Long Beach. They proposed the reason was due to missing antecedents for economic development, which includes: 1) A back door location; 2) Missing density gradients; 3) Inaccessible station locations; 4) Pedestrian-unfriendly station locations; 5) Lack of an urban design framework for the station area; 6) Landscape of deprivation and the ‘broken window syndrome’; 7) High land costs (land cost paradox); 8) Regulatory barriers; 9) Lack of institutional commitment: 10) Absence of critical mass; 11) Lack of community involvement and participation (pp. 119–21).
Bertolini and Spit (1998) and Bertolini (1999) analysed the dual nature of TODs as both a node and a place. As a node, the role of a public transport station is to connect people with other destinations; however as a place of activities the TOD becomes a destination itself. Bertolini (1999) presents a node-place model, which identifies “two ideal-typical situations” including a strong node/strong
Measuring the Success of Transit Oriented Development 245
place and weak node/weak place. In the first scenario, “potential for physical human interaction is highest (strong node) and that it has been realized (strong place)” (Bertolini 1999, pp. 201). Alternatively, places with weak nodes and weak places are considered ideal because “the struggle for space here is minimal, but the demand for transportation services from area residents, workers and other users and the demand for urban activities from travellers are also both so low” (Bertolini 1999, p. 202). Two unbalanced situations include unsustained nodes “where transportation facilities are relatively much more developed than urban activities…[and] ‘unsustained places’, where the opposite is true” (Bertolini 1999, p. 202).
Dittmar and Poticha (2004) define TOD as a new regional building block. They propose a performance-based definition of TOD, which includes location efficiency, a rich mix of choices, value capture, place making, and the resolution of tension between node and place. They define density, transit accessibility and pedestrian friendliness as indicators for location efficiency. Both travel and housing variety are defined as necessary to achieve a rich mix of choices. The author’s state,
Capturing value, accrued either to the household or the community, should be a key objective of TOD, thus allowing individuals to lead affordable lifestyles and letting communities reinvest the profits… (p. 27).
In terms of place making, the authors note that current TODs do not pay enough attention to creating attractive and pedestrian-friendly environs. Finally, Dittmar and Poticha reference the importance of Bertolini and Spit’s work, as described above. The authors recommend a typology for TODs, which include Urban Downtown, Urban Neighbourhood, Suburban Centre, Suburban Neighbourhood, Neighbourhood Transit Zone and Commuter Town Centre. For each type, they recommend a land use mix, minimum housing density, housing types, scale, level of regional connectivity, transit modes, and frequencies. For example, minimum densities range from 7 units per acre in neighbourhood transit zones to 60 units per acre in an urban downtown setting.
In Urban Design to Reduce Automobile Dependence, Newman and Kenworthy (2006) found a minimum threshold of 35 residents and jobs per hectare (87 residents and jobs per acre) is needed to create an environment that supports a vibrant mix of activities and usage of public transport and walking over driving. They report, based on these findings, that 8,000–19,000 residents and jobs are need to create a successful TOD within a 10-minute ped shed of a transit node.
Measuring TOD within a sustainability framework
In order to examine the holistic benefits of TOD, Renne (2008a) uses an expanded sustainability framework, which includes six dimensions to monitor and evaluate TOD outcomes. These include: 1) travel behaviour, 2) the economy, 3) the natural
Transit Oriented Development246
Table 18.2 TOD indicators available for collection in Western Australia
Travel Behaviour Indicators Recommended Data sources
Relative ease/Difficulty of Collecting Data
Accuracy of Data
Vehicles kilometres travelled (VKT) Household Survey Easy for work trip but substantially more difficult for other trips unless travel diary included
High for work trip. Less accurate for other types of trips unless travel diary conducted
Mode split Household Survey Easy for work trip but substantially more difficult for other trips unless travel diary included
High for work trip. Less accurate for other types of trips unless travel diary conducted
Frequency of public transit usage Household Survey Easy HighResident commuting time Household Survey Easy HighQuality of transit service (frequency of headways)
PTA Easy High
Vehicle ownership Household Survey Easy HighTransportation perceptions I feel safe walking around my neighbourhood at night
Household Survey Easy Subjective – moderate
My neighbourhood is well served with public transport
Household Survey Easy Subjective – moderate
Traffic is not a major issue in the area Household Survey Easy Subjective – moderateThe neighbourhood is easy to walk around Household Survey Easy Subjective – moderateFootpaths are in good condition Household Survey Easy Subjective – moderateIt is easy to cross the street Household Survey Easy Subjective – moderateI feel safe from traffic while walking Household Survey Easy Subjective – moderateDrivers give way to pedestrians crossing the road
Household Survey Easy Subjective – moderate
I can easily walk to the train station from my house
Household Survey Easy Subjective – moderate
Hills along the route area barrier to walking to the train station
Household Survey Easy Subjective – moderate
One of the main reasons I live here is to be close to the train station
Household Survey Easy Subjective – moderate
Local economy IndicatorsNumber of jobs by type DPI Easy HighVacancy rate DPI Easy High Home ownership vs. rental Household Survey Easy HighWeekly housing expenses Household Survey Easy ModerateProperty Value Valuer General Moderate/difficult Highnatural environment IndicatorsTransport energy consumption (computed) Calculated using
VKTCalculation relatively easy Moderate
CO2 emissions (computed) Calculated using VKT
Calculation relatively easy Moderate
Park space DPI Easyt HighPercent of land cover as greenspace DPI Easy HighPercent of land cover as trees DPI Easy HighBuilt environment IndicatorsPopulation and housing density DPI Easy HighStreet Quality Household Survey Easy Subjective – moderateAmount of public space DPI Easy HighQuality of public space Household Survey Easy Subjective – moderateLand cover/land use distribution DPI Easy ModerateParking inventory DPI Moderately difficult HighPedestrian accessibility (Ped Shed) DPI Easy High
Source: Renne 2007, pp. 40–41
Measuring the Success of Transit Oriented Development 247
environment, 4) the built environment, 5) the social environment, and 6) the policy context. For each dimension, indicators were identified and data collected based on a field analysis in Perth, Western Australia. Some of the indicators allowed for the use of secondary data, but many necessitated primary data collection through household surveys. Table 18.2 depicts which TOD indicators were available for collection in the Perth study (Renne 2007).
In Transit-Oriented Development: Developing a Strategy to Measure Success, Renne and Wells (2005) present the results of a national study in the United States to determine what indicators professionals felt were most useful in TODs. Based on survey results, the authors recommended the following indicators as the basis for monitoring TODs: transit ridership, density, streetscape design quality, mix of uses, pedestrian safety and activity, property value and tax revenue, public perception, mode connections, and parking configuration.
An important issue when monitoring TOD success is what to compare success against. Renne (2007) recommends a regional performance and a community performance approach.2 The regional performance approach includes comparing: 1) TODs versus other TODs, 2) TODs versus non-TOD neighbourhoods, and 3) TODs versus regional averages. This approach would allow regional, state, or national government to establish benchmarks. However, many TOD goals are local. Therefore, the community monitoring approach calls for a monitoring system which tracks TOD indicators towards achieving local goals set forth by the community. In both the regional and community performance approaches, monitoring TOD success can only be achieved through longitudinal data, which is often difficult to obtain unless government makes a concerted effort to track a series of indicators over time. A survey in America found that indicators only needed to be collected once a year or less often, such as once every five years. The study also recommended that regional or state-level government take the lead in collecting TOD data in order to ensure uniformity amongst the methodology and data collection effort for all TODs in a region (Renne and Wells 2005).
Measuring TOD performance: A stakeholders viewpoint
Perspectives vary between different stakeholders in monitoring the success of TODs.
State and regional government
State and regional government are increasingly looking at TOD to address a number of issues, including: urban growth and sprawl, automobile dependence, traffic congestion, air quality/carbon emissions, housing, and environmental
2 The report describes the regional performance approach as “Top-Down” and the community performance approach as “Bottom-Up” monitoring.
Transit Oriented Development248
cleanup. From a growth management perspective, Burchell et al. (2002) found, between 2000 and 2025, 25 percent of sprawl in the United States could be avoided with simple growth control measures that would not compromise growth or alter housing markets. In terms of automobile dependence, the share of trips taken by automobiles in America has steadily increased from 81.8 percent of all trips in 1969 to 86.4 percent of all trips in 2001. More dramatically, the percent of commute trips has increased from 66.9 percent of trips in 1960 to 87.9 percent in 2000 (Pucher and Renne 2003). This has led to massive traffic congestion. In 1982, only five regions across America had more than 20 hours of delay per commuter. In 2003, 51 regions met this criterion. The annual cost of traffic congestion increased during this same period from $12.5 billion to $63.1 billion (Schrank and Lomax 2005).
State and regional governments are looking towards compact land use patterns and TOD to help reduce impact on air quality and the atmosphere. Growing Cooler: The Evidence on Urban Development and Climate Change (Ewing et al. 2008) discusses how the United States needs to cut carbon dioxide emissions by 60 to 80 percent from 1990 levels by 2050 to stabilize climate change. A key part of the strategy is to reduce vehicle miles travelled (VMT) by encouraging TOD. Ewing et al. (2002) found that residents of compact regions, such as Boston and Portland, Oregon drove 25 percent less than residents of sprawling regions like Atlanta and Raleigh. A reduction in VMT would yield both cleaner air and less carbon dioxide emissions.
Some states have implemented special committees to promote TOD. Renne (2008b) discusses TOD initiatives in California, New Jersey and Western Australia. A key role for state government is to promote intra-state agency and intergovernmental participation, especially related to the topics of transportation, land use, housing, environmental cleanup and economic development. A committee, which meets on a regular basis and includes state and regional stakeholders, is vital to TOD implementation (Renne 2008b). However, planning alone is not enough. State-level TOD legislation in California passed in 1994 produced few results because the state failed to include resources to spur local governments to embrace TOD planning and implementation (Cervero 1998).
State and regional government, depending upon the geography, can serve overlapping roles. For example, in states with only one large metropolitan region, like Perth, Western Australia, the state government is particularly focused on regional planning issues. However, in a state like California, with multiple metropolitan areas, regional government plays a larger role. This relationship also varies by country. In Australia, state government has a larger interest in transportation and land use planning whereas in the United States, metropolitan planning organizations (MPOs), which are responsible for distributing federal transportation funding for projects, is a logical place for regional TOD planning.
The Transportation for Livable Communities program of the San Francisco Bay Area’s Metropolitan Transportation Commission (the region’s MPO) directs funds toward TOD projects,
Measuring the Success of Transit Oriented Development 249
This program sets aside money for the planning, design, and construction of small-scale, ‘community-oriented transportation projects,’ including streetscape improvements carried out in conjunction with real-estate development near transit (Cervero et al. 2004, p. 91).
Transit-Oriented Development in the United States: Experiences, Challenges, and Prospects (Cervero et al. 2004) provides ten in-depth case studies of regions,
All sides agree that higher levels of government, like MPOs, state DOTs, and federal agencies, should focus on providing a supportive financial, legislative, and institutional environment that promotes TOD (p. 449).
State and regional government often ask the following questions about TOD:
What funds are available for TOD planning and implementation?What state policies are used for TOD planning and implementation?Is there a forum for various state agencies and regional government(s) to collaborate with other stakeholders, especially transit agencies and local government for TOD planning and implementation?What policies and programs exist that deal with related issues, such as growth management, traffic management, housing and environmental stewardship, and how can these be integrated with TOD planning and implementation?
Recommended State and Regional Measures of TOD Success The followingThe following indicators are recommended for state and regional government. As with all measures, these should be tracked over time.
Existence of a state / regional forum on TOD coordinationNumber of TODs that receive planning support under a state/regional forumAmount of funding that comes from state and regional governments for TODNumber, content, and quality of state and regional polices that facilitate TODPercent of regional growth (housing, economic, and land consumption) occurring in transit precincts and TODs versus non-TOD areasRegional housing demand estimates for TODsVehicle miles travelled in TODs versus non-TOD areasExistence of a TOD monitoring program.
State and regional government should take upon the responsibility for tracking TOD indicators for all stakeholders in order to ensure a uniform methodology and set of data. As discussed above, this data could serve as the basis for both a regional and community performance approach.
•••
•
••
•
•
•
•••
Transit Oriented Development250
Transit agencies
Transit agencies primarily benefit from TOD through increased transit ridership and revenue and cost sharing arising from value capture through joint-developments with the private sector. The discussion earlier in this chapter highlights transit benefits in TODs; there is, however, a tension between TOD and commuter parking.
Parking and TOD Across the United States, Canada and Australia, transitAcross the United States, Canada and Australia, transit agencies rely on surface parking lots around suburban train stations to allow residents to access the train network. This is especially true as petrol prices have increased to the point were people are looking for alternatives to driving. For example, in Oakville, Ontario, a suburb of Toronto, commuter parking lots were overcrowded despite over 5,000 parking spaces between two stations. A new 600-space parking lot, which opened in June 2008, was not expected to supply the pent up demand (McGinn 2008). At the Princeton Junction station in New Jersey, a suburb of Manhattan, there is only enough parking spaces to serve half of the 7,000 daily transit riders. The waiting list to secure a parking space there is about seven-years. In Westchester County, New York, also a suburb of New York City, only 26,000 parking spaces exist for the 75,000 commuters (Mallozzi, 2006).
Transit agencies are faced with the dilemma of building more parking, which can be to the detriment of TOD or using land for development purposes. The problem with a focus on parking around commuter transit systems is that parking only reinforces automobile dependence in the suburbs. Although delivering land use development takes longer to build, and is more complex than simply providing park and ride facilities transit agencies need to consider a range of possible solutions to accommodate both commuter parking and TOD around transport nodes. Two recent books, The High Cost of Free Parking (Shoup 2005) and Parking Management Best Practices (Litman 2006) offer a range of short-term and long-term parking solutions, which should be incorporated into all TODs.
Transit agencies often ask the following questions about TOD:
How much does TOD lead to increased use of public transport?How can transit agencies balance short-term parking demands with the long-term nature of developing TODs?How can transit agencies capture value (or share costs) around and above their stations with the private sector?
Recommended transit agency measures of TOD success The following indicators are recommended for transit agencies.
Mode share and transit ridershipParking utilizationNon-fare box revenues from land.
••
•
•••
Measuring the Success of Transit Oriented Development 251
Local government and communities
Local governments and communities have the broadest view on goals for TOD. Many communities, looking to encourage sustainability, have embraced TOD based on environmental, economic, and social grounds. Communities are ultimately the foundation for all the stakeholder groups discussed in this chapter and they often share the same goals for TOD as state and regional government, transit agencies, and even private developers. Only those goals and measures that are unique to local government and communities are discussed here. This is not an exhaustive list, but a summary of the key ones (see Renne and Wells (2005) and Renne (2007) for more detail).
Economic goals Local governments and communities often encourage TOD forLocal governments and communities often encourage TOD for local economic revitalization. TODs seek to concentrate people, jobs, shopping, and entertainment within a district.
Key economic questions about TOD often include:
How many and what type of jobs are created?How vibrant is the district?Are households able to significantly reduce transport expenditures?How much property taxes are generated?
Recommended economic indicators for local government and communities
Number of jobs by typeVacancy rateHousehold housing and transport expendituresProperty value and taxes collected.
Environmental goals From an environmental perspective, local governments andFrom an environmental perspective, local governments and communities use TOD as part of a larger growth management strategy of preserving rural landscapes elsewhere within the municipality. Other environmental goals focus on reducing the ecological footprint existing and new development.
Key environmental questions about TOD often include:
Do TODs preserve open space and/or reduce sprawl?Do TODs reduce greenhouse gases?Do TODs reduce energy consumptionDo TODs reduce automobile dependence and traffic congestion?
Recommended environmental indicators for local government and communities
Population densityEnergy consumption
••••
••••
••••
••
Transit Oriented Development252
Carbon dioxide emissionsResident commuting timeVehicle miles/kilometres travelled.
Social goals ProposedTODsoftenarechallengedonsocialgrounds.CommunitiesProposed TODs often are challenged on social grounds. Communities often oppose projects that could be perceived as a threat to the current quality of life. Proponents seek to convince this opposition that TOD will have a positive impact on the community. Too often, some segments of the community only want luxury development while others are more concerned with affordable housing and gentrification. A number of studies advocate for TODs to include a range of housing options for all segments of society.
Key social questions about TOD often include:
How will TODs impact quality of life?How will benefits be distributed across society?Will the development be attractive?
Recommended social indicators for local government and communities
Quality of life perceptionsQuality of public realm perceptionsEducation and income distributionHousing affordability.
Private developers
Private developers often answer to third party investors. Investors can either be institutions, such as banks and pension funds, non-institutional funds, high net-worth individuals. Regardless, investors’ main objective is to receive a financial return on their investment with as much certainty as possible. Since real estate development by nature involves managing many risks, the rate of return that investors require is usually 10–30 percent per year. TODs are often perceived as more complex as compared to conventional suburban development. Returns, which can be quite lucrative in the long-term, often do not match the certainty of short-term gains by building single use product in automobile dependent suburbs. Therefore, with an increased risk profile, TOD investors usually require above 20 percent per year return on TOD investments. Moreover, these returns are often not realized for at least five years due to the complex nature of mixed-use development and the high-level of public involvement required for these “high profile” projects.
Developers often ask the following key questions about TOD:
How long is the approval process?What are the major risks?
•••
•••
••••
••
Measuring the Success of Transit Oriented Development 253
What public sector incentives are available?Will the market support the proposed development plan?
Recommended indicators for developers
Length of approval processAmount of subsidiesInternal Rate of Return on Investment.
Joint developments/public private partnerships
Joint developments or public private partnerships (PPPs) entail the partnership of the public and private sectors to construct portions or entire TODs. This chapter does not seek to list the various measure of success for joint developments, which are more specific to the contractual agreements set forth within the agreements, but the various measures of success listed here should be considered in the crafting of the partnership.
Conclusions and next steps in evaluating TOD
A summary of the key questions and recommended indicators by stakeholder group is included in Table 18.3. This is not an exhaustive list but accounts for a holistic understanding of how each stakeholder group can evaluate progress. It should also be noted that there are other stakeholder groups not listed here, such as federal government or non-profit organizations. Moreover, this chapter marries the concerns of local government and the community, as well as developers and investors, which in fact may have divergent interests from one another. The goal for this work has been to highlight the need for understanding TOD success based on the various perspectives of key stakeholders.
The next steps in evaluating TOD are discussed in a recent report to the State of Western Australia’s Department of Planning and Infrastructure, which proposes measuring the performance of TODs within a sustainability framework using a Regional Performance Approach (RPA) and Community Performance Approach (CPA) (Renne 2007).3 Because sustainable development theory calls for bottom-up, context sensitive solutions, the CPA seeks to track success within TODs based on the goals of local communities. This necessitates community stakeholder meetings (including the public) which set for goals and objectives before TODs are constructed. Over time, success is gauged both using the RPA to test how the TOD compares to the rest of the region but also using the CPA to see if the local goals are being achieved.
3 The report identifies the Regional Performance Approach as Top-Down and the Community Performance Approach as Bottom-Up.
••
•••
Transit Oriented Development254
Table 18.3 Summary of key questions and recommended indicators by stakeholder group
stakeholder group
Key Questions about TOD Recommended Indicators
State and Regional Government
• What funds are available for TOD planning and implementation?
• What state policies are used for TOD planning and implementation?
• Is there a forum for various state agencies and regional government(s) to collaborate with other stakeholders, especially transit agencies and local government for TOD planning and implementation?
• What policies and programs exist that deal with related issues, such as growth management, traffic management, housing and environmental stewardship, and how can these be integrated with TOD planning and implementation?
• Existence of a state / regional forum on TOD coordination
• Number of TODs that receive planning support under a state/regional forum
• Amount of funding that comes from state and regional governments for TOD
• Number, content, and quality of state and regional polices that facilitate TOD
• Percent of regional growth (housing, economic, and land consumption) occurring in transit precincts and TODs versus non-TOD areas
• Regional housing demand estimates for TODs
• Vehicle miles travelled in TODs versus non-TOD areas
• Existence of a TOD monitoring programTransit Agencies
• How much does TOD lead to increased use of public transport?
• How can transit agencies balance short-term parking demands with the long-term nature of developing TODs?
• How can transit agencies capture value (or share costs) around and above their stations with the private sector?
• Mode share and transit ridership• Parking utilization• Non-fare box revenues from land
Local Government and Communities
Economic• How many and what type of jobs are
created? • How vibrant is the district?• Are households able to significantly
reduce transport expenditures?• How much property taxes are
generated?
• Number of jobs by type• Vacancy rate• Household housing and transport
expenditures• Property value and taxes collected
Environmental• Do TODs preserve open space and/or
reduce sprawl?• Do TODs reduce greenhouse gases?• Do TODs reduce energy consumption• Do TODs reduce automobile
dependence and traffic congestion?
• Population density• Energy consumption• Carbon dioxide emissions• Resident commuting time• Vehicle miles/kilometers traveled
Social• How will TODs impact quality of life?• How will benefits be distributed across
society?• Will the development be attractive?
• Quality of life perceptions• Quality of public realm perceptions• Education and income distribution• Housing affordability
Private Developers
• How long is the approval process?• What are the major risks?• What public sector incentives are
available?• Will the market support the proposed
development plan?
• Length of approval process• Amount of subsidies• Internal Rate of Return on Investment

Measuring the Success of Transit Oriented Development 255
TOD is a tool for sustainable development and smart growth. The tracking of success is also a tool to help stakeholders, including state and regional government, transit agencies, communities and local government, and private developers better understand what success means to all entities involved.

This page has been left blank intentionally
Chapter 19
TODs for a Sustainable Future: Key Principles to ‘Make TOD Happen’
Luca Bertolini, Carey Curtis and John L. Renne
Introduction
Different aspects and examples of the challenge of implementing TOD have been discussed in the preceding chapters. At the end of the journey, this final chapter addresses one central question: what have we learned with respect to making TOD happen? There are different aspects and levels to this question. One aspect is the lessons learned and another is the transferability of these lessons. One level addresses the strategy as a whole, while another focuses on particular tools addressing specific issues. The two aspects (the lessons and their transferability) need to be treated together; otherwise we would fall short of our core aim of providing a toolbox of more general value. The two levels (of the strategy and of the tools) are also tightly connected but for the sake of clarity, will be addressed in succession.
First, in order to identify the transferable lessons for the strategy as a whole we will set the general guidelines identified by Newman (Chapter 2) and Cervero (Chapter 3) against the specific accounts of the cases in subsequent chapters. How do the guidelines translate in practice? Where do the cases confirm or challenge particular aspects of these guidelines? What is the resulting set of guidelines?
Second, to identify transferable lessons on more specific issues, we will compare the conclusions of chapters in each successive part of the book: implementation tools, implementation processes, role of the community and role of markets. Finally, we will draw the different threads together and provide some orientation of how to apply the lessons in contexts other than those discussed in the book.
guidelines for successful TOD implementation strategies
In Chapters 2 and 3 Newman and Cervero, respectively, pinpoint what they believe are the essential components of successful TOD strategies. Newman specifically names:
a strategic planning framework that asserts where centres need to occur, in what density and mix;
•
Transit Oriented Development258
a strategic planning framework that links these centres with a rapid transit base, almost inevitably with electric rail;a statutory planning base that requires development to occur at the necessary density and design in each centre, preferably with a specialized development agency;a public-private funding mechanism that enables the transit and the TOD to be built or refurbished through a linkage between the transit and the centres it will service.
Cervero, more generally, cites:
strong leadership;forward-looking urban planning;efficient pricing of scarce resources.
To what extent are the strategy elements and characteristics identified by Newman and Cervero found in the case studies discussed in successive chapters? The findings are summarized in Table 19.1, where only cases treated extensively in at least one chapter of the book have been included. Due to the ex-post nature of this framework of analysis, there is not enough information in the chapters to satisfactorily fill in all the cells. Furthermore, there are not enough cases for allowing strong generalizations. However, some interesting patterns can already be identified. These are discussed below.
First, there does not seem to be a strong relationship between the existence of all strategy components and successful TOD implementation strategies. Of all the components only strategic planning features in all cases. However, strong internal consistency between at least some key components would appear necessary, so that enough incentives for pursuing integration between transport and urban planning and development are in place. Particularly illustrative in this respect is a comparison between the implementation strategies of Singapore and Tokyo. Both are extremely successful in TOD terms. However, while Singapore seems to come close to the ideal sketched by Newman (especially) and Cervero, Tokyo appears to have achieved much of the same through a reliance on market rather than planning mechanisms. The most important factor seems thus to be the existence of transit-urban development integration mechanisms, not so much the particular form of governance (government or market led). In Singapore these mechanisms rely on planning coordination measures such as those cited by Newman and advocated by many others. In Tokyo, they are rather the product of market forces in an environment with very strong incentives towards TOD. These incentives are essentially of two sorts: first, transit is the most competitive mode (it is faster and cheaper), and second, station areas – which are already the most accessible places because of transit’s competitiveness – enjoy the highest property development allowances (through Floor Area Ratios). These two sorts of incentives combine in a self-reinforcing cycle, where urban development calls for transit development, and the other way round.
•
•
•
•••
Tabl
e 19
.1
Occ
urre
nce
of st
rate
gy e
lem
ents
and
cha
ract
eris
tics i
dent
ified
by
New
man
and
Cer
vero
in th
e ca
ses
stra
tegi
c Pl
anni
ngst
atut
ory
Plan
ning
fund
ing
Lea
ders
hip
stra
tegy
ele
men
ts
(2, 3
)
Cas
es
forw
ard
-lo
okin
g ur
ban
plan
ning
fram
ewor
k 1:
L
ocat
ion,
den
sity
and
m
ix o
f cen
tres
fram
ewor
k 2:
Lin
k ce
ntre
s and
rap
id
tran
sit (
elec
tric
ra
ilway
)
stat
utor
y pl
anni
ng b
ase
Publ
ic-p
riva
te tr
ansi
t fu
ndin
g m
echa
nism
eff
icie
nt
pric
ing
of sc
arce
re
sour
ces
stro
ng
lead
ersh
ip
Type
1 (See
Ta
ble
19.2
)
Sing
apor
e (3
, 8)
Yes
Yes,
but r
efine
d in
su
cces
sive
stag
esYe
s, bu
t refi
ned
in
succ
essi
ve st
ages
Yes
Publ
ic in
vest
men
ts in
tra
nsit
and
hous
ing,
priv
ate
inve
stm
ents
in c
omm
erci
al
prop
ertie
s
Yes,
in th
e tra
nspo
rt m
arke
t
Yes,
diffu
sed
Toky
o (1
7)Ye
s, bu
t re
lativ
ely
loos
e
Mos
tly in
dire
ct,
thro
ugh
FAR
(den
sity
on
ly, l
ocat
ion
and
mix
fle
xibl
e)
Mos
tly in
dire
ct,
thro
ugh
inte
grat
ed
priv
ate
owne
rshi
p of
tra
nsit
and
land
Lim
ited
(FA
R)
Publ
ic a
ctor
shap
es
cond
ition
s, pr
ivat
e ac
tors
in
vest
(in
both
tran
sit a
nd
prop
erty
)
Yes,
in b
oth
the
trans
port
and
urba
n la
nd m
arke
t
No
Type
2
Nap
les-
Cam
pani
a (5
)Ye
s, bu
t with
a
rela
tivel
y sh
ort t
ime
horiz
on
Yes,
loca
tion
(but
de
nsity
and
mix
fle
xibl
e)
Yes,
but
incr
emen
tally
de
fined
Stro
ng in
theo
ry,
wea
k in
pra
ctic
e Tr
aditi
onal
: tra
nsit
publ
ic
inve
stm
ent,
real
est
ate
priv
ate
inve
stm
ent (
som
e va
lue
capt
ure
thro
ugh
prop
erty
ta
xes)
Yes,
but n
ot
so m
uch
a re
sult
of
polic
y
Yes
Ran
dsta
d So
uth
(7)
Yes
Yes,
but i
ndic
ativ
e/
expl
orat
ory
Yes,
but i
ndic
ativ
e/
expl
orat
ory
Stro
ng d
ev.
cont
rol,
not y
et
TOD
info
rmed
Trad
ition
al: t
rans
it pu
blic
in
vest
men
t, re
al e
stat
e pr
ivat
e in
vest
men
t
Lim
ited
(par
king
)N
o
Type
3
Portl
and
(9, 1
2)Ye
sYe
s, bu
t evo
lvin
gYe
s, bu
t evo
lvin
gYe
sYe
sYe
s (in
the
land
mar
ket)
Yes,
diffu
sed
Type
4
Wes
tern
Aus
tralia
(2
, 4, 6
, 10,
15)
Yes
Yes,
but n
ot w
ell
defin
edYe
s, bo
th ra
il an
d bu
sYe
s, bu
t not
stro
ng
in im
plem
enta
tion
Yes,
but i
nhom
ogen
eous
/ex
plor
ativ
eN
o Ye
s
Mel
bour
ne (2
, 11
, 13)
Yes
Yes,
but s
trugg
ling
Wea
k, m
ostly
pre
sent
ra
il Ye
s, bu
t not
stro
ng
in im
plem
enta
tion
No
No
No
Sout
h Ea
st
Que
ensl
and
(2, 1
4)Ye
sYe
s, bu
t not
wel
l de
fined
Yes
No
Expl
orin
g po
ssib
ilitie
sN
oN
o
Not
e: R
elev
ant c
hapt
ers a
re in
dica
ted
betw
een
pare
nthe
ses.
Transit Oriented Development260
Second, there seem to be quite different local interpretations of the ideal mix of strategy elements, which rarely appear in the straightforward forms advocated in Chapters 2 and 3. There does not seem to be a strong association, however, between these differences and the degree of success. More flexible interpretations can still work, at least in transport and land use contexts consistent with TOD (see characterization in Table 19.2 below). The cases in point are the emerging European and South American best practices, where most of the strategy elements advocated by Newman and Cervero are in place, but they seem to be interpreted in more flexible ways than in the advocated by Newman and Cervero (see the many nuances in Table 19.1, see also Chapter 3). An interesting question is whether this flexibility can only be allowed in transport and land use contexts, such as those of the European and South American examples, which are relatively consistent with TOD in general terms (e.g. much lower car share, much higher population and job densities). While the examples are too short-lived to draw a conclusion as to their success, emerging North American and Australian examples seem also to point in the direction of the need for flexibility in translation of planning ideals (see Table 19.1).
Third, TOD strategies show a definite pattern of development over time, marked by both stability and adaptation. The most accomplished approaches documented in the book (Singapore, Tokyo, Copenhagen, Stockholm, Curitiba, Portland, Arlington County) all show a great stability of planning direction over very long time periods, typically spanning several decades. They also, however, document repeated adaptation of the strategy to respond to changing circumstances, or just to the changing understanding of the circumstances. The Singapore, Tokyo, and Portland chapters show this combination of an enduring sense of direction and a continuous refinement of the actual strategy particularly well (Chapters 8, 9 and 17). Accounts of other accomplished TOD implementation strategies elsewhere (e.g. Cervero, 1998) confirm this pattern. Most other examples discussed in the book are too short-lived to allow such conclusions. One can assume however, that they would also need a comparable capacity of both maintaining the overall clear direction and re-appraising their approach in relation to particular circumstances, that is, a capacity to learn from experience. In particular, the chapters on the Western Australian cases seem to document a still unaccomplished, but already very articulated learning process (Chapters 4, 6, 10 and 15). Similar learning processes can be also traced in other chapters, and in particular in Melbourne (as discussed in Chapters 11 and 13), Boston, Charlotte and Portland (as in Chapter 12), and other North American cases (as in Chapter 16). At the same time, however, these more recent examples seem to document a quite different learning process. A more heterogeneous array of actors is involved in a more diverse set of arenas than in the classic, more enclosed historical examples. Whether these learning processes will be more or less effective is yet to be established. They appear, however, to be required by the development of the institutional context.
Finally, the key strategy elements appear to need a reinterpretation in each new situation. Such reinterpretation needs to fit the specificities of the institutional and spatial context. For example, all successful TOD implementation strategies seem to
TODs for a Sustainable Future 261
have a working mechanism for combining public and private funding, and indeed it would appear that TOD is only possible with this combination – it does not occur without one or the other. However, the specificities of the mechanisms vary greatly, even within the same continent. Again, a comparison between state-driven financing mechanisms in Singapore and market-driven financing mechanisms in Tokyo is illustrative in this respect. The European and American examples all document yet another, more traditional division of tasks, with government financing infrastructure development and the private sector financing property development. The Australian cases document a particularly diverse set of mechanisms with no single prevailing model. Similar adaptations of the suggested guidelines seem to be needed to factor in aspects such as leadership (more and less ‘person centred’), or transport technology (rail and/or bus based).
To conclude this section, we can confirm the usefulness of the guidelines introduced in Chapters 2 and 3, but we need also to stress the importance of:
Identifying a transit and urban development integration mechanism, without a prior focus on just one possible source of it (i.e. centralized state planning),Interpreting guidelines in flexible ways and allowing them to evolve in time, so that they can fit the features of a specific, changing situation.
Implementation tools, processes, and actors
The general guidelines introduced above have been further articulated in the rest of the book. Part II of the book focused on implementation tools articulating the general guidelines discussed above. Taken together, the different chapters provide a rich overview of the actions required in different implementation phases and contexts, and of their realized or expected impacts. In Chapter 4, Curtis showed how in Perth integrated, regional transport and land use plans have been essential for promoting TOD, but that they need to be complemented with a set of measures aimed at identifying and characterizing TOD centers, fixing development targets, and retrofitting existing arterial roads. Furthermore, there is a need to establish a framework for cross-sector and cross agency collaboration and for community participation. Further exploring the Perth case, but moving from the regional to the area level in Chapter 6, Howe, Glass and Curtis showed the importance and the workings of an area-based redevelopment authority in actually delivering TOD. In Chapter 5, Cascetta and Pagliara discussed the diverse array of actions and conditions that has been put in place to redirect development in Naples and Campania towards a TOD mode. They pointed to a combination of TOD plans and measures analogous to those discussed by Curtis and colleagues, but also stressed the need for innovative design and marketing to reshape public perceptions, the involvement of different political levels and public and private actors, the creative combination of different funding sources. Finally, their contribution
•
•
Transit Oriented Development262
acknowledged the importance of ‘institutional windows of opportunity’ (in the Naples case, a federalist reform) and political continuity. In Chapter 7, Balz and Schrijnen discussed how a transition challenge similar to that in Naples is being tackled in the South of the Randstad. In comparison with Naples the process in the Randstad is rather emergent than consolidated and the focus is accordingly more on the collaborative identification and exploration of possibilities following the realization that there is a need to work at both developing new, regional and integrated plans and building a new, multi-level institutional capacity to implement them. Concluding this part, in Chapter 8, Pei-Ju Yang and How Lew discussed the accomplished TOD case of Singapore, which is exemplary for the internal consistency of measures at both the regional and the area level, the transport and the land use side. They also documented how these consistency results in tangible, substantial outcomes in terms of activity and mobility patterns.
Part III of the book moved from the description and discussion of the complex of measures needed to achieve TOD to the actual processes of identifying and implementing such measures. The Portland case, discussed by Arrington in Chapter 9, is in this respect exemplary. Portland is a mature TOD example with a time span of more than 30 years. The chapter provided a fascinating account of how the different building blocks of the approach were identified, but also further refined and enriched through continuous experimentation. In the process, Portland has learned how transit development should and could be used to leverage a broad combination of objectives; how not only planning but also educating professionals, redirecting funding streams and targeting development incentives is essential; how ambitions must be both realistic and daring; and, last but not least, how TOD is in the end just a means to achieve a much broader, ‘lifestyle’ goal. The absolute need for targeted institutional capacity building mentioned in several contributions was the central concern of Chapter 10, where Mouritz and Ainsworth discussed how this is being pursued in Perth. The details of what seems to be working in Perth might not apply to all other contexts, but the process is by all means instructive. The establishment of an integrated transport and land use planning regional authority, the promotion of TOD in the wider community, the actual engagement of stakeholders and the public in tackling problems, linking different sectors and levels of government, developing focused research activities, and a dedicated land development agency to implement the strategy all appear essential ingredients. In Chapter 11, Edghill, Kroen and Scheurer further focused on the development of effective inter-governmental linkages, an institutional capacity that proves crucial in all TOD processes, but is often missing at the outset. These linkages are crucial because TOD challenges many existing separations between government levels (federal, state, regional, municipality) and sectors (transport, land use). The authors showed and illustrated through a variety of cases how developing such linkages requires a combination of framing the TOD challenge across governmental scales and sectors, blending local and supra-local skills and resources, translating skills and resources into plans of action, and continuously reviewing progress on the ground.
TODs for a Sustainable Future 263
While reshaping the governmental environment appears essential to successful TOD, the involvement of other actors is no less important. The following parts of the book addressed the role of two crucial ones: the local community (Part IV) and the market (Part V). In Chapter 12, Poticha and Wood express concern for the affordability of TOD in the US and suggest strategies for mixed-income TOD. These include building public leadership which recognizes the objective of affordability and acts accordingly, realize that opportunities and threats for affordability vary in different contexts, think comprehensively about the whole transit district, realize that there are alternative ways to ensure affordability, encourage public-private partnership, and, whatever the case, be pro-active, because in light of the present trends and conditions mixed-income TOD won’t happen by itself. In Chapter 13, Rice addressed the issue of the actual involvement of the community in the TOD planning and development process. She showed how behind the notion of community there is a variety of subjects and, accordingly, a variety of reasons for supporting or refusing TOD. She stresses the need to develop strategies that recognize this variety of voices and realize that in most instances TOD means a leap in the unknown and uncertain for local people that needs to be facilitated. Based on the experience in Australian cities, four directions seem crucial for eliciting community support for TOD: delivering a development that is consistent with the expectation raised, particularly in term of transit services; further reinforcing the competitive position of transit by discouraging car use; starting with developing sites where community attitudes are more favourable; and, most importantly, ensuring there is continuous and real community involvement in the whole process.
Part V considered the role of markets in TOD. The fact that without the active involvement of private actors there cannot be any TOD is of course quite obvious, but of interest is how to get them on the board, and especially when this means a break with consolidated practices. In Chapter 14, James documented which drivers for private TOD financing have been successfully put in place by the Queensland Government. Developing favourable conditions and a workable format for public-private partnerships appear essential. The public sector cannot limit their role to regulation, but has to also provide leadership, proactive and integrated governance, and develop targeted urban finance and land assembly mechanisms. Furthermore, in order to legitimize the prioritizing of public resources towards TOD, there is a need to show and quantify to the community the benefits of this choice. These conclusions are compounded by the private sector view offered by Hemsley in Chapter 15, where many of the general conclusions of the previous chapter are articulated and detailed in a unique account of a successful TOD development in Australia as seen by the leading private actor. In Chapter 16, Utter assesses the present difficulties of involving private developers in TOD in the US but also sees many favourable (particularly demographic and cultural) trends, leading to the conclusion that more private initiative is to be expected in the future. Realizing this potential requires, however, that other actors acknowledge the structure and constraints of the development industry, and that not just developers, but all players have to their part. Finally, in Chapter 17, Chorus dissects the incredibly effective
Transit Oriented Development264
mix of conditions (such as the competitive position of transit) and incentives (such as allowed floor area ratios) driving developers towards railway station area development in Tokyo, perhaps the most successful example of market-led TOD in the world. While the Tokyo example is in many ways unique and difficult to re-apply, it provides very clear benchmarks for what would make TOD the dominant, rather than marginal mode of development.
Spanning across the lessons emerging from different parts of the book, in Chapter 18, Renne addressed the issue of how to assess the success of TOD. In line with the multi-actor reality and collaborative philosophy documented by all successful cases, he stresses the need to, and suggests ways of measuring performance from the point of view of each of the participating stakeholders (state and regional government, transit agencies, local government, communities and private developers). Such ‘multiple evaluations’, he contends, are an essential platform to jointly assess progress and jointly deliberate on successive moves.
Taken together, the lessons summarized here constitute an articulated toolbox for TOD implementation. Its main thrust and components are schematically depicted in Figure 19.1. The different chapters in the book richly illustrate its workings. In the remainder of this final chapter we will discuss how to transfer these lessons to other situations, that is, how to actually use the toolbox.
Transferring lessons
The cases discussed in the book vary widely. So will the cases where the lessons of this book will be applied in the future. While differentiation could run along many lines, at least two basic distinctions appear important. The first is between situations where the dominant challenge is that of structuring ‘new’ urban growth versus situations of re-structuring ‘old’ growth. While the same city may present examples of both, on the whole the former situations are more typical of cities in their times of rapid expansion, as American, Australian, European and Japanese cities in the decades following World War II and cities in developing Asia, Africa or South America in present years. The latter situations are more typical of cities in their times of slower (or no) expansion as is presently the case in European or Japanese cities. This distinction is important because the constraints and opportunities to TOD implementation can be different, and thus require different strategies. For instance, for the European context, Bertolini (2007) defines the challenge in the first group of structuring new growth as one of ‘Coordinated development’ and in the second group of re-structuring old growth as one of ‘Reconnecting developments’. Analogous differences in challenges and solutions are also documented in this book.
A second important distinction stems from the basic relationships between transport and land use patterns discussed in the first chapter. On one side there are cities and regions that, even without an explicit TOD (or comparable) strategy, already have transport and land use characteristics relatively consistent with TOD
TODs for a Sustainable Future 265
(i.e. an extensive transit network and/or high land use densities and functional mix, or a combination of ‘transit’ and ‘biking and walking’ environments) and cities and regions that can rather be characterized as ‘car environments’ (compare Figure 1.1). Examples of the former are the European and South American cities and regions now attempting to reconfigure development according to TOD principles discussed in this book (Naples/Campania, Randstad South, and Bogota). Examples of the latter are North American and Australian cities and regions with similar ambitions (as most other examples in the book). Also in this case, successful TOD implementation strategies can be expected to be significantly different.
Figure 19.1 The toolbox for TOD implementation
Transit Oriented Development266
Table 19.2 summarizes these basic distinctions and illustrates them with cases discussed in the book. It is important to stress that both the distinctions and the examples are ideal-typical. The reality is much more nuanced with the same city presenting situations belonging to different categories. Furthermore, a third category of crucial distinctions, that is distinctions in the institutional context, should be kept in mind, but cannot be treated here because of its complexity. However, and in light of the goal of transferring lessons of the book, the characterization can help explore in which measure TOD strategies can be seen as independent of the basic characteristics of the transport and land use context and in which measure they should vary. The position of contemporary Chinese cities (or similarly rapidly growing cities) if they were to adopt a TOD approach is also indicated in the table.
Conclusion: How to use this book
We have identified some patterns for the general and more specific lessons provided by the experiences discussed in this book. We have also suggested which basic differences in the context might require differences in strategies. These most importantly include differences in existing transport and land use patterns and dominant development challenge (see table 19.2) and differences in the institutional context (requiring different forms of governance). For more detailed
Table 19.2 Classification of cases discussed in the book in terms of dominant challenge and existing transport and land use patterns
Dominant (but not exclusive) challengestructure ‘new’ growth Re-direct ‘old’ growth
existing transport and land use patterns
Consistent with TOD (i.e. high activity densities/functional mix, extensive transit network etc.)
Type 1.Singapore (3, 8)Tokyo – past (17)Copenhagen (3)Stockholm (3)Curitiba (3)Chinese and other rapidly developing cities (if adopting TOD)
Type 2.Naples-Campania (5)Randstad South (7)Rheinbach (11)Bogota (3)Tokyo – present (17)
Not consistent with TOD (i.e low activity densities/functional separation, car dependency etc.)
Type 3.Portland (9, 12)Arlington County (3)Western Australia (4, 15)
Type 4.Western Australia (2, 4, 6, 10, 15)Melbourne (2, 11, 13)South East Queensland (2, 14)Boston (12)Charlotte (12)
Note: Relevant chapters are indicated between parentheses.
TODs for a Sustainable Future 267
advice, we refer the reader to that chapter: a further effort in generalization would miss the richness of experiences and insights each chapter has to offer. We would like, however to stress two final points. When looking for lessons to apply in contexts other than those discussed in this book it is important to:
Acknowledge the specificity of the context, at least in terms of the dominant challenge (develop or transform?) and the existing transport and land use patterns (more or less consistent with TOD?). Types of questions to prompt this exploration could be: what are and how consistent with TOD are current transport and land use patterns? What are and how strong are present transport and land use integration mechanisms? What is the scope for changing patterns and mechanisms? And thus: which cases in the book show most similarities and what could be the implications?Acknowledge the uniqueness of the task, and thus see suggestions for tools or approaches to the planning and development process more as a source of inspiration, as a possibility, rather that as something to apply literally and directly. The starting point could be questions as: what are, in this particular situation, the opportunities and threats for the TOD implementation strategies as indicated by this book? In recognizing these specific opportunities and threats, how could interpretations and adaptations of these strategies assist your application? How can they strengthen transit and urban development integration mechanisms?
•
•

This page has been left blank intentionally
References
ACIL Tasman, Tract Consultants (2005), Metropolitan Activity Centres. Performance Measures (Melbourne: ACIL Tasman, Tract Consultants).
American Public Transportation Association, Transit Oriented Development, http://www.apta.com/research/info/briefings/briefing_8.cfm, accessed 12 April 2008.
Aoki, E., Imashiro, M., Kato, S. and Wakuda, Y. (2000), A History of Japanese Railways 1872–1999 (Tokyo: East Japan Railway Culture Foundation).
Arlington County Department of Community Planning, Housing and Development (2002), Developments in the Metro Corridors – 2000, July 2002 (Arlington: Arlington County Department of Community Planning, Housing and Development).
Arrington, G.B. (1998), At Work in the Field of Dreams: Light Rail and Smart Growth in Portland (Portland, Oregon: TriMet).
Arrington, G.B. (2000), Reinventing the American Dream of a Livable Community: Light Rail and Smart Growth in Portland (paper presented at 8th Joint Conference on Light Rail Transit Investment for the Future, Transportation Research Board and American Public Transportation Association, Dallas, Texas, November 11–15, 2000).
Arrington, G.B. (2005), US Experiences, Challenges and Prospects for Transit Oriented Development – Issues for Melbourne address to Department of Sustainability and Environment, Friday July 8th 2005, Melbourne.
Atelier Zuidvleugel (2006), Ruimte en Lijn, Ruimtelijke Verkenning Stedenbaan 2010–2020, Zuidvleugel van de Randstad (Den Haag: Provincie Zuid-Holland).
Australian Bureau of Statistics (ABS) (2002), Census 2001. Available online at www.abs.gov.au.
Banister, D. (2002), Transport Planning. 2nd Edition. (London: Spon Press).Banister, D. (2005), ‘Overcoming Barriers to the Implementation of Sustainable
Transport’, in Rietveld, P. and Stough, R. (eds), Barriers to Sustainable Transport: Institutions, Regulations and Sustainability (Abingdon: Spon Press).
Banister, D. (ed.) (2005), ‘Transport and Urban Form’, Unsustainable Transport: City Transport in the New Century (Oxfordshire: Routledge).
Barton, H., Grant, M., and Guise, R. (2003), Shaping Neighbourhoods: A Guide for Health, Sustainability and Vitality (London: Spon Press).
Batchelor, P. (2005), ‘Melbourne’s Public Transport Future on Track’ in The Age, 8 November.
Transit Oriented Development270
Bell, D. and Jayne, M. (eds) (2006), Small Cities: Urban Experience beyond the Metropolis (New York (NY): Routledge).
Berg, L. van den, and Pol., P. (1998), The European High-Speed Train and Urban Development (Aldershot, UK: Ashgate).
Bernick, M. and Cervero, R. (1997), Transit Villages in the 21st Century (New York: McGraw-Hill).
Bertolini, L. (1999), ‘Spatial Development Patterns and Public Transport: The Application of an Analytical Model’, in The Netherlands, Planning Practice and Research, Vol. 14, No. 2, pp. 199–210.
Bertolini, L. (2000), ‘Planning in the Borderless City. A Conceptualisation and an Application to the Case of Station Area Redevelopment’, in Town Planning Review, Vol. 71, No. 4, pp. 455–475.
Bertolini, L. (2007), ‘Station Areas as Nodes and Places in Urban Networks: An Analytical Tool and Alternative Development Strategies’, in F. Bruinsma, E. Pels, H. Priemus, P. Rietveld and B. Van Wee (eds), Railway Stations and Urban Dynamics (Heidelberg: Physica Verlag).
Bertolini, L. and le Clercq, F. (2003), ‘Urban Development without More Mobility by Car? Learning from Amsterdam, A Multimodal Urban Region’, in Environment and Planning A, Vol. 35, No. 4, pp. 575–589.
Bertolini, L. and Spit, T. (1998), Cities on Rails: The Redevelopment of Railway Station Areas (London: Spon Press).
Bestuurlijk Platform Zuidvleugel (2006), Regionale Verkenning Stedenbaan (Den Haag: Bestuurlijk Platform Zuidvleugel).
Bestuurlijk Platform Zuidvleugel (2007), Ruimtelijke Ambitie Stedenbaan 2020 (Den Haag: Bestuurlijk Platform Zuidvleugel).
Birrell, B., O’Connor, K., Rapson, V., and Healy, P. (2005), Melbourne 2030: Planning Rhetoric vs Urban Reality (Melbourne: Monash University Press).
BMVBW, rak (Bundesministerium für Verkehr, Bau- und Wohnugswesen, Regionaler Arbeitskreis Entwicklung Planung und Verkehr Bonn/Rhein-Sieg/Ahrweiler) (undated), Wohnungsbauprojekte in der Region (Bonn: BMVBW).
Boelens, L. et al. (2005), Milieudifferentatie langs de Stedenbaan (Den Haag: Provincie Zuid-Holland).
Brimbank City Council (2005a), Report on the Findings of the Community Consultation on the Sydenham Transit City Draft Master Plan, conducted by Village Well, April–June 2005.
Brimbank City Council (2005b), Sydenham Transit City Masterplan, September 2005.
Bruinsma, F., Pels, E., Priemus, H., Rietveld, P. and Van Wee, B. (eds) (2007), Railway Stations and Urban Dynamics (Heidelberg: Physica Verlag).
Burchell, R., Lowenstein, G., Dolphin, W., Galley, C., Downs, A., Seskin, S., Still, K. and Moore, T. (2002), Costs of Sprawl – 2000 (Washington, D.C.: National Academy Press).
Button, J. (2004), ‘Battle Stations’, in The Age, 28 April, 2004.
References 271
Buxton, M. and Scheurer, J. (2007), ‘Density and Outer Urban Development in Melbourne’, in Urban Policy and Research, Vol 25, No 1.
California Department of Transportation (2002), Statewide Transit-Oriented Development Study: Factors for Success in California, Technical Appendix (Sacramento: California Department of Transportation).
Calthorpe, P. (1993), The Next American Metropolis: Ecology, Community, and the American Dream (New York: Princeton Architectural Press).
Carr, D. (1979), ‘Metropolitan Design’, in Gentilli, J. (ed.) (1979), Western Landscapes (Perth: University of Western Australia Press).
Cascetta, E. (2001), Transportation Systems Engineering: Theory and Methods (Boston: Kluwer).
Cascetta, E. (2005), The Transport Challenge in Campania: An Integrated System for Sustainable Mobility (La sfida dei trasporti in Campania: un sistema integrato per la mobilità sostenibile) (Naples: Electa).
Cascetta, E. (2006), Models for Transportation Systems: Theory and Applications (Modelli per i Sistemi di Trasporto: Teoria e Applicazioni) (Novara: UTET).
Cascetta, E. and Pagliara, F. (2008), ‘Integrated Railways-based Policies: The Regional Metro System (RMS) Project of Naples and Campania’, Transport Policy, Vol. 15 (2).
Center for Disease Control (CDC) (2008a), Obesity and Overweight: Introduction, http://www.cdc.gov/nccdphp/dnpa/obesity, accessed 7 April 2008.
Center for Disease Control (CDC) (2008b), ‘Prevalence of Current Smoking among Adults Aged 18 Years and Over: United States, 1997–September 2007’, http://www.cdc.gov/nchs/data/nhis/earlyrelease/200803_08.pdf, accessed 6 Apr. 2008.
Center for Transit-Oriented Development (CTOD) (2004, revised 2005), Hidden in Plain Sight: Capturing the Demand for Housing Near Transit (Oakland, California Reconnecting America), http://www.reconnectingamerica.org/public/reports, accessed 16 July 2008.
Center for Transit-Oriented Development (CTOD) (2006), The Affordability Index: A New Tool for Measuring the True Affordability of Housing Choice (Oakland, California).
Center for Transit-Oriented Development (CTOD) (2007), Realizing the Potential: Expanding the Housing Opportunities Near Transit (Oakland, CA Reconnecting America), http://www.reconnectingamerica.org/public/reports, accessed 30 July 2008.
Center for Transit-Oriented Development (CTOD) (2007), Demand Estimate Update (Oakland, California: Reconnecting America), http://www.reconnect ingamerica.org/public/reports, accessed 16 July 2008.
Cervero, R. (1994), ‘Transit-Based Housing in California: Evidence on Ridership Impacts’, in Transport Policy, 1, pp. 174–183.
Cervero, R. (1998), The Transit Metropolis: A Global Inquiry (Washington, D.C.: Island Press).
Transit Oriented Development272
Cervero, R. (1998), Transit Villages in California: Progress, Prospects, and Policy Reforms IURD Working Paper 98–08.
Cervero, R., Arrington, G.B., Smith-Heimer, J., Dunphy, R., Murphy, S., Ferrell, C., Goguts, N., Tsai, Y.-H., Boroski, J., Golem, R., Peninger, P., Nakajima, E., Chui, E., Meyers, M., McKay, S. and Witenstein, N. (2004), Transit Oriented Development in America: Experiences, Challenges, and Prospects, TCRP Report 102, National Academy Press, Washington, D.C.
Cervero R. and Duncan, M. (2002a), Residential Self Selection and Rail Commuting: A Nested Logit Analysis (Berkeley: University of California Transportation Center Working Paper), http://www.uctc.net/papers/604.pdf, accessed 15 May 2008.
Cervero, R. and Duncan, M. (2002b), ‘Benefits of Proximity to Rail on Housing Markets’, in Journal of Public Transportation, 5, 1–18.
Cervero, R. and Duncan, M. (2002c), ‘Transit’s Value-Added Effects: Light and Commuter Rail Services and Commercial Land Values’, in Transportation Research Record, 1805, 8–15.
Cervero, R. and Kockelman, K. (1997), ‘Travel Demand and the 3Ds: Density, Diversity and Design’, in Transportation Research, Part D, 2, pp. 199–219.
Chatman, D. (2006), Transit-Oriented Development and Household Travel: A Study of California Cities (DRAFT) (Los Angeles: Institute of the Environment, Institute of Transportation Studies, Department of Urban Planning, School of Public Affairs).
City of Cleveland (2001), The Effect of Rail Transit on Property Values: A Summary of Studies (Draft), Prepared by Parsons Brinkerhoff, Cleveland, Ohio.
City of Subiaco (2006), Subiaco Central Development Plan (Perth: City of Subiaco).
Consejo Nacional de Politica Económica y Social (2000), Sistema de Servicio Publico Urbano de Transporte Masivo de Pasajeros de Bogotá Departamento Nacional de Planeación, Documento No. 3093.
Corrigam, M.B. et al. (2005), Ten Principles for Successful Public Private Partnerships (Urban Land Institute Washington (www.uli.org)).
Cortright, J. (2007), Portland’s Green Dividend, Whitepaper for CEOs for Cities, Chicago, IL.
Cox Architects and Planners (2005), Frankston TAFE to Bay Structure Plan.Curtis, C. (2001), Future Perth: Transport Issues and Options (Perth: Western
Australian Planning Commission).Davison, G. (2005), Car Wars: How the Car Won our Hearts and Conquered our
Cities (Melbourne: Allen and Unwin).DeBarros, K.A., Wan He, M.S. and Velkoff, V. (2005), 65+ in the United States:
2005 (U.S. Census Bureau), http://www.census.gov/prod/2006pubs/p23-209.pdf, accessed 10 Apr. 2008.
De Majo, S. (2006), ‘Dalla Bayard Alla Direttissima. Storia della Rivoluzione Ferroviaria in Campania 1839–1927’, in Giannini (ed.), Railways and Tramways in Campania (Ferrovie e Tranvie in Campania), pp. 15–54.
References 273
Department of Infrastructure (DOI) (2002), Melbourne 2030: Planning for Sustainable Growth (Melbourne: DOI).
Department of Sustainability and Environment (DSE) (2004), Kananook Creek Urban Design Workshop (Melbourne: DSE).
Department of Transport, Ministry for Planning, Main Roads Western Australia (1996), Metropolitan Transport Strategy (Perth: Government of Western Australia).
Dittmar, H. and Ohland, G. (2004), The New Transit Town: Best Practices in Transit-Oriented Development (Washington, D.C.: Island Press).
Dittmar, H. and Potichia, S. (2004), ‘Defining Transit-Oriented Development: The New Regional Building Block’, in Dittmar, H. and Ohland, G. (eds), The New Transit Town: Best Practices in Transit-Oriented Development (Washington, D.C.; London: Island Press), pp. 19–40.
DOI (2002), Melbourne 2030 (Melbourne: Department of Infrastructure).DPCD (2007), Transit Cities: Melbourne 2030 in Action (Melbourne: Department
of Planning and Community Development), http://www.dse.vic.gov.au, accessed 11 December 2007.
DSE (undated), Transit Cities and South East Metropolitan Activity Centre Triple Bottom Line Evaluation and Monitoring, Chapter 4 Baseline Results (Melbourne: Department Sustainability and Environment, Victoria), http://www.dse.vic.gov.au/../$File/Transit Cities and SEAC chapter 4 Sydenham.pdf, accessed 2 December 2007.
Dunphy, R., Cervero, R., Dock, F., McAvey, M. and Porter, D. (2005), Developing Around Transit: Strategies and Solutions That Work (Washington, D.C.: Urban Land Institute).
Dunphy, R., Myerson, D. and Pawlukiewicz, M. (2003), Ten Principles for Successful Development Around Transit (Washington, D.C.: Urban Land Institute Washington (www.uli.org)).
Edghill, J.L. (2007), City as Soul: Applying Adaptive Sustainability to Placemaking. Unpublished Manuscript.
Engwicht, D. (1992), Towards an Eco-City – Calming the Traffic (Sydney (NSW):Envirobook).
Environmental Protection Agency (EPA) (2008), Greenhouse Gas Emissions from the US Transportation Sector, http://www.epa.gov/oms/climate/420r06003.pdf, accessed 30 July 2008.
Ewing, R., Bartholomew, K., Winkelman, J., Walters, J. and Chen, D. (2008), Growing Cooler: The Evidence on Urban Development and Climate Change (Washington, D.C.: Urban Land Institute).
Ewing, R., Pendall, R. and Chen, D. (2002), Measuring Sprawl and its Impact (Washington, D.C.: Smart Growth America).
Florida, R. (2002), The Rise of the Creative Class (New York (NY): Basic Books).
Frumkin, H., Frank, L. and Jackson, R. (2004), Urban Sprawl and Public Health (Washington, D.C.: Island Press).
Transit Oriented Development274
Gilbert, D. and Ginn, S. (2001), Live. Work. Play: Transit Oriented Sustainable Developments (Brisbane, Australia: Queensland Department of Public Works, Built Environment Research).
Giuliano, G. (1999), ‘Land Use Impacts of Transportation Investments: Highway and Transit’, in Hanson, S. (ed.), The Geography of Urban Transportation, 2nd ed. (New York: Guilford Press).
Goodman, R. and Coote, M. (2007), ‘Sustainable Urban Form and the Shopping Centre: An Investigation of Activity Centres in Melbourne’s Urban Growth Areas’, in Urban Policy and Research, Vol. 25, No. 1.
Goodwin, P. (1998), ‘Unintended Effects of Transport Policies’, in Banister, D. (ed.), Transport Policy and the Environment (London: E. & F.N. Spon).
Gordon, P. and Richardson, H. (1989), ‘Gasoline Consumption and Cities: A Reply’, in Journal of the American Planning Association, Vol. 55, No. 3, pp. 342–346.
Gorowitz, C. (2007), Transit Oriented Development and Affordable Housing, Report for LandCorp, Department of Planning and Infrastructure and Public Transport Authority, Perth: Institute for Sustainability and Technology Policy, Murdoch University.
Government of Victoria (2004), Linking Melbourne: Metropolitan Transport Plan (Melbourne: Government of Victoria).
Gravagnuolo, B. (2005), ‘Viaggio nelle stazioni della modernità’, in Cascetta (ed.), La sfida dei trasporti in Campania: un sistema integrato per la mobilità sostenibile (Naples: Electa), pp. 129–158.
Gustafson, R. (2008), Portland Streetcar CEO, Streetcar 202, Presentation by at the Congress for the New Urbanism, April 2008.
Guy, S. and Marvin, S. (2000), ‘Models and Pathways: The Diversity of Sustainable Urban Futures’, in Williams, K. Burton, E. and Jenks, M. (eds), Achieving Sustainable Urban Form (London: E. and F.N. Spon).
Gyourko, J. and Rybczynski, W. (2000), Financing New Urbanism Projects: Obstacles and Solutions Housing Policy Debate, Vol. 11, Issue 3, pp. 733–750.
Hall, P. (1997), ‘Reflections Past and Future in Planning Cities’, in Australian Planner, 34: 2, 83–89.
Hall, P. (2002), Cities of Tomorrow: An Intellectual History of Urban Planning and Design in the Twentieth Century. 3rd Edition (Oxford, UK; New York, NY, USA: Blackwell).
Hamilton, C. and Denniss, R. (2005), Affluenza – When Too Much is Never Enough (Crows Nest, N.S.W.: Allen and Unwin).
Harberger, A.C. and Jenkins, G.P. (1997), Manual: Cost-Benefit Analysis of Investment Decisions (Cambridge, MA: Harvard Institute for International Development).
Hartz-Karp, J. (2004), ‘Harmonising Divergent Voices: Sharing the Challenge of Decision-Making’, in Public Administration Today, Vol. 2, No. 1.
Hass Klau, C. (2004), Bus or Light Rail: Making the Right Choice, 2nd Edition (Brighton: Environmental and Transport Planning, Brighton).
References 275
House of Representatives (2005), Sustainable Cities (Canberra: Commonwealth of Australia).
Houston, C. (2007), ‘Camberwell, No Stopping this Station’, in The Age, 30 November 2007.
Howard, E. (1898; reprint 2003), To-Morrow: A Peaceful Path to Real Reform (New York: Routledge).
ILS, rak (Institut für Landes- und Stadtentwicklungsforschung des Landes NRW, Regionaler Arbeitskreis Entwicklung Planung und Verkehr Bonn/Rhein- Sieg/Ahrweiler) (2002), Standort Wohnen Region Bonn/Rhein-Sieg/Ahrweiler, Wohnungsbauprojekte der Impulsauszeichnung (Dortmund, Germany: ILS).
Industry Commission (1993), Taxation and Financial Policy Impacts on Urban Settlement, Report No. 30 (Canberra: Australian Government Publishing Service).
Jacobs, J. (1984), Cities and the Wealth of Nations (Harmondsworth: Penguin).JHK and Associates (1987), Development-Related Survey I (Washington, D.C.:
Washington Metropolitan Area Transit Authority).JHK and Associates (1989), Development-Related Survey II (Washington, D.C.:
Washington Metropolitan Area Transit Authority).Jones, E. (2006), Presentation given to Wynnum Enquiry by Design.Kandall, P. (1995), ‘Plan for Mass Transit’, in Newsweek, May 15 1995.Kenworthy, J. and Laube, F. (1999), An International Sourcebook of Automobile
Dependence in Cities, 1960–1999 (Boulder: University Press of Colorado).Kenworthy, J. and Laube, F. (2001), The Millennium Cities Database for
Sustainable Transport (Bruxelles, Belgium: International Association of Public Transport (UITP)).
King, A.D. (1978), ‘Exporting Planning: The Colonial and Neocolonial Experience’, in Urbanism Past and Present, 5: 1, 2–22.
Laird, P., Newman, P., Kenworthy, J. and Bachels, M. (2001), Back on Track: Rethinking Australian and New Zealand Transport Policy (Sydney: University of New South Wales Press).
Levine, J. (2005), Zoned Out: Regulation, Markets, and Choices in Transportation and Metropolitan Land Use (Washington, D.C.: RFF Press).
Levine, J. and Inam, A. (2004), ‘The Market for Transportation-Land Use Integration: Do Developers Want Smarter Growth than Regulations Allow?’, in Transportation, 31, pp. 409–427.
Litman, T. (2006), Parking Management Best Practices (Chicago: APA Planners Press).
Loukaitou-Sideris, A. and Banerjee, T. (2000), ‘The Blue Line Blues: Why the Vision of Transit Village May Not Materialize Despite Impressive Growth in Transit Ridership’, in Journal of Urban Design, Vol. 5, No. 2, pp. 101–125.
Lund, H., Cervero, R. and Willson, R. (2004), Travel Characteristics of Transit-Oriented Development in California (Pomona: Cal Poly Pomona).
Transit Oriented Development276
Mackay, M. (2003), Urban Design and Planning Principles for Activity Centres: A Draft Discussion Paper (Perth: Department for Planning and Infrastructure Western Australia).
Mallozzi, V.M. (2006), ‘Same Problem, Different Stations’, in New York Times, 13 August, Sec. 14WC, p. 1.
Marchetti, C. (1994), ‘Anthropological Invariants in Travel Behaviour’, in Technical Forecasting and Social Change, 47:1, 75–78.
Maribyrnong City Council (2002), Maribyrnong Municipal Pubic Health Plan Background Paper, Prepared by Lynley Dumble for Maribyrnong City Council.
Maribyrnong City Council (2005), (re)visioning Footscray. Red Road Consulting and Sarkissian Associates Planners for Maribyrnong City Council, June 2005.
Maribyrnong City Council (2007), Footscray Profile. http://www.maribyrnong.vic.gov.au, accessed 5 December 2007.
Mattemaker, L. and Brouwer, J. (2005), Diversiteit langs de Stedenbaan: vraagverkenning woonmilieus (Delft: ABF Research).
Mayer, J. (2007), ‘Portland Ranks First in the Nation in Biking to Work’, in The Oregonian, Portland, June 14, 2007.
McGinn, D. (2008), ‘Parking-Lot Rage’, in Globe Toronto, 15 March, p. M3.McGlynn, G. and Andrews, J. (1991), The Economic Cost-Benefits of Urban
Scenarios that Support ESD (Melbourne: Australian Commission for the Future).
McManus, P. (1993), ‘The Automobile and Planning in Perth, Western Australia: Historical Evolution’, in Papers for Centre for Architecture and Planning Research, Curtin University of Technology, Perth.
McManus, P. (2002), ‘Your Car is as Welcome as You are: A History of Transportation and Planning in the Perth Metropolitan Region’, in Haebich, A., Trinca, M., Gaynor, A. and Western Australian Museum (eds), Country: Visions of Land and People in Western Australia (Perth: Western Australian Museum).
Mees, P., Moriarty, P., Stone, J. and Buxton, M. (2006), Putting the Public Interest Back into Public Transport. A Report to the Victorian Community, Melbourne (VIC), Australia.
Metro (2008), Urban Growth Management Functional Plan (Portland, Oregon), http://www.metro-region.org/index.cfm/go/by.web/id/274, accessed March 2008.
Metropolitan Transport Trust (MTT) (1961), Report and Statement of Accounts (Perth: MTT).
Millar, R. (2005), ‘On the Road to Where?’, in The Age, 7 November.Mills, E.S. (1970), ‘Urban Density Functions’, in Urban Studies, Vol. 7, No. 1.Ministerie van VROM en Bestuurlijk Platform Zuidvleugel (2006), Visie op de
Zuidvleugel: motor in de delta (Den Haag: VROM).Ministeries van VROM, LNV, VenW en EZ (2004), Nota Mobiliteit (Den Haag:
VROM).
References 277
Ministry for Planning (1999), Development Control Policy 1.6 Planning to Enhance Public Transport Use (Perth: Government of Western Australia).
Ministry of Housing Physical Planning and Environment (MHPPE) (1991), The Right Business in the Right Place; Towards a Location Policy for Businesses and Services in the Interests of Accessibility and the Environment (The Hague: Ministry of Housing, Physical Planning and Environment).
Morris, W. and Kaufman, C. (1996), Mixed Use Development: New Designs for New Livelihoods (Brisbane, Australia: Department of Tourism, Small Business and Industry (QLD)).
Mumford, L. (1961), The City in History (Harmondsworth: Penguin).Munro, C. (2004), ‘Humphries Rails Against Development’, in The Age, 3 May
2004.Negro, S. and Gentile, D. (2005), ‘L’orario di Metrocampania’, in Cascetta (ed.),
La Sfida Dei Trasporti In Campania: Un Sistema Integrato Per La Mobilità Sostenibile (Naples: Electa), pp. 303–310.
Newman, P.W.G. (1992), ‘The Rebirth of Perth’s Suburban Railways’, in Hedgcock and Yiftachel (eds), Urban and Regional Planning in Western Australia (Perth: Paradigm Press).
Newman, P.W.G. (2001), ‘Railways and Re-urbanisation in Perth’, in Williams, J. and Stimson, R. (eds), Case Studies in Planning Success (New York: Elsevier).
Newman, P.W.G. (2007), ‘Beyond Peak Oil: Will Our Cities Collapse?’, in Journal of Urban Technology, 14: 2, 15–30.
Newman, P.W.G. and Kenworthy, J.R. (1989), Cities and Automobile Dependence: An International Sourcebook (Aldershot: Gower).
Newman, P.W.G. and Kenworthy, J.R. (1999), Sustainability and Cities: Overcoming Automobile Dependence (Washington, D.C.: Island Press).
Newman, P.W.G. and Kenworthy, J. (2006), ‘Urban Design to Reduce Automobile Dependence’, in Opolis, 2: 1, 35–52.
Newman, P.W.G., Thorpe, A., Greive, S. and Armstrong, R. (2003), ‘Locational Advantage and Disadvantage in Public Housing, Rent Assistance and Housing Loan Assistance’ (Melbourne: AHURI Project 80038).
Nuzzolo, A. and Coppola, P. (2007), Transport Accessibility and Spatial Distribution of Socioeconomic Activities, Proceedings of the Kuhmo Nectar Conference, Urbino, Italy, July.
Nuzzolo, A. and Negro, S. (2005), ‘La Rete Ferroviaria e la Metropolitana Regionale’, in Cascetta (ed.), La Sfida dei Trasporti in Campania: un Sistema Integrato per la Mobilità Sostenibile (Naples: Electa), pp. 35–50.
OECD (2007), Territorial Reviews: Randstad Holland, Netherlands (Paris: OECD).
Ohland, G. and Poticha, S. (2006), Streetcars and Cities in the Twenty-First Century, Reconnecting America – The American Public Transportation Association and the Community Streetcar Coalition, USA.
Transit Oriented Development278
Okada, T. (2006), ‘Case Study: Efforts in the Otemachi, Marunouchi, and Yurakucho Area’, in CPIJ News Letter 25, Tokyo.
Owens, S. (1984), ‘Spatial Structure and Energy Demand’, in Cope, D., Hills, P. and James, P. (eds), Energy Policy and Land Use (Oxford: Pergamon Press).
Pagliara, F. and Papa, E. (2006), ‘Impatti territoriali ed economici dei sistemi di trasporto pubblico locale: un’applicazione alla metropolitana di Napoli’, in Ferrari, P. and Cepolina E.M. (eds), Didattica e ricerca nell’ingegneria dei trasporti, pp. 230–237.
Papa, E., Pagliara, F. and Bertolini, L. (2007), ‘Rail System Development and Urban Transformations: Towards a Spatial Decision Support System’, in F. Bruinsma, E. Pels, H. Priemus, P. Rietveld and B. Van Wee (eds), Railway Stations and Urban Dynamics (Heidelberg: Physica Verlag), pp. 359–383.
Phang, S.Y. (1992), Housing Markets and Urban Transportation: Economic Theory, Econometrics and Policy Analysis for Singapore (Singapore: McGraw-Hill).
Phillips, D.R., Yeh, A.G.O., Kim, K.G., et al. (1987), New Towns in East and South-East Asia: Planning and Development (Hong Kong, New York: Oxford University Press).
Portland Bureau of Planning (1972), Planning Guidelines Portland Downtown Plan (Portland, Oregon: City of Portland).
Portland Development Commission, Community Livability Implementation Strategy, Portland, Oregon, http://www.pdc.us/pdf/ura/interstate/interstate_community_livability_strategy.pdf, accessed April 2003.
Prètsch, H. et al (2005), Ergebnisse und Hinweise für die Planungspraxis aus dem Projekt BAHN.VILLE – schienengestützte Siedlungsentwicklung und Verkehrsverknüpfung in deutschen und französischen Regione (Aachen, Germany).
Priemus, H., Rietveld, P, and Van Wee, B. (eds), Railway Stations and Urban Dynamics (Heidelberg: Physica Verlag), pp. 35–57.
Property Council of Australia (2005), South East Queensland Regional Plan: An Industry Perspective, Queensland.
Pucher, J. and Renne, J. (2003), ‘Socioeconomics of Urban Travel: Evidence from the 2001 NHTS’, in Transportation Quarterly, Vol. 57, No. 3, pp. 49–77.
Pushkarev, B.S. and Zupan, J.M. (1977), Public Transportation and Land Use Policy (Bloomington: Indiana University Press).
Queensland Government (2004), Draft South East Queensland Regional Plan: For Consultation (Brisbane: State of Queensland).
Queensland Government (2005), South East Queensland Regional Plan 2005–2026 (Brisbane: State of Queensland).
Queensland Government (2007), Queensland Housing Affordability Strategy (Brisbane: Department of Infrastructure).
Raetz, S. (2005), ‘Rheinbach – Der Weg zur Eigenständigkeit’, Informationen zur Raumentwicklung, No 8/2005.
Raetzl, S. (2006), Personal Communication to Edghill July 2006.
References 279
RAK (Regionaler Arbeitskreis Entwickling Planung und Verkehr Bonn/Rhein-Sieg/Ahrweiler) (2007), Von der ‘Ich- zur Wir-Region’ Die Region Bonn/Rhein-Sieg/Ahrweiler (Bonn: RAK).
Renne, J.L. (2005), Transit-Oriented Development in Western Australia: Attitudes, Obstacles and Opportunities (Perth: Planning and Transport Research Centre (PATREC)).
Renne, J.L. (2005), Transit-Oriented Development: Measuring Benefits, Analyzing Trends, Evaluating Policy, Dissertation, Edward J. Bloustein School of Planning and Public Policy, Rutgers University, New Brunswick, New Jersey.
Renne, J.L. (2007), Measuring the Performance of Transit-Oriented Developments in Western Australia (Perth: Planning and Transport Research Centre, Western Australia).
Renne, J.L. (2008a), ‘Measuring the Success of Transit-Oriented Development Using a Sustainability Framework: TOD Outcome Analysis’, in Thwaits, K., Porta, S., Romice, O. and Greaves, M. (eds), Urban Sustainability through Environmental Design (London: Taylor and Francis), pp. 106 – 111.
Renne, J.L. (2008b), ‘Smart Growth and Transit-Oriented Development at the State Level: Lessons from California, New Jersey, and Western Australia’, in Journal of Public Transportation, Vol. 11: 3.
Renne, J.L. and Wells, J. (2005), Transit-Oriented Development: Developing a Strategy to Measure Success (Washington, D.C.: Transportation Research Board of the National Academies, National Cooperative Highway Research Program).
Rietveld, P. and Stough, R. (eds) (2005), Barriers to Sustainable Transport: Institutions, Regulations and Sustainability (Abingdon: Spon Press).
Ross, C.L. and Dunning, A. (1997), Land Use Transportation Interaction: An Examination of the 1995 NPTS Data, prepared for the Federal Highway Administration, p.21.
Sadik-Khan, J. (2006), Transit-Oriented Development: Unlocking the Market, Senior Vice President, Parsons Brinckerhoff, USA.
Sandavol, E. and Hildalgo, D. (2002), TramsMilenio: A High Capacity – Low Cost Bus Rapid Transit System Developed for Bogotá (Colombia, Bogotá: Transmilenio, S.A.).
Santos, E. (2007), The Model of Curitiba Brazil, Draft Manuscript (Berkeley, Institute of Urban and Regional Development).
Scheurer, J., Kenworthy, J. and Newman, P. (2005), Most Liveable and Best Connected: The Economic Benefits of Investing in Public Transport in Melbourne (Melbourne (VIC), Australia: Metropolitan Transport Forum (MTF)).
Schrank, D. and Lomax, T. (2005), The 2005 Urban Mobility Report (Texas: Texas Transportation Institute, Texas A&M).
Shoup, D. (2005), The High Cost of Free Parking (Chicago: APA Planners Press).
Transit Oriented Development280
Silkstone, D. (2005), ‘Too Slow, Too Infrequent… and Grinding to a Halt’, in The Age, 5 November.
Silkstone, D. and Millar, R. (2005), ‘Car Wars: A Tale of Two Cities’, in The Age, 8 November.
Singapore Broadcasting Corporation (SBC) (1980), Video on The MRT debate of Singapore, Chaired by Liu Thai Ker (Singapore: Singapore Broadcasting Corporation).
Singapore Department of Statistics, Singapore Census of Population 1980, 1990, 2000, Geographic Distribution, Income and Travel (Singapore: Dept. of Statistics).
Singapore Housing and Development Board (HDB), Annual reports 1965 to 2006 (Singapore: Housing and Development Board).
Singapore Housing and Development Board (HDB), Unpublished internal documents (Singapore: Housing and Development Board).
Singapore Land Transport Authority (2005), The Journey: Singapore’s Land Transport Story (Singapore: Land Transport Authority).
Singapore Land Transport Authority (2006), Building The Best: Land Transport System for Singapore – Annual Report 2005/2006 (Singapore: Land Transport Authority).
Singapore Urban Redevelopment Authority (URA) (1991), Constellation plan 1991 (Singapore: Urban Redevelopment Authority).
Singapore Urban Redevelopment Authority (URA) (1994, 1996, 1997), Planning Area Reports of Queenstown, Clementi and Sengkang (Singapore: Urban Redevelopment Authority).
Singapore Urban Redevelopment Authority Website, http://www.ura.gov.sg/student/, accessed on August 2007.
Sorensen, A. (2001), ‘Subcentres and Satellite Cities: Tokyo’s 20th Century Experience of Planned Polycentrism’, in International Planning Studies, 6(1), pp. 9–32.
Sorensen, A. (2003), ‘Building World City Tokyo: Globalization and Conflict Over Urban Space’, in Annals of Regional Science, 37, pp. 519–531.
State of Victoria (2006), Meeting our Transport Challenges: Connecting Victorian Communities (Melbourne (VIC), Australia).
Stephenson, G. and Hepburn, J. (1955), Plan for the Metropolitan Region, Perth and Fremantle, Western Australia (Perth: Government Printing Office).
Steuteville, R. (2004), Transit-Oriented Development is Going Strong, According to Study, www.washington.bizjournals.com/washington/stories/2003/08/25/editorial3.html.
STPP and Center for Neighborhood Technology (2005), Driven to Spend: Pumping Dollars out of our Households and Communities (Washington, D.C.: STPP and Center for Neighborhood Technology).
Strategic Economics (2006), FTA New Starts Economic Development Criteria Working Paper (Berkeley, California: Strategic Economics).
References 281
Subiaco Business Association (1993), Subiaco Mainstreet Project Implementation Plan (Perth: Subiaco Business Association).
Targa, T. and Rodriquez, D. (2003), ‘Analysis of Bogotá’s Bus Rapid Transit System and its Impact on Land Development’, in Carolina Planning Journal, Winter 2003–2004, 26–36.
Topsfield, J. (2004), ‘Planners OK Five Storeys at Camberwell Station’, in The Age, 19 May 2004.
Transecon (2003), Urban Transport and Local Socio-Economic Development, Deliverables 4 and 5, http://www.transecon.org.
Transportation Riders United (TRU) (2006), Transit Oriented Development, http://www.detroittransit.org/cms.php?pageid=44, accessed 14 April 2008.
Troy, P. (1996), The Perils of Urban Consolidation, Leichardt, Sydney (Leichardt: The Federation Press).
United Nations Environmental Programme (UNEP) (2006), Buildings and Climate Change, http://www.unep.fr/pc/sbc/documents/Buildings_and_climate_chang e.pdf, accessed 5 April 2008.
Urban Land Institute and PriceWaterhouseCoopers (2005), Emerging Trends in Real Estate (Washington, D.C.: Urban Land Institute).
Urban Land Institute and PriceWaterhouseCoopers (2006), Emerging Trends in Real Estate (Washington, D.C.: Urban Land Institute).
Urban Land Institute and PriceWaterhouseCoopers (2007), Emerging Trends in Real Estate (Washington, D.C.: Urban Land Institute).
Urban Land Institute and PriceWaterhouseCoopers (2008), Emerging Trends in Real Estate (Washington, D.C.: Urban Land Institute).
US Census Bureau (2004), Projected Population of the United States, by Race and Hispanic Origin: 2000 to 2050, http://www.census.gov/ipc/www/usinterimproj/natprojtab01a.pdf, accessed 9 Apr. 2008.
US Department of Health and Human Services (US HHS) (2008), NHE summary including share of GDP, CY 1960–2006, http://www.cms.hhs.gov/NationalHealthExpendData/downloads/nhegdp06.zip, accessed 5 Apr. 2008.
Van Boxtel, K. (2007), Personal Communication to Edghill, May 2007.Van Vliet, D. (2000), ‘Development/Demonstration: An Adaptive Strategy’, in
Williams, K. Burton, E. and Jenks, M. (eds), Achieving Sustainable Urban Form (London: E. and F.N. Spon).
Vuchic, V. (2005), Urban Transit: Planning, Operations and Economics (Indianapolis: Wiley).
Wegener, M. and Fürst, F. (1999), Land-Use Transport Interaction: State of the Art. Transland. Integration of Transport and Land Use Planning, Work Package 2, Deliverable D2a, Institute of Spatial Planning, University of Dortmund, Dortmund.
Westerman, H.L. (1998), Cities for Tomorrow: Integrating Land Use, Transport and the Environment. Resource Document (Haymarket, New South Wales: Austroads Incorporated).
Transit Oriented Development282
Western Australian Planning Commission (WAPC) (1999), Future Perth Indicators (Perth: Government of Western Australia).
Western Australian Planning Commission (WAPC) (2004), Network City: Community Planning Strategy for Perth and Peel (Perth: WAPC).
Western Australian Planning Commission (WAPC) (2005), Network City – A Milestone in Metropolitan Planning. Statement by the WAPC on Partnerships for Planning Perth and Peel (Perth: WAPC).
Western Australian Planning Commission (WAPC) (1997), State Planning Strategy (Perth: Government of Western Australia).
Wulff, M., Healy, E. and Reynolds, M. (2004), ‘Why Don’t Small Households Live in Small Dwellings? Disentangling a Planning Dilemma’, in People and Place, Vol. 12, No. 1, pp. 57–70.
Yeh, S.H.K. (1973), Public Housing in Singapore – A Multi-Disciplinary Study (Singapore: Maruzen Asia for Housing and Development Board).
Index
accessibility 3, 139, 154, 242, 245, 250, 258in Bogotà 32in Brisbane 193in Campania 52, 54, 56in Curitiba 33–4in Los Angeles 244in Melbourne 145, 173, 174in Naples 54, 56in Perth 42, 43, 45, 46, 47, 69, 71, 72,
126, 127, 134, 201, 205in Portland 114in Queensland 188, 190, 191in Singapore 89in South Wing (Randstad) 76, 78, 82,
83, 85, 86in Sydney 17in US 156, 215in Western Australia 45, 246
activity intensity, see intensity of land useactivity mix, see mix of land useAdelaide 22Afragola station (Naples) 54–5, 61Albion (Brisbane) 194Arlington County 26, 29, 222, 260, 266Armadale Development Authority (Perth)
132Asia/Asian cities 15, 23Atlanta 242, 248AusLink 21Austin 216, 248Australia/Australian cities 10, 14, 16, 19,
20, 21–2, 139, 141–2, 182–3, 188, 261, 263, 265
Federal Better Cities projects 19, 67auto oriented transport (AOT) 94automobiles, see cars
Bangkok 15, 17BART (San Francisco) 115–16Beijing 15
Berlin 24bicycles, see cyclingBogotà 28–33, 260, 265, 266Boston 157–60, 169, 209, 214, 248, 260,
266Boulder 19Brasilia 34Brimbank Council (Melbourne) 179, 180Brisbane 11, 19, 20, 22, 187, 190–94
City Council 187, 190, 194Urban Renewal 190, 196, 198, 200
Bull’s Eye Plan 26–8Bus Rapid Transit (BRT) 18
in Bogotà 28–33in US 18
bus use/buses 17, 18in Bogotà 28–33in Brisbane 191in Campania 53, 56in Charlotte 162in Curitiba 33–4in Melbourne 144, 145, 146, 148, 175,
178, 180in Naples 53, 56in Perth 39, 43, 46, 127, 130, 135, 205in Portland 115, 124 n.7in Queensland 191, 195, 199in Singapore 93, 100, 103
California 242, 244, 248Camberwell (Melbourne) 11, 172, 177–9Campania 9, 49–63, 259, 261, 265, 266Canberra 22capacity of transit system 4–5
in Campania 55–7in Curitiba 34in Naples 55–7in Perth 46in South Wing (Randstad) 76–7
Car Free Days (Bogotà) 30, 32
Transit Oriented Development284
car use/cars 4, 5, 13–14, 15–16, 17, 20, 23, 35, 173, 174, 177, 241, 242, 249, 251, 252, 254
in Asian cities 23in Bogotà 30–31, 32in Brasilia 34in Campania 50, 53, 61in Curitiba 33–4in Italy 61–2in Melbourne 175, 178, 179–83 passim in Naples 50, 53, 61–2in Perth 39, 41–2, 68–9, 125, 130in Portland 109, 111, 116, 123in Singapore 25–6, 92–3, 100, 103–4in South Wing (Randstad) 82, 85, 86, 87in Stockholm 24in US 26, 35, 154–5, 210, 242, 243, 248in Western Australia 42, 246
Central Station (Naples) 63Centrist Road Planning 20Charlotte 160–63, 260, 266
Charlotte Area Transportation System 162
Charlotte and Mecklenburg County 162Chicago 215Claremont (Perth) 201, 202Clarkson Station (Perth) 130, 202Cockburn Central (Perth) 10, 130, 134–6community development corporations
(CDC) (Boston) 160, 162, 169Constellation Plan 24–5, 93Copenhagen 23, 24, 25, 26, 260, 266Crossings, The (Portland) 119–20Crown Motel (Portland) 116–17Curitiba 28, 29, 33–4, 260, 266cycling/bicycles 6, 15, 23, 173
in Bogotà 29–30, 32in Charlotte 162in Perth 42, 69, 128, 204, 205in Portland 124 n.7, 165in South Wing (Randstad) 79, 88in US 32
Dallas 215density 4–5, 8, 13–15, 18, 19, 20, 22, 49,
50–51, 171, 177, 245, 254, 257, 258in Arlington County 26–8, 29in Australia 141–2
in Bogotà 31–2in Boston 160in Brasilia 34in Brisbane 187–8in Campania 259in Charlotte 160in Curitiba 34in Los Angeles 244in Melbourne 144–5, 173, 175, 176,
179–82, 259in Naples 50–51, 57–9, 259in Perth 42, 43, 44–5, 68, 70, 72, 125,
126, 128, 130, 134, 135, 136, 204–5in Portland 110, 111, 115, 119, 121,
122, 123, 165, 166, 198, 259in Queensland 187–8, 195, 259in Rheinbach 149in Singapore 25, 91, 92, 93, 94–9,
102–4, 105, 106, 259in South Wing (Randstad) 76, 79–89, 259in Tokyo 259in US 122 n.6, 153, 157, 214, 221, 243,
244, 247in Western Australia 42, 246, 259
Denver 217development oriented transport (DOT) 94
East Perth 19, 126Eastside light rail (Portland) 110, 112, 114,
117electric rail 13, 16–17, 22, 258Europe/European cities 23, 24, 261
federal government, see national government
Finger Plan 23, 24FKP Property Group (Brisbane) 194flexibility 4–5Footscray (Melbourne) 11, 172, 174–6Fortitude Valley (Brisbane) 19Frankston (Melbourne) 146–8, 150
Germany 10Gold Coast (Queensland) 11, 191–94governance 5–8, 196, 199, 258, 263, 265
see also public sectorgovernments, see local/municipal
government, national/federal
Index 285
government, prefectural government, public sector, regional government, state/provincial government
Gresham (Portland) 111Civic Neighborhood Plan 119
Gresham Station (Portland) 118–19
Hague, The 76, 77, 78, 88Hobart 22Holland 78
Ministry of Housing, Spatial Planning and the Environment 75, 78
Hong Kong 15housing 10, 19, 20, 35, 153–69, 173, 242,
245, 248, 249, 251, 252, 254in Arlington County 27, 28, 29in Australia 141in Boston 157–60, 169in Brisbane 187–8, 191, 194in Charlotte 160–63in Melbourne 147, 174–82 passimin Perth 42, 43, 44–5, 70, 71, 126,
127, 128, 129, 130, 134, 135, 189, 204–5, 206
in Portland 111, 112, 117, 118, 121, 122, 163–7, 169
in Queensland 187–9, 198–9in Rheinbach 149in Singapore 25, 92, 93, 94–9 passim,
100, 103, 105in South Wing (Randstad) 76, 79–89
passimin Tokyo 226, 227in US 35, 122 n.6, 153–7, 210, 212,
217–18, 248in Western Australia 42, 44–5, 126, 246
Hoyt Street Properties (Portland) 121, 166
intensity of land use 5, 6in Japan 230in Melbourne 173in Perth 72, 134, 205in Singapore 99, 100, 102in South Wing (Randstad) 8, 78, 79–89in Sydney 14in Tokyo 228, 231, 233, 234in US 215in Western Australia 44
Interstate light rail (Portland) 111, 113, 117investment 18, 183, 241, 252–3, 254
in Arlington County 27in Bogotà 32–3in Boston 160in Brisbane 190–94in Campania 63in Melbourne 146, 176in Naples 59–60, 63in Perth 67, 125, 134, 189, 201–8in Portland 112–13, 117–22, 166, 215in Queensland 187–200in Rheinbach 149in Tokyo 230–38in US 122 n.6, 214–18
Jakarta 15Japan 231, 234
urban renaissance project 231, 234, 236–7, 238
Kelo (US) 213Kuala Lumpur 15Kwinana (Perth) 201, 203–8
Leighton (Perth) 10, 133–4light rail transit system (LRT) 17, 18, 21
in Charlotte 160–63in Portland 109–24, 165in Santa Clara 244in Singapore 101, 102in South Wing (Randstad) 76
local community 7, 10–11, 20, 141, 149–50, 241, 247, 251–2, 254, 255, 263
in Arlington County 26in Brisbane 191in Campania 63in Los Angeles 244in Melbourne 145, 147in Naples 63in Perth 43, 45, 47, 66–7, 68, 69,
70–71, 126, 127, 129, 130, 134–6in Portland 165, 167in Queensland 198in US 156, 215–16, 217–18in Western Australia 45, 47
Transit Oriented Development286
local/municipal government 3, 6, 10, 19, 139–50, 171–83, 241, 248, 251–2, 254, 255, 262
in Arlington County 27in Bogotà 32–3in Boston 159–60in Brisbane 187–8, 190–94, 196, 198in Campania 63in Charlotte 160–63in Melbourne 144–8, 150, 174–83
passimin Naples 63in Perth 44, 47, 65–73 passim, 126–36
passim, 204in Portland 109–24 passim, 165–7in Queensland 196, 198in Singapore 93, 94–9 passim, 102in South Wing (Randstad) 75, 77,
78–9, 85, 87, 88, 89in Tokyo 225–38in US 156, 213in Western Australia 44, 47, 126
London 24Los Angeles 215, 244Lowes (US) 213
Madrid 57Manila 15Marchetti Principle 16Market Road Planning 21MARTA (Atlanta) 116Marunouchi (Tokyo) 232, 233, 234–5mass rapid transit system (MRT)
in Singapore 24, 91–106Massachusetts 159
MassHousing 159, 169Massachusetts Bay Transportation
Authority 159–60, 169Maylands-Guildford project (Perth) 128measuring success 12, 241–55, 264Medellin 30Medellin Metro 30Melbourne 11, 22, 144–8, 150, 171–3,
174–6, 177–82, 183, 259, 260, 266Metropolitan Transport Forum 144,
145, 146, 150Metro (Portland) 111, 115, 117–20, 165Metrocampania 60
Metrorail (Arlington County) 26–8, 29Midland (Perth) 126Milton (Brisbane) 194mix of land use 5, 8, 13, 14, 15, 18, 19, 20,
22, 23, 241, 245, 248, 257in Arlington County 26–8, 29in Australia 142in Bogotà 31–2in Brasilia 34in Brisbane 192, 194in Campania 259in Charlotte 162, 163in Curitiba 34in Melbourne 259in Naples 57–9, 259in Perth 42, 43, 44–5, 67–73 passim,
130, 134, 135, 136, 201–5 passimin Portland 111, 118–19, 121–2, 123,
165, 259in Rheinbach 148in Queensland 188, 259in Singapore 24–5, 92, 93, 94,
100–102, 105, 259in South Wing (Randstad) 79–89, 259in Stockholm 23–4in Tokyo 226–7, 228–30, 233, 234–8,
259in US 156, 157, 168, 209, 210, 214,
216, 217, 221, 243, 244, 247in Western Australia 42, 246, 259
motorcycle/scooter use in Singapore 92–3
MTA (Los Angeles) 116
Naples 49–63, 259, 260, 261, 262, 265, 266Municipal Transportation Plan 50
national/federal government 19, 21, 139, 149, 262
in Australia 44, 190in Holland 78, 87in Italy 63in Japan 231, 234in US 116–17, 118, 156, 249
Network City (Western Australia) 9, 39, 42–3, 125–6, 128, 130, 136
New Jersey 19, 248, 250New Urbanists 18, 70New York and Manhattan 209, 214, 217, 250
Index 287
Newcastle (Australia) 22nodes and places 6, 244–5North-Rhine Westphalia 148–9, 150NS (Dutch national rail company) 78, 79,
87, 88
Oakville (Ontario) 250Oregon
Land-Use Planning Program 111Osaki Station (Tokyo) 231, 234, 236–7, 238
parking 5, 17, 20, 168, 242, 250in Australia 250in Bogotà 30, 32in Brisbane 192, 195in Canada 250in Melbourne 175, 176, 177, 180, 182,
183in Perth 68, 69, 70, 72, 130, 134,
135–6, 205in Portland 110, 111, 115, 118, 119,
120, 121, 123, 166in Singapore 26, 92, 100, 101, 102in US 35, 153, 211, 212, 214, 216–17,
221, 223, 247, 250Pearl District (Portland) 120–21, 164–6pearls on a string plan 95pedestrians, see walking Peet Limited (Perth) 201–8Perth 11, 18, 19, 20, 21, 22, 39–47,
125–37, 201–8, 247, 248, 261, 2621955 Plan 41Corridor Plan 41–2Metroplan 41–2Planning and Transport Research
Centre 126, 129, 136Subi Centro plan 65–73
Philadelphia 209places and nodes, see nodes and placesPlanetary Cluster Plan 23–4Portland 10, 21, 109–24, 163–7, 169, 198,
215, 222, 248, 259, 260, 262, 2661972 Downtown Plan 1122040 Growth Management Strategy
110Central City Plan 165, 166Community Liveability
Implementation Strategy 113
Development Commission 115, 117, 120, 166
Metropolitan Transportation Improvement Program 118
Portland Streetcar 109, 112, 113, 114, 121, 122, 163–7, 169
precincts 6, 9, 11, 254in Melbourne 147–8in Perth 47, 65–73, 126, 205in Rheinbach 148–9in US 209in Western Australia 47see also station areas
prefectural government (Japan) 231, 236Princeton Junction station (New Jersey) 250private property developers 11, 241, 252–3,
254, 255in Brisbane 190–94in Perth 47, 201–8in Queensland 187–200in Tokyo 225–38in US 209–23in Western Australia 47
private sector 11–12, 34–5, 143, 149–50, 242, 250, 258, 263, 265
in Arlington County 27in Boston 160in Brisbane 190–94in Campania 63in Melbourne 146, 150, 176in Naples 59–60, 63in Perth 39–40, 43, 45, 47, 68, 69,
70–71, 126, 127, 129, 131, 132, 133, 136, 201–8
in Portland 112–13, 118, 121–2, 123, 166, 167
in Queensland 187–200in South Wing (Randstad) 78, 85, 88–9in Tokyo 225–38in US 157, 209–23in Victoria (Australia) 144in Western Australia 45, 47
proximity to transit 195in Bogotà 31in Brisbane 191in Perth 68, 70, 71, 72, 206in Queensland 188in Rheinbach 149
Transit Oriented Development288
in Singapore 102–4, 106in US 223, 243
public-private partnership 8, 13, 20, 21, 22, 34–5, 143, 149–50, 250, 253, 258, 261, 265
in Arlington County 222in Brisbane 190–94in Campania 63, 259in Melbourne 150, 259in Naples 63, 259in Perth 39–40, 43, 45, 47, 71, 127,
129, 131, 132, 133, 201–8in Portland 118, 121–2, 166, 167, 222,
259in Queensland 187–200, 259in Singapore 259in South Wing (Randstad) 78, 85,
88–9, 259in Tokyo 259in US 169, 212, 220–22, 223in Victoria (Australia) 144in Western Australia 39–40, 45, 47,
204–5, 259public sector 6–7, 14, 19, 34–5, 139–50,
241, 242, 247–9, 252–3, 258, 262, 265
in Boston 159–60in Brisbane 190–94in Campania 63in Charlotte 160–63in Melbourne 144–8, 150, 174–83
passimin Naples 63in Perth 39–47, 66–7, 68, 69, 72–3,
125–37, 201–8in Portland 109–24, 166–7in Queensland 187–200in Singapore 93, 94–9 passim, 102in South Wing (Randstad) 75, 77,
78–9, 85, 87, 88, 89in Tokyo 225–38in US 156, 167, 213, 220–22, 223in Victoria (Australia) 144–8, 171–83
passimin Western Australia 39–47, 66, 67,
125–9, 204, 253Pyrmont (Sydney) 19
Queensland 187–200, 259, 263Property Council 194, 198, 199Queensland Transport 191–4, 200South Bank Redevelopment Authority
191, 198, 200South East Queensland Regional Plan
187, 189, 193–200 passimUrban Land Development Authority
198–9, 200Queenstown (Singapore) 93, 95, 100–102
rail transit 17–22 passimin Arlington County 26–8, 29in Boston 157–60in Brisbane 191–4, 196, 198in Campania 49–63, 259in Charlotte 160–63in Copenhagen 23, 24in Medellin 30in Melbourne 144–8, 175, 176, 178,
180, 182, 259in Naples 49–63, 259in Perth 39–47, 65–73, 125–37, 201–8in Portland 109–24, 259in Queensland 191, 195, 199, 259in Singapore 24–6, 91–106, 259in South Wing (Randstad) 75–90, 259in Stockholm 23–4in Tokyo 225–38, 259in US 242–4in Victoria (Australia) 144in Western Australia 39–47, 125–37, 259see also electric rail
Raleigh 248Randstad 9, 75–90Randstadrail 76rapid transit 8, 13, 15–18, 22REACH Housing (Portland) 117Reedy Creek station (Brisbane) 191–2regional government 241, 247–9, 254, 255,
262in Campania 63in Portland 109–24in South Wing (Randstad) 75, 77,
78–9, 85, 87, 88, 89–90in US 156, 167, 248
Regional Metro System (RMS) (Campania and Naples) 9, 49–63
Index 289
regional planning 8–9, 19–20, 261, 265in Campania 49–63in Portland 109–24in Rheinbach 149in South Wing (Randstad) 75–90in Western Australia 39–47, 125–37, 248
Rheinbach 147, 148–9, 150, 266ridership 154–5, 241, 242, 250, 254
in Arlington County 28, 29in Bogotà 30in Boston 159in Campania 56, 61in Charlotte 160in Curitiba 34in Los Angeles 244in Medellin 30in Naples 56, 59, 61in Perth 47, 70, 127, 130in Portland 116, 117, 118, 124 n.7, 165in Singapore 25, 91, 93, 102–4, 105, 106in US 154–5, 210, 247in Western Australia 47
Rio de Janeiro 34Rotterdam 75, 76, 77, 78, 88Rotterdam Central Station 85
Salerno 50, 52, 55, 56, 57Salvator Rosa station 60San Francisco 217, 243, 248Santa Clara 215, 244São Paolo 34scale 4, 13–15Scandinavia/Scandinavian cities 23Sengkang (Singapore) 95, 101, 102Seoul 15Shibuya station (Tokyo) 227, 229Shimbashi station (Tokyo) 231Shinjuku station (Tokyo) 227, 229Singapore 9–10, 15, 24–6, 91–106, 258,
259, 260, 261, 262, 2661970 Concept Plan 91, 93, 94, 95, 991991 Concept Plan 93, 94Housing Development Board 25, 92,
94, 97, 99, 102Planning Department 93Urban Redevelopment Authority 99
Somerly-Clarkson (Perth) 201, 202South Bank (Brisbane) 191, 196, 198, 200
South East Queensland 11, 187–200, 259, 266Regional Plan 187, 190, 193–200
passimSouth Holland 75, 78, 89
South Wing Studio 78–9, 89South Waterfront (Portland) 113, 164–6South Wing (Randstad) 75–90, 259, 260,
265, 266South Wing Administrative Platform 75,
78–9, 88, 90, 262spatial concentration 4–5spatial reach 4–5, 6speed of transit system 4–5, 17
in Bogotà 30–31in Campania 55–6in Naples 55–6in Perth 46
state/provincial government 3, 6, 19, 21, 139, 143, 149–50, 241, 247–9, 254, 255, 262
in Italy 63in Massachusetts 159–60in Portland 109–11, 115, 248in Queensland 187–200in South Wing (Randstad) 75, 77,
78–9, 85, 87, 88, 89in US 156, 167, 248in Victoria (Australia) 144–8, 171–83
passimin Western Australia 39–47, 66, 67, 70,
125–37, 143, 204, 248stations and station areas 5–6
in Arlington County 27in Brisbane 191in Campania 54, 62–3in Charlotte 162, 163in Los Angeles 244in Melbourne 147–8, 176, 178in Naples 54–5, 57–9, 60–61, 62–3in Perth 65–73, 126, 127, 133–6, 201–8in Portland 109–11, 112, 116–20in Queensland 195in Rheinbach 148–9in Singapore 100–102in South Wing (Randstad) 77, 78, 79–89in Tokyo 225–38, 258in US 168, 209, 214, 215, 243in Western Australia 42
Transit Oriented Development290
Stedenbaan (Randstad/South Wing) 9, 75–90
Stockholm 23–4, 25, 26, 34, 260, 266strategic planning framework 13–22streetcar transit system
in Charlotte 162in Portland 109–24 passim, 163–7,
169, 198in Tokyo 227
Subi Centro station (Perth) 9, 65–73, 201–2Subiaco (Perth) 19, 65–73, 126, 131, 201–2
Central Development Plan 72Framework Plan 73Indicative Development Plan 73Redevelopment Authority 67–73
passimSurabaya 15sustainability 3, 8, 23–35, 140–43, 174,
241, 245–7, 253, 255, 257–67in Arlington County 26–8in Bogotà 29–33in Brasilia 34in Campania 51, 53in Curitiba 33–4in Melbourne 144, 146, 175in Naples 51, 53in Perth 129, 130, 136in Portland 113–14, 123, 165in Queensland 187in Rheinbach 149in Singapore 24–6in South Wing (Randstad) 85, 86–7, 90in Western Australia 45, 125, 143
Sustainability Management Systems 141Sydenham (Melbourne) 11, 172, 179–82Sydney 14 , 17, 21, 22
Toa Payoh (Singapore) 93, 95Tokyo 12, 15, 225–38, 258, 259, 260, 261,
264, 266Metropolitan Government 229, 231,
235, 237, 238Tokyo Station 231, 232, 233, 234–6trains, see rail transittrams 17
in Melbourne 144, 175, 178, 180in Portland 165, 198see also streetcar
transit agencies 11, 115–16, 167, 217, 241, 249, 250, 254, 255
Transit Mall (Portland) 112, 123Transmilenio (Bogotà) 28–33Travel Demand Management (TDM) 50TriMet (Portland) 110, 111, 113, 115–17,
118, 120, 124 n.7, 165
Ueno station (Tokyo) 230UK Town and Country Planning
Association 14United States/US cities 10, 11–12, 14, 15,
16, 19, 20, 21, 35, 209–23, 260, 261, 263, 265
United States Urban Land Institute 197–8urbanism 8, 23–35, 42
see also New Urbanistsurbanity (urban quality) 3
Vancouver 19, 20Varsity Station (Brisbane) 191–4, 196, 197,
198Victoria (Australia) 144–8, 171–83 passim
Department of Infrastructure 147, 150Department of Sustainability and
Environment 147, 150, 179Linking Melbourne program 145Melbourne 2030 plan 144–6, 171–3,
175, 178, 179Transit Cities program 144, 147–8,
150, 173, 175, 179, 181
walking/pedestrians 6, 15, 18, 23, 173, 241, 245
in Australia 141in Bogotà 29–30, 32in Charlotte 162in Los Angeles 244in Perth 42, 68, 69, 72, 128, 130, 201,
204, 205in Portland 111, 123, 165in Rheinbach 149in Singapore 91, 100–102 passim, 105in US 154, 156, 216, 247in Western Australia 246
Washington, D.C. 28, 209, 214, 243Wellard (Perth) 11, 131, 201, 203–8
Index 291
Western Australia 8–9, 10, 11, 39–47, 67, 125–37, 143, 248, 259, 260, 266
Department for Planning and Infrastructure 126, 131, 132, 136, 204, 253
Department of Housing and Works 126, 204
Homewest 204LandCorp 126, 130–33, 134–7 passimLocal Government Association 45, 126Main Roads 126Metropolitan Development Program 44Metropolitan Region Scheme 44Metropolitan Transport Strategy 42Planning Commission 44–5Public Transport Authority 126, 128,
204, 205TOD Coordinating Committee 10, 125,
126–9, 136
Western Sydney Fast Rail 21Westside light rail (Portland) 110, 111, 112,
114WMATA (Washington, D.C.) 116
zoning 19, 20, 196, 199in Arlington County 27in Boston 159, 160in Charlotte 162, 163in Perth 72, 73in Portland 110, 166, 167in Rheinbach 149in South Wing (Randstad) 80in Tokyo 12, 229–30, 231, 235, 236,
238in US 153, 157, 213, 214, 221, 243in Western Australia 44
Zuidvleugel, see South Wing (Randstad)

This page has been left blank intentionally


