MARKETING ENGINEERING FOR EXCEL • TUTORIAL • VERSION 1.0.8 Tutorial Customer Choice (Logit) Marketing Engineering for Excel is a Microsoft Excel add-in. The software runs from within Microsoft Excel and only with data contained in an Excel spreadsheet. After installing the software, simply open Microsoft Excel. A new menu appears, called “MEXL.” This tutorial refers to the “MEXL/Customer Choice (Logit)” submenu. Overview The customer choice (logit) model is an individual-level response model that helps analyze and explain the choices individual customers make in a market. Thus, the customer choice model helps firms understand the extent to which factors such as the price of a brand or its ease of installation influence a customer's choice. A brand's purchase probability at the individual level equals the brand's market share at the market level. Firms also can use customer choice analysis to develop marketing programs tailored to specific market segments, or even to individual customers. Furthermore, if a company has purchase data about its products versus those of their competitors (product choice data), as well as some observed independent variables (e.g., gender, price, promotion), it can use customer choice modeling to answer questions such as: 9 Does a customer’s gender influence his or her purchase decision regarding our product(s)? 9 Do competitor’s promotions affect the purchase of our product(s)? 9 How do our promotions affect our sales rates? CUSTOMER CHOICE (LOGIT) TUTORIAL 1/15
Transcript
MARKETING ENGINEERING FOR EXCEL • TUTORIAL • VERSION 1.0.8
Tutorial Customer Choice (Logit)
Marketing Engineering for Excel is a Microsoft Excel add-in. The software runs from within Microsoft Excel and only with data contained in an Excel spreadsheet.
After installing the software, simply open Microsoft Excel. A new menu appears, called “ME XL.” This tutorial refers to the “ME XL/Customer Choice (Logit)” submenu.
Overview The customer choice (logit) model is an individual-level response model that helps analyze and explain the choices individual customers make in a market. Thus, the customer choice model helps firms understand the extent to which factors such as the price of a brand or its ease of installation influence a customer's choice. A brand's purchase probability at the individual level equals the brand's market share at the market level.
Firms also can use customer choice analysis to develop marketing programs tailored to specific market segments, or even to individual customers.
Furthermore, if a company has purchase data about its products versus those of their competitors (product choice data), as well as some observed independent variables (e.g., gender, price, promotion), it can use customer choice modeling to answer questions such as:
Does a customer’s gender influence his or her purchase decision regarding our product(s)?
Do competitor’s promotions affect the purchase of our product(s)?
How do our promotions affect our sales rates?
CUSTOMER CHOICE (LOGIT) TUTORIAL 1/15
Getting Started Customer choice analysis allows you to use your own data directly or a preformatted template.
Because customer choice models require a specific data format, users with their own data should to review the preformatted template to learn an appropriate structure.
This section explains how to create an easy-to-use template to enter your own data.
If you want to run customer choice analysis immediately, open the example file “OfficeStar Data (Customer Choice).xls” and jump to “Step 2: Running analysis.” By default, the example files install in “My Documents/My Marketing Engineering/.”
Step 1 Creating a template
Using the interactive assistant
In Excel, if you click on ME XL CUSTOMER CHOICE (LOGIT) CREATE TEMPLATE, a dialog box appears. This box represents the first step in creating a template for running the customer choice model. The first dialog box prompts you to use the interactive assistant.
Many Marketing Engineering for Excel models allow you to use the interactive assistant, which will prompt you to enter the parameters required by the model and build a template spreadsheet that directs you to enter the required data. This generated template includes pre-selected cell ranges that correspond to the parameters you enter. Marketing Engineering for Excel templates are recommended and will facilitate subsequent analyses.
Expert users who are familiar with Marketing Engineering for Excel models and data requirements may prefer to input data directly in an unformatted spreadsheet. Such users should begin with the interactive assistant to become familiar with the data format that Marketing Engineering for Excel expects.
Unless you are already familiar with the methodology, you should select “yes” in response to the box that asks whether you want to use the interactive assistant.
CUSTOMER CHOICE (LOGIT) TUTORIAL 2/15
With the interactive assistant, the following dialog box allows you to create a template to run the customer choice software. All customer choice models require at least one case per respondent (customer) and at least one independent variable.
The options are as follows:
Number of respondents: The total number of respondents (customers) in your study.
Number of cases per respondent: The number of observations per respondents (one or more than one purchase event).
Number of independent variables: The number of independent variables you collected or observed during the study, such as respondent gender, product on sale, and so forth.
CUSTOMER CHOICE (LOGIT) TUTORIAL 3/15
After completing the dialog box, click Next to move to the subsequent dialog box and define the customer choice template further.
There are two methods of collecting data for customer choice analysis:
Single alternative (Boolean, yes/no). This data format is suitable when customers face only one alternative, such as a choice between “buy” and “don’t buy.” That is, it requires a yes-no decision process.
Multiple alternatives. This data format considers customer responses across a subset of related competitors, such as brand A versus brand B versus brand C. Therefore, it requires a one-out-of-many decision process.
If you select the multiple alternatives option, you will activate the lower portion of the dialog box, which allows you to enter the labels you want to use to describe the various alternatives. In the box labeled “Enter new Alternative Label,” enter the label for the first alternative, then click the Add button. The alternative label appears in the list, as shown below:
CUSTOMER CHOICE (LOGIT) TUTORIAL 4/15
Repeat the process of adding options until you have entered all the desired labels. You may use the Up, Down, or Delete buttons to modify your list by simply selecting any item within the list.
If your data require a “no choice” option, you may specify it yourself or not. If you do not, the software will add this option automatically during the analysis.
For example, if customers must choose among three brands, A, B, and C, and some choose none of the options, the choice process actually involves four options (A, B, C, and none). The software identifies this issue and adds the fourth option (called a dummy) automatically. Alternatively, you may specify the four options manually.
After entering all alternatives, click OK to generate the data collection template, as shown below:
CUSTOMER CHOICE (LOGIT) TUTORIAL 5/15
Not using the interactive assistant
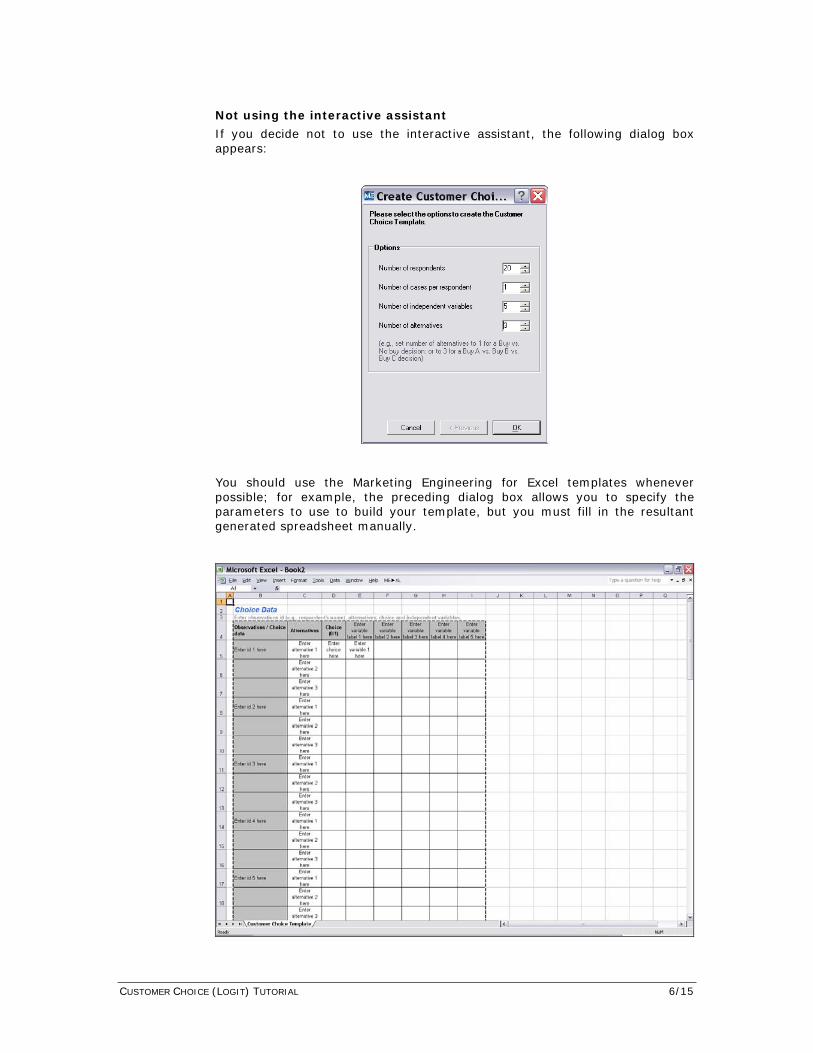
If you decide not to use the interactive assistant, the following dialog box appears:
You should use the Marketing Engineering for Excel templates whenever possible; for example, the preceding dialog box allows you to specify the parameters to use to build your template, but you must fill in the resultant generated spreadsheet manually.
CUSTOMER CHOICE (LOGIT) TUTORIAL 6/15
Step 2 Entering your data
In this tutorial, we use the example file “OfficeStar Data (Customer Choice).xls,” which by default appears in “My Documents/My Marketing Engineering/.”
To view a proper data format, open that spreadsheet in Excel. A snapshot is reproduced below.
For each respondent, a customer choice spreadsheet contains:
Alternative names for each product in the study. If the spreadsheet was generated using the one alternative option, this column is not present.
Cases. The same customer might have been exposed to the same choice, repeatedly, and these repetitions assist model estimation. If the spreadsheet was generated using the one case per respondent option, this column is not present.
Choice variables. The alternative the customer chose receives a value of 1; all other alternatives receive values of 0. Only one “1” can exist per case. If all options are set to 0, a none-of-the-above option (dummy) automatically appears during the analysis.
Independent variables. A column represents each variable specified for the study, and all independent variables should have consistent value ranges. That is, the data for a single independent variable should be scaled within the same range.
CUSTOMER CHOICE (LOGIT) TUTORIAL 7/15
Step 3 Running analyses After you enter your data in an Excel spreadsheet with the appropriate format, click on ME►XL CUSTOMER CHOICE (LOGIT) RUN ANALYSIS. The dialog box that appears allows you to set the options to perform the customer choice analysis of your data.
The four sections in this dialog box control the customer choice analysis.
Data
In this portion of the dialog box, you must indicate which data are present in the spreadsheet. If you have used the interactive assistant, the software automatically clicks the appropriate check boxes. If you are using a custom spreadsheet, you will need to select the appropriate check boxes to indicate which data are present.
Generate Alternate-Specific Constants. In general, it is a good idea to include alternative-specific constants in the model. If you check this option, the program will automatically generate the dummy variables for alternative-specific constants.
Significance level. Expressed in percentage terms, this option refers to the significance level of the statistical tests. The software uses this value to identify statistically significant coefficients from the analysis.
CUSTOMER CHOICE (LOGIT) TUTORIAL 8/15
Perform analysis on holdout sample. This option allows you to specify a number between 0 and 100 (0 is the default) to represent the percentage of the data you want to use as a holdout sample to assess the predictive validity of the model. If you choose this option, the customer choice analysis selects the closest feasible sample with a size equal to, or smaller than, the percentage you specify. For example, if you have 110 customers (cases) with one observation per customer and you specify 15%, the program sets aside the last 16 observations in the data file as the holdout sample and estimates the model using the first 94 customers.
Last case for each respondent. This option (only available when you specify that the data set contains multiple cases per respondents) uses the first cases associated with each respondent for model estimation and the last cases as the holdout sample for model prediction.
Latent Class Options
In this portion of the dialog box, you may indicate the maximum number of segments which ME►XL should consider. The default number of segments is set to 1 which is the most common option. If you have reason to believe your data may have multiple “latent” segments, you may select a number greater than 1. In the step that follows, you will be able to review the attributes of each segment and decide how many segments to include in the analysis.
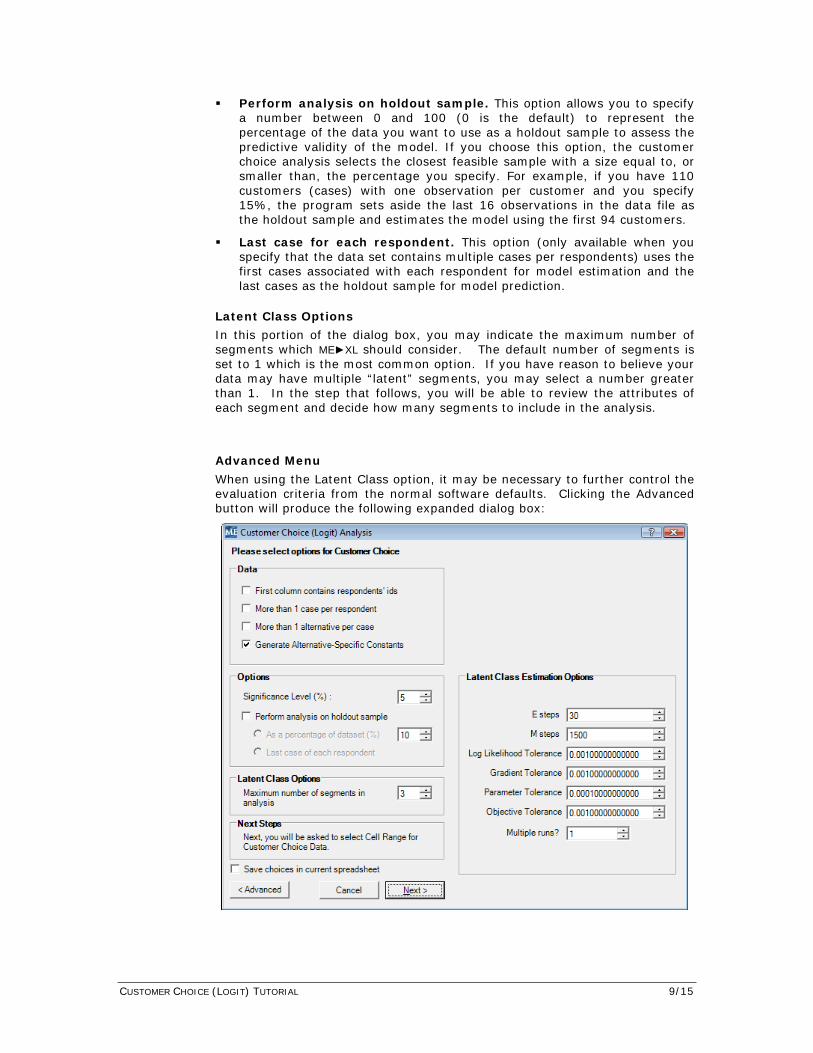
Advanced Menu
When using the Latent Class option, it may be necessary to further control the evaluation criteria from the normal software defaults. Clicking the Advanced button will produce the following expanded dialog box:
CUSTOMER CHOICE (LOGIT) TUTORIAL 9/15
Latent Class Estimation Options
Latent Class uses the EM algorithm. With each iteration, it alternately predicts the missing data (in the E or Expectation step) and based on these predictions re-estimates the parameters (in the M or Maximization step). The controls below allow user to influence the execution of the program. Typically the tolerance levels should be 0.001. The program uses several criteria to evaluate whether to terminate, including how fast the likelihood function is converging, how fast the coefficients of the model are converging. E steps: Specifies the number of expectation steps
M steps: Specifies the number of maximization steps.
Log Likelihood, Gradient, Parameter and Objective Tolerances: These parameters control the tolerances within the analysis. If a data set is not converging, the user should reduce the tolerance levels to gain better insight to the data. Note that decreasing the tolerance levels will increase the processing time required.
Multiple Runs?: In many cases, it will be necessary to make multiple runs of the same data to determine whether a true latent class exists. This parameter will allow you to re-run the model “n” times.
After selecting the desired options, click Next. The software will ask you to select the data on which to perform the analysis.
CUSTOMER CHOICE (LOGIT) TUTORIAL 10/15
Optional Screen if Latent Class Option was selected
If you changed the number of segments in Latent Class Options to greater than 1, the following dialog box will appear. With this dialog box, you can review the attributes of each of the segments you requested. Use the drop down arrow to select segment scheme to be displayed. In the two sections of on the screen, use the scroll arrows to view all of the attributes for each segment. The bottom part of this screen allows you to select how many segments are to be retained for analysis. Note: Latent Class will identify potential clusters. Numerous runs may be required before one can establish clusters of importance.
Step 4 Interpreting the results The generated workbook contains several worksheets that describe the analysis.
CUSTOMER CHOICE (LOGIT) TUTORIAL 11/15
Variable averages
This portion of the spreadsheet presents the means of each independent variable for the group of respondents.
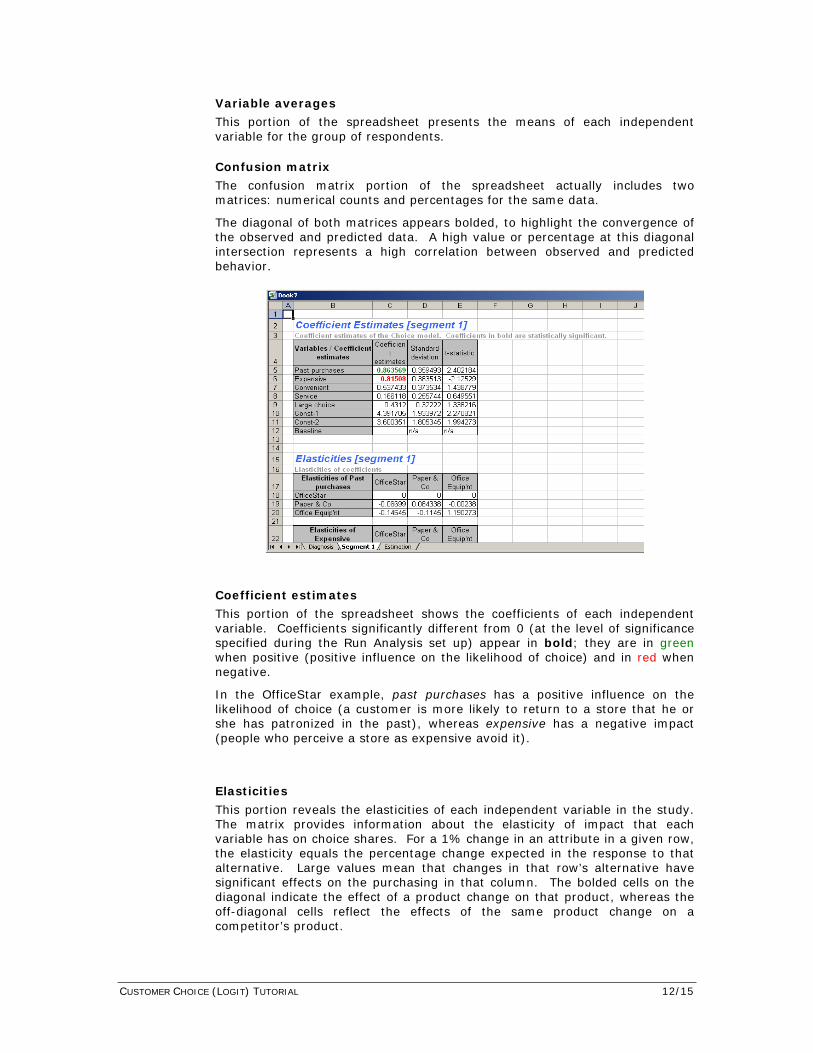
Confusion matrix
The confusion matrix portion of the spreadsheet actually includes two matrices: numerical counts and percentages for the same data.
The diagonal of both matrices appears bolded, to highlight the convergence of the observed and predicted data. A high value or percentage at this diagonal intersection represents a high correlation between observed and predicted behavior.
Coefficient estimates
This portion of the spreadsheet shows the coefficients of each independent variable. Coefficients significantly different from 0 (at the level of significance specified during the Run Analysis set up) appear in bold; they are in green when positive (positive influence on the likelihood of choice) and in red when negative.
In the OfficeStar example, past purchases has a positive influence on the likelihood of choice (a customer is more likely to return to a store that he or she has patronized in the past), whereas expensive has a negative impact (people who perceive a store as expensive avoid it).
Elasticities
This portion reveals the elasticities of each independent variable in the study. The matrix provides information about the elasticity of impact that each variable has on choice shares. For a 1% change in an attribute in a given row, the elasticity equals the percentage change expected in the response to that alternative. Large values mean that changes in that row’s alternative have significant effects on the purchasing in that column. The bolded cells on the diagonal indicate the effect of a product change on that product, whereas the off-diagonal cells reflect the effects of the same product change on a competitor’s product.
CUSTOMER CHOICE (LOGIT) TUTORIAL 12/15
In the OfficeStar example, service elasticity (.14) is rather small (compared with other elasticities in the different matrices’ diagonals), so improving perceptions of service quality by 1% would have a limited impact on the likelihood of customer purchase from OfficeStar (i.e., .14%). However, the greater service elasticity for a competitor, Office Equipment (.42), suggests that it would benefit much more than OfficeStar if it managed to improve customers’ perceptions of its service quality.
The off-diagonal elements reveal the influence on competitors created by changes in customer perceptions.
Estimated choice probabilities
This portion of the above spreadsheet shows the probability, predicted choice, and observed choice for each respondent in your study. The matrix will show all respondents unless you selected the “Perform analysis on holdout sample” option. In this case, this matrix shows only the results for the holdout sample.
Step 4a Interpreting the results when using Latent Class option
When using the Latent Class option, several screens will differ from those produced when not using the Latent Class option. Notably, a worksheet will be produced for each segment analyzed, as shown below.
CUSTOMER CHOICE (LOGIT) TUTORIAL 13/15
The Hold-out worksheet will show the details of the analysis for the hold-out sample.
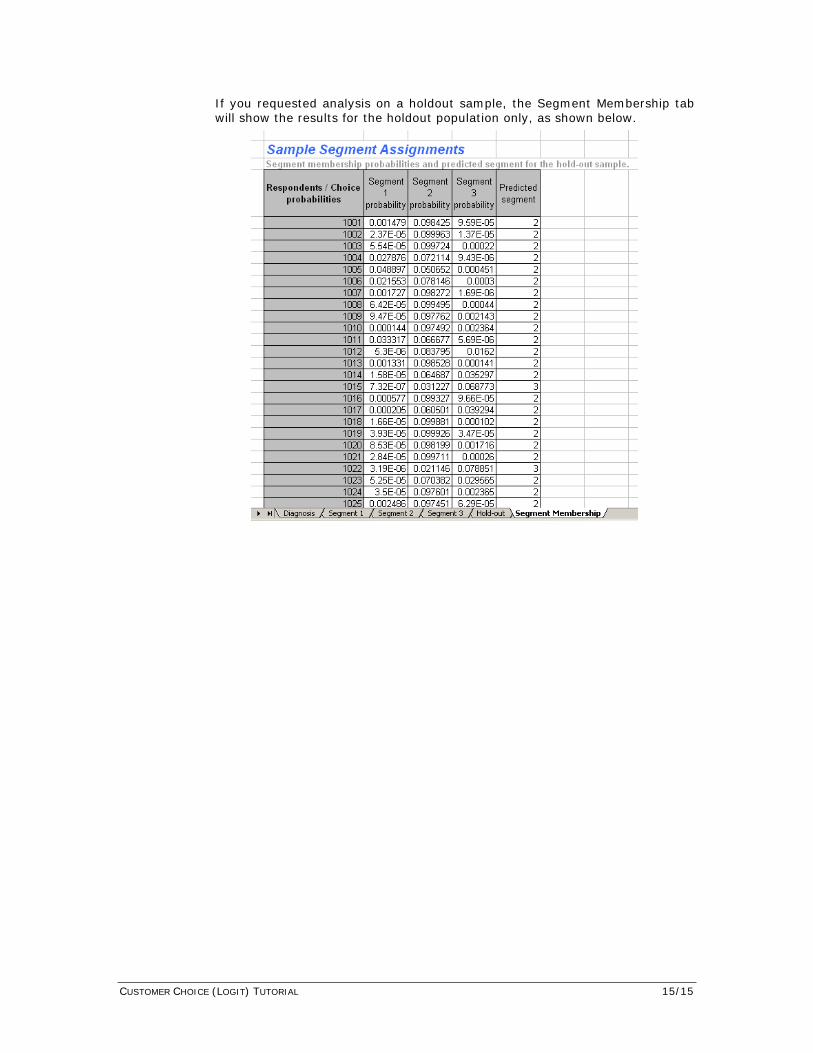
Additionally, Latent Class also produces an additional worksheet, Segment Membership, as shown below. The segment membership will show the probability of each respondent fitting within each segment, along with the predicted segment based on those probabilities.
CUSTOMER CHOICE (LOGIT) TUTORIAL 14/15
If you requested analysis on a holdout sample, the Segment Membership tab will show the results for the holdout population only, as shown below.