43
30 April 2015 Customer Engagement Initiatives and Outcomes United Energy Regulatory Proposal: 2016-20 Public

30 April 2015
Customer Engagement Initiatives and Outcomes
United Energy Regulatory Proposal: 2016-20
Public

ii 30 April 2015 © United Energy Customer Engagement Initiatives and Outcomes
Public
This page is intentionally blank

TABLE OF CONTENTS
30 April 2015 © United Energy
Customer Engagement Initiatives and Outcomes
iii Public
Table of Contents
1. Introduction ............................................................................................................................. 1
2. What we have learnt ............................................................................................................... 2
3. Background ............................................................................................................................. 3
4. Our approach .......................................................................................................................... 5
5. Strategy Development ........................................................................................................... 7
6. Research ............................................................................................................................... 10
6.1 Research review ..................................................................................................................... 10
6.2 Focus groups .......................................................................................................................... 11
6.3 Workshops .............................................................................................................................. 16
6.4 Willingness to pay, willingness to trade research ................................................................... 20
7. Community outreach and consultation workshops ......................................................... 35
7.1 Shopping centre kiosks .......................................................................................................... 35
7.2 Council workshops ................................................................................................................. 36
7.3 Consultation workshops ......................................................................................................... 36
7.3.1 Workshop participants ............................................................................................... 36
7.3.2 Workshop format ....................................................................................................... 37
7.3.3 EDPR Information and Consultation Session Schedule ........................................... 37
8. Preliminary proposal overview for public comment......................................................... 38
8.1 Distribution .............................................................................................................................. 38
8.2 Key customer outcomes ......................................................................................................... 39


INTRODUCTION
30 April 2015 © United Energy
Customer Engagement Initiatives and Outcomes
1 Public
1. Introduction
This document tells the story of our customer and stakeholder engagement in the preparation of our regulatory
proposal for the 2016-20 period.
A significant shift occurred in the Victorian electricity industry when it was privatised back in the mid-1990s. As
the State Electricity Commission of Victoria was broken up, new businesses were created in generation,
transmission and distribution companies.
Thousands of skilled men and women that had populated the old SEC migrated to all parts of the sector.
Engineers went to the infrastructure businesses, while many customer facing people ended up working in
energy retail.
For the next 20 years, despite some further twists and turns, distribution businesses like United Energy,
responsible for delivering safe, reliable electricity via the network, ran quietly in the background, out of view
from the customer.
Now, as technology empowers customers and electricity is transformed from essential service to a consumer
product, we have been called upon to reintroduce ourselves, explain what we do, and talk to our communities
about what they want from their network service.
This is challenging, but we think it is a good thing. There are enormous benefits, both to our community and
to us as a business, from a deeper, genuine engagement with our stakeholders.
The development of our regulatory proposal has provided an excellent opportunity to increase the customer
focus across our business. We have used it as a catalyst to develop a new strategic approach to engaging
with our customers that allows us to have a valuable two-way communication with customers across a range
of interest levels and expertise.
We would like to thank everyone who has contributed their views and perspectives on our proposal over the
past 12 months or so, no matter how big or small, general or detailed. We’ve learnt a lot and our proposal is
undoubtedly better for the experience.
Hugh Gleeson
Chief Executive Officer
United Energy

WHAT WE HAVE LEARNT ABOUT ENGAGEMENT
2 30 April 2015 © United Energy Customer Engagement Initiatives and Outcomes
Public
2. What we have learnt about engagement
The customer and stakeholder engagement program has been a valuable experience in the
development of the 2016-2016 regulatory proposal.
We recognised that the rule changes to Chapter 6 of the National Electricity Rules (NER) that the
Australian Energy Market Commission (AEMC) and the AER’s Better Regulation Reform Program
represented a new era in the relationship between network operators, customers and stakeholder
groups.
In our efforts to improve our customer and stakeholder engagement performance, we have
benefited from the support of senior management and the United Energy Board. We view this
support as essential to making the improvements we have achieved sustainable.
In our view, the shift from relative anonymity to a more customer centric approach to running our
business has the potential to create mutual benefits. To make the transformation, we needed to
improve the quality, frequency and depth of our engagement.
The development of a new customer and stakeholder engagement strategy at the outset of this
program has positioned us to integrate engagement much more effectively into our normal business
practices.
Our experience has highlighted the dramatic differences in interest and capacity of customers and
stakeholders to engage on energy issues. While we expect this to change over time, the relatively
low engagement by the vast majority of customers should not necessarily be seen as a failure by the
sector to engage effectively. We will continue to refine our approach in line with best practice,
particularly the IAP2 public participation spectrum.
Given the low levels of engagement by individual customers, our challenge is to engage with
organised customer representatives more effectively. Engagement of this nature must ensure a
diversity of views is accessible.
Our relationship with local government has traditionally been transactional in nature, with a
bureaucratic approach (on both sides) limiting our ability to work towards strategic outcomes.
Through this engagement program, we have identified a partnership approach with councils in our
network as a priority.
Customer advocacy groups and other stakeholders have made a considerable contribution in the
development of our proposal. While we recognise the risk of stakeholder capture over the medium to
long term, we have benefited from frank and robust debate about key issues, much of which is
reflected in our proposal.
Customer and stakeholder engagement is a combination of business culture and values, and
specialist skills. We recognise that the further development of our capability in customer and
stakeholder engagement will take time.
BACKGROUND
30 April 2015 © United Energy
Customer Engagement Initiatives and Outcomes
3 Public
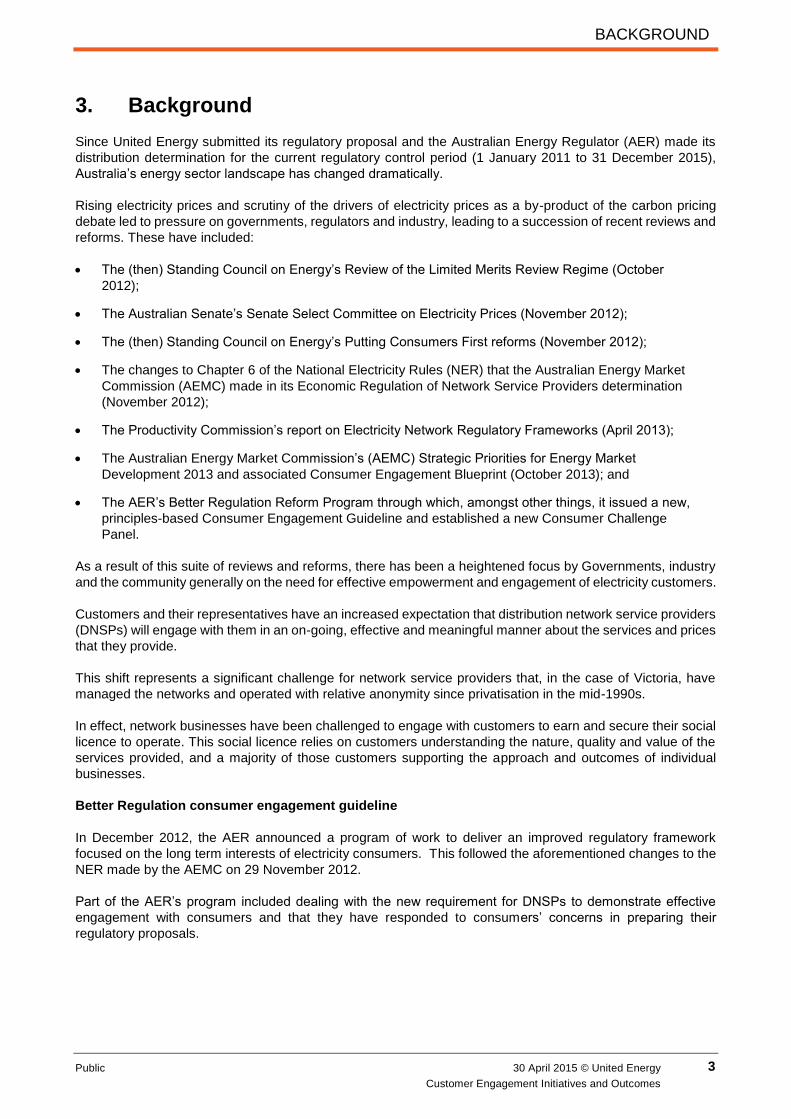
3. Background
Since United Energy submitted its regulatory proposal and the Australian Energy Regulator (AER) made its
distribution determination for the current regulatory control period (1 January 2011 to 31 December 2015),
Australia’s energy sector landscape has changed dramatically.
Rising electricity prices and scrutiny of the drivers of electricity prices as a by-product of the carbon pricing
debate led to pressure on governments, regulators and industry, leading to a succession of recent reviews and
reforms. These have included:
The (then) Standing Council on Energy’s Review of the Limited Merits Review Regime (October
2012);
The Australian Senate’s Senate Select Committee on Electricity Prices (November 2012);
The (then) Standing Council on Energy’s Putting Consumers First reforms (November 2012);
The changes to Chapter 6 of the National Electricity Rules (NER) that the Australian Energy Market
Commission (AEMC) made in its Economic Regulation of Network Service Providers determination
(November 2012);
The Productivity Commission’s report on Electricity Network Regulatory Frameworks (April 2013);
The Australian Energy Market Commission’s (AEMC) Strategic Priorities for Energy Market
Development 2013 and associated Consumer Engagement Blueprint (October 2013); and
The AER’s Better Regulation Reform Program through which, amongst other things, it issued a new,
principles-based Consumer Engagement Guideline and established a new Consumer Challenge
Panel.
As a result of this suite of reviews and reforms, there has been a heightened focus by Governments, industry
and the community generally on the need for effective empowerment and engagement of electricity customers.
Customers and their representatives have an increased expectation that distribution network service providers
(DNSPs) will engage with them in an on-going, effective and meaningful manner about the services and prices
that they provide.
This shift represents a significant challenge for network service providers that, in the case of Victoria, have
managed the networks and operated with relative anonymity since privatisation in the mid-1990s.
In effect, network businesses have been challenged to engage with customers to earn and secure their social
licence to operate. This social licence relies on customers understanding the nature, quality and value of the
services provided, and a majority of those customers supporting the approach and outcomes of individual
businesses.
Better Regulation consumer engagement guideline
In December 2012, the AER announced a program of work to deliver an improved regulatory framework
focused on the long term interests of electricity consumers. This followed the aforementioned changes to the
NER made by the AEMC on 29 November 2012.
Part of the AER’s program included dealing with the new requirement for DNSPs to demonstrate effective
engagement with consumers and that they have responded to consumers’ concerns in preparing their
regulatory proposals.

BACKGROUND
4 30 April 2015 © United Energy Customer Engagement Initiatives and Outcomes
Public
In November 2013, the AER released its Consumer Engagement Guideline for DNSPs. The guideline details
the AER’s expectations of how service providers engage with their consumers1:
This guideline provides service providers with a high level framework to integrate consumer
engagement into their business-as-usual operations. When we review regulatory proposals,
revenue proposals and access arrangements (expenditure proposals), we will have regard, on a
case by case basis, to how a service provider engaged with its consumers and accounted for the
long term interests of those consumers.
Underpinning the AER’s Guideline are four best practice principles:
Clear, accurate and timely communication – The provision of information to consumers that is clear,
accurate, relevant and timely, recognising the different communication needs and wants of
consumers.
Accessible and inclusive – The recognition, understanding and involvement of consumers early and
throughout the business activity or expenditure process.
Transparent – Clear identification and explanation of the role of consumers in the engagement
process, and consultation with consumers on information and feedback processes.
Measurable – Measurement of the success, or otherwise, of engagement activities.
The AER’s Guideline is structured around four components. The components set out a process for service
providers to develop and implement new or improved consumer engagement activities to meet the best
practice principles:
Priorities – DNSPs are expected to identify consumer cohorts and the current views of those
cohorts; outline their engagement objectives; and discuss the processes to best achieve those
objectives.
Delivery – DNSPs are expected to address identified priorities via robust and thorough consumer
engagement.
Results – DNSPs are expected to articulate the outcomes of their consumer engagement
processes, and how they measure the success of those processes, reporting back to the AER, their
business and consumers.
Evaluation and review – DNSPs are expected to periodically evaluate and review the effectiveness
of their consumer engagement processes.
1 AER, Consumer Engagement Guideline for Network Service Providers, November 2013

OUR APPROACH
30 April 2015 © United Energy
Customer Engagement Initiatives and Outcomes
5 Public
4. Our approach
Our approach to customer engagement recognises that the biggest changes to our industry in the future won’t
be driven by regulation. They’ll be driven by customers, in concert with technology. There are enormous
benefits, both to our community and to us as a business, from a deeper, genuine engagement with our
stakeholders.
We recognise that to be meaningful, communication needs to be two-way. We have a responsibility to provide
information about what we do, what drives our decision-making and what we are doing to plan for the future.
Equally important is the need to seek the opinion of our community, take time to understand those views and
incorporate them into our planning.
To ensure our investment proposals meet the needs, expectations, and long term interests of our customers,
we embarked on a comprehensive, multi-channel customer and community engagement program.
The aim of our stakeholder engagement program for the regulatory proposal was to give customers and other
stakeholders the opportunity to express their views and concerns and provide input on how we invest in their
electricity network.
Our stakeholders are diverse, so in order to ensure we captured the breadth of their long term interests, our
engagement process considered our different stakeholder groups’ capacity to engage, the impact of different
elements on them, and their areas of influence.
By mapping our stakeholders, we were able to examine the key areas where we were making decisions in the
preparation of the Regulatory Proposal and work through how best to consult with our diverse stakeholder and
customer groups.
Our engagement program included direct customer engagement through customer kiosks in major shopping
centres within our network area and an online engagement portal. A multi-stakeholder Customer Consultative
Forum provided us with an opportunity to examine in detail what our customers want from our electricity
distribution network. We’ve also run a series of focus groups and conducted a comprehensive a best practice
survey to assess customers’ willingness to pay or trade savings for changes to existing service levels, or the
introduction of new services.
We will continue using these insights to ensure our future network investments are targeted and that our
service offering meets customers’ expectations.
Customer engagement in the development of our investment plans for the 2016-20 pricing period included four
phases, commencing in December 2013.
Stage 1: Strategy Development
We recognised that in order to meet changing community expectations, we needed fresh thinking about the
way we communicate. We developed our Customer and Stakeholder Engagement Strategy to outline our
commitment and approach.
Stage 2: Research
From April to July 2014 we undertook a range of research initiatives to establish customer priorities and assess
customers’ willingness to pay or trade for changes to service levels, or for us to introduce new services.

OUR APPROACH
6 30 April 2015 © United Energy Customer Engagement Initiatives and Outcomes
Public
Phase 3: Community outreach and consultation
In the second half of 2014 we ran two initiatives concurrently. The first was a series of in-depth consultation
sessions with key stakeholder groups on major topic areas to be considered in our proposal. These included
customer services, network investment and innovation, and environment and safety.
The second was a community outreach initiative to build general awareness of our business and the services
we provide, and to ask customers general questions about the things that are important to them when it comes
to electricity
Phase 4: Preliminary proposal overview for public comment
In February 2015, we published an overview for public comment, on the direction and priorities of our regulatory
proposal. The proposal explicitly addressed the price impacts of our proposed approach, and the impacts on
our service offering over the next regulatory period.
STRATEGY DEVELOPMENT
30 April 2015 © United Energy
Customer Engagement Initiatives and Outcomes
7 Public
5. Strategy Development
In December 2013 we engaged KPMG to assist in the preparation and implementation of a number of elements
of our engagement program. The first of these elements was the development of a Customer and Stakeholder
Engagement Strategy, recognising that we needed a new framework and strategic approach to improve the
quality and effectiveness of our engagement activities.
A copy of the strategy is available on our website at uemg.com.au and is also provided as an Appendix to our
regulatory proposal.
The strategy was developed with input from across our business, including senior management. A draft was
provided to members of our Customer Consultative Committee (CCC) for their review and feedback. The final
strategy was endorsed by the United Energy Board and includes an introductory message from our Chief
Executive.
The strategy aims to give effect to our stakeholder engagement vision, which is that:
We will be an outwardly focussed business. We will embed effective stakeholder engagement
throughout our operations and develop mature relationships with our stakeholders based on
effective two-way communication and understanding.
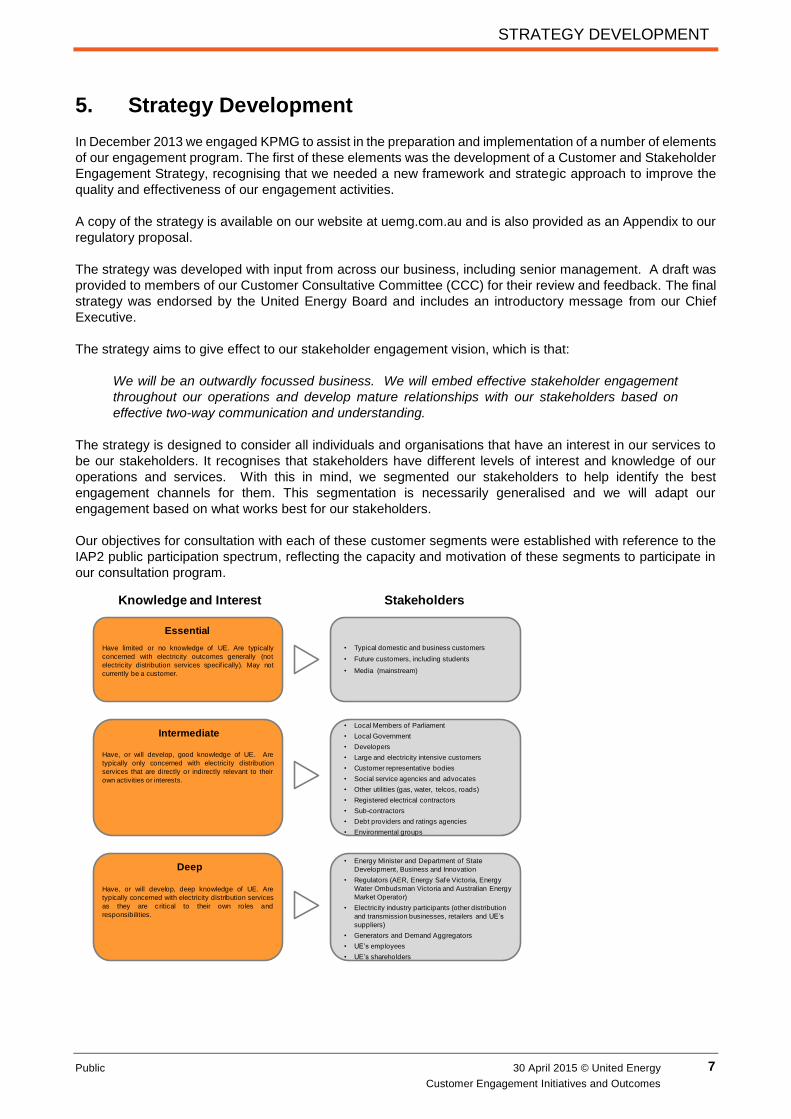
The strategy is designed to consider all individuals and organisations that have an interest in our services to
be our stakeholders. It recognises that stakeholders have different levels of interest and knowledge of our
operations and services. With this in mind, we segmented our stakeholders to help identify the best
engagement channels for them. This segmentation is necessarily generalised and we will adapt our
engagement based on what works best for our stakeholders.
Our objectives for consultation with each of these customer segments were established with reference to the
IAP2 public participation spectrum, reflecting the capacity and motivation of these segments to participate in
our consultation program.
Essential
Deep
Intermediate
Have limited or no knowledge of UE. Are typically
concerned with electricity outcomes generally (not
electricity distribution services specif ically). May not
currently be a customer.
Have, or will develop, good knowledge of UE. Are
typically only concerned with electricity distribution
services that are directly or indirectly relevant to their
own activities or interests.
Have, or will develop, deep knowledge of UE. Are
typically concerned with electricity distribution services
as they are critical to their own roles and
responsibilities.
• Local Members of Parliament
• Local Government
• Developers
• Large and electricity intensive customers
• Customer representative bodies
• Social service agencies and advocates
• Other utilities (gas, water, telcos, roads)
• Registered electrical contractors
• Sub-contractors
• Debt providers and ratings agencies
• Environmental groups
• Energy Minister and Department of State
Development, Business and Innovation
• Regulators (AER, Energy Safe Victoria, Energy
Water Ombudsman Victoria and Australian Energy
Market Operator)
• Electricity industry participants (other distribution
and transmission businesses, retailers and UE’s
suppliers)
• Generators and Demand Aggregators
• UE’s employees
• UE’s shareholders
• Typical domestic and business customers
• Future customers, including students
• Media (mainstream)
Knowledge and Interest Stakeholders
STRATEGY DEVELOPMENT
8 30 April 2015 © United Energy Customer Engagement Initiatives and Outcomes
Public
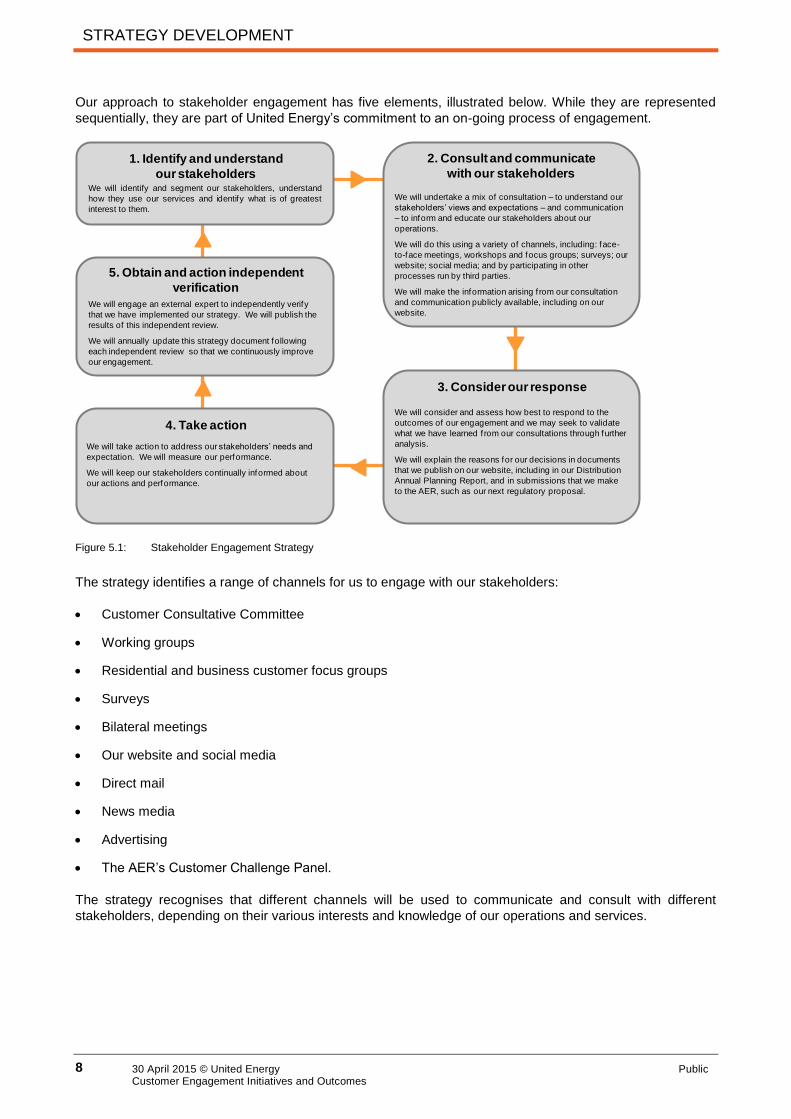
Our approach to stakeholder engagement has five elements, illustrated below. While they are represented
sequentially, they are part of United Energy’s commitment to an on-going process of engagement.
Figure 5.1: Stakeholder Engagement Strategy
The strategy identifies a range of channels for us to engage with our stakeholders:
Customer Consultative Committee
Working groups
Residential and business customer focus groups
Surveys
Bilateral meetings
Our website and social media
Direct mail
News media
Advertising
The AER’s Customer Challenge Panel.
The strategy recognises that different channels will be used to communicate and consult with different
stakeholders, depending on their various interests and knowledge of our operations and services.
1. Identify and understand
our stakeholdersWe will identify and segment our stakeholders, understand
how they use our services and identify what is of greatest
interest to them.
2. Consult and communicate
with our stakeholders
We will undertake a mix of consultation – to understand our
stakeholders’ views and expectations – and communication
– to inform and educate our stakeholders about our
operations.
We will do this using a variety of channels, including: face-
to-face meetings, workshops and focus groups; surveys; our
website; social media; and by participating in other
processes run by third parties.
We will make the information arising f rom our consultation
and communication publicly available, including on our
website.
3. Consider our response
We will consider and assess how best to respond to the
outcomes of our engagement and we may seek to validate
what we have learned f rom our consultations through further
analysis.
We will explain the reasons for our decisions in documents
that we publish on our website, including in our Distribution
Annual Planning Report, and in submissions that we make
to the AER, such as our next regulatory proposal.
4. Take action
We will take action to address our stakeholders’ needs and
expectation. We will measure our performance.
We will keep our stakeholders continually informed about
our actions and performance.
5. Obtain and action independent
verification
We will engage an external expert to independently verify
that we have implemented our strategy. We will publish the
results of this independent review.
We will annually update this strategy document following
each independent review so that we continuously improve
our engagement.

STRATEGY DEVELOPMENT
30 April 2015 © United Energy
Customer Engagement Initiatives and Outcomes
9 Public
The strategy commits us to listening to understand the issues that are most important to our stakeholders. It
also identifies the specific issues that we have identified to engage our stakeholders on:
Safety
Environment
Network performance, outages and restoration
Quality of supply
Customer connections
Customer service and satisfaction
Social obligations
Affordability and pricing
Major projects and investment
Innovation and new technology
Regulatory processes.
While the strategy was developed as the basis for ongoing customer and stakeholder engagement, it
highlighted stakeholder focus groups, workshops and a best practice Willingness to pay survey as key inputs
to our next regulatory proposal.

RESEARCH
10 30 April 2015 © United Energy Customer Engagement Initiatives and Outcomes
Public
6. Research
From March to July 2014 we implemented the research phase of our engagement program. While each
initiative provided valuable input to our understanding of customer priorities generally, they were also designed
specifically to assist in the development of a best practice ‘Willingness to pay, willingness to trade’ (WTP)
survey.
6.1 Research review
Our first step was to undertake a review of customer research undertaken in July 2013, to establish a baseline
for key customer priorities.
Quantum Market Research was commissioned by United Energy and Multinet Gas to conduct qualitative
research to explore perceptions and expectations of energy suppliers across the UE and MG areas in Victoria.
This research, which focussed on general services for both our electricity and Multinet Gas business, included
14 in-depth interviews with business customers and six focus groups with residential customers.
The key findings of the research are outlined below:
Awareness
Understanding of the distributor to
customer relationship
There is limited understanding about the distributor / retailer split – many simply
named their retailer when asked who their distributor was
However, this is generally not viewed as a problem. As such a low engagement category (in times of reliable supply) whilst there is acknowledgement of the gap in
knowledge, there is no customer driven want to rectify this
Awareness of United Energy (and Multinet Gas)
Extremely low awareness, even after listing out the names of all the distributors in Victoria, though there was some recall of the UE name when prompted
Understanding of what energy distributors do
Most assume the distributor maintains and repairs the network, but there is little awareness beyond this
Very low awareness that maintenance of street lighting is taken care of by the
electricity distributor and not the council
Awareness tended to be low across both business and residential customers. The key exception was for large
hospitals / medical services groups, where energy management is considered critical.
Service delivery priorities
Reliability of supply, minimising power outages, and minimising time without power following an
unplanned outage tended to be the top priorities
Public lighting, scheduled maintenance, customer service through issue resolution and call centres
were intermediate priorities
New connections, vegetation management and safety messages all tended to be considered the
lowest priority areas.

RESEARCH
30 April 2015 © United Energy
Customer Engagement Initiatives and Outcomes
11 Public
Service expectations and satisfaction levels
Reliability of supply The key service expectation of all consumers is a continuous, reliable supply of energy
Given interruptions are relatively rare for most, customers tend to be understanding that unplanned interruptions will happen and are largely out of the control of the distributor. However, patience is limited and regular interruptions (>3 per year) leads to frustration and
discontent
A minority of residential customers are interested (even concerned) to know what plans distributors have in place to ensure a secure and reliable supply of energy into the future, and
what plans are in place to increase usage of renewable energy sources.
Customer service There is a strong preference for a call centre in Australia with Australian staff. This is primarily due to a perceived need for the call centre to be able to relate to, and immediately understand the issue at hand – leading to less frustration and faster resolution.
Most want to speak to a real person, with no need to push buttons or say key words to get through to the right area
Call centre staff should be courteous, helpful, knowledgeable and able to deal with problems
on the spot
Where issues cannot be dealt with immediately, customers expect timely follow-up with a call back within a week.
Other Promised timeframes need to be met (e.g. for new connections, contractor visits, notified interruptions
It a scheduled interruption is not going to proceed as planned, businesses need to be notified as early as possible, as some (particularly in the health and aged care sector) may incur costs to hire generators during planned outages
While consumers felt it would be useful for United Energy (and Multinet Gas) to provide information about energy conservation and safety, they did not necessarily feel it was their distributor’s responsibility to provide this information.
Implications
1. Overall, both business and residential customers’ top priority is a reliable supply of energy
2. Very few customers had had interactions with their energy distributor
3. Customers expect clear communication about planned and unplanned interruptions to supply.
6.2 Focus groups
A total of 57 people representing business and residential customers took part in a series of focus groups held
across our network in St Kilda, Dandenong and Rosebud.
The objective of the focus groups was to listen to and understand residential and business consumers’ views
and expectations about the services we provide. The focus groups sought to:
Reveal consumers’ experiences of purchasing and using electricity, as they relate to our services
Identify the key issues of importance to consumers in their interactions with our business
Inform the development of the WTP survey; and
Provide evidence of United Energy’s commitment to robust and meaningful engagement of its
stakeholders.

RESEARCH
12 30 April 2015 © United Energy Customer Engagement Initiatives and Outcomes
Public
A Melbourne based market research company was engaged to recruit residential and business consumers to
ensure a broad cross-section of participants for the focus groups. The target participants were the ‘person on
the street’ and small business owners who may or may not have been aware of the United Energy brand or
our role in the electricity supply chain. The only criteria for inclusion in the focus groups was that the individual
was responsible for paying the electricity bill. Participants were paid a nominal amount to attend the focus
groups.
The focus groups sought to engage consumers from across our network. Six focus groups of 1.5 hours duration
each were conducted in the northern, central, and southern sub-regions of United Energy’s network. The
breakdown was aligned with analysis of our network performance to represent three broad bands of reliability
- from the best in the north to the poorest in the south. The location and number of participants in each focus
group are provided in the table below.
A total of 57 participants attended the six focus groups, comprising 25 men and 32 women ranging from 23 to
68 years of age, as illustrated in the table below.
Location of Focus Group Residential Small Business
North (St Kilda) 9 9
Central (Dandenong) 10 9
Southern (Rosebud) 10 10
Table 5.1 - Breakdown of focus group attendances
A United Energy representative attended each of the focus groups as an observer, and addressed participants’
specific questions about United Energy at the conclusion of each focus group.
The focus group discussions were facilitated by KPMG, drawing on a set of questions to guide the discussion.
The questions covered 10 topic areas aligned with our Stakeholder Engagement Strategy.
Awareness of United Energy
Electricity supply
Customer service
Connections
Power outages and restoration
Price and affordability
Environment
Safety
Social obligations
New technologies.

RESEARCH
30 April 2015 © United Energy
Customer Engagement Initiatives and Outcomes
13 Public
Ten key insights were identified from the focus group discussions. These insights were subsequently explored
further in the Willingness to pay, willingness to trade survey, in order to determine whether they reflect
consumers’ experiences.
1. Awareness of United Energy was low
Residential and business participants had limited awareness of United Energy and/or of the electricity supply
chain:
Participants were asked during the recruitment process if they could name their electricity DNSP.
15 of the 57 participants were able to correctly identify United Energy. Participants generally cited
their retailer, with companies named including Origin, AGL, Momentum Energy, Red Energy, Dodo,
and Lumo.
Across all focus groups, a few participants were able to correctly describe the role of a DNSP as
distinct from a retailer, however many were not aware that there was a difference between the two.
Participants reported limited contact with United Energy. Examples were provided of contact due to
a power surge and installation of solar panels. Some participants recalled letter box drops for
planned outages when prompted by the facilitator.
2. Supply experience
Participants were asked to comment on when they last thought about their electricity supply. Participants
reported that they typically thought about their electricity supply in three circumstances:
Upon receipt of their retail bill;
When there is a supply problem, notably an unplanned outage; and
When they are approached by retail companies to change retailer.
Participants reported that the supply of electricity to their homes and businesses was not something they
generally thought about, unless there was an issue that needed addressing.
Participants were asked to comment on their last experience of an unplanned outage. There was considerable
variation across the network:
The majority of participants in the northern sub-region could not recall a recent power outage (“I
can’t fault it”), while some noted that “the power has occasionally gone off in the middle of the night”;
and
Experiences of outages were greater in the central and southern sub-regions, which were attributed
to construction works, car accidents, ageing infrastructure and fallen power lines. However,
participants in these areas considered that unplanned outages were occurring less frequently than in
the past.
Unplanned outages have a varied impact on residents and businesses; while some were understanding of the
causes of such outages, others were less so.
Business and residential participants were not prepared to pay less for lower reliability. They consider
electricity to be a basic utility, that electricity supply should be continuous and of high quality, and they do not
a see reason to pay a premium for improved reliability.
A few participants perceived that there was less apparent or obvious maintenance of the network than they
recall in the past.

RESEARCH
14 30 April 2015 © United Energy Customer Engagement Initiatives and Outcomes
Public
Business participants reported significant inconvenience and loss of revenue associated with planned and
unplanned outages. They specifically noted impacts on their IT systems and infrastructure.
3. Consumers are not willing to trade reliability over price
Participants noted that outages have significant cost impacts for businesses, primarily due to a loss of sales.
Participants indicated that residents want price and supply standards to be maintained, and are not willing to
pay more for their services. They perceive electricity to be a basic utility, that electricity supply should be
constant and of high quality, and do not see a reason to pay a premium for improved reliability.
Consumers are supportive of the adoption of new technologies, but are not necessarily prepared to pay more
for them.
4. Consumers expect timely access and accurate information from customer call centres
Only a few participants had recent experience of contacting United Energy.
Participants were divided over where United Energy should locate its call centres. Approximately half of the
focus group participants indicated that having a call centre in Australia was important to them, as they would
prefer that ‘jobs remain in Australia’, however they understood that this may come at a higher cost due to wage
pressures. The other half did not have a preference, but indicated that it is the quality of the service received,
and the capacity for personnel to address their concerns, that are important.
Some participants indicated a preference for a ‘case management’ of significant supply issues, with a United
Energy staff member allocated to coordinate the issue, to avoid them having to repeat their story.
Some participants noted that they wouldn’t have any reason to contact their DNSP, and would simply contact
their retailer if they had issues or concerns about their electricity supply.
Residential and business participants indicated a preference for more direct lines of communication for planned
and unplanned outages and welcomed more information about United Energy.
Business participants, particularly in retail and services (e.g. food, hairdressing, mechanics), typically indicated
a need for a longer period of notice for planned outages than residential participants. Most business
participants would prefer one to two weeks’ notice, particularly for appointment-based services.
5. Consumers would like more direct communication about unplanned outages
Business participants favoured more notice than the current standard for planned outages, with a preference
for one to two weeks’ notice, and prompt restoration updates after an unplanned outage.
Residential and business participants suggested that United Energy use more personalised communication
methods when unplanned outages occur, for example, via SMS or direct email. Radio announcements and
online updates were also considered important.
6. Consumers have a limited understanding of price structures
Participants across all focus groups were concerned about the increasing cost of electricity.
Approximately half of all participants had some understanding of tariff structures, and could identify peak/off-
peak as a tariff option. The other half had a limited understanding of the range of tariff options available to
them, and many were not aware that they had a choice. Some reported that they were ‘forced’ to choose a
particular tariff.

RESEARCH
30 April 2015 © United Energy
Customer Engagement Initiatives and Outcomes
15 Public
Some frequently and actively sought better tariffs, while other participants were aware of choice but “didn’t
have the time” or were “too complacent” to pursue them.
Few participants in each focus group were aware of the various components of their bill, i.e. a daily supply
charge and a variable tariff. None knew what proportion of their bill was passed onto the DNSP.
Many residential and business participants noted concerns about the lack of transparency in electricity pricing
and, in particular, the capacity of the elderly or consumers with limited English to understand contracts in order
to identify the best ‘deal’ to suit their circumstances, and to resolve issues with their bills when they arose.
Again, this was noted to be an issue to address with retailers.
Participants agreed that they would welcome mechanisms that would improve their ability to compare prices
across retailers. They did not feel that they received value for money, or that electricity was affordable.
Participants who had solar power had a stronger understanding of price structures and factors that increased
use and cost, compared with participants without solar power.
7. Consumers found it difficult to identify measures to further reduce their electricity use
Participants had some awareness of the factors that contributed to how much electricity they used. The majority
identified air-conditioning and heating, the number of appliances used, and (for residential consumers) how
often and for what duration they were at home.
Many residential participants reported having taken some action to reduce their electricity usage, and thus
their retail bills. Examples included changing light globes, purchasing energy efficient appliances and
investigating the installation of solar panels. However, most residential participants reported that this had had
limited favourable impact on their bills.
Residential participants were open to incentives to reduce power consumption in peak periods. However,
factors such as having elderly parents or young children limit their ability to do so. Some were strongly opposed
to taking such action, and viewed the use of electricity as their personal right. Other participants noted that
they would be happy to reduce their consumption to a lower, more sustainable average.
8. Businesses are less able than residents to reduce electricity usage
Some business participants indicated that they had taken action to reduce their electricity usage, such as
opting to purchase low-power computer screens and printers, and changing light globes. Some business
participants were unclear if there was any real benefit, and indicated that mechanisms such as sensor lights
and more efficient machinery were too costly.
Business participants were less willing than residential consumers to pursue initiatives aimed at reducing
demand, noting that electricity was essential for them to run or operate their business.
Business and residential participants alike were keen to receive more information about how they could reduce
or better monitor their usage, as a basis for reducing their electricity bills. Suggestions included improved
access to technology.
9. Consumers have limited awareness of safety and environmental issues
The environmental impacts of electricity distribution were not well understood, and residential and business
participants had limited awareness of safety issues associated with electricity distribution services.
The majority of participants started by discussing green power sources, and the environmental impacts of the
generation of electricity. Some were concerned about the health impacts of electricity transmission.

RESEARCH
16 30 April 2015 © United Energy Customer Engagement Initiatives and Outcomes
Public
Participants in all focus groups were aware that sparks from electricity lines can start grass fires. Most were
not aware of consumers and DNSPs’ respective roles and responsibilities for vegetation management.
Safety issues identified included safety in the home or workplace (such as test and tag programs), risks
associated with faulty wiring and old fuse boxes, and the dangers of fallen power lines.
Some business participants favoured safety checks within their business, however, they had mixed views on
whether this should be at an additional cost to the consumer.
There was some support for undergrounding, for aesthetic purposes, to replace ageing infrastructure, as well
as to reduce maintenance costs in the longer term. This was, however, tempered by some participants’
awareness of the significant associated cost of undergrounding.
10. Consumers would like more information from United Energy
Participants favoured additional information about who United Energy is, what value and services it is providing
to its consumers, strategies to reduce electricity demand, and how to make best use of smart meters.
6.3 Workshops
Workshops were held with representative groups and some of our large business customers with the following
objectives:
Gain an understanding of stakeholders’ perspectives on electricity supply
Identify issues of importance to key stakeholders
Communicate, and gain support for, the WTP survey and inform the final version
Provide evidence of United Energy’s commitment to robust and meaningful stakeholder
engagement.
The workshops targeted stakeholders who were likely to have some awareness of United Energy’s brand and
its role in the electricity market. KPMG facilitated two workshops, one with United Energy’s Customer
Consultative Committee (CCC) and another with its large and commercial consumers.
Grouping stakeholders with common interests provided for a more robust and meaningful discussion, thereby
improving the quality of the outputs. The number and composition of workshops are provided in table 5.1.
Stakeholder Group Participants
CCC and associated Working Groups United Energy
Alternative Technology Group
Consumer Utility Advice Centre
Consumer Action Law Centre
Australian Industries Group
Large Commercial and Industrial Consumers United Energy
Wilson Transformers
Aurora (packaging manufacturer)
Dandenong Hospital
Metro Trains
Table 6.1 - Composition of workshops

RESEARCH
30 April 2015 © United Energy
Customer Engagement Initiatives and Outcomes
17 Public
United Energy identified and invited its stakeholders to participate in the workshops by:
Utilising its CCC and associated Working Groups; and
Directly approaching (by letter and telephone) community groups and large business consumers.
Workshops were held in community venues within United Energy’s service area in order to minimise any
potential barriers to participation (such as travel distance and time). A United Energy representative attended
each workshop to meet and greet stakeholders and to listen to stakeholders’ views. The AER was also invited
to attend as an independent observer to support their early understanding of United Energy’s approach to
stakeholder engagement, however it declined the offer.
Each workshop was facilitated by two KPMG team members, and notes were taken, however, comments were
not attributed to individual participants. These notes were sent to participants within two business days of the
workshop for validation and for their own records.
United Energy was interested in understanding from the workshops the range of issues that were important to
its stakeholders. The topics discussed:
Were tailored to each stakeholder group, recognising their different interests and interactions with
United Energy
Reflected the key issues that United Energy wanted to communicate and consult with their
stakeholders on, as outlined in the Stakeholder Engagement Strategy
Included items to be subsequently addressed in the WTP survey – there was also a discussion of
the draft WTP survey.
The issues that United Energy identified for discussion during the workshops included stakeholders’ views on:
What is important to consumers’ supply and what impacts on their use
Consumers’ service experiences, including whether dealings with United Energy were positive or
negative
Preferred forms of communications, including its form and any additional services that United
Energy should be providing
United Energy’s social obligations, including how it can better service disadvantaged and vulnerable
community members, and experiences of supply disconnection
Power outages and restorations, including United Energy’s notification, restoration, communications
processes, duration, and the preparedness to pay to change the duration and frequency of
interruptions
Experiences of connection to the network
Pricing and affordability, including how prices are determined, the understandability of charges,
awareness of how to reduce bills and/or consumption, willingness to participate in programs to
reduce bills and/or consumption and rebates and/or incentives
The importance of safety, including on the network and at premises and the willingness to pay for
safety checks
Environmental issues, including the impacts of electricity distribution and mitigation strategies
How United Energy should be embracing and adapting to new technology.

RESEARCH
18 30 April 2015 © United Energy Customer Engagement Initiatives and Outcomes
Public
Observations
Customer Consultative Committee
The following summarises the feedback provided by United Energy’s CCC during the workshop.
1. Deferring or avoiding network upgrades
One stakeholder raised concerns about the significant costs of building new capacity into the system to meet
rising peak demand. The stakeholder felt that United Energy should actively engage with businesses to work
with them to manage their load in order to seek alternatives to the high capital costs of building new network
capacity.
2. Customer service centre education
Stakeholders expressed concern that staff in customer service centres are unable to provide advice on tariffs,
and typically refer consumers back to their retailers. Stakeholders emphasised the importance of all staff that
interact with consumers understanding tariffs, so that they can readily communicate with them.
3. Greater transparency and availability of information
Stakeholders felt greater access is needed to information to enable consumers to understand bills better,
including a breakdown of what the bill means in plain English. Stakeholders considered that many consumers
simply don’t have the time or knowledge to explore and comprehend what the best retail supply arrangement
would be for them. This applies both to many small to medium enterprises (SME) and residential consumers.
Further, stakeholders noted that consumers are looking for avenues to reduce bills and to better understand
their energy costs. Stakeholders indicated that consumers are also interested in accessing information in
differing formats for improved engagement, and a consistency in language from DNSP to retailer to consumers.
4. Outages and restoration
Stakeholders highlighted that the reliability and quality of supply are of great significance to small business
and manufacturing consumers, as a momentary interruption can adversely impact their processes, impose
additional costs and result in lost revenue.
Some stakeholders were also keen to provide input into the value of customer reliability (VCR) that is used by
United Energy.
5. Tariffs
Stakeholders were concerned about issues of cross subsidisation and equity in electricity tariffs. One
stakeholder was keen to see a shift away from consumption / volumetric based tariffs to one that reflects the
costs incurred by United Energy to deliver services to specific consumers. Other stakeholders raised the
possibility of charging based on:
A capacity charge, irrespective of use; and
A peak demand charge, based on an historical peak.
6. Pass through of cost reductions
Stakeholders felt that cost savings achieved by United Energy should flow back through to the end consumer
in the form of lower prices.

RESEARCH
30 April 2015 © United Energy
Customer Engagement Initiatives and Outcomes
19 Public
7. Feedback on the design of the WTP survey
Participants provided limited direct feedback on the design of the WTP survey. One stakeholder wanted the
WTP survey to have more direct questions about smart meters and the services that they deliver.
Large Commercial and Industrial Consumers
The following summarises the feedback provided by United Energy’s large commercial and industrial
consumers during the workshop with them.
1. Communication
One stakeholder indicated that its electricity usage peaks for a short period of time when it tests the products
that they manufacture. It noted that it is difficult for it to plan any notification to United Energy about when
these peaks occur.
Some stakeholders raised concerns about a lack of adequate notification by United Energy before planned
outages occur. They indicated that sending a letter to one registered point of contact is no longer adequate,
as it may not reach the right people in their business at the right time. Stakeholders suggested that United
Energy maintain a list of key contacts (e.g. at the site by site level / plant level rather than to a business’s
central office) to provide notification regarding planned outages.
Stakeholders felt that the form of communication from United Energy was inconsistent with the size of their
account, and they need more tailored service, such as telephone call.
Stakeholders felt that more regular updates regarding unplanned outages would better assist businesses to
optimise their use of resources (e.g. whether to send staff home, or keep on site). While high voltage
consumers have a direct line to United Energy’s control room, stakeholders considered that United Energy
should provide information directly to consumers, rather than consumers needing to chase information.
Some stakeholders indicated that at least one week’s notification was appropriate for planned outage
notification, from the time of first receiving the communication from United Energy.
Stakeholders provided United Energy with examples of the matters on which other DNSPs in Victoria and
interstate have undertaken to improve notification. This included:
Asking manufacturers when they had planned maintenance shutdowns, and scheduling network
maintenance to coincide with this; and
Meeting with large business to identify mutually convenient times for shut downs, and supplying a
temporary generator to provide continuity of supply.
Stakeholders supported the provision of dedicated account managers by United Energy, which they noted was
not common for other DNSPs. Stakeholders’ preference was to deal with the DNSP rather than the retailer on
most occasions.
Stakeholders felt that sub-contractors should be able to set specific appointment times with large commercial
and industrial consumers to undertake works, such as to access a site for a meter installation, rather than just
to nominate the current three hour window.
Stakeholders also suggested United Energy prepare a contact list for large consumers to use in contacting
United Energy for particular issues or projects.

RESEARCH
20 30 April 2015 © United Energy Customer Engagement Initiatives and Outcomes
Public
2. Power outages
Stakeholders noted that power outages can result in significant costs to businesses, including as a result of
financial penalties under contractual arrangements with third parties. They noted that even a short five to ten
minute outage can be very costly, due to the need to re-start processes, and loss of product.
3. Tariffs
Stakeholders were complimentary of the rolling demand tariff provided by United Energy noting that other
DNSPs do not offer this tariff.
Stakeholders also expressed concerns that peak demand tariffs did not provide businesses with the intended
demand management incentives, where their operations cannot change during peak hours (e.g. metropolitan
train operation). Manufacturing businesses can’t necessarily shift demand / shed load, so there is a need to
examine alternative incentives to reduce demand.
Some stakeholders felt that capacity charging was a more equitable means of pricing, although they
recognised this would require a restructuring of pricing arrangements.
4. Additional services
Stakeholders also identified various additional services that United Energy could consider providing, such as:
Voluntary demand side participation;
An application to communicate with smart meters;
Better education on the capabilities and uses of smart meters;
Consistency of metering information across DNSPs, as many large consumers operate across
multiple networks;
Site visits by United Energy staff to customer sites to discuss opportunities for energy savings in
processes and equipment; and
Greater transparency from United Energy in advance of price increases.
6.4 Willingness to pay, willingness to trade research
We undertook a best practice survey to assess customers’ willingness to pay or trade savings for changes to
existing service levels, of the introduction of new services. More than 1,100 people took part in the survey to
give us a final sample of 960 customers from across our network.
Purpose
A WTP survey is designed to assess the maximum amount a person would be willing to pay, sacrifice or
exchange in order to receive a service or to avoid an undesirable event.
For United Energy, the WTP survey provides information about consumers’ willingness to pay or trade for
particular characteristics of their electricity supply, such as reliability, quality of supply and cost.
The design of the WTP survey for United Energy was informed by the outputs of the focus groups and
workshops. This enabled the questions that were included in the survey to address the range of issues that
are important to United Energy’s consumers and other key stakeholders.

RESEARCH
30 April 2015 © United Energy
Customer Engagement Initiatives and Outcomes
21 Public
The purpose of the WTP survey is to inform the development of United Energy’s regulatory proposal for the
next regulatory control period, using robust methods to understand consumer preferences.
Survey approach and design
The survey consisted of the following stages:
Survey design;
Sample design;
Data collection;
Analysis; and
Reporting.
1. Survey design
The survey built on previous surveys conducted by KPMG. It was adapted in consultation with United Energy,
taking into account the outputs of the focus groups and workshops. It included well-proven scales to determine
the respondents’ perceptions about the reliability of their electricity supply.
The survey comprised approximately 160 questions, and was designed to be completed within 20 minutes,
incorporating:
Demographic questions to provide an understanding of the characteristics of respondents;
National Meter Identifier (NMI) details to ensure the sample could be matched to United Energy’s
catchment and to ensure the respondent’s experience could be calibrated to United Energy’s feeder
performance data;
Attitudinal survey questions, which comprise:
– Yes/No questions to ascertain the profile of respondents’ electricity equipment and consumption;
– “Likert scale” questions to ascertain the frequency of events experienced by respondents; and
– “Likert scale” questions to ascertain importance and relevance of particular features to consumers.
Willingness to pay / forego – simple choices of ten possible attributes, for which respondents
indicated they were willing to pay something or forego a saving. This was included because the
number of attributes that could be tested was too great to be included in the more robust choice
experiment; and
A choice model experiment to ascertain consumers’ willingness to pay for particular characteristics
of energy supply, and willingness to trade one characteristic for another. This experiment presented
respondents with a number of choice sets using scales. They were asked either to accept or reject
each choice set. The choice sets included trade-offs between the following attributes of electricity
supply:
Interruption frequency – The average number of interruptions a customer experiences per annum,
measured by the System Average Interruption Frequency Index (SAIFI);
Interruption duration – The average total duration of interruptions per customer per annum,
measured by the System Average Interruption Duration Index (SAIDI);

RESEARCH
22 30 April 2015 © United Energy Customer Engagement Initiatives and Outcomes
Public
Longest duration interruptions – A respondent’s longest duration for a single interruption;
Momentary interruptions – The average number of times a customer experiences momentary
interruptions per annum, measured by the Momentary Average Interruption Frequency Index
(MAIFI) and defined as interruptions of one minute or shorter duration; and
Quality of supply – A customer’s average frequency of flickering or blinking lights, blown light
bulbs, damaged electrical equipment and sustained low voltage.
Sample design
A sample design was required to select the respondents to participate in the survey. Generally speaking, the
objective of the sample design was to obtain the most statistically accurate (reliable) results with the resources
available for this project.
The sample needed to be representative both of the population of interest and the range of service standards
across United Energy’s service area. The sample needed to be sufficiently large to provide statistically reliable
data.
A sample size of approximately 1,000 survey responses (600 residential and 400 small business) was required
to provide an acceptable level of confidence in the reliability of the survey. The sample was controlled and
weighted by the following factors to ensure that it closely represented the underlying population:
For business and residential consumers:
– Solar photovoltaic (PV); and
– Electricity reliability zone – derived from United Energy performance data.
For business alone:
– Industry sector (retail and service or light industrial/other).
For residential alone:
– Household size.
Data Collection
Survey data was collected both online and by telephone.
All residential and some business data were collected online via a secure site managed by I-View, in
accordance with relevant market research standards – ISO 26362 and ISO 20252. The balance of business
data were collected by I-View using computer aided telephone interviewing (CATI) using a centralised,
supervised control room.
United Energy provided contact phone numbers for customers on feeders selected in the sample design
phase. United Energy also provided information about the measured reliability performance on individual
feeders that serviced customers. This was used in the “calibration” phase and is discussed below.
Table 6.2 shows that the original, unweighted sample of respondents to the WTP sample was 1,125
respondents. Following the weighting, and matching of respondents to United Energy’s NMI data, the final
matched sample was reduced to 960 respondents. The business survey had a perfect match as contact phone
numbers were provided by United Energy. Some of the businesses, and all of the residential customers, were
sourced from internet panels. A number of respondents answered with invalid NMIs. This came about either
from mis-keyed entries or respondents not being United Energy’s consumers (i.e. they are supplied by another

RESEARCH
30 April 2015 © United Energy
Customer Engagement Initiatives and Outcomes
23 Public
DNSP). An online survey cannot be finely targeted to source respondents only from United Energy’s service
area. Any respondents without a United Energy NMI were excluded from the sample.
A sample of 960 respondents is sufficiently large to provide statistically reliable data for the survey.
Sample source Original sample Matched sample
Business CATI 331 331
Business on-line 72 49
Total Business 403 380
Residential on-line 722 580
Total 1,125 960
Table 6.2 - Survey response rate and reweighting of sample
Analysis
The analysis stage included:
Quantitative assessment of the electricity network’s reliability performance as identified by United
Energy’s data;
Understanding the attitudinal questions of importance and relevance to respondents;
Understanding the types of equipment respondents had within their homes or businesses;
Calibrating respondents’ perceived network performance for the frequency and duration of their
interruptions – as revealed through the survey – to the actual feeder performance as measured by
United Energy – which can be related back to respondents’ individual NMIs. This calibration is
explained in section 0 below; and
Determining the perceived threshold points for electricity performance measures, including the
duration and frequency of interruptions for all consumer segments.
Two methods were to be used to validate responses:
Calibrating perceived reliability with actual reliability – This provided a robust and accepted
method for validating survey findings. The application of calibration requires United Energy to
provide two key pieces of information:
Residential – NMI and network reliability; and
Business – consumer phone numbers matched to network reliability.
Comparison with the outputs of previous consumer engagement – United Energy contrasted the outputs of the
WTP survey with the responses from the focus groups and stakeholder workshops.
Calibration
Respondents were asked to provide information about their perceived service levels. There is a high likelihood
of errors in these responses and in respondents’ perceived service levels compared with the service they
actually receive. These errors could arise, for example, because respondents may not remember with perfect

RESEARCH
24 30 April 2015 © United Energy Customer Engagement Initiatives and Outcomes
Public
accuracy events that affect their supply, or they may not be at their premises (or may not be using electricity)
when an interruption event occurs.
There is a need for a calibration process to neutralise for these distortions. The calibration process compares
respondents’ perceptions about the reliability of the network with actual data about the performance of the
feeder from which they are served. A respondent’s perception is representative of the service level at its
connection point, which may be different to a consumer on a different part of the same feeder. These
perceptions were compared to the United Energy feeder data to represent an average for the feeder.
In general, the results of analysis showed that respondents perceive that they face fewer reliability events than
is being measured by United Energy on the feeders from which they are supplied.
Service standard thresholds
A robust and thorough consumer research process was used to obtain estimates of threshold points for various
measures of reliability, including average duration, average frequency and the longest duration interruption.
Threshold points measure a consumer’s willingness to trade for improvements in a particular aspect of a
product or service. The thresholds are determined by undertaking consumer research which asks participants
to trade-off different levels of attributes of their electricity supply, such as the number versus duration of
interruptions to supply. In other words, the threshold points are levels of a reliability index, above which
consumers would generally be seeking improvements in that reliability index and below which customers would
generally not be seeking improvements. These thresholds may also be considered as points of indifference
at which consumers are equally willing to trade for better or worse reliability. The threshold is determined
where the ‘choose worse’ and ‘choose better’ lines intersect.
The ‘choose worse’ and ‘choose better’ lines represent the proportion of people that chose the offer and the
total number of people made that offer. This is illustrated in figure 5.3 below.
Importantly, these lines do not represent the arithmetic sum of the responses to a particular offer, as the
responses for trade-offs where the offer was the same supply, are excluded from the analysis.
Interpreting the threshold graphs
In the threshold graph presented in figure Error! Reference source not found.5.3 below, and those presented
in section 11.4 of Appendix 3, the y-axis represents the percentage of respondents and the x-axis represents
the respondents’ perceived level of reliability.
The dashed line represents the proportion of consumers in the choice experiment who ‘choose worse’, such
as a lower level of reliability than they currently receive. The solid line represents the proportion of consumers
who ‘choose better’. For example, in figure 5.3 below, for those consumers that currently have a perceived
SAIFI of once a year, approximately 70 per cent would accept a bundle of attributes that includes a higher
frequency of interruptions, while approximately 20 per cent would accept a bundle of attributes that includes a
lower frequency of interruptions.

RESEARCH
30 April 2015 © United Energy
Customer Engagement Initiatives and Outcomes
25 Public
Figure 6.3: Example threshold graph
The threshold point is where the lines intersect. At SAIFI below the threshold point, the proportion of
respondents willing to choose worse is higher than the proportion of respondents choosing better (and vice
versa).
In the discussion of the results, a “worse power supply” refers to a lower level of reliability / higher frequency
or duration of supply incidents. Conversely, a “better power supply” refers to a higher level of reliability / lower
frequency or duration of quality of supply incidents.
The threshold point is where consumers are equally balanced in terms of the reliability they choose. Setting
reliability standards to the left of the threshold point would give them better reliability than they choose and
setting it to the right would give them worse reliability. It should be noted that there can be multiple threshold
points. This indicates that there is a “zone of indifference” between the thresholds. Moving the reliability
standards within that zone will make little difference to consumer demands for reliability. In those cases, the
reliability standards could be set anywhere between the threshold points.
Ideally, the aim is to establish a clear threshold point, indicating clear preferences in the market for reliability
standards. The intercept is arithmetically interpolated in the spreadsheet and not estimated on the curves.
The positioning on the curves is indicative only.
The choice or trade-off tasks
During the survey, consumers were asked to make choices based on their preferences for defined outcomes
relative to actual performance on the electricity network. In the first choice task, respondents were offered six
to eight “real” electricity options in which they were asked to trade-off simultaneous variations in the five
reliability service standard attributes within the range of plus or minus two categories of their perceived
reliability. A further three to four choices included money.
The choice is based on each respondents’ perceived experience and is therefore more relevant to their
perceived values. In any one choice, any of the attributes may be better, the same or worse than what they
are currently receiving. The respondents simply had to say whether they accepted or rejected the offer.
Annual interruption frequency - urban business & residential
0%
10%
20%
30%
40%
50%
60%
70%
80%
90%
100%
None Once a
year
Twice a
year
Three
times a
year
4-5 times a
year
6-8 times a
year
9-12 times
a year
Every 2
weeks
Perceived annual frequency of interruption
% o
f ch
oic
es
Choose worse Choose better
Lines with a good slope and clear
threshold point

RESEARCH
26 30 April 2015 © United Energy Customer Engagement Initiatives and Outcomes
Public
Observations
The following section details the observations from the different techniques that were employed in the survey,
being:
The attitudinal survey;
The willingness to pay / trade survey – simple choices; and
Reliability choice modelling / choice experiment.
Attitudinal Survey
Part of the survey involved an attitudinal survey. This involved a series of yes / no, agree / disagree questions
and simple rating scales about United Energy and its service provision.
The graphical results of the attitudinal survey are presented in Appendix 3. Figure 6.4 provides an example
of the attitudinal survey results for questions about supply reliability.
Figure 6.4 - Example of attitudinal survey result
The attitudinal survey addressed the following matters:
Knowledge of United Energy and its services - 67 (av)2 of respondents agreed that they were
aware that United Energy was their DNSP and, on a scale of very likely (9) to very unlikely (0),
were likely (5.9) to recommend United Energy to a friend. 53 (av) of respondents agreed that
they wanted to know more about United Energy and their services, the most popular means being
through United Energy’s website (67 (av)). Businesses were slightly less interested in knowing
more about United Energy than residential consumers;
2 The Likert scale of 1 to 5 was converted to a 0 to 100 scale. Where (av) is included, this is the average score on the transformed scale. It approximates a percentage agreed score.
RESEARCH
30 April 2015 © United Energy
Customer Engagement Initiatives and Outcomes
27 Public
Network reliability – 76 (av) of respondents agreed they received reliable supply from United
Energy and that, on average, power supply has neither improved nor declined over the last year.
There was a small appetite from respondents for improved reliability (57 (av)). Business
consumers were slightly more likely to agree with this. The relative indifference to reliability
improvement is an important finding as it supports and confirms the results of the WTP survey,
which are discussed later in this section. In general, consumers “perceive” their reliability to be of
a good standard, and do not desire a better/worse level of reliability;
Call centre contact in the last two years – Business respondents (36 (av)) contacted United
Energy’s call centre more often than residential consumers (23 (av)), with almost half of all
contacts relating to faults. On average, consumers agreed the quality of interaction with United
Energy’s call centre as slightly better than neutral (54 (av));
Planned interruptions – Respondents indicated that letter box drops and email were the preferred
notification methods for planned interruptions (70 (av)), with radio and social media being the
least preferred (supported by less than one fifth of respondents). Businesses preferred
personalised mail slightly more than letter box drops;
Unplanned interruptions – Both residential and business consumers indicated that email and SMS
were the preferred notification for unplanned interruptions (approximately 65 (av)), with the least
popular being social media (16 (av));
Information response to interruptions – Residential and business consumers equally agree (79
(av)) that rapid information response is needed for both planned and unplanned interruptions.
Businesses were more attracted than residents to the most rapid response time of one hour;
System management – Vegetation and particularly attractiveness of the system (31 (av)) were
rated negatively, and the importance of system safety was rated somewhat positively (63 (av)).
Improvements were not identified as a priority except for safety, which businesses expressed a
slight need for improvement;
Prioritisation of service – Respondents were generally positive that United Energy could be
trusted to manage the network for the greater good of the system (67 (av)), and that they should
direct their efforts to where it would do the most good rather than to service individual needs (64
(av)). Further, respondents were in moderate agreement that all electricity users should pay for
solar panels to be connected to the electricity grid (56 (av));
Provision of information – Respondents wanted information (70 (av)) to enable them to control
their electricity bill. They agreed that they are reasonably aware of their electricity consumptions
patterns (66 (av)), and have purchased energy efficient appliances (73 (av)), but indicated they
would pay closer attention to usage patterns (75 (av)) if they could easily do so. Approximately
half of respondents deliberately vary their usage patterns to save electricity, and most (80 (av))
agreed that they would like United Energy’s costs to be separately identified on their electricity
bill;
Disruptive technologies – Nearly half of respondents agreed that they would disconnect from the
electricity grid if there was capacity for them to do so; and
Electricity equipment – Almost all residential and business respondents have at least one
computer and a fixed internet connection. The majority of residential respondents were mains
connected to the gas supply (92 (av)), compared to one third of business respondents. More than
two thirds of all respondents had electric air conditioning and surge protection and half had a
telephone that doesn’t operate during power outages. One third of business respondents had
uninterruptible power supply and two in five had industrial power tools and equipment. More than
90 (av) of residential respondents had a washing machine, and approximately two thirds had an
electric oven and dishwasher. Two thirds of residential respondents had energy saving devices
for appliances, compared to one third for business respondents.

RESEARCH
28 30 April 2015 © United Energy Customer Engagement Initiatives and Outcomes
Public
Willingness to pay/forgo – simple choices
Respondents were asked to nominate:
Which of ten initiatives they would pay extra for; and
How much extra in total they would be prepared to pay per bill.
The ten initiatives included suggestions regarding:
Undergrounding of electricity assets;
Improving reliability;
Improving safety;
Communications regarding planned / unplanned interruptions;
Improving information response capability;
Improving the aesthetics of assets;
Improving vegetation management;
Improving call centre responsiveness; and
Learning more about United Energy’s services.
On average, respondents indicated that they were only prepared to pay a very small amount to improve their
current service levels. The matters that they were willing to pay something for were:
Replacing existing power supply poles with undergrounding ($0.83 to $2.77 per bill);
Improving electricity reliability by a noticeable amount ($0.48 to $1.46 per bill); and
Making the power lines, poles and transformers safer ($0.47 to $2.28 per bill).
However, more than half of respondents were not prepared to pay anything for a change in service. These
results are summarised in Table 6.5

RESEARCH
30 April 2015 © United Energy
Customer Engagement Initiatives and Outcomes
29 Public
Willingness to pay Residential Business
Willingness to pay something for change of service 47.1% 48.4%
Median total willing to pay per bill $0.00 $0.00
Average total willing to pay per bill $2.89 $12.51
Number of initiatives willing to pay something for 1.41 2.58
Table 6.5 – Willingness to pay results
Respondents were also asked to nominate which of the ten initiatives they would choose to receive by forgoing
any future savings when their bill fell in value, and how much in total that reduction would need to be per bill.
On average, residential respondents were prepared to forego $3.44 per bill and business respondents were
willing to forego $36.39 per bill to improve their current service levels. Respondents choose to improve the
same service attributes as noted above for the willingness to pay element of the survey.
However, half of residential respondents were not willing to forego more than $0.5 per bill and business
respondents more than $5 per bill. These results are summarised in Table 6.5.6.
Willingness to forego Residential Business
Willingness to forego something for change of service 52.4% 68.3%
Median total willing to forego per bill $0.50 $5.00
Average total willing to forego per bill $3.44 $36.39
Number of initiatives willing to forego something for 1.56 3.82
Table 6.6 - Willingness to forgo results
Reliability choice modelling/choice experiment
A variation of the bill was included in one third of the choice models.
Figure 6.7 highlights the impact of relatively small changes in price to the respondents and the percentage of
time an offer of improved service is accepted. It shows that, where no money is offered, respondents accept
the offer of improved service almost 45 per cent of the time. Where they are asked to pay only $0.50 more on
their bill, acceptance falls to almost 30 per cent. By the time respondents are asked to pay $15 on their bill,
acceptance falls to less than 10 per cent, where it remains for higher payments.

RESEARCH
30 30 April 2015 © United Energy Customer Engagement Initiatives and Outcomes
Public
Figure 6.7 - The impact of money on choices
Price variation had a very powerful distorting effect on the answers respondents gave in the survey. The
inclusion of money not only distorted the choice experiment, but also meant that the choice became much
more about the money than any other element of the available choice. For these reasons, any of the choices
involving money were excluded from further analysis. As a result, the remaining choices provided an
assessment of “willingness to trade” (WTT) only (i.e. where no money is involved).
Interruption frequency
Figure 6.8 shows that, when taken together, the survey revealed residential and business respondents having
a perceived threshold point for their interruption frequency of 1.0 times per annum. When calibrated to United
Energy’s actual network performance, this translated to 1.99 interruptions per annum. That is, respondents
perceived that they experienced half as many interruptions as they actually experienced. Further analysis on
network data shows that 57 per cent of consumers are receiving better reliability than the threshold point
indicates. For business consumers, perceived interruptions ranged between 1.7 to 12.7 times per annum,
which gave them calibrated network thresholds of 2.1 to 3.7 times per annum.
Figure 6.8 - Residential and business consumer perceived interruption frequency
0%
5%
10%
15%
20%
25%
30%
35%
40%
45%
50%%
of
tim
e a
n o
ffe
r is
acc
ep
ted
Money involved in the choice
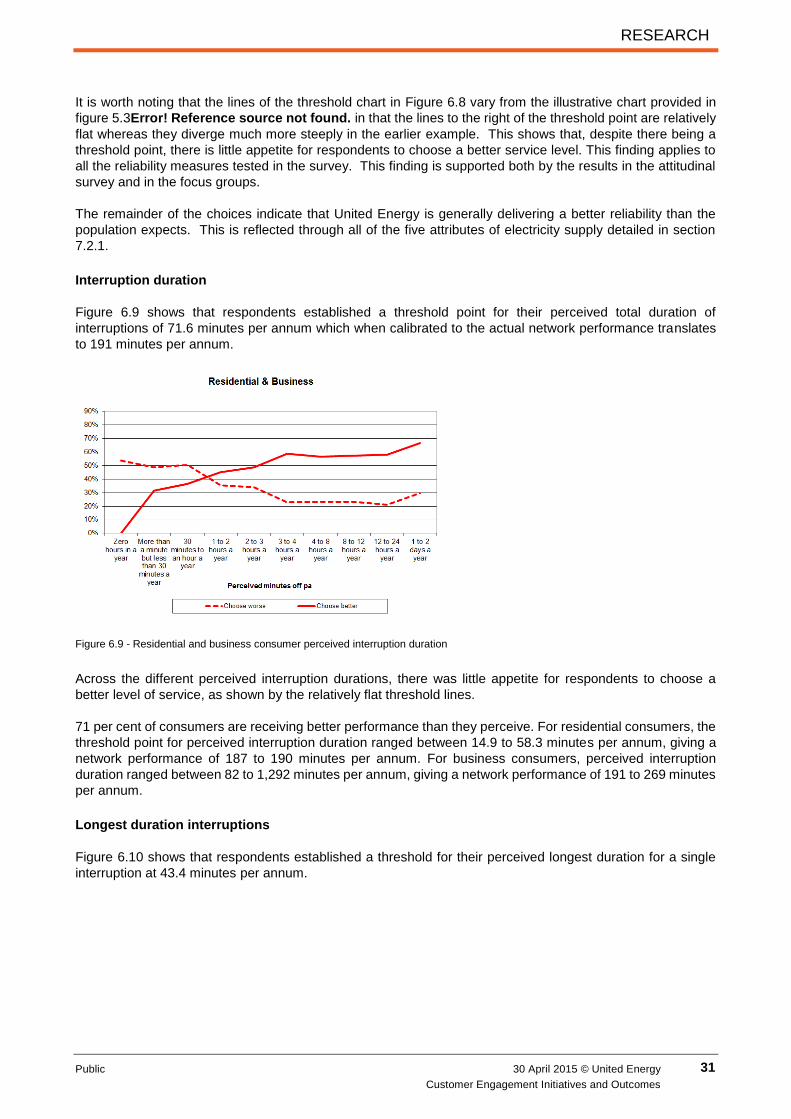
RESEARCH
30 April 2015 © United Energy
Customer Engagement Initiatives and Outcomes
31 Public
It is worth noting that the lines of the threshold chart in Figure 6.8 vary from the illustrative chart provided in
figure 5.3Error! Reference source not found. in that the lines to the right of the threshold point are relatively
flat whereas they diverge much more steeply in the earlier example. This shows that, despite there being a
threshold point, there is little appetite for respondents to choose a better service level. This finding applies to
all the reliability measures tested in the survey. This finding is supported both by the results in the attitudinal
survey and in the focus groups.
The remainder of the choices indicate that United Energy is generally delivering a better reliability than the
population expects. This is reflected through all of the five attributes of electricity supply detailed in section
7.2.1.
Interruption duration
Figure 6.9 shows that respondents established a threshold point for their perceived total duration of
interruptions of 71.6 minutes per annum which when calibrated to the actual network performance translates
to 191 minutes per annum.
Figure 6.9 - Residential and business consumer perceived interruption duration
Across the different perceived interruption durations, there was little appetite for respondents to choose a
better level of service, as shown by the relatively flat threshold lines.
71 per cent of consumers are receiving better performance than they perceive. For residential consumers, the
threshold point for perceived interruption duration ranged between 14.9 to 58.3 minutes per annum, giving a
network performance of 187 to 190 minutes per annum. For business consumers, perceived interruption
duration ranged between 82 to 1,292 minutes per annum, giving a network performance of 191 to 269 minutes
per annum.
Longest duration interruptions
Figure 6.10 shows that respondents established a threshold for their perceived longest duration for a single
interruption at 43.4 minutes per annum.

RESEARCH
32 30 April 2015 © United Energy Customer Engagement Initiatives and Outcomes
Public
Figure 6.10 - Residential and business consumer perceived duration of longest single interruption
Across the different perceived interruption durations there was little appetite for respondents to choose a better
service level, except for those consumers experiencing an interruption of eight hours or more. These
respondents make up a relatively small proportion of United Energy’s total customer base.
Momentary interruptions
Figure 6.11shows that consumers have a perceived threshold 0.8 momentary interruptions per annum. This
calibrates to an actual network performance of 1.63 times per annum.
Figure 6.11 - Residential and business consumer perceived momentary interruptions
Across the different levels of perceived momentary interruptions, there was little appetite for respondents to
choose a better service level, except for those respondents currently experiencing weekly momentary
interruptions. These consumers make up a tiny proportion of the total consumer base.
70 per cent of consumers are receiving better performance than they specify in the threshold point. For
business consumers, perceived momentary interruption threshold ranged between 1.7 to 10.0 times per
annum, compared to United Energy’s actual network performance of 2.0 to 3.0 times per annum.

RESEARCH
30 April 2015 © United Energy
Customer Engagement Initiatives and Outcomes
33 Public
Quality of supply
On average, consumers’ perceived threshold for the frequency of flickering or blinking lights, blown light bulbs,
damaged electrical equipment and sustained low voltage is 0.9 times per annum, which calibrates to an actual
experience of 1.6 times per annum. This is necessary as there is no network measure of quality. This is
shown in Figure 6.12.
Figure 6.12 - Residential and business consumer perceived reliability threshold
Across the different levels of perceived quality issues, respondents had little appetite for a materially better
quality of service, as shown by the relatively flat threshold lines.
Key research findings
Following completion of the research phase of the customer and stakeholder engagement program, a number
of general conclusions were developed on the key matters on which consumers were engaged:
Awareness of United Energy – consumers have relatively low awareness of United Energy and
the services it provides but want to know more about them. Those who do know about United
Energy would generally recommend it to others;
Price structures – consumers generally do not understand the cost breakdown of their retail bills
but think that United Energy’s component should be separately identified;
Reliability – consumers generally think they receive reliable supply from United Energy – in fact
they perceive their reliability to be better than that they actually experience. Consumers generally
have little or no appetite for improved reliability. They are also generally not willing to pay anything
to improve their service;
Communication – consumers want better communication from United Energy about planned and
unplanned interruptions. Their principal concern is not that power goes off but not knowing when
it is going to come back on (i.e. the speed and accuracy of United Energy’s response information);
Electricity consumption – consumers are generally willing to respond to incentives to reduce their
peak demand, although this can be more difficult for business consumers. Consumers would
generally pay closer attention to their usage patterns if it was easy to do;
Bill control – consumers generally want better and more timely information to enable them to
control their electricity bills; and

RESEARCH
34 30 April 2015 © United Energy Customer Engagement Initiatives and Outcomes
Public
Safety and environment – consumers generally consider that United Energy is looking after the
day-to-day issues of vegetation management, safety and aesthetics close to their expectations.

COMMUNITY OUTREACH AND CONSULTATION WORKSHOPS
30 April 2015 © United Energy
Customer Engagement Initiatives and Outcomes
35 Public
7. Community outreach and consultation workshops
7.1 Shopping centre kiosks
During August and September 2014, we ran a community outreach initiative where we hosted a branded kiosk
in three shopping centres in our network area at Chadstone, Frankston and Glen Waverley.
The objectives of the kiosks were to:
Build awareness of United Energy and our services
Increase awareness of the regulatory process and price setting framework
Establish high level customer priorities relating to electricity supply
Test the concept of community outreach for future customer engagement.
In addition to providing general coverage of our network area, the locations also provided a mix in terms of the
nature of the facilities and the customer traffic. For example, while Westfield Chadstone gave us exposure to
much greater numbers of customers, a larger proportion were expected to come from outside our network
area. In addition, the smaller suburban centres in Frankston and Glen Waverley tended to be visited by people
undertaking more regular shopping activities, with more time and inclination to engage kiosk staff in
conversation.
The kiosk was supported by two staff at all times. Initially, the staff was a mix of customer service and
engineering personnel from within our business.
Over the course of the three weeks, more than 1,000 people visited to kiosk and were engaged in conversation.
Feedback from the first two weeks of the initiative consistently referred to customer conversations being highly
general and related to issues such as retail bills and solar. In response, we increased customer service
personnel and decreased support from our engineering professionals.
We created a simple five-minute online survey to identify customer priorities relating to electricity supply. The
interactive survey required customers to order a list of seven issues in order of importance to them. Around
300 people completing an online survey to tell us what was important to them when it comes to electricity.
What does energy mean to you - what's most important when you think about electricity in your home?
Price Reliability Help managing
usage
Safety Customer
service
Undergrounding
power lines
Solar Other
44 116 17 5 14 3 6 15
What's important to you
Improving call centre
responsiveness
Improving electricity
reliability
Providing service
interruption notifications by SMS or email
Making infrastructure
(poles, lines) and vegetation more attractive
Improving safety of power lines,
power poles, transformers, etc.
Provision of information about
the services we provide
Undergrounding power lines and
power poles
38 108 31 8 270 18 39

COMMUNITY OUTREACH AND CONSULTATION WORKSHOPS
36 30 April 2015 © United Energy Customer Engagement Initiatives and Outcomes
Public
7.2 Council workshops
Recognising the specific issues of concern to local government in our network area, we held two workshops
for Councils during the engagement program.
The first workshop session, held 6 March 2014, focused primarily on public lighting. The outcomes
were used to inform our response to the AER Framework and Approach for Victorian businesses.
The second workshop, held in 4 December 2014, focused primarily on vegetation management,
including potential solutions to ongoing problems with scheduling of tree cutting by councils, as well
as process and communication issues generally.
7.3 Consultation workshops
Between July and December we held a series of monthly in-depth workshops with diverse representative
groups to discuss key issues including public lighting, customer service and communication, network
innovation and investment, demand forecasting, environmental programs, safety initiatives and pricing
scenarios.
We wrote to a broad range of stakeholder groups were invited to attend, before following up by phone. While
stakeholders were encouraged to come to all of the sessions, by setting out the topic areas to be covered in
each session at the outset of the program, participants were able to select which sessions to prioritise.
7.3.1 Workshop participants
The following groups were represented at one or more of the consultation workshop sessions:
Alternative Technologies Association
St Vincent de Paul Society
Consumer Action Law Centre
Consumer Utility Advocacy Centre
Victoria Police
Municipal Association of Victoria
Springvale Community Aid and Advice Bureau
Ironbark Sustainability
Victorian Department of State Development, Business and Innovation
Eastern Alliance for Greenhouse Action
South East Councils Climate Change Alliance
Energy and Water Ombudsman of Victoria
Victorian Council of Social Services
City of Stonington Council

COMMUNITY OUTREACH AND CONSULTATION WORKSHOPS
30 April 2015 © United Energy
Customer Engagement Initiatives and Outcomes
37 Public
7.3.2 Workshop format
Each workshop session included a brief presentation from United Energy from subject matter experts from
across the business. The objective of the presentation was to set out the general issues related to the topic
area, before a discussion among the group participants about specific concerns, items to be addressed in the
regulatory proposal and other matters to be pursued, such as process improvements unrelated to the price
review.
Sessions were facilitated by a representative of KPMG. While we paid KPMG for this service, the role of the
facilitator was independent with the objective to provide opportunity for further clarification of issues as
required.
7.3.3 EDPR Information and Consultation Session Schedule
Date 2014 Topic Area Description
Thurs 31 July EDPR overview About UE
Regulatory framework
The EDPR process, timeframes, outcomes and implications
Consultation process and opportunities
Generic expenditure and pricing impacts
Research findings
Thurs 28 August Customer service Initiatives to provide customers with better access to accurate and timely information
Further research outcomes
Community outreach program
Thurs 25 September Network investment and innovation
Network related capital investment to plan for future customer needs
Initiatives to support technology innovation
Wed 22 October Safety and environment Initiatives related to community safety
Vegetation management
Environmental initiatives
Friday 12 December UE EDPR proposal 2016-2020 /
Expenditure and price path scenarios
High level summary of draft EDPR proposal
Base, medium and high scenarios of potential investment proposals
The final consultation workshop, held on 12 December, included an overview of the high level priorities and
directions of the preliminary draft proposal for discussion.
In addition, we presented pricing scenarios compared against the 2011-15 regulatory period. A menu of options
including regulatory changes, network performance, customer experience and council initiatives were also
provided, matched against explicit price impacts and customer outcomes.

PRELIMINARY PROPOSAL OVERVIEW FOR PUBLIC COMMENT
38 30 April 2015 © United Energy Customer Engagement Initiatives and Outcomes
Public
8. Preliminary proposal overview for public comment
In February 2015 we released a summary of our draft proposal for public comment. A copy of the consultation
paper is available from our website, and is also provided as an Appendix to our regulatory proposal.
The objective of the consultation paper was to provide customers and stakeholder groups with an easy to
understand overview of our business and proposal, with explicit information about price impacts. It included:
A foreword from our Chief Executive Officer
An introduction to United Energy and our role in the energy supply chain
A profile of our customer base and stakeholders
Our engagement strategy
What customers have told us
What we delivered in the 2011-15 regulatory period
What we propose to deliver in the 2016-20 regulatory period
Explicit pricing impacts, including a price cut of approximately $55 in 2016
Customer outcomes and investment highlights
Information on how to provide customer and stakeholder feedback.
In consultation with stakeholders, we confirmed that we would delay the release of any consultation document
until after the Australia Day long weekend, recognising that many customers and stakeholder groups would
be unavailable to consider the document.
The consultation paper was open for one month, with submissions closing on Friday 20 March.
8.1 Distribution
The consultation paper was made available online and sent directly to stakeholder groups that had participated
in the engagement program.
We also provide a copy to local and metropolitan media. A story appeared in the Herald Sun on 27 February.
In addition, we ran half page advertisements in the nine Leader Community Newspapers titles covering our
network area.
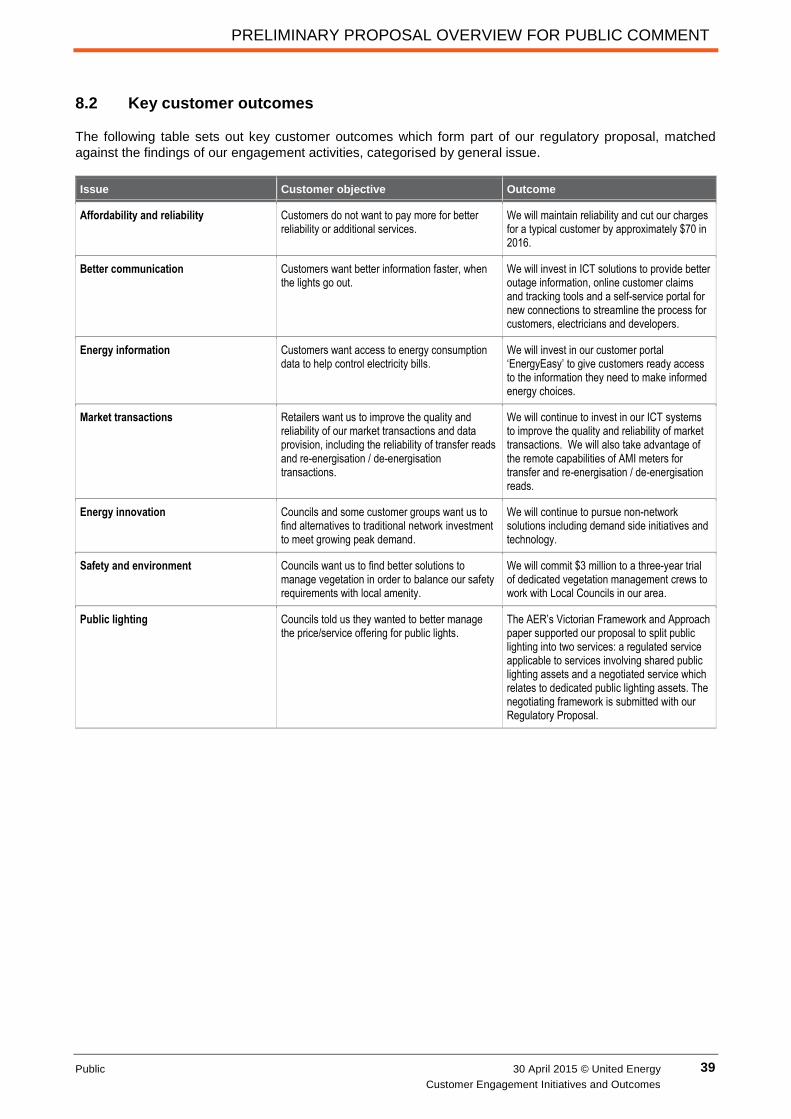
PRELIMINARY PROPOSAL OVERVIEW FOR PUBLIC COMMENT
30 April 2015 © United Energy
Customer Engagement Initiatives and Outcomes
39 Public
8.2 Key customer outcomes
The following table sets out key customer outcomes which form part of our regulatory proposal, matched
against the findings of our engagement activities, categorised by general issue.
Issue Customer objective Outcome
Affordability and reliability Customers do not want to pay more for better reliability or additional services.
We will maintain reliability and cut our charges for a typical customer by approximately $70 in 2016.
Better communication Customers want better information faster, when the lights go out.
We will invest in ICT solutions to provide better outage information, online customer claims and tracking tools and a self-service portal for new connections to streamline the process for customers, electricians and developers.
Energy information Customers want access to energy consumption data to help control electricity bills.
We will invest in our customer portal ‘EnergyEasy’ to give customers ready access to the information they need to make informed energy choices.
Market transactions Retailers want us to improve the quality and reliability of our market transactions and data provision, including the reliability of transfer reads and re-energisation / de-energisation transactions.
We will continue to invest in our ICT systems to improve the quality and reliability of market transactions. We will also take advantage of the remote capabilities of AMI meters for transfer and re-energisation / de-energisation reads.
Energy innovation Councils and some customer groups want us to find alternatives to traditional network investment to meet growing peak demand.
We will continue to pursue non-network solutions including demand side initiatives and technology.
Safety and environment Councils want us to find better solutions to manage vegetation in order to balance our safety requirements with local amenity.
We will commit $3 million to a three-year trial of dedicated vegetation management crews to work with Local Councils in our area.
Public lighting Councils told us they wanted to better manage the price/service offering for public lights.
The AER’s Victorian Framework and Approach paper supported our proposal to split public lighting into two services: a regulated service applicable to services involving shared public lighting assets and a negotiated service which relates to dedicated public lighting assets. The negotiating framework is submitted with our Regulatory Proposal.


