48
Customer Insight report 2015 – 2016 5 July 2016

Customer Insight report 2015 – 2016
5 July 2016

Contents
Contents........................................................................................................................................... 1
Context ............................................................................................................................................ 2
Summary.......................................................................................................................................... 3
What do residents think of the council? ........................................................................................... 5
Surveying residents of the city ...................................................................................................... 6
How do we compare nationally? ................................................................................................. 11
How satisfied are our customers with the service we provide? ...................................................... 13
Surveying our customers ............................................................................................................ 14
What are the reasons for customers contacting us? ...................................................................... 18
How do our customers contact us? ................................................................................................ 20
What methods do our customers use to get in touch? ................................................................ 21
How do we use customer complaints and compliments to improve services? ............................... 38
What feedback have we received? ............................................................................................. 39
Next steps ...................................................................................................................................... 46
Improving customer satisfaction ................................................................................................. 46
Improving data quality ................................................................................................................. 46
Page 1 of 47

Context
We have listened to our customers and have made the following 3 commitments – our Customer Promise.
The purpose of this Customer Insight report is to bring together the information collected about the customer experience of using Brighton & Hove City Council services in 2015/16. By customer we mean, any user of council services, whether voluntary or involuntary. This includes residents and visitors to the city, service users and their representatives. This report presents what we currently know about our customer services. This is to ensure we better understand the needs of our customer, and to learn and grow consistently from the feedback we receive. Intelligence from this report is feeding into the modernisation programme Customer First in a Digital Age (CFDA) to improve our digital offer for customers.
Customer Insight is one element of our Performance Management Framework that sets out how the council manages performance, to achieve our purpose as set out in the Corporate Plan, and provide a guide for all those involved in the performance management process.
Further work is underway in 2016/17 to improve the consistency and quality of the data included in this report and to include the services not currently featured, where appropriate.
Continuous Improvement
1 Business
Planning and Management 2
Risk Management
3 Financial
Management
4 Customer
Insight 5
Modernisation Programmes &
Projects
6 People
Management
7 Health & Safety
Management
8 Safeguarding
Quality Assurance
Page 2 of 47

60%20%
7,630
12%
3 of the 6 services who deliver the top 20 highest volume transactions have reported that at least
60% 60%
20%complaints
20%compliments
6%
4%
3%
Page 3 of 47
and

49% reductionin face to face contact from 2010/11 (18,050pm to 9,222pm).
T
13 % a
www25% a
REDUCED
BY 32%
@ 11%
40%Page 4 of 47

What do residents think of the council?
Nationally, in the Local Government Association (LGA) Resident Satisfaction survey of
September 2015, this figure stood at 71%.
In the most recent national LGA Resident Satisfaction survey, 51%
agreed that their council provides value for money.
Nationally, in the LGA Resident Satisfaction survey 58% say they trust their council a great deal/fair
amount.
60% of residents are fairly or very satisfied with the
way the council runs things, up from 40% in 2014.
39% of residents agree that the council provides value for money, up from 31% in
2014.
Almost six in ten residents (59%) trust the council a
great deal or a fair amount - in 2014, the figure stood
at 52%.
Page 5 of 47

Surveying residents of the city
The City Tracker survey is an annual survey of 1000 residents collects the views of residents on council and partner services, satisfaction with the city as a place to live, as well as propensity for social action. The latest survey was conducted between September 14 and October 21 2015. Brighton & Hove Connected commissioned Infocorp Ltd to carry out its 2015 annual survey of city-wide residents. The survey covers the adult population aged 18+, usually resident in Brighton & Hove
The objective of the City Tracker Survey is to find out what residents think of Brighton & Hove as a place to live. This includes tracking key performance indicator (KPI) monitoring of essential city services.
Some of the questions included in the 2015 survey can be compared with data from research carried out by national bodies and central government departments, which gives perspective on how Brighton & Hove compares with the rest of the country.
The comparison surveys are:
• Local Government Association national benchmarks for resident satisfaction from June2015 (LGA comparison)
• Cabinet Office Community Life Survey 2014-15 (CLS comparison)• Department for Culture, Media & Sport Taking Part Survey June 2015 (TPS comparison)
2015 results are also compared with previous waves of the City Tracker Survey undertaken at the same time of year.
About the data: Whilst postcode data is collected from respondents, the sample size at the ward level is too small to allow meaningful or robust analysis. We are, however, able to draw out some broader geographical information, where there are significant variations in results, around the wider postcode areas of BN1, BN2, BN3 & BN41.
Resident satisfaction with the council
Satisfaction with the council has returned to previously seen levels after a drop in 2014. In 2013, this was 60%, in 2014 this reduced to 40%, and for 2015 this has returned to 60%, an increase of 20 percentage points.
The nearest comparable result nationally is from the LGA national Resident Satisfaction survey, which asks: “Overall, how satisfied or dissatisfied are you with the way your local council(s) runs things?” 71% were ‘fairly’ or ‘very satisfied’ in September 2015.
Page 6 of 47

Six in ten residents (61%) are satisfied with Brighton & Hove City Council, including 14% who are very satisfied.
Service users ‘very or fairly satisfied’
• Residents in the 18-34 (19%) and 55+ (16%) age categories are more likely to feel verysatisfied with the council than those in the 35-54 group (8%).
• 22% of users in the 18-34 year-old age band are very satisfied with the council, comparedwith 9% of 35-54 year olds and 17% of those aged 55+
• More than a quarter (27%) of users from BME backgrounds say they are very satisfied withthe council, compared to 14% of white British residents
• A quarter (24%) of users with a disability are very satisfied with the council, compared with14% of those who do not consider themselves to be disabled
• A majority (86%) of residents are satisfied with Brighton & Hove as a place to live. Only 7%are dissatisfied.The 2015 figure (86%) is a notable improvement on 2014 when 79% of residents said theywere satisfied with the city as a place to liveHowever, the proportion saying they are satisfied is not quite as high as in 2013 (89%) or2012 (90%)The proportion of residents who are dissatisfied is broadly similar in 2015 (7%) to 2014(6%). This stood at 4% in 2013 and 5% in 2012
• Residents living in the BN3 postcode area are most likely to be very or fairly satisfied(91%), compared to 84% in BN1 and BN2 and 83% in BN41
40%
50%
60%
70%
80%
90%
100%
2012 2013 2014 2015
East Sussex Fire & Rescue
Your local chemist
Local charities/ communitygroupsYour GP
NHS dentist
Local NHS hospital
Sussex Police
Mental health services
Brighton & Hove CityCouncil
Page 7 of 47

Perceived value for money
Almost four in ten (39%) residents agree that the council provides value for money, up from 31% in 2014. However, as in the previous surveys, there are a sizeable proportion of residents who feel they are not getting value for money – 29% in 2015, compared with 32% in 2014.
Despite the year-on-year improvement in the Brighton & Hove figures, residents are considerably less likely to feel the council provides value for money than is the case nationally. In the most recent LGA survey, 51% agreed that their local authority was providing value for money.
Trustworthiness
Almost six in ten residents (59%) trust the City Council a great deal or a fair amount - in 2014, the figure stood at 52%. However, more than a quarter (27%), say they don’t trust the council very much, while one in ten (11%) say they have no trust at all.
Residents in the 18-34 age band are most likely to trust the council a great deal (13% do so, compared with 4% in the 35-54 age band and 6% of those aged 55+) Lack of trust in the council is highest in BN41, where 18% don’t trust the council at all, compared with 7% in BN3.
Brighton & Hove residents are similar to the national LGA average, in the latest national survey, 58% say they trust their council a great deal/fair amount.
4% 13% 16% 29% 32% 7%
Don't know Strongly disagree Tend to disagreeNeither agree nor disagree Tend to agree Strongly agree
3% 11% 27% 51% 8%
Don't know Not at all Not very much A fair amount A great deal
Page 8 of 47

Satisfaction with the street in which you live
Following the general upward trend in this year’s findings, satisfaction with residents’ immediate neighbourhood has increased in all areas since 2014, in most cases returning to levels seen in 2013.
More than 75% are ‘fairly’ or ‘very satisfied’ with road safety in their immediate neighbourhood, up from only 58% in 2014, and even exceeding the levels recorded in 2013 (74%) and 2012 (73%).
Despite an increase in satisfaction with noise levels in their street since last year (up to 80% in 2015 from 65% in 2014), there has not been a return to the levels recorded in 2013 (81%) or 2012 (84%).
Reflecting yet again the disruption to refuse and recycling collection in 2014, the overall satisfaction with resident’s perception of how well the council looks after their street has increased from last year (66% up from 48% in 2014) but still hasn’t returned to levels recorded in 2013 (73%) or 2012 (76%). Satisfaction with ‘how clean and green the streets are’ and ‘the way the street looks’ are showing a similar trend, with considerable increases in satisfaction from last year, but not recovered to levels recorded in 2012 or 2013.
Residents of BN41 are less likely to be very satisfied with the way the council looks after their street (12%) than those in BN2 (25%), BN3 (25%) and BN1 (21%).
8%
8%
5%
14%
11%
10%
13%
10%
9%
43%
37%
43%
23%
35%
33%
How well the CityCouncil looks after it
(984)
How clean and greenthe street is (998)
The way it looks (998)
Very Dissatisfied Fairly dissatisfied Neither Fairly satisfied Very satisfied
6%
5%
12%
8%
6%
8%
41%
38%
35%
42%
Road safety (997)
Noise levels (998)
Page 9 of 47

• Respondents were also asked how satisfied they were with the parks and open spacesprovided by the council, and how satisfied they were with the Seafront, there aregeographical differences in these results - Residents of BN3 report the highest level of verysatisfied scores (Parks and open spaces) by locality (44%), compared with a low of 29% inBN41.
• The highest level of very satisfied scores by locality is reported in BN3 (34%) while BN1residents are least likely to be very satisfied (19%) with the Seafront.
Page 10 of 47

How do we compare nationally?
Where we are performing above the average City Tracker 2015 Nationally
Percentage point(s)
difference
People agreeing they can influence decisions affecting their local area 51% 35% +16
Agree people pulling together to improve their neighbourhood 72% 63% +9
Local activism (belong to group that make decision that affect their local area 15% 8% +7
Satisfaction with the local area as a place to live 89% 82% +7
Satisfied with road maintenance 46% 39% +7
Agree that people from different backgrounds get on well together 91% 86% +5
Where we are similar to national results City Tracker 2015 Nationally
Percentage points
difference
Satisfied with Library services 66% 62% +4
Trust in their local council 59% 58% +1
Feeling unsafe in your local area after dark 11% 10% +1
Satisfied with sports & leisure services 63% 62% +1
Satisfied with services for children and young people 47% 47% 0
Feel strongly they belonging to your neighbourhood 70% 72% -2
Formal volunteering in last 12 month 39% 42% -3
Page 11 of 47

Where we are performing below the average City Tracker
2015 Nationally Percentage
points difference
Satisfied with waste collection 64% 77% -13
Satisfied with services for older people 32% 45% -13
Agree the council provides value for money 39% 51% -12
The council acting on the concern of local residents 53% 59% -6
Well informed about council services and benefits 55% 61% -6
Satisfied with street cleaning 66% 72% -6
Satisfied with pavement maintenance 48% 54% -6
72% of residents agree that people pull together to improve their neighbourhood – this is 9 percentage points above the
national average.
Page 12 of 47

How satisfied are our customers with the service we provide?
These services include:
Benefits,Revenues & Housing Management.
Benefits, Bereavement Services, Blue Badge team, Business Rates, Customer Service Centres, Libraries, Local Land Charges and Visitor Information.
All of the services that deliver the top twenty highest volume transactions have provided customer satisfaction data, these include Revenues & Benefits, Parking, Cityclean, Planning and Housing. Additionally 13 other services reported a significant response to key questions on Customer Satisfaction and Ease of Effort in 2015/16, 6 further services recorded response rates too low to include.
In 2015/16, the following services reported results of the standard customer questions for the first time: Blue Badge, Brighton Centre Box Office, Environmental Health & Licensing, Housing Adaptations, Housing Needs, and Visitor Information.
3 of the 6 services who deliver the council’s top twenty highest
volume transactions have reported that at least 60% of their customers were ‘very
satisfied’ with the standard of customer service received and
also found it ‘very easy’ to access their services.
9 services reported that more than 80% of customers found it ‘very easy’ to access services
3 of the 11 services reporting results in 2014/15 and 2015/16
have seen improvements in both customer satisfaction and
ease of effort results.
Page 13 of 47

Surveying our customers
How was the standard of customer service received?
Service users were asked the following question:
(1) How was the standard of customer service you received? • Responses included: Very good, fairly good, neither good nor poor, fairly poor, very poor
The below chart shows the percentage of ‘very good’ responses
89% 91% 97%
75%
100%
76%
94%
92%
32%
49% 62%
28%
82%
86%
100%
33%
98%
40%
83% 80%
0%
25%
50%
75%
100%Benefits
Bereavement
Blue Badge
BrightonCentre Box
Office
BusinessRates
Council Tax
CSCBartholomews
CSC HoveTown Hall
Environment(inc Parking,
Cityclean,Cityparks)Environmental
Health &LicensingHousing
CustomerServices
HousingNeeds
HousingAdaptations
Libraries
Local LandCharges
Planning
RegisterOffice
Transport &Highways
RoyalPavillion &Museums
VisitorInformation
Service
Page 14 of 47

How easy or difficult was it to use a service?
Service users were asked the following question:
(1) How easy or difficult was it for you to use our service? • Responses included: Very easy, fairly easy, neither easy nor difficult, fairly difficult, very difficult
The below chart shows the percentage of ‘very good’ responses
82%
100%
97%
50%
83%
69%
94%
92%
32%
37%
59%
28%
64%
89%
100%
35%
98%
65%
87%
0%
25%
50%
75%
100%Benefits
Bereavement
Blue Badge
BrightonCentre
Box Office
BusinessRates
Council Tax
CSCBartholomews
CSCHove Town
Hall
Environment(inc Parking,
Cityclean,Environmental Cityparks)
Health& Licensing
HousingCustomerServices
HousingNeeds
HousingAdaptations
Libraries
Local LandCharges
Planning
RegisterOffice
RoyalPavillion
& Museums
VisitorInformation
Service
Page 15 of 47
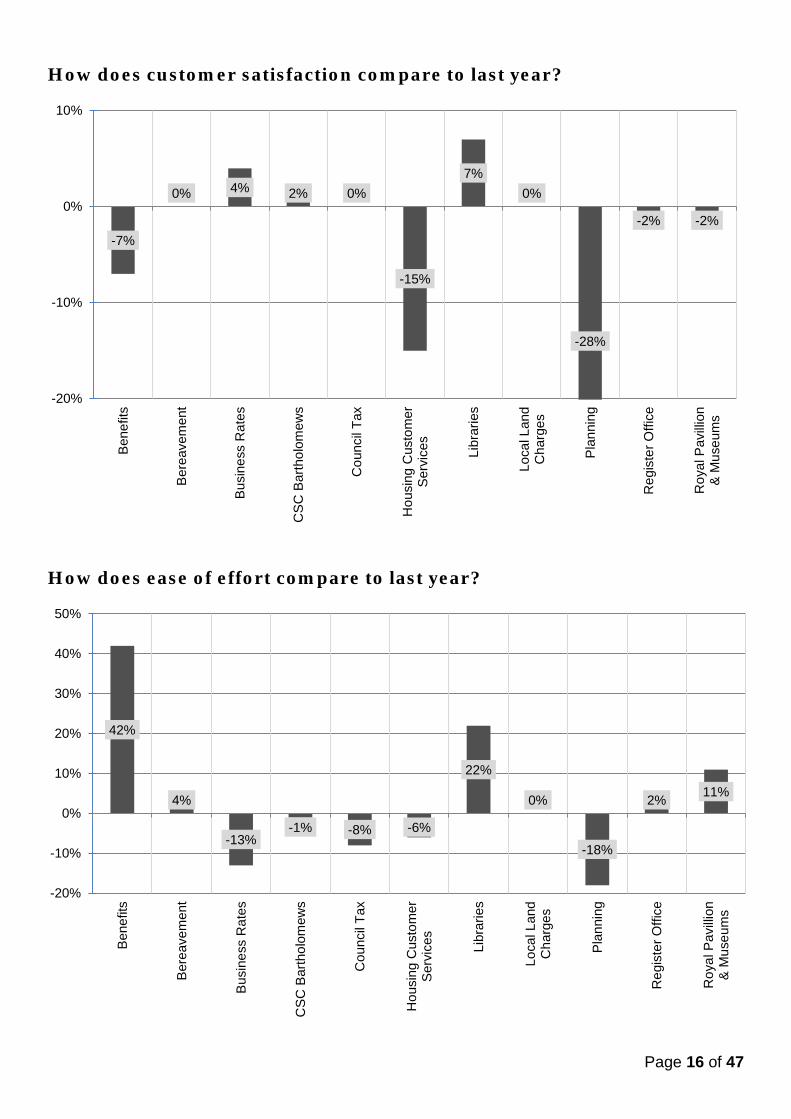
How does customer satisfaction compare to last year?
How does ease of effort compare to last year?
-7%
0% 4% 2% 0%
-15%
7% 0%
-28%
-2% -2%
-20%
-10%
0%
10%B
enef
its
Ber
eave
men
t
Bus
ines
s R
ates
CS
C B
arth
olom
ews
Cou
ncil
Tax
Hou
sing
Cus
tom
erS
ervi
ces
Libr
arie
s
Loca
l Lan
dC
harg
es
Pla
nnin
g
Reg
iste
r Offi
ce
Roy
al P
avilli
on&
Mus
eum
s42%
4%
-13% -1% -8% -6%
22%
0%
-18%
2% 11%
-20%
-10%
0%
10%
20%
30%
40%
50%
Ben
efits
Ber
eave
men
t
Bus
ines
s R
ates
CS
C B
arth
olom
ews
Cou
ncil
Tax
Hou
sing
Cus
tom
erS
ervi
ces
Libr
arie
s
Loca
l Lan
dC
harg
es
Pla
nnin
g
Reg
iste
r Offi
ce
Roy
al P
avilli
on&
Mus
eum
s
Page 16 of 47

Notes about surveying
For those services who have reported both the number of respondents and the results, we have only included those who have received more than 20 responses. For services reporting response rates below 20, the results could not be considered representative.
Services which have conducted surveys but have had a response rate lower than 20 include: Access Point (Adult Social Care), Electoral Services, Family Information Service, Free School Meals, Fostering & Adoption team, School Admissions.
Services which have not conducted surveys with the standard corporate questions, but gather feedback from customers in other ways include:
Early Years services who conducted a consultation around their service redesign, asking customers for feedback on their experience of using the service and Library services that have carried out a Library Needs Analysis, inviting feedback from customers on proposed changes to the service and their opinions on the services they had used.
Work continues in 2016/17 to ensure all customer facing services use these standard questions when surveying customers, where appropriate.
Page 17 of 47

What are the reasons for customers contacting us?
The top twenty recorded reasons for customer contact in February 2016 – as a percentage of total calls where a reason was recorded, only the top twenty are displayed in this chart.
1.5%
1.6%
1.7%
1.7%
1.9%
2.0%
2.1%
2.4%
2.4%
2.5%
2.5%
2.6%
2.7%
3.1%
3.3%
3.3%
3.9%
4.0%
4.3%
5.8%
11.9%
0% 2% 4% 6% 8% 10% 12% 14%
Homemove (infonon-council tenant)
Evidence Query
Setting upDirect Debit
Liability Orders
DiscretionaryScheme
Neighbourhoodcall back new
EntitlementQuery
Making apayment
New ClaimAdvice
Repairs (chasing/complaints)
Progress Chasing
Car Parks& Garages
Visitor Parkingpermit query
Tenancy issues
Missed refuse/recycling/assisted collection
Reminder notice
Summons notice
Moved address
General HomemoveAdvice
Query balance/repayments
Parking-residentpermit query
Of the 7,630 calls received in February where we recorded the reason for contact, 12% were about resident parking permits, 6% were to query the balance or instalments of their Council Tax bill, 4% were for general Homemove advice from Housing Needs, and 3% about missed refuse or recycling collections.
Page 18 of 47

Background
In 2015, a single virtual contact centre steering group was set up for the top 20 highest volume transactions (identified through internal research), to improve consistency, resilience and efficiency in the customer service we provide.
Part of the remit of the contact centre was to gather data about the reasons for customer contact, to enable better understanding of the demand on services, to inform both continuous service improvement, and to support the CFDA programme in prioritising appropriate, high volume transaction processes to be streamlined and digitised.
Currently five services who deliver the top twenty highest volume transactions (Revenues, Benefits, Housing Needs, Housing Management and Cityclean) are recording this information, with Parking services beginning to record in 2016/17.
The average rate of recording is around 50% of calls, so isn’t a complete picture of the organisation’s telephone contact, but gives a broad overview of why our customers are contacting us. These are the results from February 2016 where the total volume of calls against which a specific reason for contact was recorded was 7630 calls.
Key findings
• As the Environment Contact Hub, Cityclean also take calls on behalf of the Parking service– specifically around permits for visitors and residents. More than 40% of the calls toCityclean are with regard to parking permits.
By further drilling down into how many of these calls can be resolved by Cityclean staff andhow many have to get transferred to Parking staff, further data collection has shown that75% of these calls are transferred over, causing confusion and frustration for the customer,and an inefficient use of resources for the organisation.
There is now further discovery work ongoing to design a refresher training course forEnvironment contact centre staff, to ensure the majority of queries can be resolved at thefirst point of contact.
• Council Tax’s highest volume enquiries are for reporting a change of address, querying abill or payment schedule and enquiries about court summonses for non-payment of counciltax.
• Housing Benefits main reasons for contact are to chase the progress of a claim, and foradvice on submitting a new claim.
• Housing Management’s highest volume enquiries are about Homemove (Joint HousingRegister) and tenancy issues, as well as receiving a high volume of calls which areintended for other Housing teams.
• Housing Needs high volume contact reason is for Homemove (the Joint Housing Register),more than 50% of calls are about the Homemove process. Housing Needs also have a highvolume of calls from customers who actually wanted a different team or service.
Page 19 of 47

How do our customers contact us?
The average number of phone calls to our ten most contacted services has reduced
by 32% since 2010/11 (61,872pm to 42,232pm).
In the last year, there has been a 5% reduction in incoming phone calls.
Of the 5 most visited transactional services (including Benefits, Development Control, Housing Management, Parking and Revenues) there has been a 49% reduction in face to face contact from
2010/11. (18,050pm to 9,222pm)
www.brighton-hove.gov.uk had 4,477,746 visits in 2015/16, making us the 2nd most visited unitary authority website, and the
most visited in the south east region.
All services reporting data have received increased volumes of online forms since
2015/16, by at least 15%. Particular increases have been seen in Council Tax,
Registrars and Parking.
There has been an overall reduction in incoming contact by post since 2014/15,
in some cases by up to 40%. This is likely to be due to take up of the council’s digital
services and the move towards more digital communication in general.
As of May 2016, we had 35,607 followers on Twitter (@BrightonHoveCC ),
5,116 likes on Facebook and 379 subscribers and 253,835 views on
YouTube.
Page 20 of 47

What methods do our customers use to get in touch? We currently monitor a range of different methods of customer contact across our transactional services. These include by phone, online, in person, email, social media and post.
All counts detailed are the average number of contacts per month.
Switchboard, receptions & customer service centres (CSC)
• 13% decrease overall in footfall at Civic receptions and Customer Service Centres since2014/15. The most significant decrease here is for the Brighton Customer Service Centre(17%).
• 8% increase in phone calls to Switchboard since 2014/15.
18,956
16,995
20,695
14,231 15,324
-
5,000
10,000
15,000
20,000
25,000
2011/12 2012/13 2013/14 2014/15 2015/16
Switchboard - total phone calls
Page 21 of 47

Customer Service Centre (CSC) & civic reception visitors
4,991
3,764
0 1,000 2,000 3,000 4,000 5,000 6,000 7,000
Brighton TownHall Reception
Kings HouseReception
2011/12
2012/13
2013/14
2014/15
2015/16
5,243
7,614
0 2,000 4,000 6,000 8,000 10,000
CSC BartholomewHouse
CSC HoveTown Hall
2011/12
2012/13
2013/14
2014/15
2015/16
Page 22 of 47

Telephone
Almost all services reporting telephone call volumes in 2014/15 & 2015/16 have recorded a reduction in phone contact this financial year, on average a reduction of 5%.
Accuracy and consistency of phone call volume data has been improved this year, by working closely with our telephony provider to better understand the data available.
Services with the highest call volumes
2,151
5,349
5,553
5,731
4,998
2,539
6,953
4,836
2,782
9,208
0 2,000 4,000 6,000 8,000 10,000 12,000 14,000
AccessPoint
Benefits
DevelopmentControl
Environment
HousingManagement
HousingNeeds
HousingRepairs
Libraries
Parking
Revenues
2011/12
2012/13
2013/14
2014/15
2015/16
In 2015/16 Parking services have changed the way that Penalty Charge Notice enquiries are dealt with, which has affected call volumes.
Revenues, Housing Management and Benefits have amended their reporting method in 2015/16 to more accurately reflect customer contact volumes.
Page 23 of 47

Services with lower call volumes
152
1,056
361
757
208
408
417
44
348
237
960
1,057
300
783
1,551
1,114
996
373
569
0 200 400 600 800 1000 1200 1400 1600 1800
AnimalWelfare
BlueBadge
Children's Centres
ConcessionaryTravel
Credit Control(Housing Needs)
EnvironmentalProtection
FamilyInformation
Service
Food Safety
Fostering& Adoption
Housing Adaptations
MASH(Children's Social
Services)
Museums
PestControl
Private SectorHousing
RegisterOffice
SchoolAdmissions
TemporaryAccommodation
Transport(Highways
Enforcement)
VisitorInfo
2011/12
2012/13
2013/14
2014/15
2015/16
Page 24 of 47

Calls answered & unanswered
The overall percentage of unanswered calls has increased amongst services reporting this data in both 2014/15 & 2015/16 from 16% to 17%, however it should be noted that in some cases, this is an integral part of the service’s channel shift strategy – whilst customers are in a phone queue, they will hear a recorded message directing them to online services, therefore they may abandon their call before getting through to an advisor.
Services with high call volumes
4,226
6,471
5,137
4,869
4,756
6,953
3,504
15,324
5,751
1,124
2,120
594
684
242
159
1,332
1,424
920
0 2,000 4,000 6,000 8,000 10,000 12,000 14,000 16,000 18,000
Benefits
CouncilTax
Cityclean
DevelopmentControl
HousingManagement
HousingRepairs
Libraries
Mainswitchboard
ParkingServices
Callsanswered
Callsunanswered
Page 25 of 47

Services with lower call volumes
Note: Not all services are able to report unanswered calls as their lines are not yet on the system that can provide this information.
1,770
879
588
757
179
399
1,308
230
1,826
943
375
1,108
960
807
514
381
177
30
78
29
18
119
7
882
114
8
443
154
189
55
0 200 400 600 800 1,000 1,200 1,400 1,600 1,800 2,000
AccessPoint
Blue BadgeTeam
BusinessRates
ConcessionaryTravel
Credit Control
FamilyInformation
Service
ElectoralServices
HousingAdaptations
HousingNeeds
Museums
Private SectorHousing
RegisterOffice
SchoolAdmissions
TemporaryAccommodation
VisitorInformation
Calls answered
Calls unanswered
Page 26 of 47

Visitors
All services that have reported this information in both 2014/15 & 2015/16 have reported a reduction in face to face visits from customers, this does however include cultural services such as Libraries and Museums, for who increased footfall is positive.
Footfall at higher volume services
Page 27 of 47
Case Study
Housing Management have seen a 50% decrease in face to face visitors since 2011/12 from an
average of 3,310 customers a month to 1,164 in 2015/16, which can mainly be attributed to the
closure of cash taking offices during this time. Despite this reduction in the range of methods by
which rent payments can be made, due to proactive customer engagement, there has been no
detrimental impact on rent collection or tenant arrears. Even with recent reductions to Housing
Benefit entitlement for many households, tenant arrears have reduced by an average of 28%
since April 2014.

Footfall at lower volume services
Footfall at not exclusively transactional services
178
473
198
30
471
16
68
0 100 200 300 400 500
Blue badge
ConcessionaryTravel
DevelopmentControl
Family InformationService
HackneyCarriage Licensing
MASH(Multi Agency
Safeguarding Hub)
Regulatory services(includes Trading Standards,
Food Safety, AnimalWelfare,…
2011/12
2012/13
2013/14
2014/15
2015/16
124,875
44,460
0 20,000 40,000 60,000 80,000 100,000 120,000 140,000 160,000
Libraries
Museums
2011/12
2012/13
2013/14
2014/15
2015/16
Page 28 of 47

Emails
Services such as Revenues & Benefits who have made many transactions available through online forms have reported significant reductions in unstructured emails. Services that have recently moved away from more paper-based processes, such as Electoral Services are receiving increased contact via email.
Services with high volumes of email correspondence
2,575
1,249
1,172
1,012
1,268
5,421
2,940
0 1,000 2,000 3,000 4,000 5,000 6,000
AccessPoint
Benefits
Environment
EnvironmentalProtection,
Health & Licensing
DevelopmentControl
ParkingServices
Revenues
2011/12
2012/13
2013/14
2014/15
2015/16
Parking services are now reporting all emails to the service through all inboxes, unlike in previous years.
Page 29 of 47

Services with lower email volumes
134
884
454
220
432
353
314
256
840
809
758
554
227
695
0 200 400 600 800 1000 1200
ConcessionaryTravel
ElectoralServices
Family InformationService
Fostering& Adoption
Hackney CarriageLicensing
Housing Advice
HousingManagement
Libraries
MASH
Museums
Register Office
SchoolAdmissions
Transport(Highway enforcement)
Visitor Information
2011/12
2012/13
2013/14
2014/15
2015/16
Page 30 of 47

Contacts by post
There has been an overall reduction in incoming contact by post since 2014/15, in some cases by up to 40%.
Case Study
The Concessionary Travel team (processing applications for bus passes for older and disabled people), for the first time this year, have offered the facility for customers to apply for their passes online, rather than only in person or by post.
6500 letters were sent out on 31st December 2015 to customers whose bus passes needed renewing. Of these, so far, 4288 applications have been returned, 60% of which have been submitted online, despite the customer having to retype the web link from the physical letter. This means that in future years, these customers can be contacted electronically to renew their passes, saving the council £1,183 in envelopes alone and saving the customer at least the cost of postage or the journey to our offices.
11,214
546
131
124
1,623
188
372
4,864
52
0 2,000 4,000 6,000 8,000 10,000 12,000 14,000 16,000
Benefits
DevelopmentControl
HousingManagement
Museum
ParkingServices
Register Office
RegulatoryServices
Revenues
SchoolAdmissions
2011/12
2012/13
2013/14
2014/15
2015/16
Parking have reported increased post since 2014/15, largely due to the introduction of a new Parking Zone, therefore have seen increased enquiries and applications through all channels, despite higher take up of online services overall.
Page 31 of 47

Online transactions
All services reporting data in both 2014/15 and 2015/16 have reported significant increases in web forms submissions, in particular Council Tax, Parking and the Register Office.
Note: Midway through 2015/16, the platform, and therefore the reporting method for online forms has been upgraded, this may mean that there are discrepancies in the figures available.
79
784
12
3,438
2,573
1,503
4,931
75
13
613
4,774
63
2,511
760
218
225
- 1,000 2,000 3,000 4,000 5,000 6,000
AccessPoint
Benefits
Blue Badge
Council tax
Concessionary Travel(Bus Passes)
DevelopmentControl
Environment
Family InformationService
Fostering &Adoption
HousingManagement
ParkingServices
Private SectorHousing
RegisterOffice
SchoolAdmissions
HighwaysEnforcement
Transport
2012/13
2013/14
2014/15
2015/16
Page 32 of 47

Web page views
Schools admissions and Housing Management have both reported a 25% increase in web page views since 2014/15.
Electoral services have received four times the number of page views in this year (Individual voter registration was introduced), when compared with last year in which a general election was held, and the Environment pages have reported a reduction in views since 2014/15 when there was industrial action taken which affected refuse and recycling collections.
These both reflect the way the website is visited to get information on a particular incident or unusual event, and highlights the importance of these pages being regularly updated, especially at such times.
Service pages with more than 6,000 views per month
11,693
146,603
24,690
7,738
8,501
26,648
47,614
24,287
7,382
16,906
0 20,000 40,000 60,000 80,000 100,000 120,000 140,000 160,000
SchoolsAdmissions
Parking &Transport
HousingManagement
Family InformationService
Environment
ElectoralServices
DevelopmentControl
Council Tax
BereavementServices
Benefits
2014/15
2015/16
Page 33 of 47

Summary of online activity This section presents data and information relating to Brighton & Hove City Council’s online presence in 2015/16.
Website usage
• www.brighton-hove.gov.uk had 4,477,746 visits.• This is up from 4,219,585 visits the previous year (1 April 2014 to 31 March 2015).• We had 54% returning visitors and 46% new visitors.
What our website visitors are most interested in
1. Planning2. Jobs3. Car parks4. Parking & parking permits5. Contact the council6. Recycling centres7. Elections8. School holiday & term dates9. Libraries10. Council Tax
How people find the website
• Search – 71% (mostly Google – was 70% previous year)• Direct (bookmark or typed in URL) – 14% (was 11% previous year)• Referral (links from other sites) – 13% (was 17% previous year)• Social sharing – 2% (was 1.5% previous year)
What devices people use to access the website
• Desktop – 51% (previous year was 58%)• Mobile – 34% (previous year was 26%)• Tablet – 15% (previous year was 16%)
SOCITM Better Connected 2015 – a snapshot of all local authority websites
Every year our website is ranked against 415 other local authority websites. In 2015 we were ranked:
• 15th nationally by usage (new entry in the top 20)• 10th nationally by share of the population (up 7 places from previous year)• 2nd most visited English unitary authority website• 1st most visited website in the south east.
Page 34 of 47

Social media
As of May 2016, we had: • 35,607 followers on Twitter (main account @BrightonHoveCC )• 5,116 likes on Facebook.• 379 subscribers and 253,835 views on YouTube
From 1 April 2015 to 31 March 2016 we: • sent out 3,992 tweets• gained 9,415 followers• had 98,584 visitors to our Twitter profile page, and• had 11,546 mentions.
Page 35 of 47

Comments from services This section outlines information provided by the services who deliver the top twenty highest volume transactions, regarding the customer service they provide.
Housing Customer Services
“We reviewed our procedures for managing Discretionary gardening and decorating schemes. The review focused on channel shift and a lean review to remove waste from our processes. We made the process paperless by moving the form on-line and stopped requesting paper proofs from applicants. Savings are in officer time to process the applications and postal costs, as well as reducing the requirements on the customer.”
Revenues & Benefits
Revenues and Benefits have been working very closely with CFDA (Customer First in a Digital Age) to make their online or self service offer to customers as effective as possible. By using the information provided by collecting the reasons for customer contact, they have been able to prioritise the processes or transactions which have the highest customer demand and work on streamlining and improving these to have the highest impact on customer contact volumes, freeing up staff time to assist customers with those complex interactions which aren’t well suited to self service. In 2015/16, the service has introduced online direct debit set up (where previously this would have required a phone call and the completion and return of a paper form), an online form for customers to fill in when moving into the area which is now integrated with the back office processing system, saving officer time in rekeying information from an email, as well as considerably shortening the length of time a customer has to wait for their bill.
Parking
Parking Permit Centre
“From 1 June 2016 The Parking Information Centre becomes The Parking Permit Centre. In the last financial year the Parking Information Centre issued approximately 37,340 permits over the counter this has risen 10% compared to permits sold over the counter the previous year due to the extension of parking zones. In order to provide a quicker and more beneficial service the parking information centre has become the parking permit centre dealing in all types of permits for parking. It is felt that this will reduce the waiting time for customers wanting to obtain a permit. For customers paying by cheque or postal order there is a drop box to avoiding queuing. The next phase is to progress with the development of an on-line permit renewal system. A drop box will be in place in the centre for people who just want to drop in their parking appeals, this will save the customer time queuing.”
Penalty Charge Notice Appeals
“We are now responding to up to 62% of online Penalty Charge Notice appeals by e-mail, this makes the appeal process quicker and more convenient for the customer. By sending informal representations by e-mail decreases back office processing cost of stationary, printing and postage and scanning costs, saving the council an estimated £6,400 per year in postage and envelope costs alone. We also suggest that evidence is now sent by e-mail rather than by post for
Page 36 of 47

a quicker response. A drop box will be in place in the permit centre for people who just want to drop in their appeals, this will save the customer time queuing. In the last financial year 2015/16, over 165 cases were contested at the Traffic Penalty Tribunal. From the 14 March 2016 Brighton and Hove City Council became a pilot authority for the introduction of a new online portal to make appeals to the adjudicator online. This has made the process of transferring the process of transferring information simpler for both the driver and the council.“
Housing Needs
“During the trial phase of the service redesign within Housing Needs (encompassing Housing Advice, Homemove and Housing Options) we have operated an expanded advice service and broadened their scope. This has had the following outcomes:
By taking over Homemove’s phone service we have allowed them the time to clear their long-running backlog of applications and submitted evidence. This has lead to much swifter assessments and has the side-effect of reducing low-value contacts from clients, who otherwise would be calling or attending drop-in regularly purely to ask how their assessment is progressing. This can be seen by the overall reduction in contacts.
• Drop-In contacts per month: Oct 2015 – 934, Feb 2016 – 733• Phone calls to advice line per month: Oct 2015 – 1800, Feb 2016 – 1395
The advice service has also been offering a drop-in service for Homemove related queries (which was not offered previously) and this has contributed to the fall in contacts, as we have been able to deal with issues there and then, resulting in a better use of officer resource and a swifter service for customers.
By expanding the advice service’s remit to include straight-forward decision letters following applications for homeless assistance, this has taken some of the burden from Housing Options and allowed them to focus on the more complex cases, which necessitate their skills. Over this period the number of homeless applications undertaken by the advice service has equated to up to 29% of all decisions in a particular month.”
Cityclean
“Cityclean are working with the CFDA (Customer First in a Digital Age) team to improve both our processes and systems. There has already been a great deal of work which has resulted in a new version of our Achieve system which was rolled out to the contact centre team last week. This new version is faster which should help us to reduce the time taken over each call, and the number of abandoned calls, both of which will improve our customer experience.”
Page 37 of 47

How do we use customer complaints and compliments to improve services?
Overall, there has been a 20% decrease in
complaints, from 1955 in 2014/15 to 1588 in
2015/16
Similarly there has been a 20% increase in reported compliments, from 648 in
2014/15 to 778, in 2015/16.
Compared to 2014/15 there have been:
• 94 fewer complaints aboutrefuse collection (135 to 41)
• 40 fewer complaints aboutrecycling collection (71 to31)
• 31 fewer complaints aboutdelays in repairs (94 to 63)
The top three types of compliments we receive are about how customer
focussed we are (219 compliments), the
personal qualities of the staff (133) and how good our processes are (114).
Page 38 of 47

What feedback have we received?
Complaints
The number of complaints about council services received in 2015/16 has reduced by 20% compared to 2014/15 and 15% compared to 2013/14. Results for the last three years are:
Year Number of complaints Change on previous year
2015/16 1563 392 decrease 2014/15 1955 107 increase 2013/14 1848 202 increase
The services which have had the greatest impact in reducing complaint levels between 2013/14 and 2015/16 are:
Service Percentage Reduction Numerical Reduction
Cityclean 35% 149 Housing Services 20% 29 Revenues & Benefits 15% 27 Repairs & Maintenance 10% 26
See the next page for a year on year look at complaint numbers by service area.
Page 39 of 47

The chart below shows how complaint levels have changed for those services.
24
7
105
117
273
116
113
218
82
173
156
24
39
22
0 50 100 150 200 250 300 350 400 450 500
Sports &Leisure
Tourism &Venues
Adult SocialCare
Children'sServices
Cityclean
HousingServices
HousingNeeds
Repairs &Maintenance
Highways
Parking
Revenues &Benefits
Life Events
DevelopmentControl
EnvironmentalHealth/Licensing
Complaints Received
2013/14
2014/15
2015/16
Page 40 of 47
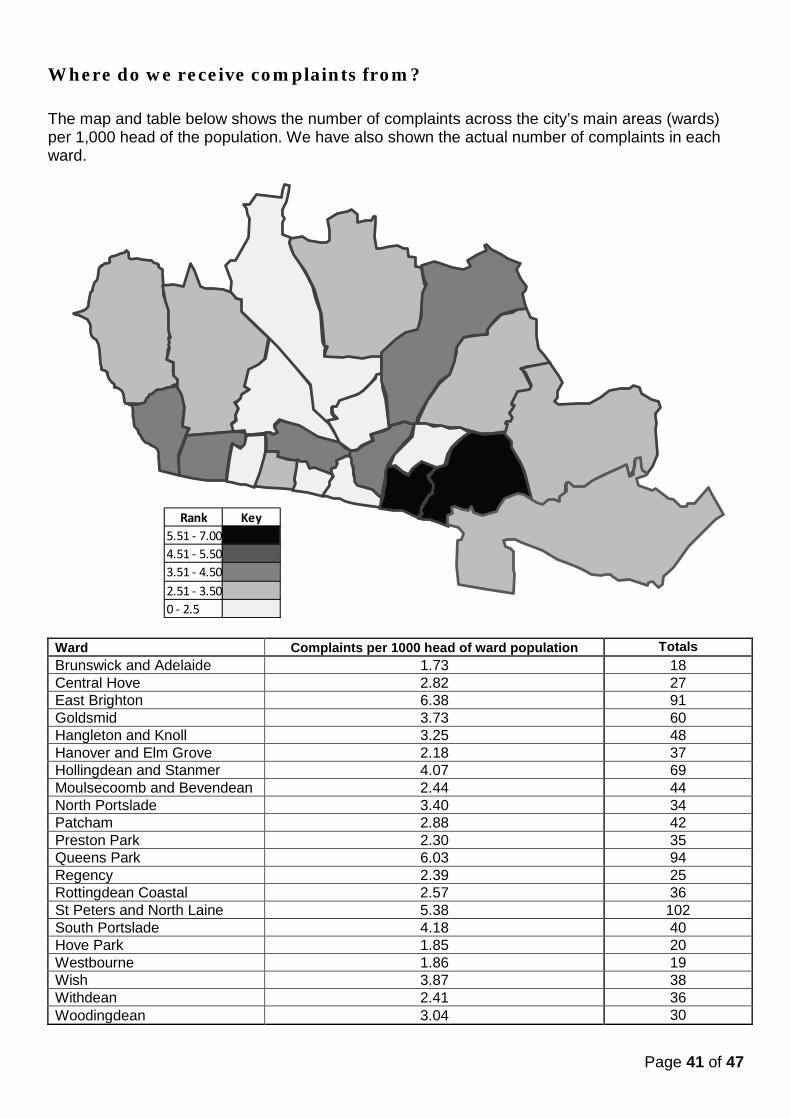
Where do we receive complaints from?
The map and table below shows the number of complaints across the city’s main areas (wards) per 1,000 head of the population. We have also shown the actual number of complaints in each ward.
Ward Complaints per 1000 head of ward population Totals Brunswick and Adelaide 1.73 18 Central Hove 2.82 27 East Brighton 6.38 91 Goldsmid 3.73 60 Hangleton and Knoll 3.25 48 Hanover and Elm Grove 2.18 37 Hollingdean and Stanmer 4.07 69 Moulsecoomb and Bevendean 2.44 44 North Portslade 3.40 34 Patcham 2.88 42 Preston Park 2.30 35 Queens Park 6.03 94 Regency 2.39 25 Rottingdean Coastal 2.57 36 St Peters and North Laine 5.38 102 South Portslade 4.18 40 Hove Park 1.85 20 Westbourne 1.86 19 Wish 3.87 38 Withdean 2.41 36 Woodingdean 3.04 30
Rank Key5.51 - 7.004.51 - 5.503.51 - 4.502.51 - 3.500 - 2.5
Page 41 of 47

The most frequently raised types of complaint include:
• East Brighton – responsive and planned housing repairs (40 complaints) and theNeighbourhood team (7 complaints)
• Queens Park – responsive housing repairs (22 complaints)• St Peter & North Laine – parking management (10 complaints), refuse and street cleaning
(18 complaints)
How is feedback from complaints being used?
Cityclean
The main issue of complaint for City Clean is missed collections.
• The service has been operating a continuous review to understand the cause of missedcollections. They have found that when close attention can be paid to checking, remindingcrews and communicating with them the numbers and associated complaints of missedcollections can be dramatically reduced. However, this requires a lot of staff resources.
• To make this easier Cityclean are working on their processes and systems with theCustomer First in a Digital Age team to sustain improvements for our customers. One aimof the project is to use mobile technology linked to GPS; crews will have tablets in the caband input information about any missed collections, with the reasons why, while they are atthe location. This information will be immediately available online for the customer and thecontact centre and will enable quicker resolution of problems.
• This may take some time to bring into practice. Therefore as an interim measure CFDA aredeveloping a process for team leaders and charge hands to use electronic forms and “fixmy street” via their work mobiles to receive alerts of problems within real time and respondif nearby rather than returning to the depot and being asked to revisit.
Housing Services
The main issues of complaint in Housing Services are about gardens, low level Anti-Social Behaviour, unmanaged car parks and a lack of action.
• Neighbourhood Teams are inspecting gardens, talking to residents and advising them onwhat to do, supporting them and also applying sanctions, or referring some to thediscretionary gardening scheme.
• Housing are encouraging residents to report more instances of ASB and are encouragingneighbourliness. This is resulting in more Neighbourhood Team and Tenancy EnforcementOfficer visits to ensure people are aware of tenancy conditions and consequences ofescalation. These officers are promoting the use of mediation.
• Area Panels and Housing Committee have agreed a programme of managing Housing carparks, working with residents to find solutions to local parking problems.
• Housing Services are striving to improve response times to address the perception of a lackof action. Response times will depend on the issue, some things such as ASB can takelonger than a resident might expect.
Page 42 of 47

• As part of the drive to improve communications, Housing Services will provide much moreinformation to customers using the Housing pages of the council website to resolve issuesthere and then. Access to web based information will enable Housing Customer ServiceTeam members to assist customers and help to resolve 80% of enquiries at first point ofcontact.
• Since April 2015 HCST have sent more than 20,000 text messages to customers. This hasimproved the speed of passing on urgent/necessary information.
Revenues & Benefits
The main issue of complaint is that customers feel legal action to recover debt is unwarranted
• In October/November we started using an external trace and collect company who werechasing £5.1million of old debt. This is all now dealt with, but a high level of complaintscame from that action.
• A Revenues and Benefits telephone hub was established in November. Extended openinghours have been introduced and the Council Tax and Benefits teams are sat next to eachother to encourage immediate resolution of cross services issues rather than the customerhaving to call back and speak to another team. Call waiting times have significantlyimproved.
• On line forms are being made available over the next months including moving forms and,next financial year, bills will be available on line. Users of the digital service areautomatically being asked about their experience and are actively being asked to commenton any areas that have not run smoothly so that any issues can be dealt with.
Repairs and Maintenance
The main issue of complaint is delay in carrying out repairs.
• Repairs and Maintenance are developing an improved communication strategy so thatcustomers are given a more responsive personal service and are kept clearly informed ofwhat is happening with regard to response repairs.
• The service has recognised from complaints over recent years that they need to improvetheir communications around what works are planned and when. To address this they haveimproved the information on their website about building programmes in the form of aninteractive map that residents can use to see what works are planned in their area over thenext three years.
• There are regular “Tool Box Talk” for all operatives and contractors which provide refreshertraining and are centred on providing a better customer service. Examples of these includea review of scaffolding and parking arrangements for contractors.
Page 43 of 47

Compliments
The number of compliments about council services recorded in 2015/16 has increased by 20% compared to 2014/15 and 35% compared to 2013/14. Results for the last three years are:
Year Number of Compliments Change on previous year
2015/16 780 132 increase
2014/15 648 74 increase
2013/14 574 195 increase
780 Compliments
655 Compliments from members of the public
Customer Focused 219 Personal Qualities 133 Good Process 114 Quality of Outcome 109 Quality of Input 48
125 Compliments from internal customers and external professionals
Quality of Input 37 Good Process 31 Personal Qualities 29 Customer Focused 17 Quality of Outcome 11
25
34
226
53
23
27
32
133
58
19
21
35
2
21
0 50 100 150 200 250 300
Sports & Leisure
Tourism & Venues
ASC
Children's Services
City Clean
Housing Services
Housing Needs
Repairs & Maintenance
Highways
Parking
Benefits & Revenues
Life Events
Development Control
Number of compliments
Compliments
2013/14
2014/15
2015/16
Page 44 of 47
Environmental Health & Licencing

The following are examples of some of the compliments we have received:
“I had an appointment this week with XXX as part of her duty planning officer role. Her
calm demeanour, clarity and professionalism helped my client. My client has mental health concerns and the man, XXXXX, who took the duty call made every effort to ensure that my client was not discriminated against. Whilst
we all hope for outstanding customer service an awareness of disabilities and the
equalities act is something my clients often have to fight for. To have this high level of
service has such a massive positive influence in a number of ways when people have been discriminated against and need
the involvement of your team to support them. So I thought I would email as the service has been of such a high level.”
I wanted to mail you today to underline whilst it is fresh in my mind to express my gratitude for the constructive and helpful manner with which you have engaged with me on this project and helped considerably move the design of the scheme forward since we were first commissioned in the dying days of the last application. Bringing a piece of Miami to Kemptown was never going to be easy and as ever Social Media is hot today with locals overjoyed by the outcome. Yesterday of course we witnessed the pure drama of a Planning Committee. BHCC is the only one I ever attend that allows questions of the speakers by the way which is a good thing in the quest for truth and fact. Most of my client side were watching on screens from several destinations world-wide - feedback: 'edge of the seat' stuff. It truly was dramatic and yet all included on this mail trail remained cool, rational and professional throughout. Finally I wanted to take this opportunity to
say a huge thank you to you and your team for all your hard work, perseverance, and patience with this issue. I can honestly say that I have had nothing but a positive experience every time I have had dealings with the council in this issue. I have found every individual and department I have come into contact with to be extremely helpful, friendly, transparent, highly responsive, and very professional. I can honestly say that the service I have received is exemplary and I will be writing a letter of praise to the leader of the council, and the acting Chief Executive accordingly, naming particular individuals such as yourself, xxxxxx, and others, that have stood out. Once again, thank you for all your hard work.
Thank whoever is responsible for the wonderful lawns of wild flowers at Preston Park. A joy to walk through. In fact in recent years in Brighton there have been many lovely banks of wild flowers. Many thanks to all your gardeners and volunteer helpers, it was worth all the time and trouble they took. Please pass on our regards, we will return to Brighton again at a later date.
Page 45 of 47

Next steps
Improving customer satisfaction
- Working on our customer promise to set measurable standards for customer service delivery.
- Taking part in the annual Institute of Customer Services survey, in order to improve understanding of our customer service performance against other Local Government agencies and against the commercial sector, including benchmarking and channel by channel satisfaction questions.
- Promoting the Customer Service Excellence Quality Mark and the Institute of Customer Service qualifications as externally recognised standards of performance in customer service delivery.
- Supporting services in ensuring that they maximise the investment in their online services, to advise on changing working practices, channel shift strategy and change management to actively encourage customers to use online services.
- Working with the Institute of Customer Service to improve the 2016/17 report.
Improving data quality
- Improving our understanding of the telephone reporting system to ensure higher quality and greater consistency in our telephone data, using the Avaya Customer Management System, to include specifying which reports should be run to gather comparable data, and to recommend that where teams have a public phone line, this is set up with the Avaya supervisors program to enable regular, consistent monitoring and reporting.
- Assisting services in identifying a statistically valid number of survey respondents to enable more robust, detailed analysis and confidence in using the data for performance and equalities monitoring.
- Including in the performance indicators that support our Customer Promise, the reporting of the total number of positive responses to survey questions (including the ‘good’ and ‘easy responses in addition to the ‘very good’ and ‘very easy’ responses) as well as the number of respondents and any equalities information gathered.
- Working with the relevant internal teams and external suppliers to improve quality of and ease of access to, data on online form submissions.
- Including more teams in this report in future years, as the organisation moves through to its latest phase of Workstyles and implements improvements in technological infrastructure.
Page 46 of 47

This and previous year’s reports are published on our website:
www.brighton-hove.gov.uk/customerinsightreport
For any queries, suggestions or further information, please contact:
Customer Insight Manager Performance, Improvements & Programmes 01273 291805
Page 47 of 47


