Page 1
TAF Journal of Administrative and Business Studies
2016, 2(4): 189-207 JABS 1
19
Content from this work is copyrighted by TAF Publishing, which permits restricted commercial use, distribution and reproduction in any medium under a written permission. Users may print articles for educational and research uses only, provided the original author and source are credited. Any further utilization of this work must maintain attribution to the author(s), the title of the work and journal citation in the form of a proper scientific referencing.
PRIMARY RESEARCH
Brand equity analysis and its impact on the loyal
customer of local batik to develop its competitiveness
(An empirical study of batik Banten in south
tangerang)
Nila Krisnawati 1, * , Loina K Perangin-angin 2 , Munawaroh Zainal 3 , Imelda Suardi 4
1,2,3,4 Swiss German University, Tangerang, Indonesia
Abstract. Batik industry has been growing well since the enclosure of batik by UNESCO
(United Nations Education, Scientific and Cultural Organization) in "Intangible Cultural
Heritage of Humanity" items on September 30, 2009. However, much local batik in
Indonesia do not concern about their brand and leave them far away behind the superior
brand of existing batik in the market, including Batik Banten. This study was carried out in
Tangerang focusing on the brand of Batik Banten. This study aims to determine the effect
of brand awareness, brand association, perceived quality, brand loyalty and uniqueness
towards customer’s loyalty. The study is also to identify the brand existence of Batik
Banten through analyzing its strengths, weaknesses, opportunity and threat. The 203
respondents were the batik lovers in Tangerang and their data were collected by using
survey method. The Regression Analysis was used in this study with the aim to prove the
hypothesis of the influence of variables Brand Awareness (X1), Brand Association (X2),
Perceived Quality (X3), Brand Loyalty, and Uniqueness (X4) that are partially or jointly
against Consumer Loyalty (Y). Results of regression calculation show that the value of
Adjusted R Square is 0.211. The remaining 79,1% was influenced by other variables which
are not examined in the research. The study also provides a contribution to the better
strategy implementation to Batik Banten owner and local government to increase the
brand equity of Batik Banten towards consumers’ loyalty.
©2016TAF Publishing. All rights reserved.
INTRODUCTION
Batik industry has been growing well since the enclosure
of batik by UNESCO (United Nations Education, Scientific
and Cultural Organization) in "Intangible Cultural Heritage
of Humanity" items on September 30, 2009. It is also
* Corresponding author: Nila Krisnawati E-mail: [email protected]
followed by the enthusiasm of Indonesian people to wear
batik as a part of their life style including the effort from
the government to ask the officers and staff to wear batik
as a policy. UNESCO describes Indonesian Batik as; the
techniques, symbolism and culture surrounding hand-
dyed cotton and silk garments known as Indonesian Batik
that permeates the lives of Indonesians from beginning to
end: infants are carried in batik slings decorated with
Keywords: Brand awareness Brand association Perceived quality Brand loyalty Uniqueness and customer’s loyalty
Received: 2 April 2016 Accepted: 18 June 2016 Published: 12 August 2016
Page 2
190 N. Krisnawati, L.K. Perangin-angin, M.Zainal, I. Saurdi – Brand equity analysis and its impact on the … 2016
ISSN: 2414-309X DOI:10.20474/jabs-2.4.5 TAF
Publishing
symbols designed to bring the child luck, and the dead are
shrouded in funerary batik (www.antaranews.com, 2011).
As one subsector in creative industry, batik development
can be seen from value of exports and batik production
continues to increase overtime.
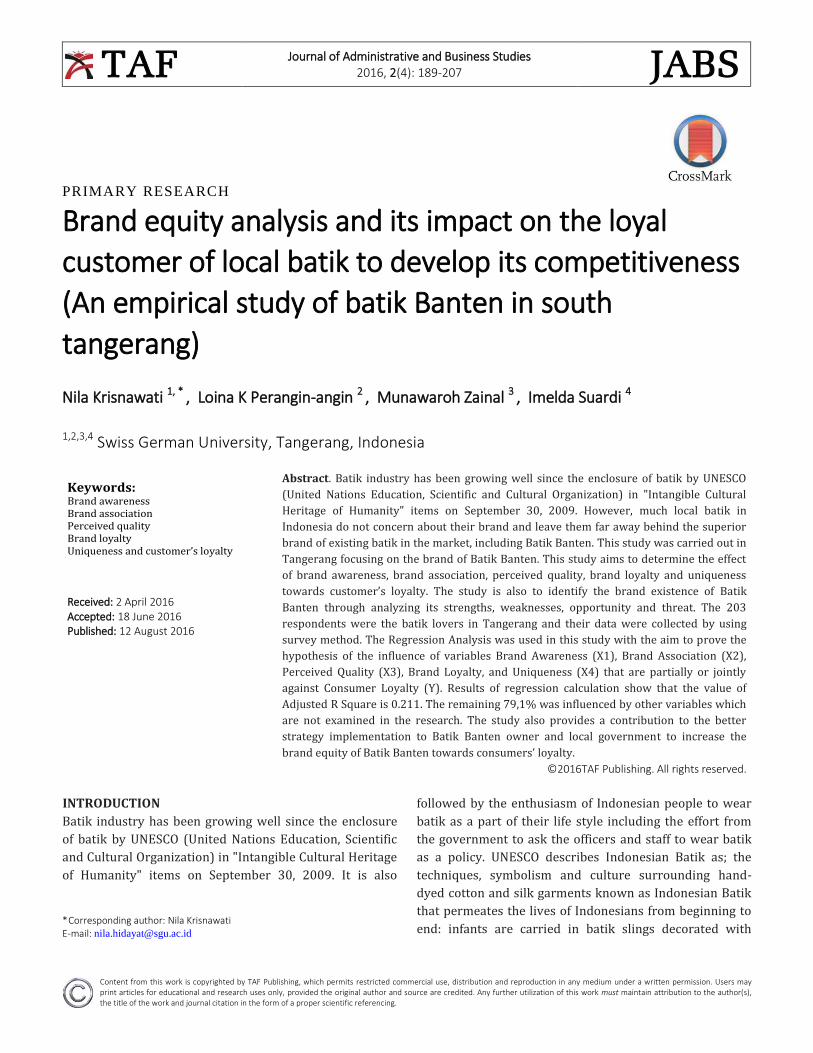
FIGURE 1. Batik industry growths in Indonesia
From the figure 1, it can be described that there was a
significant growth from 1990 up to 2002. This high
industry value is seen from the value of Rp.100 Billion to
Rp.200 billion. In 1999, the Indonesian batik growth
reached Rp.94.502.423 and in 2000 reached
Rp.100.830.719. In 2001 reached Rp.196.326.256, while in
2002 the batik growth reached Rp.201.778.942. It can be
said that the batik development increased in subsequent
years.
Based on online news from Tempo.co.id in June 2015, it
was reported as well that The United States has become
the main export destination for Indonesian Batik with 37
percent of the total export market share. Indonesia has
also exported batik to South Korea, Japan, Germany, the
United Kingdom and the Netherlands. In 2010, the total
value of Batik export had reached US$22 million while in
2014, the number increased by 154 percent to US$340
million. Batik is a highly potential commodity. In the
January-April 2015 period, the export figure was positive,
reaching up to US$81.8 million. Based on the government's
target to increase export value to 300 percent within the
next five years, the Trade Ministry has set US$1.5 billion
for batik export in 2019.
However, we found other fact that the import of Batik
until April 2015 showed increase. For that reason, The
Ministry of Trade tightened the import of textiles and
textile products (TPT) of batik. Batik due to increased
importation of such products, reached 24.1 percent in the
period of January to April 2015. The period before was 28
billion US dollar. The labor absorption of the sector is able
to employ approximately 1.3 million people. In terms of
consumption, sales reached Rp5.9 trillion, with the
number of consumers reached 110 million people. The
government had delivered the decree to protect the local
batik from the import attack including batik motif through
The Ministry Decree No. 53 / M - DAG / PER / 7/2015 on
imports of textiles and textile products (TPT). In these
regulations, commodities are regulated for a fabric sheet,
apparel batik and batik with limits of at least two colors,
where every company that will do the imports of textile
batik and textile motif must have the determination as a
Registered Importer (IT) of textile batik and the motif
(antara news.com, 2014). In regard with the growth of
Batik, there are many well-known batik varieties in
Indonesia as described in figure 2.
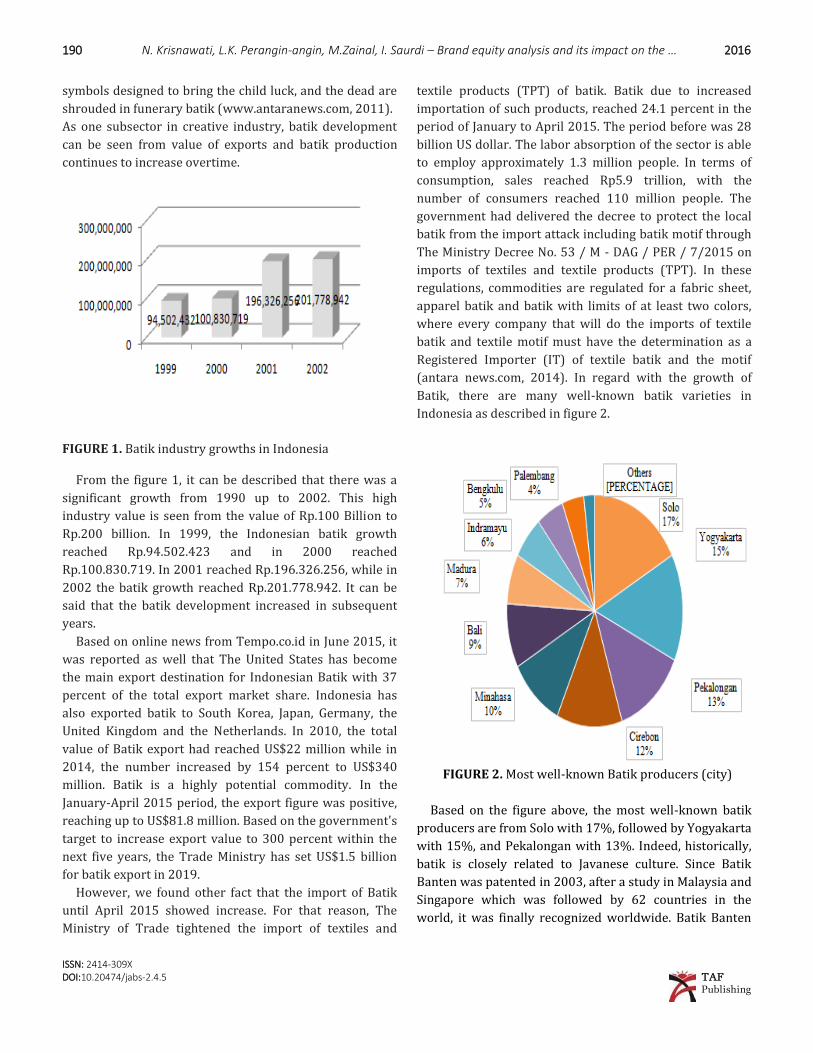
FIGURE 2. Most well-known Batik producers (city)
Based on the figure above, the most well-known batik
producers are from Solo with 17%, followed by Yogyakarta
with 15%, and Pekalongan with 13%. Indeed, historically,
batik is closely related to Javanese culture. Since Batik
Banten was patented in 2003, after a study in Malaysia and
Singapore which was followed by 62 countries in the
world, it was finally recognized worldwide. Batik Banten
Page 3
2016 J. Admin. Bus. Stud. 191
ISSN: 2414-309X DOI:10.20474/jabs-2.4.5 TAF
Publishing
was recognized as one of the best in the entire world
through an international conference in Singapore and
Malaysia. Batik Banten is also the first batik which has
patents in UNESCO. Tangerang Selatan as a one of rising
regencies located nearby Jakarta with batik as their
traditional heritage to develop as a potential source as well
as their district revenue. Their batik, called as Batik
Benteng and Batik SekarPurnama has been growing since
many years ago. The patterns describe attractively
expressing the symbol of the acculturation between
Banten and Tionghoa. However the brand image of their
names is far away behind the superior brand of existing
batik in the market, such as batik Keris, Semar, Danarhadi
or Iwan Tirta. From the focus group discussion, it was also
found that there are only around 30% of local people
interestedin Batik Banten. As the only Batik archipelago
that really has a unique character, Batik Banten is a batik
with first patent motif indicating spirit of Banten. In fact, in
many countries, this batik emerged as winners from 52
countries’ exhibitors in Malaysia in 2005. Banten Batik
prices offered to the market range up to Rp.75,000
millions of rupiah. Most of them are exported to Malaysia,
Finland and Korea. However, the challenge ahead for Batik
Banten is how to increase the awareness of its existence,
including the packaging delivery, developing channel of
distribution and producing its own raw materials which
are taken from the Banten Batik Solo and Pekalongan.
Some efforts have been delivered by Tangerang
government as well as the communities to build the
belonging sense to Batik Benteng and Batik Sekar Purnama
through many events and exhibitions. It is also followed by
the action to boost up the existing brand to the market to
make batik from Tangerang much more competitive
among other existing brands.
The fact above is describing significant gap that even
batik industry is considered potential but some local
brands such as Batik Benteng and Batik Sekar Purnama
from Tangerang are still less competitive. The research is
necessary to be conducted to analyze its brand existence
through its brand equity and the impact on the consumer
loyalty. Based on the phenomena and challenges faced by
local batik industry in Tangerang, it is necessary to help
the Batik Banten to strengthen their brand. The problems
faced by the Batik Banten are that the brand equity of
Batik Banten towards consumer loyalty in Tangerang
Selatan is considered low, the SWOT analysis is not
conducted yet on Batik Banten, and the strategy to
strengthen Batik Banten as the local brand is not
implemented yet, too. Therefore the research is significant
to be conducted. The study aims are to measure the effect
of brand equity of Batik Banten towards consumer loyalty
in the market, to identify the batik industry’s current
condition through Strength Weakness Opportunity and
Threat (SWOT) Analysis and to develop the suitable
strategy on Batik Banten as a local batik brand in
Tangerang Selatan
LITERATURE REVIEW
Creative Industry
The creative industries have been seen currently to
become increasingly important to economic well-being,
proponents suggesting that "human creativity is the
ultimate economic resource," (Florida, 2003) and that “the
industries of the twenty-first century will depend
increasingly on the generation of knowledge through
creativity and innovation," (Landry & Bianchini, 1995).
The creative industries at the worldwide perspective refer
to a range of economic activities concerned with the
generation or exploitation of knowledge and information.
They may variously also be referred to as the cultural
industries especially in Europe (Hesmondhalgh 2002) or
the creative economy (Howkins, 2001). Lash & Urry
(1994) suggest that each of the creative industries has an
'irreducible core' concerned with "the exchange of finance
for rights in intellectual property”.
Creative industries are characterized by seven economic
properties; (Caves, 2000):
1. Nobody knows principle: Demand uncertainty exists
because the consumers' reactions to a product are neither
known beforehand, nor easily understood afterward.
2. Art for art’s sake: Workers care about originality,
technical and professional skill, harmony, etc. of creative
goods and are willing to settle for lower wages than
offered by 'humdrum' jobs.
3. Motley crew principle: For relatively complex creative
products (e.g., films), the production requires diversely
skilled inputs. Each skilled input must be present and
performed at some minimum level to produce a valuable
outcome.
4. Infinite variety: Products are differentiated by quality
and uniqueness; each product is a distinct combination of
inputs leading to infinite variety options (e.g., works of
creative writing, whether poetry, novel, screenplays or
otherwise).
Page 4
192 N. Krisnawati, L.K. Perangin-angin, M.Zainal, I. Saurdi – Brand equity analysis and its impact on the … 2016
ISSN: 2414-309X DOI:10.20474/jabs-2.4.5 TAF
Publishing
5. A list/B list: Skills are vertically differentiated. Artists
are ranked on their skills, originality, and proficiency in
creative processes and/or products. (Samiee, 1994). Small
differences in skills and talent may yield huge differences
in (financial) success.
6. Time flies: When coordinating complex projects with
diversely skilled inputs, time is of the essence.
7. Ars longa: Some creative products have durability
aspects that invoke copyright protection, allowing a
creator or performer to collect rents.
It is concluded that not all creative workers are purely
driven by 'art for art's sake'. The meaning of ‘ars longa'
property also holds for certain noncreative products (i.e.,
licensed products). It is definitely clear that the creative
industries are not unique, but they score generally higher
on these properties relative to non-creative industries.
The Emergence of the Brands
Brands represent enormously valuable pieces of legal
property, capable of influencing consumer behavior, being
bought and sold, and providing the security of sustained
future revenues to their owner. Krake (2005) and Keller
(1993) and some other researchers considered the
performance of brand in two parts including the brand
market performance and brand profitability performance.
They declared that the brand profitability performance is
an index of the financial share of a brand in relation with
the retailing profits and is evaluated using the profit and
the margin of profit while the brand market performance
considers the market demands and evaluates the indices
such as sale levels and market share. Frimpong (2011)
found that consumers in Ghana have a more positive
attitude on foreign apparel brands than the local brands.
Consumers perceived apparel having foreign brand
namesas of superior durability, higher quality, more
attractive, and more stylish, thus they have a higher
tendency to purchase imported apparel.
There is also research on consumers’ shopping
behaviors in Indonesia, which proved that Indonesian
consumers gain higher satisfaction on products with
foreign brand name than the ones with local brand name
(Tunjungsari, 2011). The use of local vs. foreign brand
names is vividly clear in the Batik apparel industry. As a
local product of Indonesia, it is very common that until
today most of Batik apparels have Javanese brand name,
since the term "batik" is derived from Javanese Batik and is
internationally well known as a traditional product of Java
or Indonesia (Hitchcock, 1991).
The Role of Brand Equity
Brand equity is a set of assets and brand reliability
associated with a particular brand, name and or symbols,
which can increase or decrease the value given by a
product or service, both for marketers /companies and
customers (Kotler, 2009). According to Aaker (1997)
brand equity is a multidimensional concept. Aaker
believed that the brand equity is a set of assets, liabilities
of a brand linked to a brand, its name and its symbol that
add to or subtract from the value provided by a product or
service to a firm and/or to that firm’s customers. These
assets are divided into five groups including brand loyalty,
brand awareness, perceived quality, brand associations
and other proprietary brand assets.
There are several ways of understanding of brand equity
that have been proposed by the scientists and researchers
since its emergence. These definitions are generally
classified into two main approaches. First approach
incorporates the definitions having the financial concepts
and the second one consists of the definitions having the
customer-based approaches. Financial approach
concentrates on the estimation of the value of a brand. In
this approach, brand is defined as an asset in the balance
sheet and is estimated for the accounting purposes or for
merger, acquisition or divestiture purposes (Keller,1993).
While the brand equity from the viewpoint of customers
usually incorporates the collected data of the customer’s
mind, feelings and attitudes about a brand, (Kartono, Rao,
2005). Keller (1993) defined the brand equity from the
viewpoint of customers as the differential effect of brand
knowledge on customer’s response to marketing of a
brand. According to his studies, there are three main parts
in this definition including differential effect, brand
knowledge and the customer’s response. The brand
knowledge is also defined based on the brand awareness
and brand image and is conceptualized by the personality
and the brand association links. In addition, customer’s
response to the marketing is defined based on the
customer’s perception, preferences and the behaviors due
to marketing mix activities.
The main advantage of the brand equity is its positive
effect on demand. It is expected that the brand awareness,
brand quality and the brand loyalty cause the increase of
brand market performance. This aspect of brand equity
Page 5
2016 J. Admin. Bus. Stud. 193
ISSN: 2414-309X DOI:10.20474/jabs-2.4.5 TAF
Publishing
helps the organizations attract the customers and keep
them (Baldauf, Cravens & Binder, 2003).
One of the advantages is lower marketing expense. It is
because of the high awareness and loyalty of customer to a
brand. Furthermore, company has strong position for
negotiation to distributor or retailer for selling their
products. Aaker (1997) stated that brand equity
contributes value to customer by enhancing customer’s
interpretation or processing of information, their
confidence in purchasing decision and satisfaction.
Therefore, customer loyalty to a product can be developed.
It also noted that there exit similar interrelationships
among brand equity dimensions. For example, perceived
quality could be influenced by awareness, associations and
by loyalty. In some circumstances it might be useful to
explicitly include other brand equity dimensions’ output as
well as inputs, even though they did not appear previously.
Next, will be the explanation on each dimension of brand
equity.
Brand Loyalty
Brand loyalty reflects customer’s relation with a branded
product. As defined by Oliver (1997), brand loyalty is a
deeply held commitment to rebuy a preferred product or
service consistently in the future. Moreover, according to
Rangkuti (2004), brand loyalty is an essence in brand
equity that becomes central idea in marketing. It measures
the relation between a customer and a brand. If brand
loyalty increases, then customer’s vulnerability from
competitor can be decreased. Therefore, a customer will
have big loyalty for the company.
Brand Awareness
Chandon, Morwitz & Reinartz (2005) have defined brand
awareness as accessibility of the brand in the customer’s
memory. Aaker (1997) stated that brand awareness shows
the ability of future customer to recognize and remember
that a brand is part of certain category. In this case, the
role of brand awareness in brand equity is dependent on
level of awareness of a brand.
Brand Association
Aakar (1991) has defined brand association as anything
linked in the memory of the consumers to a brand. In
1997, Aaker said that association does not only exist, but
also has level of strength. The relation to a brand will be
stronger if based on more experiences or appearance to
communicate it. Customers will remember many
associations that create an image of a brand in their minds.
Brand association gives advantages and plays important
role to process information, differentiate one brand from
another, help customer to decide in buying product or
service, create attitude and positive thinking, and also a
base for brand extension or new product. In this case,
customers will be loyal to a product if they feel that brand
association gives benefits to them.
Perceived Quality
The perceived quality has been defined by Zeithaml (1988)
as consumer’s subjective judgment about a product’s
overall excellence or superiority. According to Aaker
(1997), perceived quality is customers’ perception
towards overall quality or advantage of a product or
service related to their expectation.
There are 5 dimensions of perceived quality according
to Rangkuti (2004) which provide important reason to
buy, influence which brands to choose, advantage for
company to make options in determining the optimum
price, value for retailer in expanding distribution channels
and to launch new product for wider target market.
Consumer Loyalty
Customer loyalty plays a very important role to achieve
competitive advantage and maintain it (Bagram & Khan,
2012). According to Inamullah (2012), Customer loyalty is
the willingness of a consumer to purchase the same
product and keep the same profitable relationship with a
particular company.
Customer loyalty is the key and important competitive
advantage in current market situations (Lin & Wang,
2006). This is very hard to understand as per the mind of
consumer that what will be the key psychological factors
that will make consumer loyal towards a company’s
product (Chen & Hu, 2010).
RESEARCH METHOD
Type and Method of Study
This research will use quantitative research approach.
Quantitative methods are those which are based on
numerical information or quantities, and they are typically
associated with statistical analyses.
Research method that will be used in this study is a
survey method; “a structured questionnaire given to a
sample of a population and designed to elicit specific
information from respondents” (Malhotra, 1999).
Page 6
194 N. Krisnawati, L.K. Perangin-angin, M.Zainal, I. Saurdi – Brand equity analysis and its impact on the … 2016
ISSN: 2414-309X DOI:10.20474/jabs-2.4.5 TAF
Publishing
Unit of Analysis
Unit of analysis for this research is individual, who will be
studied based on their demographics and opinion
regarding the intended variables.
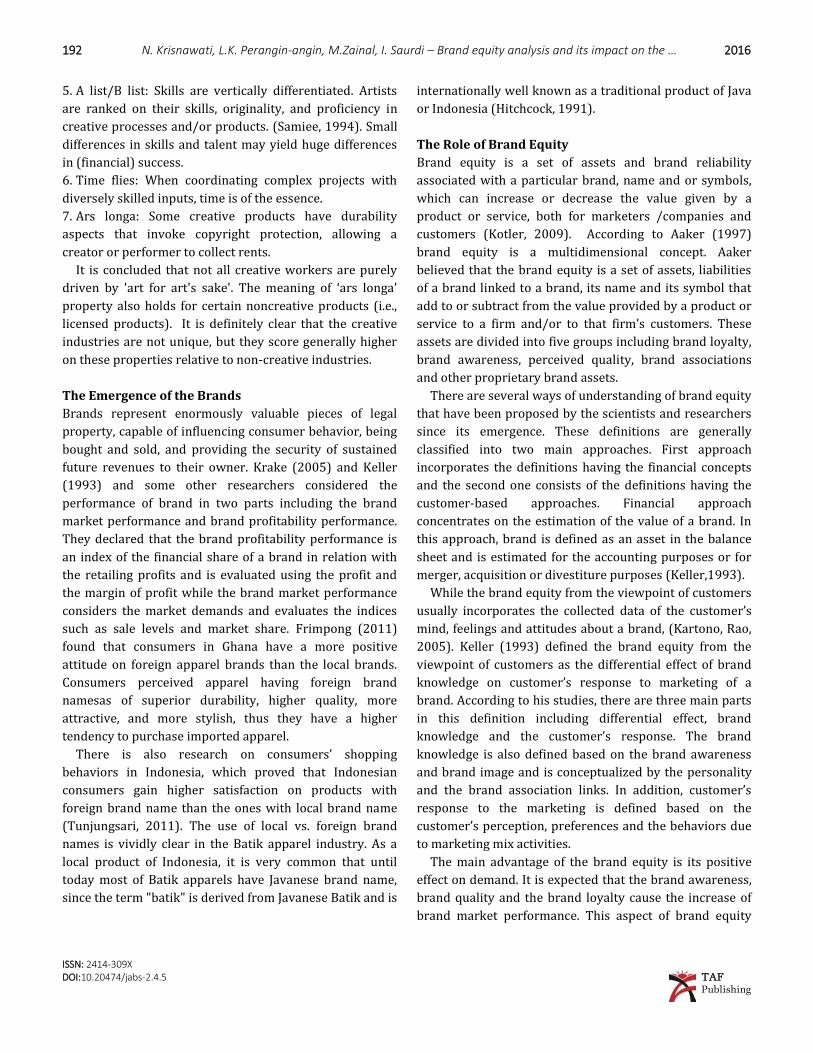
Research Model
FIGURE 3. Brand equity model
The Hypothesis
Hypothesis 1
Ho: 1 ≤ 0 there is no positive and significant influence
of variable Brand Awareness towards Consumer
Loyalty
Ha: 1> 0 there is a positive and significant influence of
variable Brand Awareness towards Consumer
Loyalty
Hypothesis 2
Ho: 1 ≤ 0 There is no positive and significant influence
of variable Brand Association towards Consumer
Loyalty
Ha: 1> 0 There is a positive and significant influence of
variable Brand Association towards Consumer
Loyalty
Hypothesis 3
Ho: 1 ≤ 0 There is no positive and significant influence
of variable Perceived Quality towards Consumer
Loyalty
Ha: 1> 0 There is a positive and significant influence of
variable Perceived Quality towards Consumer
Loyalty
Hypothesis 4
Ho: 1 ≤ 0 There is no positive and significant influence
of variable Brand Loyalty towards Consumer Loyalty
Ha: 1> 0 There is a positive and significant influence of
variable Brand Loyalty towards Consumer Loyalty
Hypothesis 5
Ho: 1 ≤ 0 there is no positive and significant influence
of variable Brand Awareness towards Consumer
Loyalty
Ha: 1> 0 There is a positive and significant influence of
variable Brand Awareness towards Consumer
Loyalty
Scale Measurement
Scaling techniques that will be used for measuring are
interval scales. For both variables, rating scale will use
Likert scale with five (5) response categories ranging from
“strongly disagree” to “strongly agree”, which requires the
respondents to indicate a degree of agreement or
disagreement with each of a series of statements related to
the stimulus objects. “Strongly Disagree” will have score 1,
up to strongly agree whose score is 5.
Population and Sample
The population of this research is the consumer of Batik’s
Banten who domicile in Banten area. Samples have been
selected randomly. The sample size is 203.
Data Collecting and Analysis Techniques
Data for this research will be primarily collected through
questionnaires with self complementary questions. For
reliability test, this research will use internal consistency
reliability, which is used to assess the reliability of a
summated scale in which several items are summed to
form a total score. This measure of reliability focuses on
the internal consistency of the set of items forming the
scale. The coefficient alpha, or Cronbach’s alpha will be
used for this kind of reliability approach. If the result of
Cronbach’s Alpha is less than 0.6, the instrument is
considered to have poor reliability, greater than 0.6 is
acceptable, and greater than 0.8 is considered good.
Validity is the extent to which differences in observed scale
scores reflect true differences among objects on the
characteristic being measured. Perfect validity requires
that there should be no measurement error. This research
will use KMO and Bartlett’s Test to measure the validity. If
the result of KMO and Bartlett’s Test is more than 0.5, the
instrument is considered valid. For correlation, analysis
will use linear regression equation.
BrandAwareness
Uniqueness
PerceivedQuality
BrandLoyalty
BrandAssocia on
Ba kBanten’sCustomerLoyalty
BrandEquity
Page 7
2016 J. Admin. Bus. Stud. 195
ISSN: 2414-309X DOI:10.20474/jabs-2.4.5 TAF
Publishing
The correlation coefficient will be calculated to explain the
closeness of the relationship. The regression model will be
tested to see if it is statistically significant; similarly, the
regression and correlation coefficients will be tested to see
if they are significantly different from zero. Shortly, this
technique will be used for analyzing the type of
relationships that exit, to determine the closeness of the
relationship by correlation coefficient and to assess the
range over which the relationship holds in evaluating
whether the regression model is good at fitting the
observed data.
RESEARCH AND DISCUSSION
Respondent’s Profile
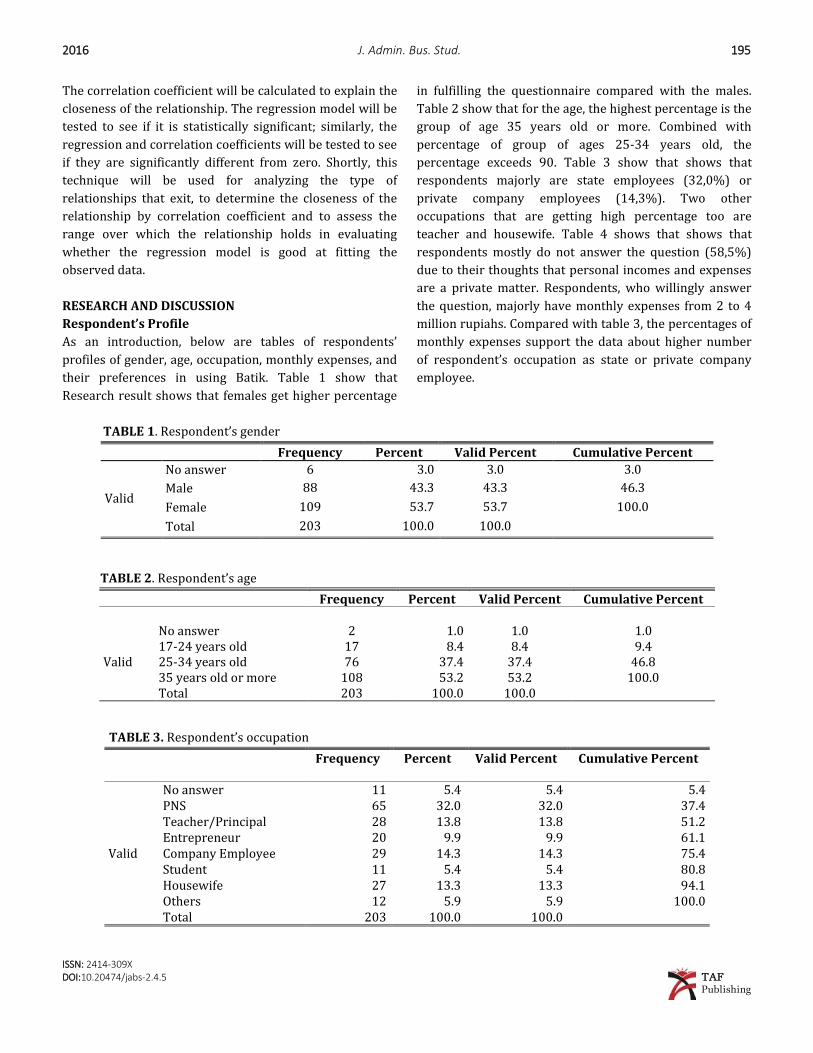
As an introduction, below are tables of respondents’
profiles of gender, age, occupation, monthly expenses, and
their preferences in using Batik. Table 1 show that
Research result shows that females get higher percentage
in fulfilling the questionnaire compared with the males.
Table 2 show that for the age, the highest percentage is the
group of age 35 years old or more. Combined with
percentage of group of ages 25-34 years old, the
percentage exceeds 90. Table 3 show that shows that
respondents majorly are state employees (32,0%) or
private company employees (14,3%). Two other
occupations that are getting high percentage too are
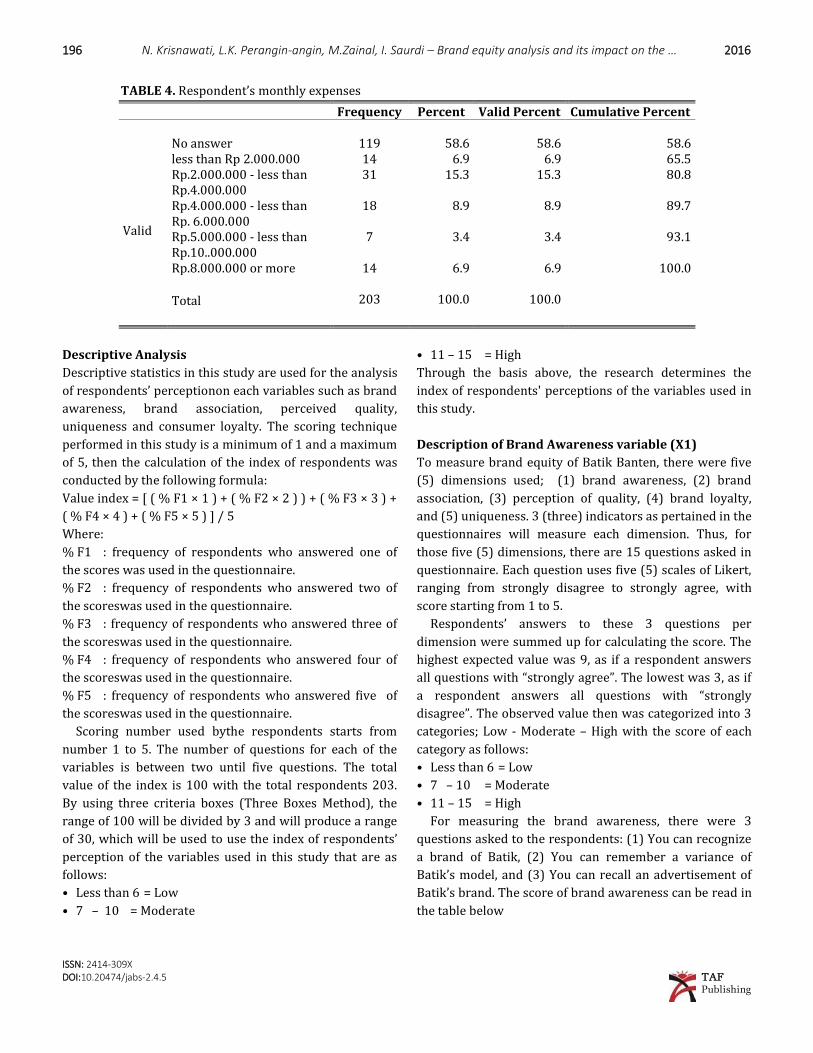
teacher and housewife. Table 4 shows that shows that
respondents mostly do not answer the question (58,5%)
due to their thoughts that personal incomes and expenses
are a private matter. Respondents, who willingly answer
the question, majorly have monthly expenses from 2 to 4
million rupiahs. Compared with table 3, the percentages of
monthly expenses support the data about higher number
of respondent’s occupation as state or private company
employee.
TABLE 1. Respondent’s gender
Frequency Percent Valid Percent Cumulative Percent
Valid
No answer 6 3.0 3.0 3.0
Male 88 43.3 43.3 46.3
Female 109 53.7 53.7 100.0
Total 203 100.0 100.0
TABLE 2. Respondent’s age
TABLE 3. Respondent’s occupation
Frequency Percent Valid Percent Cumulative Percent
Valid
No answer 11 5.4 5.4 5.4 PNS 65 32.0 32.0 37.4 Teacher/Principal 28 13.8 13.8 51.2 Entrepreneur 20 9.9 9.9 61.1 Company Employee 29 14.3 14.3 75.4 Student 11 5.4 5.4 80.8 Housewife 27 13.3 13.3 94.1 Others 12 5.9 5.9 100.0 Total 203 100.0 100.0
Frequency Percent Valid Percent Cumulative Percent
Valid
No answer 2 1.0 1.0 1.0 17-24 years old 17 8.4 8.4 9.4 25-34 years old 76 37.4 37.4 46.8 35 years old or more 108 53.2 53.2 100.0 Total 203 100.0 100.0
Page 8
196 N. Krisnawati, L.K. Perangin-angin, M.Zainal, I. Saurdi – Brand equity analysis and its impact on the … 2016
ISSN: 2414-309X DOI:10.20474/jabs-2.4.5 TAF
Publishing
TABLE 4. Respondent’s monthly expenses
Frequency Percent Valid Percent Cumulative Percent
Valid
No answer 119 58.6 58.6 58.6 less than Rp 2.000.000 14 6.9 6.9 65.5 Rp.2.000.000 - less than Rp.4.000.000
31 15.3 15.3 80.8
Rp.4.000.000 - less than Rp. 6.000.000
18 8.9 8.9 89.7
Rp.5.000.000 - less than Rp.10..000.000
7 3.4 3.4 93.1
Rp.8.000.000 or more 14 6.9 6.9 100.0
Total
203
100.0
100.0
Descriptive Analysis
Descriptive statistics in this study are used for the analysis
of respondents’ perceptionon each variables such as brand
awareness, brand association, perceived quality,
uniqueness and consumer loyalty. The scoring technique
performed in this study is a minimum of 1 and a maximum
of 5, then the calculation of the index of respondents was
conducted by the following formula:
Value index = [ ( % F1 × 1 ) + ( % F2 × 2 ) ) + ( % F3 × 3 ) +
( % F4 × 4 ) + ( % F5 × 5 ) ] / 5
Where:
% F1 : frequency of respondents who answered one of
the scores was used in the questionnaire.
% F2 : frequency of respondents who answered two of
the scoreswas used in the questionnaire.
% F3 : frequency of respondents who answered three of
the scoreswas used in the questionnaire.
% F4 : frequency of respondents who answered four of
the scoreswas used in the questionnaire.
% F5 : frequency of respondents who answered five of
the scoreswas used in the questionnaire.
Scoring number used bythe respondents starts from
number 1 to 5. The number of questions for each of the
variables is between two until five questions. The total
value of the index is 100 with the total respondents 203.
By using three criteria boxes (Three Boxes Method), the
range of 100 will be divided by 3 and will produce a range
of 30, which will be used to use the index of respondents’
perception of the variables used in this study that are as
follows:
• Less than 6 = Low
• 7 – 10 = Moderate
• 11 – 15 = High
Through the basis above, the research determines the
index of respondents' perceptions of the variables used in
this study.
Description of Brand Awareness variable (X1)
To measure brand equity of Batik Banten, there were five
(5) dimensions used; (1) brand awareness, (2) brand
association, (3) perception of quality, (4) brand loyalty,
and (5) uniqueness. 3 (three) indicators as pertained in the
questionnaires will measure each dimension. Thus, for
those five (5) dimensions, there are 15 questions asked in
questionnaire. Each question uses five (5) scales of Likert,
ranging from strongly disagree to strongly agree, with
score starting from 1 to 5.
Respondents’ answers to these 3 questions per
dimension were summed up for calculating the score. The
highest expected value was 9, as if a respondent answers
all questions with “strongly agree”. The lowest was 3, as if
a respondent answers all questions with “strongly
disagree”. The observed value then was categorized into 3
categories; Low - Moderate – High with the score of each
category as follows:
• Less than 6 = Low
• 7 – 10 = Moderate
• 11 – 15 = High
For measuring the brand awareness, there were 3
questions asked to the respondents: (1) You can recognize
a brand of Batik, (2) You can remember a variance of
Batik’s model, and (3) You can recall an advertisement of
Batik’s brand. The score of brand awareness can be read in
the table below
Page 9
2016 J. Admin. Bus. Stud. 197
ISSN: 2414-309X DOI:10.20474/jabs-2.4.5 TAF
Publishing
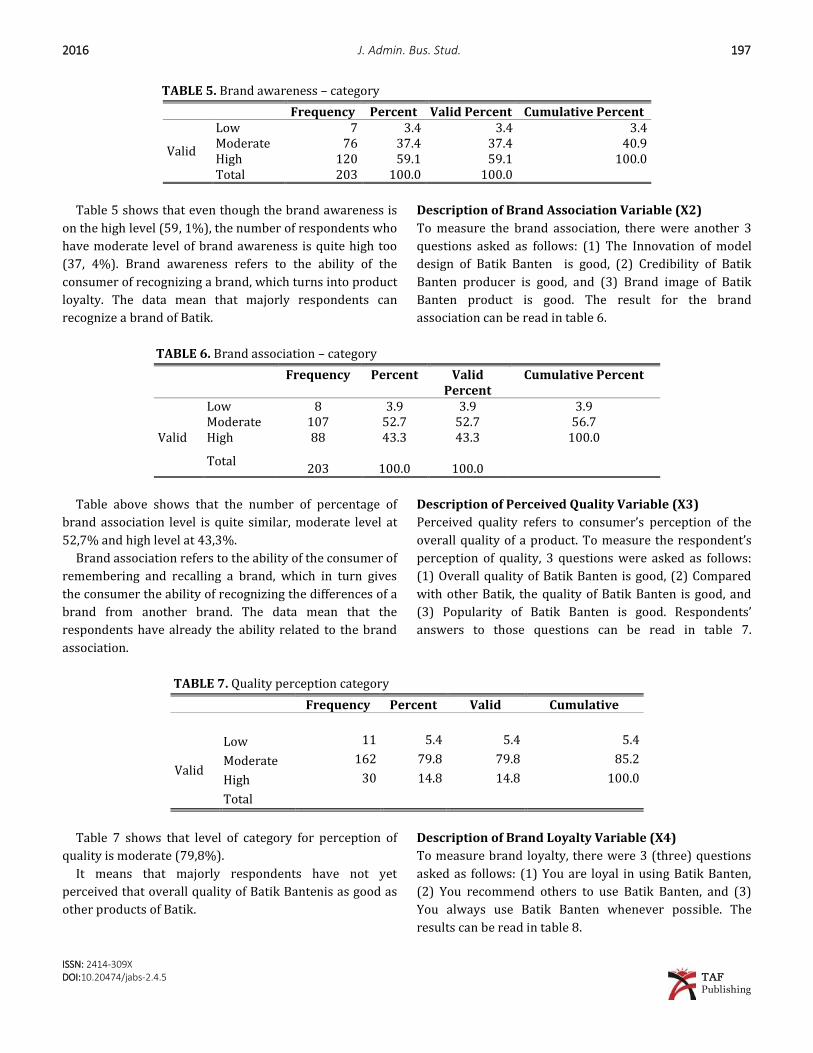
TABLE 5. Brand awareness – category
Frequency Percent Valid Percent Cumulative Percent
Valid
Low 7 3.4 3.4 3.4 Moderate 76 37.4 37.4 40.9 High 120 59.1 59.1 100.0 Total 203 100.0 100.0
Table 5 shows that even though the brand awareness is
on the high level (59, 1%), the number of respondents who
have moderate level of brand awareness is quite high too
(37, 4%). Brand awareness refers to the ability of the
consumer of recognizing a brand, which turns into product
loyalty. The data mean that majorly respondents can
recognize a brand of Batik.
Description of Brand Association Variable (X2)
To measure the brand association, there were another 3
questions asked as follows: (1) The Innovation of model
design of Batik Banten is good, (2) Credibility of Batik
Banten producer is good, and (3) Brand image of Batik
Banten product is good. The result for the brand
association can be read in table 6.
TABLE 6. Brand association – category
Frequency Percent Valid Percent
Cumulative Percent
Valid
Low 8 3.9 3.9 3.9 Moderate 107 52.7 52.7 56.7 High 88 43.3 43.3 100.0
Total
203
100.0
100.0
Table above shows that the number of percentage of
brand association level is quite similar, moderate level at
52,7% and high level at 43,3%.
Brand association refers to the ability of the consumer of
remembering and recalling a brand, which in turn gives
the consumer the ability of recognizing the differences of a
brand from another brand. The data mean that the
respondents have already the ability related to the brand
association.
Description of Perceived Quality Variable (X3)
Perceived quality refers to consumer’s perception of the
overall quality of a product. To measure the respondent’s
perception of quality, 3 questions were asked as follows:
(1) Overall quality of Batik Banten is good, (2) Compared
with other Batik, the quality of Batik Banten is good, and
(3) Popularity of Batik Banten is good. Respondents’
answers to those questions can be read in table 7.
TABLE 7. Quality perception category
Frequency Percent Valid Percent
Cumulative Percent
Valid
Low 11 5.4 5.4 5.4
Moderate 162 79.8 79.8 85.2
High 30 14.8 14.8 100.0
Total 203
100.0
100.0
Table 7 shows that level of category for perception of
quality is moderate (79,8%).
It means that majorly respondents have not yet
perceived that overall quality of Batik Bantenis as good as
other products of Batik.
Description of Brand Loyalty Variable (X4)
To measure brand loyalty, there were 3 (three) questions
asked as follows: (1) You are loyal in using Batik Banten,
(2) You recommend others to use Batik Banten, and (3)
You always use Batik Banten whenever possible. The
results can be read in table 8.
Page 10
198 N. Krisnawati, L.K. Perangin-angin, M.Zainal, I. Saurdi – Brand equity analysis and its impact on the … 2016
ISSN: 2414-309X DOI:10.20474/jabs-2.4.5 TAF
Publishing
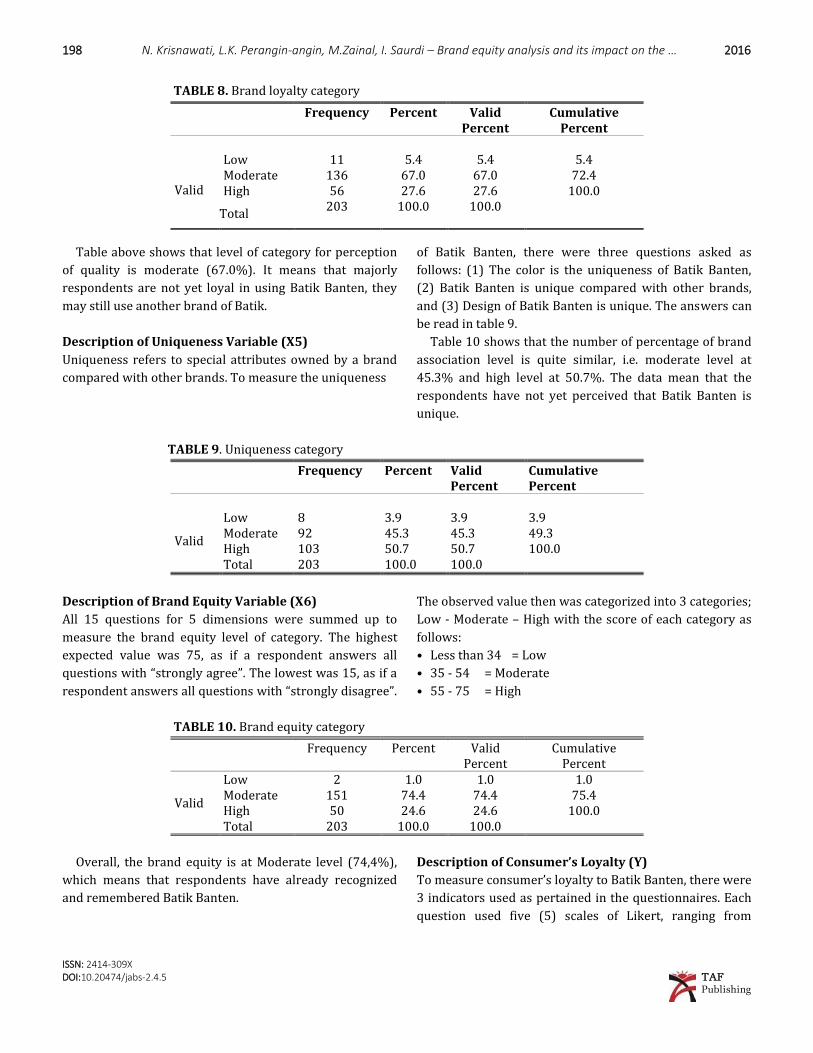
TABLE 8. Brand loyalty category
Table above shows that level of category for perception
of quality is moderate (67.0%). It means that majorly
respondents are not yet loyal in using Batik Banten, they
may still use another brand of Batik.
Description of Uniqueness Variable (X5)
Uniqueness refers to special attributes owned by a brand
compared with other brands. To measure the uniqueness
of Batik Banten, there were three questions asked as
follows: (1) The color is the uniqueness of Batik Banten,
(2) Batik Banten is unique compared with other brands,
and (3) Design of Batik Banten is unique. The answers can
be read in table 9.
Table 10 shows that the number of percentage of brand
association level is quite similar, i.e. moderate level at
45.3% and high level at 50.7%. The data mean that the
respondents have not yet perceived that Batik Banten is
unique.
TABLE 9. Uniqueness category
Frequency Percent Valid Percent
Cumulative Percent
Valid
Low 8 3.9 3.9 3.9 Moderate 92 45.3 45.3 49.3 High 103 50.7 50.7 100.0 Total 203 100.0 100.0
Description of Brand Equity Variable (X6)
All 15 questions for 5 dimensions were summed up to
measure the brand equity level of category. The highest
expected value was 75, as if a respondent answers all
questions with “strongly agree”. The lowest was 15, as if a
respondent answers all questions with “strongly disagree”.
The observed value then was categorized into 3 categories;
Low - Moderate – High with the score of each category as
follows:
• Less than 34 = Low
• 35 - 54 = Moderate
• 55 - 75 = High
TABLE 10. Brand equity category
Frequency Percent Valid Percent
Cumulative Percent
Valid
Low 2 1.0 1.0 1.0 Moderate 151 74.4 74.4 75.4 High 50 24.6 24.6 100.0 Total 203 100.0 100.0
Overall, the brand equity is at Moderate level (74,4%),
which means that respondents have already recognized
and remembered Batik Banten.
Description of Consumer’s Loyalty (Y)
To measure consumer’s loyalty to Batik Banten, there were
3 indicators used as pertained in the questionnaires. Each
question used five (5) scales of Likert, ranging from
Frequency Percent Valid Percent
Cumulative Percent
Valid
Low 11 5.4 5.4 5.4 Moderate 136 67.0 67.0 72.4 High 56 27.6 27.6 100.0
Total 203 100.0 100.0
Page 11
2016 J. Admin. Bus. Stud. 199
ISSN: 2414-309X DOI:10.20474/jabs-2.4.5 TAF
Publishing
strongly disagree to strongly agree, with score starting
from 1 to 5. Respondents’ answers to these 3 questions
were summed up for calculating the score. The highest
expected value was 9, as if a respondent answers all
questions with “strongly agree”. The lowest was 3, as if a
respondent answers all questions with “strongly disagree”.
The observed value then was categorized into 3 categories;
Low - Moderate – High with the score of each category as
follows:
• Less than 6 = Low
• 7 – 10 = Moderate
• 11 – 15 = High
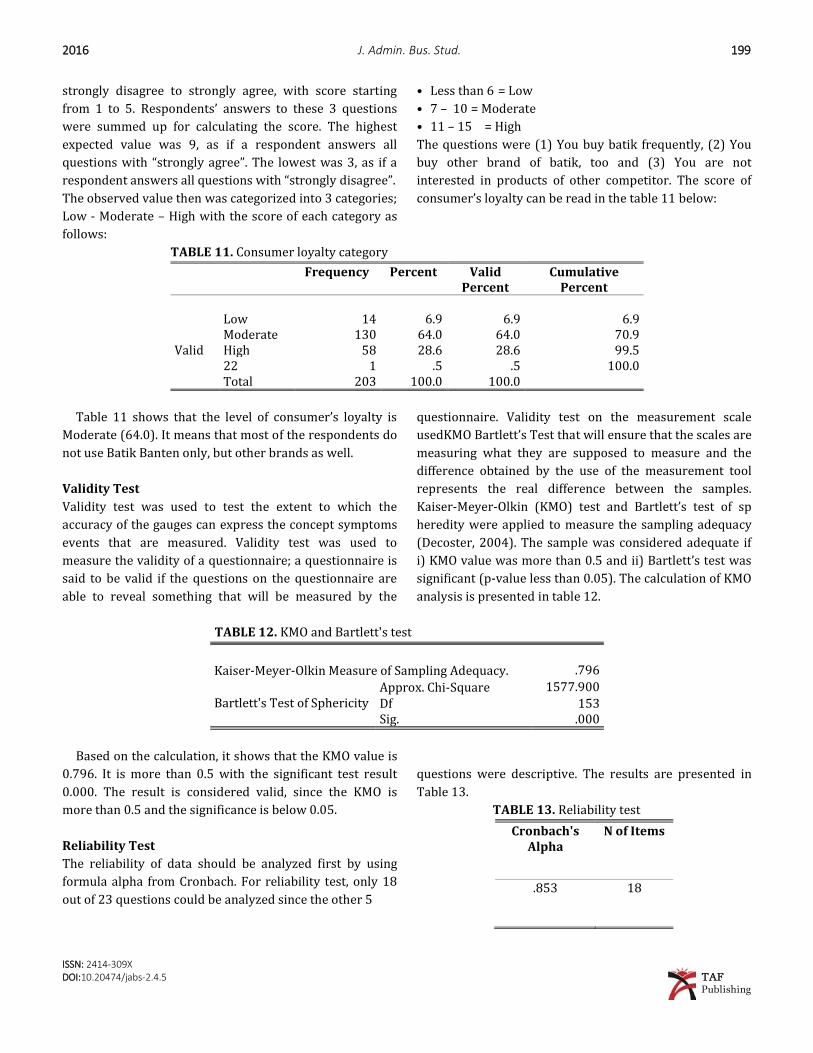
The questions were (1) You buy batik frequently, (2) You
buy other brand of batik, too and (3) You are not
interested in products of other competitor. The score of
consumer’s loyalty can be read in the table 11 below:
TABLE 11. Consumer loyalty category
Frequency Percent Valid Percent
Cumulative Percent
Valid
Low 14 6.9 6.9 6.9 Moderate 130 64.0 64.0 70.9 High 58 28.6 28.6 99.5 22 1 .5 .5 100.0 Total 203 100.0 100.0
Table 11 shows that the level of consumer’s loyalty is
Moderate (64.0). It means that most of the respondents do
not use Batik Banten only, but other brands as well.
Validity Test
Validity test was used to test the extent to which the
accuracy of the gauges can express the concept symptoms
events that are measured. Validity test was used to
measure the validity of a questionnaire; a questionnaire is
said to be valid if the questions on the questionnaire are
able to reveal something that will be measured by the
questionnaire. Validity test on the measurement scale
usedKMO Bartlett’s Test that will ensure that the scales are
measuring what they are supposed to measure and the
difference obtained by the use of the measurement tool
represents the real difference between the samples.
Kaiser-Meyer-Olkin (KMO) test and Bartlett’s test of sp
heredity were applied to measure the sampling adequacy
(Decoster, 2004). The sample was considered adequate if
i) KMO value was more than 0.5 and ii) Bartlett’s test was
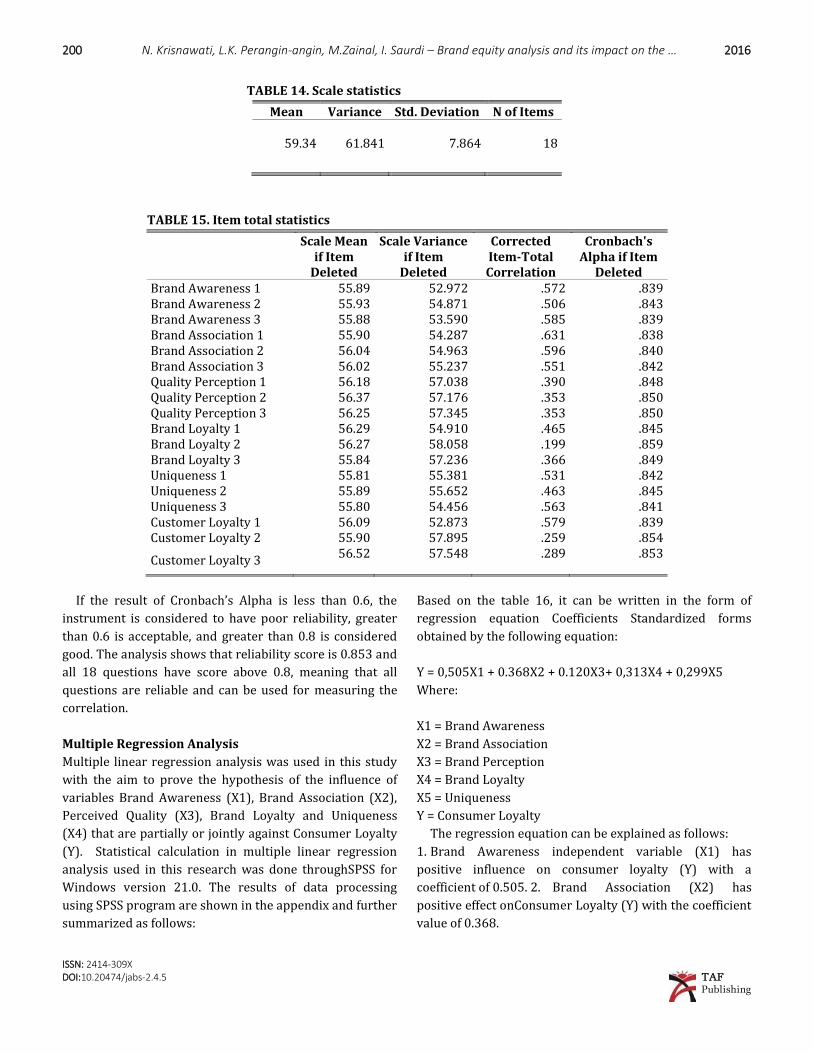
significant (p-value less than 0.05). The calculation of KMO
analysis is presented in table 12.
TABLE 12. KMO and Bartlett's test
Kaiser-Meyer-Olkin Measure of Sampling Adequacy. .796
Bartlett's Test of Sphericity Approx. Chi-Square 1577.900
Df 153 Sig. .000
Based on the calculation, it shows that the KMO value is
0.796. It is more than 0.5 with the significant test result
0.000. The result is considered valid, since the KMO is
more than 0.5 and the significance is below 0.05.
Reliability Test
The reliability of data should be analyzed first by using
formula alpha from Cronbach. For reliability test, only 18
out of 23 questions could be analyzed since the other 5
questions were descriptive. The results are presented in
Table 13.
TABLE 13. Reliability test
Cronbach's Alpha
N of Items
.853 18
Page 12
200 N. Krisnawati, L.K. Perangin-angin, M.Zainal, I. Saurdi – Brand equity analysis and its impact on the … 2016
ISSN: 2414-309X DOI:10.20474/jabs-2.4.5 TAF
Publishing
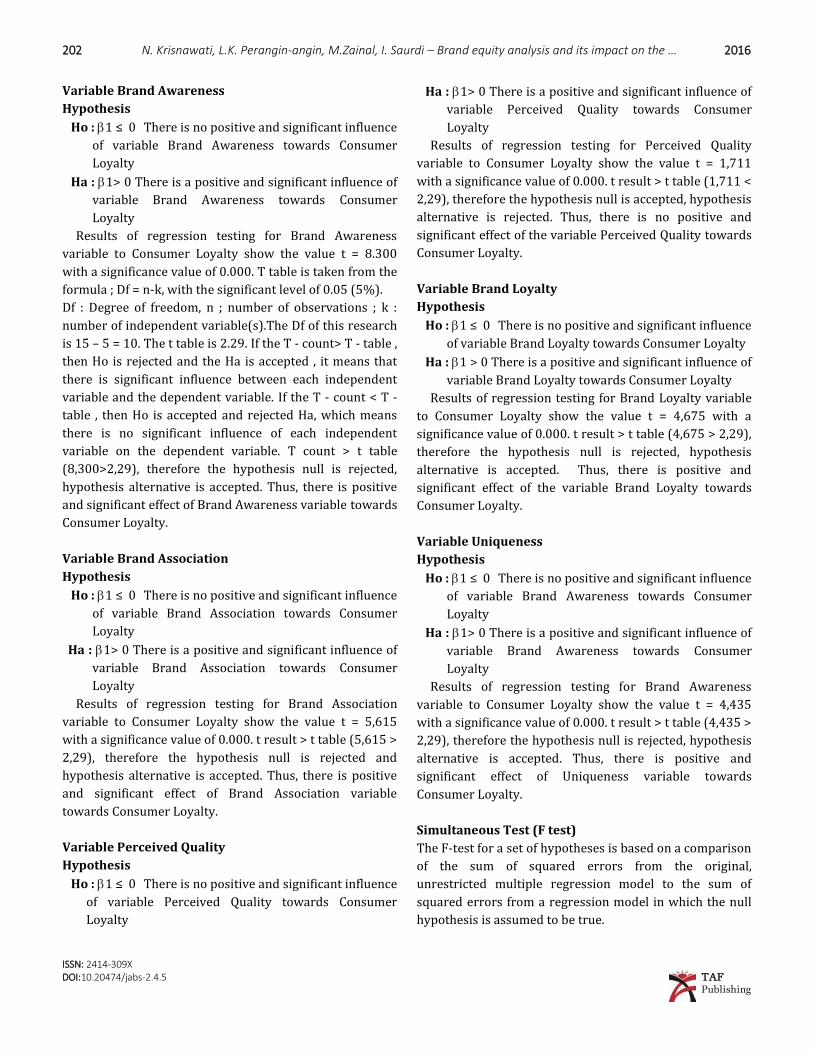
TABLE 14. Scale statistics
Mean Variance Std. Deviation N of Items
59.34
61.841
7.864
18
TABLE 15. Item total statistics
Scale Mean if Item
Deleted
Scale Variance if Item
Deleted
Corrected Item-Total Correlation
Cronbach's Alpha if Item
Deleted Brand Awareness 1 55.89 52.972 .572 .839 Brand Awareness 2 55.93 54.871 .506 .843 Brand Awareness 3 55.88 53.590 .585 .839 Brand Association 1 55.90 54.287 .631 .838 Brand Association 2 56.04 54.963 .596 .840 Brand Association 3 56.02 55.237 .551 .842 Quality Perception 1 56.18 57.038 .390 .848 Quality Perception 2 56.37 57.176 .353 .850 Quality Perception 3 56.25 57.345 .353 .850 Brand Loyalty 1 56.29 54.910 .465 .845 Brand Loyalty 2 56.27 58.058 .199 .859 Brand Loyalty 3 55.84 57.236 .366 .849 Uniqueness 1 55.81 55.381 .531 .842 Uniqueness 2 55.89 55.652 .463 .845 Uniqueness 3 55.80 54.456 .563 .841 Customer Loyalty 1 56.09 52.873 .579 .839 Customer Loyalty 2 55.90 57.895 .259 .854
Customer Loyalty 3 56.52 57.548 .289 .853
If the result of Cronbach’s Alpha is less than 0.6, the
instrument is considered to have poor reliability, greater
than 0.6 is acceptable, and greater than 0.8 is considered
good. The analysis shows that reliability score is 0.853 and
all 18 questions have score above 0.8, meaning that all
questions are reliable and can be used for measuring the
correlation.
Multiple Regression Analysis
Multiple linear regression analysis was used in this study
with the aim to prove the hypothesis of the influence of
variables Brand Awareness (X1), Brand Association (X2),
Perceived Quality (X3), Brand Loyalty and Uniqueness
(X4) that are partially or jointly against Consumer Loyalty
(Y). Statistical calculation in multiple linear regression
analysis used in this research was done throughSPSS for
Windows version 21.0. The results of data processing
using SPSS program are shown in the appendix and further
summarized as follows:
Based on the table 16, it can be written in the form of
regression equation Coefficients Standardized forms
obtained by the following equation:
Y = 0,505X1 + 0.368X2 + 0.120X3+ 0,313X4 + 0,299X5
Where:
X1 = Brand Awareness
X2 = Brand Association
X3 = Brand Perception
X4 = Brand Loyalty
X5 = Uniqueness
Y = Consumer Loyalty
The regression equation can be explained as follows:
1. Brand Awareness independent variable (X1) has
positive influence on consumer loyalty (Y) with a
coefficient of 0.505. 2. Brand Association (X2) has
positive effect onConsumer Loyalty (Y) with the coefficient
value of 0.368.
Page 13
2016 J. Admin. Bus. Stud. 201
ISSN: 2414-309X DOI:10.20474/jabs-2.4.5 TAF
Publishing
3. Quality Perception independent variable (X3) has
positive influence on consumer loyalty (Y) with a
coefficient of 0.120. 4. Brand Loyalty independent
variable (X4) has positive effect on
Consumer Loyalty (Y) with the coefficient value of 0.313.
5. Uniqueness independent variable (X5) has positive
influence on consumer loyalty (Y) with a coefficient of
0.299
TABLE 16. Multiple regression analysis
Coefficientsa Model Unstandardized
Coefficients Standardized Coefficients
t Sig.
B Std. Error Beta
(Constant) 5.080 .644 7.888 .000
Brand Awareness (X1) Brand Association (X2) Perceived Quality (X3) Brand Loyalty (X4) Uniqueness (X5)
.550
.362
.114
.315
.333
.066
.064
.066
.067
.075
.505
.368
.120
.313
.299
8.300 5.615 1.711 4.675 4.435
.000
.000
.000
.000
.000
Determination Coefficient Analysis
Test the coefficient of determination (R2) that is used to
measure how far the ability of the model is to explain
variations in the dependent variable. (R2) value is closer to
1, meaning the independent variables provide almost all
the information needed to predict the independent
variable. The coefficient of determination used is the value
of Adjusted R squares because it is more reliable in
evaluating the regression model. Adjusted R square can go
up or down if the independent variable is added into the
model.
Hypothesis Test Analysis
Partial Test (t test)
To show how far the influence of the explanatory variables
is non- individually or in explaining the variation of the
dependent variable. The following table will explain the
testing of each variable partially:
TABLE 17. Model summary
Model R R Square Adjusted
R Square Std.
Error of the
Estimate
Change Statistics
R Square Change
F Change df1 df2 Sig. F Chang
e
1 .463a .215 .211 6.011 .215 54.928 1 201 .000
i. Predictors: (Constant), X1,X2,X3,X4,X5. ii. Dependent Variable : Y
TABLE 18. Partial t -test
Coefficients Model Unstandardized
Coefficients Standardized Coefficients
T Sig.
B Std. Error Beta
(Constant) 5.080 .644 7.888 .000
Brand Awareness (X1) Brand Association (X2) Perceived Quality (X3) Brand Loyalty (X4) Uniqueness (X5)
.550
.362
.114
.315
.333
.066
.064
.066
.067
.075
.505
.368
.120
.313
.299
8.300 5.615 1.711 4.675 4.435
.000
.000
.000
.000
.000
Page 14
202 N. Krisnawati, L.K. Perangin-angin, M.Zainal, I. Saurdi – Brand equity analysis and its impact on the … 2016
ISSN: 2414-309X DOI:10.20474/jabs-2.4.5 TAF
Publishing
Variable Brand Awareness
Hypothesis
Ho : 1 ≤ 0 There is no positive and significant influence
of variable Brand Awareness towards Consumer
Loyalty
Ha : 1> 0 There is a positive and significant influence of
variable Brand Awareness towards Consumer
Loyalty
Results of regression testing for Brand Awareness
variable to Consumer Loyalty show the value t = 8.300
with a significance value of 0.000. T table is taken from the
formula ; Df = n-k, with the significant level of 0.05 (5%).
Df : Degree of freedom, n ; number of observations ; k :
number of independent variable(s).The Df of this research
is 15 – 5 = 10. The t table is 2.29. If the T - count> T - table ,
then Ho is rejected and the Ha is accepted , it means that
there is significant influence between each independent
variable and the dependent variable. If the T - count < T -
table , then Ho is accepted and rejected Ha, which means
there is no significant influence of each independent
variable on the dependent variable. T count > t table
(8,300>2,29), therefore the hypothesis null is rejected,
hypothesis alternative is accepted. Thus, there is positive
and significant effect of Brand Awareness variable towards
Consumer Loyalty.
Variable Brand Association
Hypothesis
Ho : 1 ≤ 0 There is no positive and significant influence
of variable Brand Association towards Consumer
Loyalty
Ha : 1> 0 There is a positive and significant influence of
variable Brand Association towards Consumer
Loyalty
Results of regression testing for Brand Association
variable to Consumer Loyalty show the value t = 5,615
with a significance value of 0.000. t result > t table (5,615 >
2,29), therefore the hypothesis null is rejected and
hypothesis alternative is accepted. Thus, there is positive
and significant effect of Brand Association variable
towards Consumer Loyalty.
Variable Perceived Quality
Hypothesis
Ho : 1 ≤ 0 There is no positive and significant influence
of variable Perceived Quality towards Consumer
Loyalty
Ha : 1> 0 There is a positive and significant influence of
variable Perceived Quality towards Consumer
Loyalty
Results of regression testing for Perceived Quality
variable to Consumer Loyalty show the value t = 1,711
with a significance value of 0.000. t result > t table (1,711 <
2,29), therefore the hypothesis null is accepted, hypothesis
alternative is rejected. Thus, there is no positive and
significant effect of the variable Perceived Quality towards
Consumer Loyalty.
Variable Brand Loyalty
Hypothesis
Ho : 1 ≤ 0 There is no positive and significant influence
of variable Brand Loyalty towards Consumer Loyalty
Ha : 1 > 0 There is a positive and significant influence of
variable Brand Loyalty towards Consumer Loyalty
Results of regression testing for Brand Loyalty variable
to Consumer Loyalty show the value t = 4,675 with a
significance value of 0.000. t result > t table (4,675 > 2,29),
therefore the hypothesis null is rejected, hypothesis
alternative is accepted. Thus, there is positive and
significant effect of the variable Brand Loyalty towards
Consumer Loyalty.
Variable Uniqueness
Hypothesis
Ho : 1 ≤ 0 There is no positive and significant influence
of variable Brand Awareness towards Consumer
Loyalty
Ha : 1> 0 There is a positive and significant influence of
variable Brand Awareness towards Consumer
Loyalty
Results of regression testing for Brand Awareness
variable to Consumer Loyalty show the value t = 4,435
with a significance value of 0.000. t result > t table (4,435 >
2,29), therefore the hypothesis null is rejected, hypothesis
alternative is accepted. Thus, there is positive and
significant effect of Uniqueness variable towards
Consumer Loyalty.
Simultaneous Test (F test)
The F-test for a set of hypotheses is based on a comparison
of the sum of squared errors from the original,
unrestricted multiple regression model to the sum of
squared errors from a regression model in which the null
hypothesis is assumed to be true.
Page 15
2016 J. Admin. Bus. Stud. 203
ISSN: 2414-309X DOI:10.20474/jabs-2.4.5 TAF
Publishing
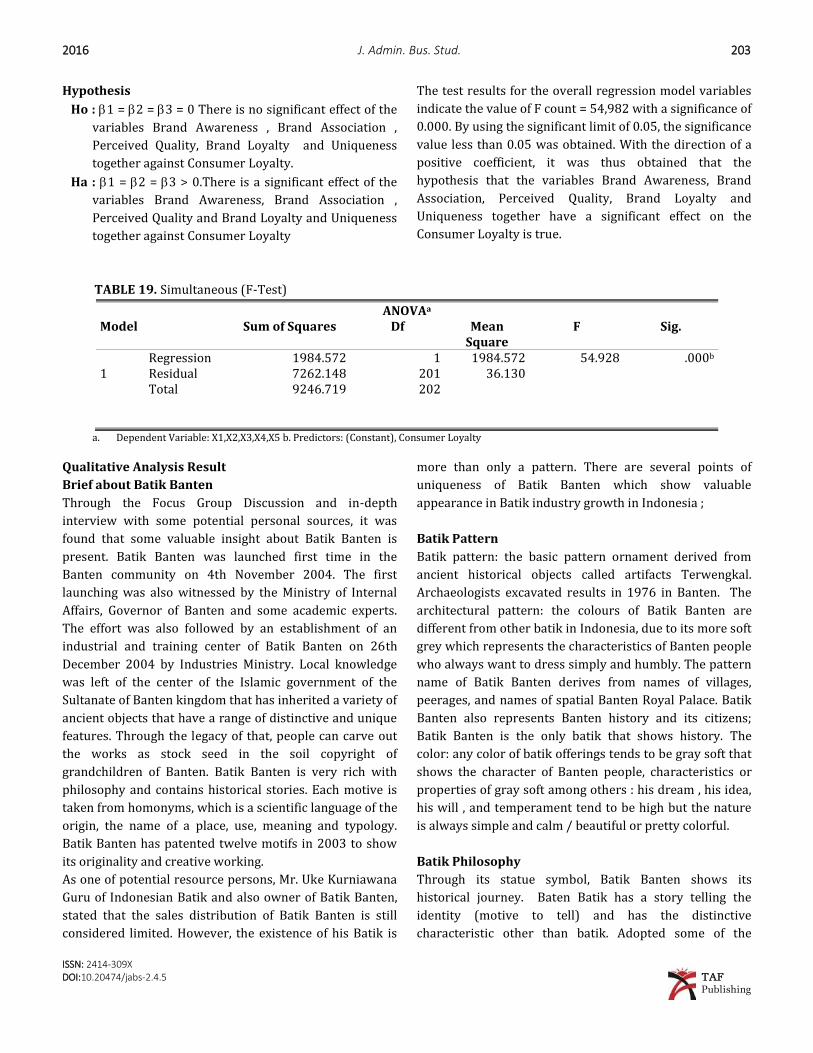
Hypothesis
Ho : 1 = 2 = 3 = 0 There is no significant effect of the
variables Brand Awareness , Brand Association ,
Perceived Quality, Brand Loyalty and Uniqueness
together against Consumer Loyalty.
Ha : 1 = 2 = 3 > 0.There is a significant effect of the
variables Brand Awareness, Brand Association ,
Perceived Quality and Brand Loyalty and Uniqueness
together against Consumer Loyalty
TABLE 19. Simultaneous (F-Test)
The test results for the overall regression model variables
indicate the value of F count = 54,982 with a significance of
0.000. By using the significant limit of 0.05, the significance
value less than 0.05 was obtained. With the direction of a
positive coefficient, it was thus obtained that the
hypothesis that the variables Brand Awareness, Brand
Association, Perceived Quality, Brand Loyalty and
Uniqueness together have a significant effect on the
Consumer Loyalty is true.
ANOVAa Model Sum of Squares Df Mean
Square F Sig.
1 Regression 1984.572 1 1984.572 54.928 .000b Residual 7262.148 201 36.130 Total 9246.719 202
a. Dependent Variable: X1,X2,X3,X4,X5 b. Predictors: (Constant), Consumer Loyalty
Qualitative Analysis Result
Brief about Batik Banten
Through the Focus Group Discussion and in-depth
interview with some potential personal sources, it was
found that some valuable insight about Batik Banten is
present. Batik Banten was launched first time in the
Banten community on 4th November 2004. The first
launching was also witnessed by the Ministry of Internal
Affairs, Governor of Banten and some academic experts.
The effort was also followed by an establishment of an
industrial and training center of Batik Banten on 26th
December 2004 by Industries Ministry. Local knowledge
was left of the center of the Islamic government of the
Sultanate of Banten kingdom that has inherited a variety of
ancient objects that have a range of distinctive and unique
features. Through the legacy of that, people can carve out
the works as stock seed in the soil copyright of
grandchildren of Banten. Batik Banten is very rich with
philosophy and contains historical stories. Each motive is
taken from homonyms, which is a scientific language of the
origin, the name of a place, use, meaning and typology.
Batik Banten has patented twelve motifs in 2003 to show
its originality and creative working.
As one of potential resource persons, Mr. Uke Kurniawana
Guru of Indonesian Batik and also owner of Batik Banten,
stated that the sales distribution of Batik Banten is still
considered limited. However, the existence of his Batik is
more than only a pattern. There are several points of
uniqueness of Batik Banten which show valuable
appearance in Batik industry growth in Indonesia ;
Batik Pattern
Batik pattern: the basic pattern ornament derived from
ancient historical objects called artifacts Terwengkal.
Archaeologists excavated results in 1976 in Banten. The
architectural pattern: the colours of Batik Banten are
different from other batik in Indonesia, due to its more soft
grey which represents the characteristics of Banten people
who always want to dress simply and humbly. The pattern
name of Batik Banten derives from names of villages,
peerages, and names of spatial Banten Royal Palace. Batik
Banten also represents Banten history and its citizens;
Batik Banten is the only batik that shows history. The
color: any color of batik offerings tends to be gray soft that
shows the character of Banten people, characteristics or
properties of gray soft among others : his dream , his idea,
his will , and temperament tend to be high but the nature
is always simple and calm / beautiful or pretty colorful.
Batik Philosophy
Through its statue symbol, Batik Banten shows its
historical journey. Baten Batik has a story telling the
identity (motive to tell) and has the distinctive
characteristic other than batik. Adopted some of the
Page 16
204 N. Krisnawati, L.K. Perangin-angin, M.Zainal, I. Saurdi – Brand equity analysis and its impact on the … 2016
ISSN: 2414-309X DOI:10.20474/jabs-2.4.5 TAF
Publishing
motives of historical objects (artifacts). In each motif is
gray that is said to be the mirror of Banten. All content
contains batik philosophy. The name comes from the motif
toponym of ancient villages, the name peerage / sultan and
nomenclature space in “Banten Sultanate". Batik Banten
has the distinctive characteristics and unique properties
because in addition to any motive to tell the history, they
are also derived from the heritage objects such as pottery
and the names of the kingdom of Banten as Aryam and alik
a penem bahan, Sakingking, and others.
Characteristics and Expression of Batik Banten
The color of Batik Banten is affected by water and soil;
which is in the process of reducing and dyeing bright
colors into pastels as a result of the content in it. These
colors, as is said, fit very well to describe the character of
the Banten who have the spirit and high ideals, are
expressive, but remain humble. Each motif is then given
special names, taken from the name of the place, the room,
and the building of the site Banten Lama, as well as the
title name in the Sultanate of Banten. And, until now, there
are more than 50 ornaments available in the form of batik
cloth, even 12 of them have been patented since 2003.
Motif stook the name of the place, among other things, like
Pamaranggen (residence keris), Pancaniti (ward where
King watched soldiers practicing), Pasepen (where King
meditates), Pajantren (abode of the weavers), Pasulaman
(residence of craftsmen embroidery), Datulaya (prince's
residence), Srimanganti (where King comes face to face
with the people), and Surosowan (the capital of the
Sultanate of Banten).
While the motifs of the name of titles, among others, are
Sabakingking (the title of Sultan Maulana Hasanuddin),
Kawangsan (associated with Prince Wangsa), Kapurban
(associated with the title of Prince Purba), as well as
Mandalikan (associated with Prince Mandalika).However,
there is the main characteristic that is the Banten Batik
motif Datulaya, named after the prince's residence. "Datu”
means prince, “laya” place to stay. Motif Datulaya has
basic rhombus-shaped flowers and circles in figura leaf
tendrils. The colors used are the basic motif of blue, with
variations on the motif leaf tendrils of figurathat aregray
yellow on fabric base.
SWOT Analysis on Batik Banten
The SWOT analysis for Batik Bantenwas conducted as the
data were gathered through Focus Group Discussion (FGD)
and in-depth interview with Batik owner and government
representative. Focus Group Discussion was conducted on
23 April 2015, while the in-depth interviews happened on
variable times which were on 11 May 2015, 03 June 2015
and also on 14 January 2016. SWOT analysis consists of
internal and external factors of a company. Internally,
SWOT analysis covers the strengths and the weaknesses of
the business, while externally SWOT analysis covers the
opportunities and the threats of the business. There are
several points on strengths, weaknesses, opportunities,
and threats on Batik Banten:
Strengths
Batik Banten has a strong philosophy and it has been
patented its patterns. On each type of Batik Banten, it has
its own identity, such as gold color on hand-painted Batik,
silver color on stamped Batik, and white color on
combination of hand-painted and stamped Batik. Batik
Banten is the first Batik which holds patent from UNESCO,
and currently has seventy five patterns; thirty of them
have been patented in Indonesia.
Weaknesses
The knowledge and awareness of Batik Banten among the
community of Banten region are still considered low. This
might be the result of Batik Banten marketing lack. Greater
marketing effort introduces Batik Banten more broadly. In
the process of Batik Banten, there is a problem of waste
dump, but it has small effect.
Opportunities
Some opportunities are potential to grow such as the
availability of educational institutions, One Village One
Product (OVOP) movement, and Batik Banten worn as
uniform. Batik Banten could be socialized through general
lecture or workshop to the students. OVOP movement
could support Batik Banten and its identity. The
mandatory uniform in both governmental and public
institutions could also broaden the awareness and
knowledge of Batik Banten.
Threats
The main threats of Batik Banten are piracy and its
competitors, especially competitors who sell imported
Batik. Though intellectual property is available and open, it
has not been maximized by SMEs’ owners.
Page 17
2016 J. Admin. Bus. Stud. 205
ISSN: 2414-309X DOI:10.20474/jabs-2.4.5 TAF
Publishing
Most of piracy in Indonesia is unrecognized by the government. Batik from other region or country is also a
significant threat to Batik Banten. Most of the imported
Batik is sold as commodity, where the selling price is lower
than Batik Banten.
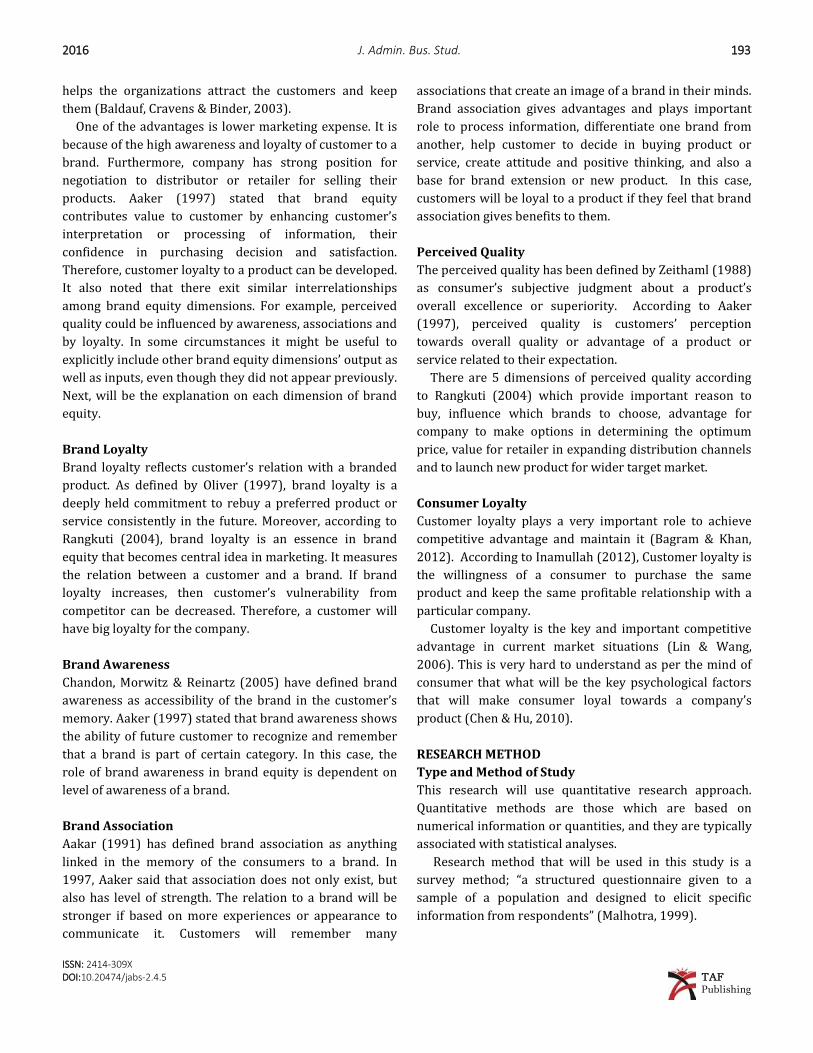
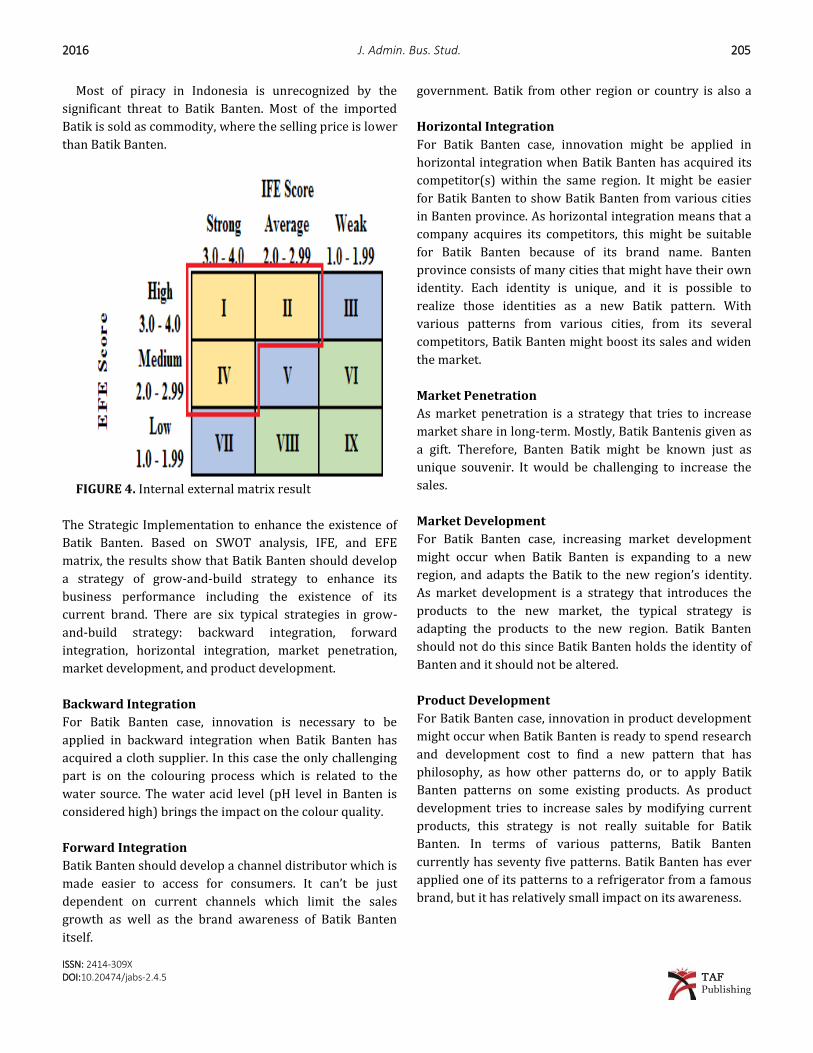
FIGURE 4. Internal external matrix result
The Strategic Implementation to enhance the existence of
Batik Banten. Based on SWOT analysis, IFE, and EFE
matrix, the results show that Batik Banten should develop
a strategy of grow-and-build strategy to enhance its
business performance including the existence of its
current brand. There are six typical strategies in grow-
and-build strategy: backward integration, forward
integration, horizontal integration, market penetration,
market development, and product development.
Backward Integration
For Batik Banten case, innovation is necessary to be
applied in backward integration when Batik Banten has
acquired a cloth supplier. In this case the only challenging
part is on the colouring process which is related to the
water source. The water acid level (pH level in Banten is
considered high) brings the impact on the colour quality.
Forward Integration
Batik Banten should develop a channel distributor which is
made easier to access for consumers. It can’t be just
dependent on current channels which limit the sales
growth as well as the brand awareness of Batik Banten
itself.
Horizontal Integration
For Batik Banten case, innovation might be applied in
horizontal integration when Batik Banten has acquired its
competitor(s) within the same region. It might be easier
for Batik Banten to show Batik Banten from various cities
in Banten province. As horizontal integration means that a
company acquires its competitors, this might be suitable
for Batik Banten because of its brand name. Banten
province consists of many cities that might have their own
identity. Each identity is unique, and it is possible to
realize those identities as a new Batik pattern. With
various patterns from various cities, from its several
competitors, Batik Banten might boost its sales and widen
the market.
Market Penetration
As market penetration is a strategy that tries to increase
market share in long-term. Mostly, Batik Bantenis given as
a gift. Therefore, Banten Batik might be known just as
unique souvenir. It would be challenging to increase the
sales.
Market Development
For Batik Banten case, increasing market development
might occur when Batik Banten is expanding to a new
region, and adapts the Batik to the new region’s identity.
As market development is a strategy that introduces the
products to the new market, the typical strategy is
adapting the products to the new region. Batik Banten
should not do this since Batik Banten holds the identity of
Banten and it should not be altered.
Product Development
For Batik Banten case, innovation in product development
might occur when Batik Banten is ready to spend research
and development cost to find a new pattern that has
philosophy, as how other patterns do, or to apply Batik
Banten patterns on some existing products. As product
development tries to increase sales by modifying current
products, this strategy is not really suitable for Batik
Banten. In terms of various patterns, Batik Banten
currently has seventy five patterns. Batik Banten has ever
applied one of its patterns to a refrigerator from a famous
brand, but it has relatively small impact on its awareness.
Page 18
206 C. Hor – Analysis of the impact of the determinant factors on … 2016
ISSN: 2414-309X DOI:10.20474/jabs-2.4.5 TAF
Publishing
CONCLUSION
Based on the research result it is concluded that from the
partial test, it is found that;
1. There is positive and significant effect of Brand
Awareness variable towards Consumer Loyalty.
2. There is positive and significant effect of Brand
Association variable towards Consumer Loyalty.
3. There is no positive and significant effect of the variable
Perceived Quality towards Consumer Loyalty.
4. There is positive and significant effect of the variable
Brand Loyalty towards Consumer Loyalty.
5. There is positive and significant effect of Uniqueness
variable towards Consumer Loyalty.
From the simultaneous test, it is found that the variables of
Brand Awareness, Brand Association, Perceived Quality,
Brand Loyalty and Uniqueness together have a significant
effect on the Consumer Loyalty. From qualitative analysis
it is shown that Batik Banten has two strong
characteristics; its pattern and philosophy. The final result
from SWOT analysis stated that Batik Banten is internally
strong and has support externally. Batik Banten is in area
IV which means the most suitable strategy in order to
boost the performance is grow and build strategy. The
available strategies for area IV are backward integration,
forward integration, horizontal integration, market
penetration, market development, and product
development.
REFERENCES
Aaker David A. 1997. Building strong brands. New York, NY: The Free Press.
Bagram, M.M.M., & Khan, S. 2012. Attaining customer loyalty! The role of consumer attitude and consumer
behavior. International Review of Management & Business Research, 1(1): 1-8.
Baldauf, A., Cravens, K.S., & Binder, G. 2003. Performance consequences of brand equity management: Evidence from
organizations in the value chain. Journal of Product & Brand Management, 12(4): 220-236. DOI:
10.1108/10610420310485032
Caves, R.E. 2000. Creative industries: Contracts between art and commerce. Cambridge, MA: Harvard University Press.
Chandon, P., Morwitz, V.G., & Reinartz, W.J. 2005. Do intentions really predict behavior? Self-generated validity effects in
survey research. Journal of Marketing, 69(2): 1-14. DOI: 10.1509/jmkg.69.2.1.60755
Chen, P.T., & Hu, H.H. 2010. The effect of relational benefits on perceived value in relation to customer loyalty: An
empirical study in the Australian coffee outlets industry. International Journal of Hospitality Management, 29(3):
405-412. DOI: 10.1016/j.ijhm.2009.09.006
Decoster, J. 2004. Data analysis in SPSS. URL: http://goo.gl/tiVzbr.Last accessed on 14 October 2008.
Florida, R. 2003. The rise of the creative class: And how it is transforming work, leisure, community and everyday
life. Melbourne, AU: Pluto Press.
Frimpong, S.K. 2011. A comparison of effect between domestic versus foreign brands on consumer purchasing
decision in Ghana. Paper presented at the 8th International Conference on Innovation & Management, Kobe, JP.
Lash, S., & Urry, J. 1994. Economies of sign and space. London, UK: Sage Publication.
Landry, C., & Bianchini, F. 1995. The creative city. London, UK: Demos.
Hesmondhalgh, D. 2002. The cultural industries. London, UK: Sage Publication.
Hitchcock, M. 1991. Indonesian textiles. London, UK: British Museum Press.
Howkins, J. 2001. The creative economy: How people make money from ideas. London, UK: Penguin.
Inamullah, K. 2012. Impact of customers satisfaction and customers retention on customers loyalty. International
Journal of Scientific & Technology Research, 1(2): 106-110.
Kartono, B., & Rao, V.R. 2005. Linking customer-based brand equity to market performace : An integrated approach
to brand equity management. Working paper no. 1-37, Cornell University, Ithaca, NY.
Keller, K.L. 1993. Conceptualizing, measuring, and managing customer-based brand equity. The Journal of Marketing,
57(1): 1-22. DOI: 10.2307/1252054
Krake, F.B. 2005. Successful brand management in SMEs: A new theory and practical hints. Journal of Product & Brand
Management, 14(4): 228-238. DOI: 10.1108/10610420510609230
Kotler, M. 2009. Principal of marketing. Warsaw, PL: Prentice Hall.
Lin, H.H., & Wang, Y.S. 2006. An examination of the determinants of customer loyalty in mobile commerce
Page 19
2016 J. Admin. Bus. Stud. 207
ISSN: 2414-309X DOI:10.20474/jabs-2.4.5 TAF
Publishing
contexts. Information & Management, 43(3): 271-282. DOI: 10.1016/j.im.2005.08.001
Malhotra, N.K. 1999. Marketing research: An applied orientation. New Jersey, NJ: Prentice Hall International Inc.
Oliver, R.L. 1997. Loyalty and profit: Long-term effects of satisfaction: A behavioral perspective on the consumer.
New York, NY: McGraw-Hill Companies
Rangkuti, F. 2004. The power of brand. Jakarta, ID: Gramedia Pustaka Utama.
Samiee, S. 1994. Customer evaluation of products in a global market. Journal of International Business Studies, 25(3):
579-604.DOI: 10.1057/palgrave.jibs.8490213
Tunjungsari, H.K. 2011. Retail therapy : Do foreign brands give more satisfaction than local brands? Unpublished
doctoral dissertation, Tarumanagara University, Jakarta, ID.
Zeithaml, V.A. 1988. Consumer perceptions of price, quality and value: A means-end model and synthesis of evidence.
Journal of Marketing, 52 (3): 2-22. DOI: 10.2307/1251446
— This article does not have any appendix. —